Abstract
With the continuous development of information technology, a spontaneous interdependent network has formed within the air traffic control network. Due to the internal interdependence, any small, failed node may trigger a cascade failure of the entire system. The purpose of this study is to investigate the resilience of air traffic control networks. Based on air traffic management regulations, a new cascading failure model for air traffic control networks is proposed, which is based on the theory of interdependent networks. The model establishes a dual-layer dependency relationship between the control coordination network and the air route facility network, including control dependency and service dependency. Through experiments, targeted measures are proposed to improve the safety and reliability of air traffic control. This model introduces parameters such as control cost and node control capability, and reflects the resilience of the air traffic control network, based on the final number of failed nodes after the steady-state of the cascade failure, the network’s cascade failure rate, and the system’s load failure threshold. Simulation results show that enhancing the control capability and increasing the number of control positions can improve the control cost of the air traffic control network. The higher the control cost, the better the resilience of the air traffic control network. Improving the control capability of control nodes has a greater impact on the resilience of the air traffic control network, compared to increasing the number of control nodes. The degree attack on route nodes has a greater impact on the cascade failure of the air traffic control network, compared to random attacks and facility node degree attacks. The cascade failure model proposed in this paper provides a new method for guiding the air traffic control network to resist cascade failure attacks and enhance its resilience.
1. Introduction
With the continuous development of China’s aviation industry, the aviation network has become an indispensable infrastructure network in human society. At the same time, the air traffic control network has also become more complex and has been continuously improved. From 2019 to 2021, there were a total of 49 general aviation accidents and 1569 transport aviation incidents in China’s civil aviation sector [1]. In recent years, traffic accidents that cause flight delays or cancellations due to weather, malicious attacks, equipment failures, and other reasons have occurred frequently, which has raised social concerns about the security of the ATC network [2]. The ATC network is a network that provides air traffic management services by multiple control units through remote networks and related physical service facilities. These control units interact with physical service facilities remotely, such as aircraft, reporting points, ground-to-air communication facilities, ATC monitoring facilities, radar facilities, telemetry facilities, meteorological service facilities, etc. On the one hand, the control units control the operation of physical service facilities, and on the other hand, these physical service facilities provide relevant security services for the control units of the ATC network. A self-organized interdependent network has formed within the ATC network.
These complex interdependent relationships will seriously affect the resilience of the network. When the ATC network is affected by severe weather, deliberate attacks, and other events, some initial failures may cause a control position of the network to fail, and the related service facilities that interact with the control position will also be affected and cause failure. The failure will spread in the network, which may cause a destructive cascading effect [3]. On 8 July 2016, Xiamen Airport was affected by Typhoon Nepartak, which led to the cancellation of 245 inbound and outbound flights. On 16 June 2021, Southwest Airlines in the United States stopped operating due to website crashes, resulting in the cancellation of nearly 300 flights and the delay of more than 500 flights. On 17 April 2022, Sunwing Airlines in Canada was attacked by a network attack, which caused system failures and delays in 188 flights. When the ATC network experiences cascading failure due to special circumstances, it will affect the operation of the entire network, causing the failure of some airports, route points, and sectors, leading to aircraft congestion, flight cancellations, or delays.
Regarding the cascade failure model of interdependent networks, Yanli Gao et al. [4] proposed a “one-to-one” asymmetric interdependent network model. They studied the second-order to first-order transition of the network under random attacks using percolation theory, and analyzed the impact of different phase transition types, from mixed transition to second-order transition, on the network’s vulnerability. Reference [5] proposed an energy-based cascading failure model for the one-to-one interdependent network, based on control nodes. Wang Ning et al. [6] studied the robustness of the one-to-one interdependent network model under different attack strategies, connection strategies, and load distribution mechanisms. Liu Run-Ran et al. [7] studied a cascading failure model of one-to-one interdependent networks under random allocation, and the results showed that, as the number of failed nodes increased, the size of the giant connected component decreased from the first-order phase transition to the second-order phase transition to near-zero values. However, the one-to-one cascading failure model cannot fully reflect the operational characteristics of interdependent network systems, as the nodes in this model depend only on one node in another network to operate, which has certain limitations.
Zhen Huang et al. [8] proposed a “k-n” interdependent network model for network-level cascading failure, in which a node provides service support to multiple nodes and is controlled by only one control node. Nodes disconnected from the giant connected component will also fail. Zheng Kexian et al. [9] studied the robustness of the “one-to-many” multilayer interdependent network model under random attacks, and investigated the relationship between the robustness of the system and the interlayer average degree, and the critical threshold of the maximum connected subgraph in the final stable state. Zhuoyang Wang et al. [10] improved and optimized the dependency relationship in the interdependent network and proposed a “many-to-many” cascading failure model for interdependent networks. Meizhu Li et al. [11] studied different network models, such as multilayer networks, multiplex networks, interconnection networks, and NON networks, to describe the relationships between different systems, and proposed a method to identify critical influential nodes in NON. Xin Su et al. [12] studied a cascading failure model of interdependent networks, based on multiple dependency relationships, and investigated the relationship between network robustness and the number of dependent links and cluster size. Jian Wang et al. [13] proposed a cascading failure model of interdependent networks, based on dependency groups, and studied the relationship between inter-layer correlation and dependency group size and system robustness. Compared with the “one-to-one” model, the “k-n”, “many-to-many”, and NON models, which have non-single dependency relationships, are more suitable for interdependent networks and reflect the complex dependency relationships between networks more accurately.
Sturaro et al. [14] proposed a cascading failure model for heterogeneous interdependent networks. The model constructed interdependent relationships between heterogeneous networks, and studied the heterogeneity of networks and their complex interdependencies, which is more closely related to the cascading failure process in industrial control networks. Zhengcheng Dong et al. [15] proposed a cascading failure model for interdependent networks, based on core-periphery structure. The model consists of a dense core and sparse periphery, and studied the impact of mutual coupling and random coupling on network robustness. Wu Yipeng et al. [16] proposed a cascading failure propagation model for interdependent networks based on discrete dynamic systems. The model used conditional probability between network nodes to represent the cascading failure propagation, and the conditional probability served as the state variable of the discrete dynamic system, proposing the cascading failure propagation process of network nodes in continuous time. Tianqiao Zhang et al. [17] proposed a cascade failure model of interdependent networks with star-shaped links. In this model, network A has f service nodes, and each service node provides services to n nodes in network B. Meng Tian et al. [5] proposed a cascading failure model for interdependent networks, based on control nodes and control support. The model studied the impact of control factors and control nodes on network cascading failures. The “core-periphery”, “discrete dynamic”, and “star-shaped links” cascading failure models, based on network characteristics, reflect the characteristics of different interdependent network dependencies and cascading failure propagation, greatly enriching the research on cascading failure models for interdependent networks.
In the research on cascading failure propagation in interdependent networks, Sisi Duan et al. [18] studied the application of optimal broadcasting algorithms in cascading failure propagation in interdependent networks, proposing distributed algorithms and centralized algorithms for node failure analysis. Yubo Huang et al. [19] proposed a small perturbation analysis method to identify abnormal nodes, enhancing network resilience against cascading failure attacks by controlling the abnormal nodes after an attack. The results also showed that increasing coupling strength can significantly improve network stability. Yi Shen et al. [20] proposed a cascading failure model for interdependent networks, based on traffic redistribution under fluctuating loads, studying the impact of node tolerance and traffic distribution on network robustness. Alexander Veremyev et al. [21] studied the optimization problem of identifying critical nodes in interdependent networks, based on conditional risk values.
The above-mentioned interdependent network cascading failure models have expanded the research methods for interdependent network cascading failures, but there is little research on cascading failures in air traffic control networks, both domestically and internationally. In this paper, based on the characteristics of cyber-physical systems and the actual operation of air traffic control networks, it is modeled as two interdependent complex networks. The cascading failure process of the air traffic control network is analyzed when attacking a certain node in the network, such as control positions, aircraft, reporting points, ground-air communication facilities, air traffic monitoring facilities, meteorological service facilities, etc., exploring its internal interdependencies, the process of initial failure nodes causing multiple dependent nodes to fail, and its internal failure propagation rules. Network attacks can have serious impacts on air traffic control networks, potentially leading to flight delays or cancellations, airport closures, compromising the safety of air traffic control networks, and causing safety and flight accidents. The cascading failure model can be used to address potential network attack threats by enhancing control capabilities, increasing the number of control positions, and implementing emergency response measures to counter network attacks and prevent cascading failures caused by network attacks.
This article focuses on the resilience of air traffic control networks and constructs a cascading failure model, based on the complex interdependent network theory. Relevant concepts such as control cost are introduced to study the propagation process of cascading failures in interdependent networks, with a particular focus on the resilience of air traffic control networks under different interdependence parameter conditions between the control coordination network and the route facility network. A comparison is made with existing models, and the experimental results show that existing models simplify the fault evolution and network functional requirements, leading to an underestimation of cascading failures. To study the robustness of air traffic control networks and the impact of cascading failures, this article proposes optimization directions for air traffic control networks, providing guidance for them to resist cascading failure attacks and enhance their resilience.
The rest of the article is organized as follows: In Section 2, the cascading failure model for air traffic control networks is constructed. Section 3 discusses the propagation process of the cascading failure model in detail, while Section 4 presents the experimental results and discussion. Finally, Section 5 summarizes the conclusions.
2. Cascading Failure Model for Air Traffic Control Networks
A Cyber-Physical System (CPS) [22] is a complex system that integrates sensing, computing, and control, with features such as real-time perception, control management, and information services. The air traffic management network is a complex cyber-physical system [23], formed by the coupling of information and physical networks, integrating facilities such as navigation, radar, communication, surveillance, and sensing, and providing services such as air traffic control, navigation information, air traffic safety, and airspace management, as shown in Figure 1. Currently, in the application of CPS in air traffic control, Ren L et al. [24] studied the application of critical tasks in CPS systems in the aviation network from three aspects: aircraft, aircraft operation control, and air navigation operation and maintenance services. Zheng Xueli et al. [25] established an aviation CPS network model, based on node attributes and mobile tasks. Wang Xinglong et al. [25] proposed an air traffic CPS model, based on control network and route network.
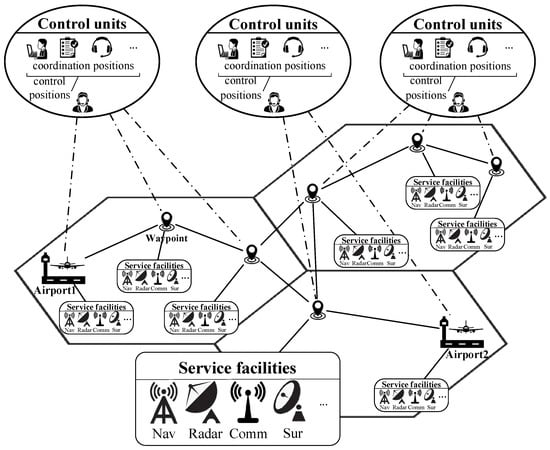
Figure 1.
Air traffic control network.
In the air traffic control network, the information and physical network systems are composed of a large number of components, and, in most cases, the impact of most terminals on the system reliability is limited. Therefore, when modeling, only the component nodes that play an important role in the network are considered. Based on the air traffic CPS model [26], this paper considers the differences in node functions and proposes two types of dependencies. According to the civil aviation air traffic management regulations [27] and the interdependence between control units and physical route service facilities, the air traffic control network is modeled as a cascading failure model of interdependent complex networks, as shown in Figure 2.
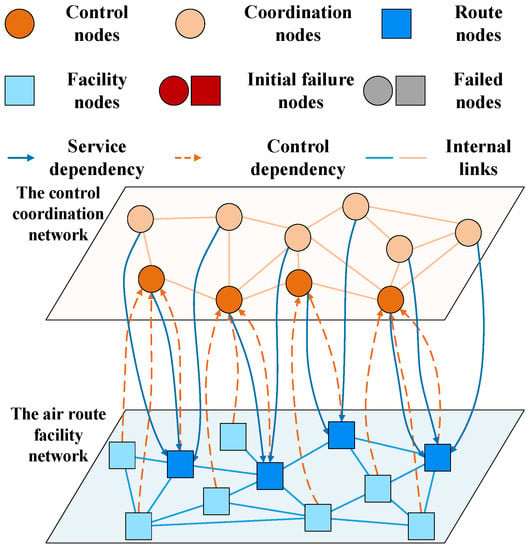
Figure 2.
Cascading failure model for air traffic control networks.
Within the information and physical networks, the internal links are undirected. When modeling, both networks are represented as undirected graphs. The information network is the control coordination network, which is modeled as a graph:
Here, is the control coordination network, and the node set of the control coordination network is divided into control nodes and coordination nodes . Control nodes are control positions in control units, such as airport control positions, ground control positions, approach control positions, procedural control positions, radar control positions, flow management positions, etc. They are mainly responsible for controlling activities of aircraft and reporting points within corresponding control sectors. Coordination nodes are coordination, operation, and support positions in control units, such as release permission release positions, notification coordination positions, director positions, military coordination positions, flight plan processing positions, search and rescue coordination positions, dynamic maintenance positions, etc. They are mainly responsible for reporting navigation dynamic information and plans to aircraft, relevant positions, and related units, and conducting necessary coordination. The edges of the control coordination network represent the transmission of information instructions between connected positions in the control coordination network .
The physical network is the air route facility network, which is modeled as a graph:
In this network, is the air route facility network, and the node set of the air route facility network is divided into route nodes and facility nodes . Route nodes are geographical nodes on the aircraft route, such as position reporting points, mandatory reporting points, airports, navigation points, important points, transition points, holding points, control transfer points, control permission boundary points, etc. They are mainly key geographical nodes, established on the aircraft route for navigation, reporting aircraft positions, and changing air traffic service settings. Facility nodes are relevant physical service facilities in the physical network, such as aircraft, ground-air communication facilities, satellite communication facilities, monitoring facilities, navigation equipment, meteorological service facilities, terminal information facilities, etc. They are mainly physical facilities, such as sensors, detectors, and transducers, with the function of collecting surrounding information. The edges of the air route facility network represent the transmission of sensing information data between nodes in the air route facility network .
After modeling the information network and physical network, we establish edge relationships between the control coordination network and the air route facility network . Considering the interdependence within the air traffic control network, two special dependency edge relationships are defined as control dependency and service dependency. In the air traffic control network, control nodes have the ability to control all nodes in the air route facility network. Control dependency refers to the dependence of each node in the air route facility network on control nodes in the control coordination network . Each control node has a control capability of , which means that the operation of route points and related physical service facilities in the air route facility network are managed and controlled by various control positions. At the same time, control coordination nodes in the control coordination network require service data support provided by each route node in the air route facility network . Due to the difference in address location, all service data is uniformly uploaded to control coordination network nodes by route nodes . Service dependency refers to the dependence of control coordination network nodes on route nodes in the air route facility network , indicating that control and coordination positions in the control coordination network are supported by service data from each route point. These two dependency relationships are called dependency edges.
A dependency edge represents a one-way dependency edge from node to node . It means that the dependency edge only works when is running, but does not depend on . This dependency relationship is directional and asymmetric. If node depends on node , it does not mean that node depends on node . Only when there is a bidirectional dependency edge between nodes and is it indicated that and depend on each other to work properly. This is shown in Figure 3. In this paper, both control dependency and service dependency are mandatory dependency relationships. The control dependency of the route facility network nodes depends on the control nodes, which reflects the air control in the air traffic management system. The service dependency of the control coordination network nodes depends on the route nodes, which reflects the control and sharing of information resources in the air traffic management system.
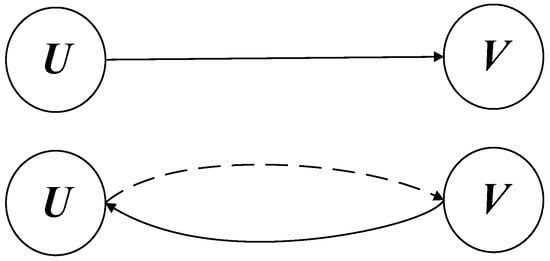
Figure 3.
Dependency edge.
When establishing the cascading failure model, the meanings of the node codes are shown in Table 1.

Table 1.
Codes and their meanings in the model.
3. The Fault Propagation and Instances of Cascading Failure Models
Under normal circumstances, the air traffic control network maintains a regular operational state, and the control coordination network and the air route facility network support each other. According to the cascading failure model of the air traffic control network, the nodes in the network need to meet the following conditions to maintain normal operation: The node function is intact; the nodes in the air route facility network have control dependency edges; the nodes in the control coordination network have service dependency edges; and they are connected to the largest connected component. The process of cascading failure in the air traffic control network is shown in Figure 4. The process of cascading failure is as follows:
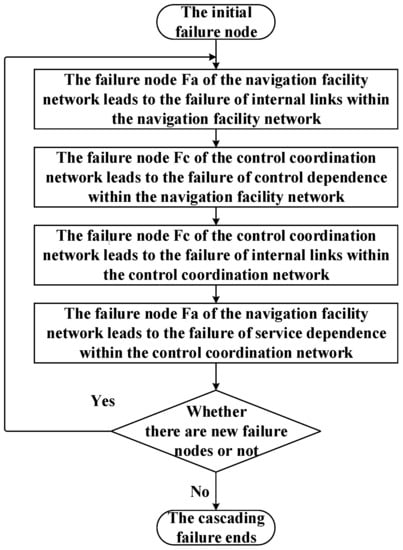
Figure 4.
The cascading failure process diagram of the air traffic control network.
- (1)
- The attacker attacks a node in the control coordination network or the air route facility network and causes it to fail;
- (2)
- Nodes that have dependency and internal link relationships with the failed node will also fail, and their normal operation conditions will be checked;
- (3)
- The failure of the node is then fed back to the corresponding control coordination network and air route facility network . This process is iterated repeatedly until there are no new node failures, and the network reaches its final stable state, and the process of cascading failure ends.
To further illustrate the control dependency relationships, service dependency relationships, and failure rules in the cascading failure model of the air traffic control network, an example is presented in this section to analyze the evolution of cascading failures in the network. In this example, as shown in Figure 5, there are two layers of networks, the control coordination network and the air route facility network . The control coordination network at the top contains two control nodes, and , and four coordination nodes, , , , and . The air route facility network at the bottom contains three route nodes , , and , and five facility nodes , , , , and . The control dependency relationship between the control nodes and the nodes in the air route facility network is as follows:
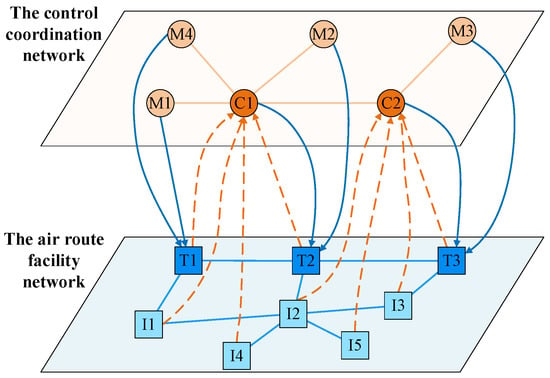
Figure 5.
Example of cascading failure model in air traffic control network.
The service dependency relationship between the route nodes and the control coordination network nodes is as follows:
In the air traffic control network, attackers generally use methods such as ADS-B injection to launch network attacks, due to the dispersed and location-differentiated characteristics of route nodes. Control nodes usually have certain protective measures, and it is difficult to directly attack nodes in the control coordination network. This paper mainly studies the resilience of the air traffic control network under network attacks on route facility network nodes by attackers. In the following scenario, the attacker simulates an attack on the route nodes in the route facility network, causing the route nodes to fail, and resulting in the failure of control coordination network nodes that rely on the service data provided by the node, as shown in Figure 6. The process of cascading failure is as follows:
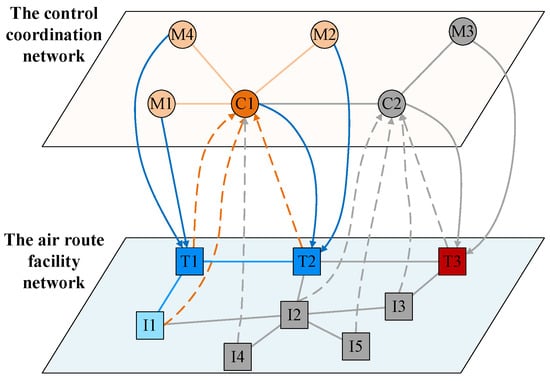
Figure 6.
Scenario of cascading failure model in air traffic control network.
- (1)
- Node fails;
- (2)
- Due to service dependency, causes and to fail;
- (3)
- Due to control dependency, causes , , and to fail;
- (4)
- Due to internal links, causes to fail.
When the network reaches a steady-state and the cascade failure ends, a total of 7 nodes have failed, while 7 nodes are still functioning normally.
4. Simulation Experiment and Analysis
4.1. Experimental Explanation
Through experimental simulation of the cascading failure model in the air traffic control network, the Network X library in Python [28] was used in the simulation network to explore and analyze network properties. Previously, most complex networks, including air traffic control networks, were considered random networks, with node degree distributions following the Poisson distribution. However, the research by Barabasi and Albert [29] showed that the Internet, computer wiring diagrams, and other networks are different from random networks, with node degree distributions following a power-law distribution and the existence of hub nodes. Zhang Haixia et al. [30] studied the topological characteristics of the global aviation network and found that it is a scale-free heterogeneous network. They also improved the node contraction method and ranked the importance of nodes.
The simulation experiment network topology uses the BA model to generate the control coordination network with power-law degree distribution and scale-free characteristics, and the air route facility network is modeled based on the route map. The control coordination network is modeled as a scale-free network with node degree distribution following a power-law distribution:
Here, is the probability that a node has links, and is the power-law exponent. The topology of the control coordination network in the air traffic control system is similar to that of real communication networks, such as the Internet. During the generation process of the control coordination network, nodes are iteratively added, and each new node is connected to existing nodes.
We denote the number of air route facility network nodes that a control node can manage as the control capacity of the control node, denoted as . In the construction of the control coordination network in this article, it is assumed that the control capacity of each control node is consistent, and each control node in the control coordination network supports nodes in the route facility network.
After the construction of the control coordination network and the air route facility network , the dependency relationship between the two networks is established. The method of constructing the dependency relationship is as follows: each node in the air route facility network has control dependency relationships from control nodes, and each control node can manage nodes in the route facility network. Each node in the control coordination network requires one service dependency relationship from a route node in the air route facility network, and all service dependency relationships are randomly assigned. The nodes in the air route facility network all have control dependency edges from the control nodes , and the control coordination network nodes all have service dependency edges from the route nodes . When the simulation network was established, the meanings of the node numbers used were as shown in Table 2.

Table 2.
Codes and their meanings in the simulation.
In order to effectively reflect the control capability of the air traffic control network, the control cost is defined as the cost required for the control nodes to manage and control the air route facility network nodes :
Here, represents the control cost of the air traffic control network, which represents the actual meaning of the number of control dependency edges in the air traffic control network. represents the control cost required for a single air route facility network node , and represents the control capability of a single control node . To reflect the anti-destructive ability of the air traffic control network, the load failure threshold value of the system is defined as the minimum initial failure node quantity required for the air traffic control network to reach complete failure:
Here, represents the initial number of failed nodes, represents the final number of failed nodes, and represents the number of nodes in the air traffic control network. The stronger the anti-destructive ability of the network, the smaller the final number of failed nodes at the steady-state of cascading failure will be, under the same initial number of failed nodes , and the larger the load failure threshold value of the system will be.
The experimental steps are shown in Algorithm 1. In this paper, the route facility network in the air traffic control network is attacked, and the impact of different attack types and parameters on the resilience of the air traffic control network is observed as the attack intensity and initial number of failed nodes increase.
| Algorithm 1 Cascade Failure Model for Air Traffic Control Network | ||
| Input: | ||
| Modeling of control coordination network: ; | ||
| Modeling of route facilities network: ; | ||
| Initial failure nodes: ; | ||
| Output: | ||
| Network topology after cascading failure. | ||
| //Initialization | ||
| (1) | ; | |
| (2) | ; | |
| (3) | ||
| (4) | ; | |
| //Failure nodes caused by internal link failure in the route facilities network. | ||
| (5) | The node in the route facilities network becomes disconnected from the largest connected subgraph of the route facilities network, due to the failure of node in the route facilities network. | |
| (6) | ; | |
| //Failure nodes caused by control dependency failure in the route facilities network. | ||
| (7) | The node in the route facilities network loses control dependency, due to the failure of the node in the control coordination network. | |
| (8) | ; | |
| //Failure nodes caused by internal link failure in the control coordination network. | ||
| (9) | The node in the control coordination network becomes disconnected from the largest connected subgraph of the control coordination network, due to the failure of the node in the control coordination network. | |
| (10) | ; | |
| //Failure nodes caused by service dependency failure in the control coordination network. | ||
| (11) | The node(s) in the control coordination network lose service dependency, due to the failure of node(s) in the route facilities network. | |
| (12) | ; | |
| (There are new failure nodes.) | ||
4.2. The Impact of the Control Capacity of Control Nodes on the Anti-Destructive Ability of the Air Traffic Control Network
In this set of experiments, when the number of nodes in the network topology of the cascading failure model in the air traffic control network is determined (i.e., and are determined), with the increase of the initial number of failed nodes , the final number of failed nodes and the load failure threshold value of the system were compared under different control capacities when the cascading failure ended and the network reached the final steady state.
Taking Figure 7a as an example, it can be analyzed that, from top to bottom, the control capacities of the control nodes are 5, 10, 15, and 500, respectively. With the improvement of the control capacity, the initial cascading failure rate of the network decreases, and the fewer final failed nodes are caused under the same initial number of failed nodes. The load failure threshold values of the system are approximately 7, 30, 40, and 50, respectively, and the load failure threshold value of the system with stronger control capacity is higher. When the network is close to complete destruction, the cascading failure rate of the system with stronger control capacity decreases to 0 later. In summary, as shown in Figure 7a,b, when the number of control nodes is determined, with the increase of the control capacity of the control nodes, the number of control dependency edges provided by the control nodes to the air route facility network nodes increases. The destruction of some dependent edges does not easily cause node failure, and the cascading failure rate of the network decreases, enhancing the anti-destructive ability of the air traffic control network. The results show that, by enhancing the control capacity of each control position in the control coordination network, the cascading failure rate of the network can be reduced, which can improve the anti-destructive ability of the air traffic control network and enhance its ability to resist cascading failures.
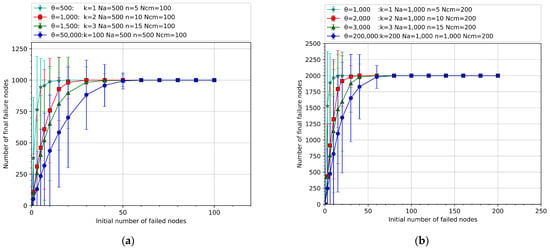
Figure 7.
The relationship between network anti-destructive ability and control capacity of control nodes. (a) The total number of nodes is 1000. (b) The total number of nodes is 2000. (The curves shown in the circle represent the study of the maximum control capacity of control nodes under ideal conditions. Each curve in the figure represents the average result of 25 rounds of random attacks on 10 model networks).
4.3. The Impact of the Number of Control Nodes on the Anti-Destructive Ability of the Air Traffic Control Network
In this set of experiments, when the control capacity of the control nodes is determined, with the increase of the initial number of failed nodes , the final number of failed nodes and the load failure threshold value of the system were compared under different numbers of control nodes when the cascading failure ended and the network reached the final steady state.
Taking Figure 8a as an example, it can be analyzed that, from top to bottom, the numbers of control nodes are 2, 4, 100, and 200, respectively. With the increase of the number of control nodes, the initial cascading failure rate of the network decreases, and the fewer final failed nodes are caused under the same initial number of failed nodes. The load failure threshold value of the system is higher for the system with more control nodes. When the network is close to complete destruction, the cascading failure rate of the system with more control nodes decreases to 0 later. In summary, as shown in Figure 8a,b, when the control capacity of the control nodes in the air traffic control network is determined, with the increase of the number of control nodes, the number of control dependency edges provided by the control nodes to the air route facility network nodes increases. The cascading failure rate of the network decreases, enhancing the anti-destructive ability of the air traffic control network. The results show that, by increasing the number of control positions in the control coordination network, the cascading failure rate of the network can be reduced, which can improve the anti-destructive ability of the air traffic control network and enhance its ability to resist cascading failures. From the conclusions of Section 4.2 and Section 4.3, it can be seen that, when the control capacity of the control nodes is enhanced and the number of control nodes is increased, it is equivalent to increasing the control cost of the air traffic control network from two different aspects, which is beneficial to improving the anti-destructive ability of the air traffic control network.
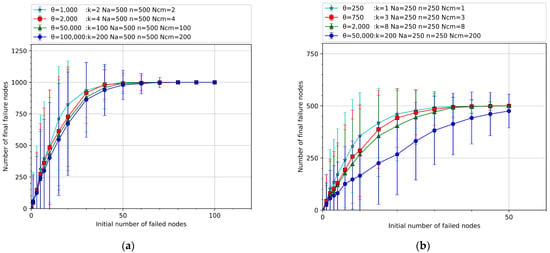
Figure 8.
The relationship between network anti-destructive ability and the number of control nodes. (a) The total number of nodes is 1000. (b) The total number of nodes is 500. (The curves shown in the circle represent the study of the maximum control capacity of control nodes under ideal conditions. Each curve in the figure represents the average result of 25 rounds of random attacks on 10 model networks).
4.4. The Impact of the Control Capacity and the Number of Control Nodes on the Anti-Destructive Ability of the Air Traffic Control Network
In this set of experiments, when the control cost is determined, with the increase of the initial number of failed nodes , the final number of failed nodes and the load failure threshold value of the system were compared under different conditions when the cascading failure ended and the network reached the final steady state.
Taking Figure 9a as an example, it can be analyzed that, with the control cost of the air traffic control network determined, from top to bottom, the control capacities of the control nodes are 50, 250, and 500, respectively. With the increase of the control capacity and the decrease of the number of control nodes, the initial cascading failure rate of the network decreases, and the fewer final failed nodes are caused under the same initial number of failed nodes. The load failure threshold value of the system is higher for the system with stronger control capacity. When the network is close to complete destruction, the cascading failure rate of the system with stronger control capacity decreases to 0 later. In summary, as shown in Figure 9a,b, when the control cost of the air traffic control network is determined, with the enhancement of the control capacity of the control nodes and the reduction of the number of control nodes, the cascading failure rate of the network decreases, enhancing the anti-destructive ability of the air traffic control network. The results show that enhancing the control capacity of the control nodes is more beneficial to improving the anti-destructive ability of the air traffic control network, compared to increasing the number of control nodes.
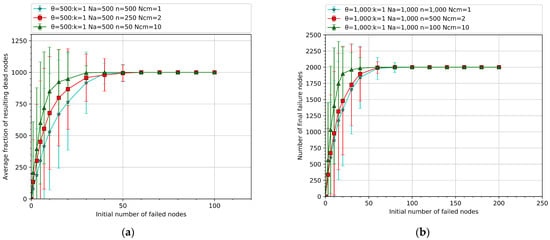
Figure 9.
The degree of influence of control capacity and the number of control nodes on the anti-destructive ability of the network. (a) The total number of nodes is 1000. (b) The total number of nodes is 2000. (Each curve in the figure represents the average result of 25 rounds of random attacks on 10 model networks).
4.5. The Impact of Targeted Attacks on the Anti-Destructive Ability of the Air Traffic Control Network
In this set of experiments, the degree values of the air route facility network nodes were sorted from high to low for targeted attacks. The degree attack on the route nodes, the degree attack on the facility nodes, and the random attack were compared.
As shown in Figure 10, among the three attack scenarios, the attack effect of the degree attack on the route nodes is the most obvious. The degree value of the route nodes in busy airspace is high. When the attacker attacks these high-value nodes, the attacks cause the control nodes that rely on these route nodes to provide service data support to fail, thus limiting the control capacity of the control and coordination network and triggering further failures, leading to destructive effects. Due to the limitations of their own functions, after the facility nodes are attacked, the route nodes may still work normally. With the increase of failed facility nodes, a certain route node may fail, which will cause a step-like failure effect on the air traffic control network. The results show that the impact of the degree attack on the route nodes on the cascading failure of the air traffic control network is greater than that of the random attack and the degree attack on the facility nodes.
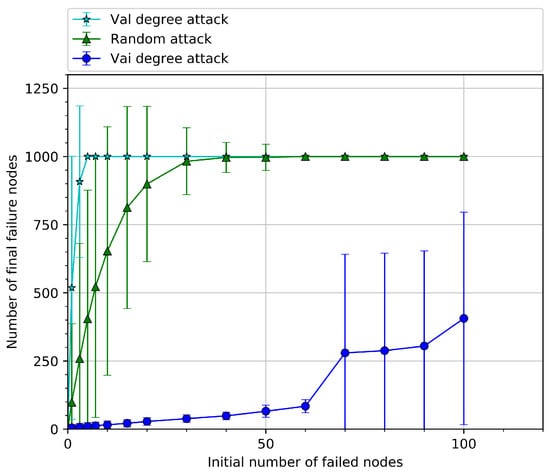
Figure 10.
The impact of degree attack and random attack on the anti-destructive ability of the network.
4.6. The Comparison of this Model with Other Models in the Article
In this set of experiments, the cascading failure model of the air traffic control network, based on the theory of interdependent networks proposed in this article, was compared with other single-layer and multi-layer network models.
As shown in Figure 11a, literature [31,32] modeled the airport network and found that the largest connected subgraph of the airport network is approximately inversely proportional to the attack ratio when subjected to random attacks. Literature [32] modeled the airport network, route network, and sector network, based on domestic flight data in China. Under random attacks, the robustness of the network, from weak to strong, is: route network, sector network, and airport network. However, in the actual operation of the air traffic control network, the elements of each node, such as route points, sector nodes, and airport nodes in the route network, sector network, and airport network, are not operated independently. There are certain internal connections between them. The models in literature [31,32,33] did not consider the dependency between the various node elements in the network, greatly underestimating the size of the cascading failure of the air traffic control network.
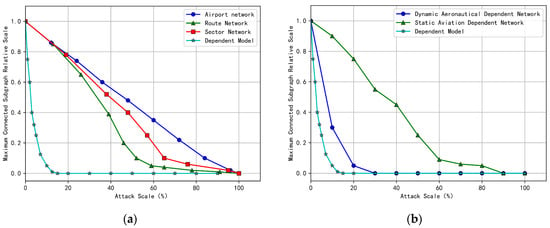
Figure 11.
Comparison of the interdependent air traffic control network model with other models: (a) Comparison with single-layer airport network, route network, and sector network models; (b) Comparison with interdependent air traffic control network model in North China.
As shown in Figure 11b, literature [34] modeled the air traffic control network in North China, based on data from the region, and constructed a three-layer interdependent network consisting of airport network, route network, and control network, adding bidirectional and unweighted connections outside to simulate the dependency between networks. Due to its simple failure rules that do not fully describe the actual dependency relationships, the North China air interdependent network model largely underestimates the size of the cascading failure of the air traffic control network. The schematic diagram of the air traffic control network in North China is shown in Figure 12. The interdependent air traffic control network model was used to model the North China air traffic control network. Compared with the North China air interdependent network model in literature [34], the interdependent air traffic control network model takes into account the heterogeneity of the network and defines the complex interaction relationship between the control coordination network and the air route facility network. The model defines control dependency and service dependency, clearly reflecting the propagation rules of cascading failures in the network. Compared with the models in literature [31,32,33,34], the interdependent air traffic control network model performs better and can predict more node failures and better predict changes in cascading failures in the network.
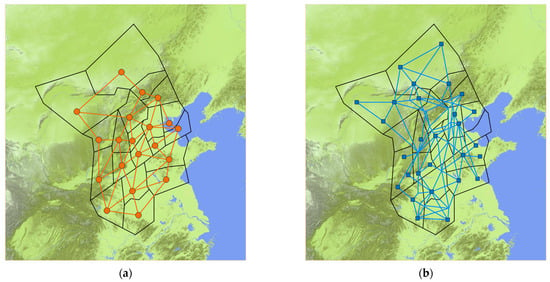
Figure 12.
Schematic diagram of the air traffic control network in North China. (a) Control coordination network in North China. (b) Air route facility network in North China. (There are 20 control nodes represented by circles in the control coordination network, and 69 air route nodes in the air route facility network, including 28 airports, represented by squares, and 41 other navigation nodes, represented by intersections of routes in the figure).
5. Conclusions
In this article, the air traffic control network was modeled using the theory of interdependent networks and CPS theory. A cascading failure model of the air traffic control network, composed of the control coordination network and the air route facility network, was constructed. The dependency relationships of control dependency and service dependency were proposed, and the propagation process of cascading failures under this model was analyzed. This model is closer to the actual operation of the air traffic control network and more clearly reflects the relationship between control and service support within the air traffic control network, as well as the process of cascading failures. The relationship between the resilience of the air traffic control network system and parameters such as the control capacity of control nodes, the number of control nodes, and the control cost was studied. The results showed that, under the condition of determining the topology of the air traffic control network, enhancing the control capacity of each control position can effectively improve the resilience of the network by reducing the rate of cascading failures; under the condition of determining the control capacity of control positions, increasing the number of control positions can also effectively improve the resilience of the network by reducing the rate of cascading failures; enhancing the control capacity and the number of control positions can both increase the control cost of the air traffic control network and also reduce the rate of cascading failures, which is conducive to improving the resilience of the network; compared to increasing the number of control positions, enhancing the control capacity of control positions is more conducive to improving the resilience of the air traffic control network. Degree attacks on route nodes have a greater impact on the cascading failure of the air traffic control network, compared to random attacks or degree attacks on facility nodes.
The cascading failure model of air traffic control networks proposed in this article shows that once a cascading failure occurs in the air traffic control network, it may cause the entire air traffic control system to collapse, leading to serious impacts on flight safety and economy. Although increasing control costs can improve the safety of the air traffic control network, it also increases the operating costs of aviation authorities in operating the air traffic control network. However, compared with the safety and stability of the air traffic control system, these costs and resource inputs are necessary. Implementing the strategies suggested in the cascading failure model is feasible.
Our work can help aviation authorities better understand the risks and safety issues in the air traffic control system, providing a reference for them to develop more scientific and effective safety management measures. Although aviation authorities may need some cost and resource inputs, these measures can effectively improve the safety and reliability of the air traffic control system, reduce flight delays and cancellations, enhance the robustness of the air traffic control network, ensure the time cost, economy, and safety of airlines and passengers, and bring safer and more convenient air traffic services to society.
Although this article provides some ideas and methods for studying cascading failures in the air traffic control network, it has not yet considered the differences in control nodes under different sectors and the elasticity of the air traffic control network’s own recovery. Further improvements are needed in the next step, combined with the actual application background.
Author Contributions
Conceptualization, J.B. and Y.Y.; methodology, J.B. and B.W.; software, L.Z.; validation, J.B. and Y.Y.; formal analysis, J.B. and L.Z.; investigation, Y.Y.; resources, J.B. and L.Z.; data curation, L.Z.; original draft preparation, J.B.; review and editing, B.W. and Y.Y.; visualization, J.B.; supervision, B.W. and Y.Y.; project administration, B.W.; funding acquisition, B.W. and Y.Y. All authors have read and agreed to the published version of the manuscript.
Funding
This work was partially supported by the Shaanxi Provincial Natural Science Foundation of China under Grant 2021JQ-879.
Institutional Review Board Statement
Not applicable.
Informed Consent Statement
Not applicable.
Data Availability Statement
Not applicable.
Conflicts of Interest
The authors declare no conflict of interest.
References
- Civil Aviation Administration of China. Civil Aviation Industry Development Statistical Bulletin; Civil Aviation Administration of China: Beijing, China, 2021. [Google Scholar]
- Milbredt, O.; Popa, A.; Doenitz, F.C.; Hellmann, M. Aviation security automation: The current level of security automation and its impact. J. Airpt. Manag. 2022, 16, 184–208. [Google Scholar]
- Wu, Y.; Chen, Z.; Zhao, X.; Zhang, P.; Liu, Y. Robust analysis of cascading failures in complex networks. Phys. A Stat. Mech. Appl. 2021, 583, 126320. [Google Scholar] [CrossRef]
- Gao, Y.C.; Shiming, Z.; Zhang, J.; Stanley, J.H.E. Multiple phase transition in the non-symmetrical interdependent networks. Phys. A Stat. Mech. Appl. 2020, 556, 124822. [Google Scholar] [CrossRef]
- Tian, M.; Dong, Z.; Cui, M.; Wang, J.; Wang, X.; Zhao, L. Energy-supported cascading failure model on interdependent networks considering control nodes. Phys. A Stat. Mech. Appl. 2019, 522, 195–204. [Google Scholar] [CrossRef]
- Wang, N.; Jin, Z.Y.; Zhao, J. Cascading failures of overload behaviors on interdependent networks. Phys. A Stat. Mech. Appl. 2021, 574, 125989. [Google Scholar] [CrossRef]
- Liu, R.R.; Jia, C.X.; Lai, Y.C. Asymmetry in interdependence makes a multilayer system more robust against cascading failures. Phys. Rev. E 2019, 100, 052306. [Google Scholar] [CrossRef] [PubMed]
- Huang, Z.; Wang, C.; Stojmenovic, M.; Nayak, A. Characterization of cascading failures in interdependent cyber-physical systems. IEEE Trans. Comput. 2015, 64, 2158–2168. [Google Scholar] [CrossRef]
- Zheng, K.; Liu, Y.; Gong, J.; Wang, W. Robustness of circularly interdependent networks. Chaos Solitons Fractals 2022, 157, 111934. [Google Scholar] [CrossRef]
- Wang, Z.; Chen, G.; Liu, L.; Hill, D. Cascading risk assessment in power-communication interdependent networks. Phys. A Stat. Mech. Appl. 2020, 540, 120496. [Google Scholar] [CrossRef]
- Li, Q. Evidential identification of influential nodes in network of networks. Chaos Solitons Fractals Appl. Sci. Eng. Interdiscip. J. Nonlinear Sci. 2018, 117, 283–296. [Google Scholar] [CrossRef]
- Su, X.; Ma, J.; Chen, N.; Zhu, X. Cascading failures on interdependent networks with multiple dependency links and cliques. Phys. A Stat. Mech. Appl. 2019, 526, 120907. [Google Scholar] [CrossRef]
- Wang, J.; Fang, H.; Qin, X. Cascading failures on correlated interdependent networks with dependency groups. Phys. A Stat. Mech. Appl. 2019, 530, 121355. [Google Scholar] [CrossRef]
- Sturaro, A.; Silvestri, S.; Conti, M.; Das, S.K. A realistic model for failure propagation in interdependent cyber-physical systems. IEEE Trans. Netw. Sci. Eng. 2018, 7, 817–831. [Google Scholar] [CrossRef]
- Dong, Z.; Tian, M.; Lu, Y.; Lai, J.; Tang, R.; Li, X. Impact of core-periphery structure on cascading failures in interdependent scale-free networks. Phys. Lett. A 2019, 383, 607–616. [Google Scholar] [CrossRef]
- Wu, Y.; Chen, Z.; Zhao, X.; Gong, H.; Su, X.; Chen, Y. Propagation model of cascading failure based on discrete dynamical system. Reliab. Eng. Syst. Saf. 2021, 209, 107424. [Google Scholar] [CrossRef]
- Zhang, T.; Zhang, Y.; Zhu, X.; Chen, J. Cascading failures on interdependent networks with star dependent links. Phys. A Stat. Mech. Appl. 2019, 535, 122222. [Google Scholar] [CrossRef]
- Duan, S.; Lee, S.; Chinthavali, S.; Shankar, M. Best effort broadcast under cascading failures in interdependent critical infrastructure networks. Pervasive Mob. Comput. 2017, 43, 114–130. [Google Scholar] [CrossRef]
- Huang, Y.; Dong, H.; Zhang, W.; Lu, J. Stability analysis of nonlinear oscillator networks based on the mechanism of cascading failures. Chaos, Solitons Fractals 2019, 128, 5–15. [Google Scholar] [CrossRef]
- Shen, Y.; Gang, R.B.; Ning, Z.B.; Guohao, S.; Qin, W.; Bin, R. Effects of mutual traffic redistribution on robustness of interdependent networks to cascading failures under fluctuant load. Phys. A Stat. Mech. Appl. 2020, 560, 125138. [Google Scholar] [CrossRef]
- Veremyev, A.; Pavlikov, K.; Pasiliao, E.L.; Thai, M.T.; Boginski, V. Critical nodes in interdependent networks with deterministic and probabilistic cascading failures. J. Glob. Optim. 2019, 74, 803–838. [Google Scholar] [CrossRef]
- Jbair, M.; Ahmad, B.; Maple, C.; Harrison, R. Threat modelling for industrial cyber physical systems in the era of smart manufacturing. Comput. Ind. 2022, 137, 103611. [Google Scholar] [CrossRef]
- Wang, X.; Wei, Y.; He, M. Structural characteristics and toughness evaluation of air traffic CPS. J. Beijing Univ. Aeronaut. Astronaut. 2022, 1–16. [Google Scholar] [CrossRef]
- Ren, L.; Liao, H.; Castillo-Effen, M.; Beckmann, B.; Citriniti, T. Transformation of Mission-Critical Applications in Aviation to Cyber-Physical Systems. Cyber-Phys. Syst. Acad. Press 2017, 339–362. [Google Scholar] [CrossRef]
- Zheng, X.; Yang, X.; Wang, K.; Zhou, Q. Research on The Mission Oriented Mobile Model of Aviation Network. In Proceedings of the Symposium on Novel Photoelectronic Detection Technology and Applications, Kunming, China, 5–7 November 2020; p. 11763. [Google Scholar]
- Wang, X.; He, M.; Liu, M. Cascade failure and mitigation strategy of air traffic CPS. J. Beijing Univ. Aeronaut. Astronaut. 2021, 47, 2426–2433. [Google Scholar] [CrossRef]
- Civil Aviation Administration of China. Civil Aviation Regulations of China. Part 93. Civil Aviation Air Traffic Management Rules: CCAR-93-R5-2017; Civil Aviation Administration of China: Beijing, China, 2017. [Google Scholar]
- Kollu, V.; Amiripalli, S.S.; Jitendra, M.; Kumar, T.R. A network science-based performance improvement model for the airline industry using networkx. Int. J. Sens. Wirel. Commun. Control 2021, 11, 768–773. [Google Scholar] [CrossRef]
- Barabsi, A.L.; Albert, R. Emergence of Scaling in Random Networks; Princeton University Press: Princeton, NJ, USA, 2011; pp. 349–352. [Google Scholar]
- Zhang, H.; Zhao, J.; Wang, J.; Zhu, P. An Optimization Method for Critical Node Identification in Aviation Network. Front. Phys. 2022, 10, 944136. [Google Scholar] [CrossRef]
- Feng, X.; Hongcan, J. Study of aviation network robustness considering node failure and edge failure. J. Beijing Jiaotong Univ. 2021, 45, 84–92. [Google Scholar]
- Xingsi, C. Robustness Evaluation of Chinese Air Transport Network Based on Complex Network. Beijing Surv. Mapp. 2019, 33, 280–284. [Google Scholar]
- Xu, X. Research on Robustness of Air Transportation Network and Flight Delay Correlation. Nanjing Univ. Aeronaut. Astronaut. 2018, 2, 17–22. [Google Scholar]
- Wang, X.; Pan, W.; Zhao, W. Analysis of Network Characteristics and Robustness of Aeronautical Interdependent Network in North China. Sci. Technol. Eng. 2018, 18, 180–185. [Google Scholar]
Disclaimer/Publisher’s Note: The statements, opinions and data contained in all publications are solely those of the individual author(s) and contributor(s) and not of MDPI and/or the editor(s). MDPI and/or the editor(s) disclaim responsibility for any injury to people or property resulting from any ideas, methods, instructions or products referred to in the content. |
© 2023 by the authors. Licensee MDPI, Basel, Switzerland. This article is an open access article distributed under the terms and conditions of the Creative Commons Attribution (CC BY) license (https://creativecommons.org/licenses/by/4.0/).