Article

Assessment of Rainwater Quality Regarding Its Use in the Roztocze National Park (Poland)—Case Study

by
Tadeusz Grabowski
1,2,
Krzysztof Jóźwiakowski
2,*,
Andrzej Bochniak
3,*,
Przemysław Stachyra
1 and
Bogusław Radliński
1
1
Roztocze National Park, Plażowa 2, 22-470 Zwierzyniec, Poland
2
Department of Environmental Engineering and Geodesy, University of Life Sciences in Lublin, Leszczyńskiego 7, 20-069 Lublin, Poland
3
Department of Applied Mathematics and Computer Science, University of Life Sciences in Lublin, Akademicka 13, 20-950 Lublin, Poland
*
Authors to whom correspondence should be addressed.
Appl. Sci. 2023, 13(10), 6110; https://doi.org/10.3390/app13106110
Submission received: 26 April 2023 / Revised: 11 May 2023 / Accepted: 12 May 2023 / Published: 16 May 2023
(This article belongs to the Special Issue Water and Wastewater Management in Agriculture)

Abstract

:
The aim of this study was to determine the quality of rainwater and the possibility of using it for various purposes in the Roztocze National Park (RNP), Poland. This study was carried out in 2021–2022. Samples of rainwater that drained from the roofs of farm buildings in the RNP were tested for their organoleptic, physicochemical and microbiological qualities. The organoleptic tests were run to evaluate the water for a foreign odour and the threshold odour number. The physical and chemical tests included turbidity; colour; pH; conductivity; concentrations of ammonium ions, nitrates, nitrites, manganese, iron and chlorides; and general hardness. The microbiological tests included total microbial counts at 36 °C and 22 °C, coliform bacteria, Escherichia coli, intestinal enterococci and Pseudomonas aeruginosa. The rainwater quality results were compared with the quality parameters of surface water collected from the River Świerszcz, as well as with the Polish drinking water standards. The findings indicated that rainwater collected in the RNP had good organoleptic, physicochemical and microbiological properties, which, in some cases, complied with the standards for potable water. Exceedances of the permissible limits, mainly for ammonium ions and microbiological indicators, were periodically observed in the tested rainwater. This was probably due to contamination of roof surfaces with bird droppings. However, these exceedances did not exclude the use of the rainwater for economic purposes, e.g., flushing toilets, washing vehicles or watering plants, which may significantly reduce the abstraction of high-quality groundwater. The rainwater that is planned to be used as drinking water for the Polish konik horses living in the park will have to be pre-treated via filtration and disinfection processes (e.g., with a UV lamp).

1. Introduction

In recent times, more and more has been said around the world about the possibility of using rainwater for various purposes [1,2,3]. This discussion was spurred on by the ongoing climate change and increasing water shortages in many countries. Rainwater harvesting and use can improve water security and access to fresh water [2]. It was shown that rainwater harvesting systems (RWHSs) can supply up to 100% of a household’s water needs [1,4,5,6,7,8].
A vital issue is the quality of rainwater, which depends on many different geographical and anthropogenic factors [5,9,10,11]. According to Forster [12], the quality of rainwater collected from roofs depends on the (1) roof material (chemical properties, roughness, surface coating, age, etc.), (2) physical boundary conditions (size, slope, direction and exposure), (3) location of the roof (distance from possible sources of pollution), (4) concentrations of chemical contaminants (water vapor pressure, solubility of pollutants in water, etc.), (5) characteristics of precipitation events (intensity and volume of atmospheric precipitation, wind characteristics, concentration of pollutants in precipitation waters) and (6) local meteorological factors (season of the year, weather characteristics, length of the preceding dry period).
Harvested rainwater usually has good physicochemical parameters, but often contains high levels of microbial contaminants. The pollution of harvested rainwater can be attributed to the combustion of fuels in vehicles and buildings, industrial emissions, agricultural activities in rural areas and faecal deposits from animals, mostly from birds [13]. The quality of rainwater also depends on the storage conditions. Quality assessment data for rainwater stored in different types of cisterns were reported by Wu et al. [14]. These authors showed that concrete tanks are the best solution for storing rainwater.
A study of the structure of household water consumption in Poland showed that about 50% of drinking water can be replaced by rainwater. For public buildings, this percentage is even higher, reaching 65% [15]. The quality of rainwater significantly impacts its use by humans for various purposes, including flushing sanitation, laundry, cleaning, washing cars, and watering crops and lawns [16]. In areas that are particularly vulnerable to water scarcity, rainwater can also be used for drinking [17]. Research done in southern Brazil showed that the potential use of rainwater in animal breeding can be up to 100% of water requirements for poultry production, while for swine production, it ranged between 32.7% and 68.3% [18]. In Australia, many people choose to drink rainwater, even in areas where clean mains water is available, as the latter is chlorinated and fluorinated [19]. However, when rainwater is used for drinking, in order to protect public health, it is very important to know the quality of harvested rainwater [11].
With concerns about ongoing climate change and the associated prospects of a lack of access to potable water, rainwater harvesting and reuse are actions that can improve water security and access to fresh water. The use of rainwater management installations is mainly considered in urbanised areas, where due to the development of these areas, there is often not enough natural space to retain rainwater. However, also or mainly for protected areas, proper rainwater management should be a key issue. It can help to contribute to the sustainable protection of water resources and biodiversity in areas such as national parks, Natura 2000 sites, landscape parks or other nature reserves. Although there are many papers on the quality of rainwater and its use, only a few of them discuss this problem with regard to protected areas. Therefore the goal of this study was to determine the quality of rainwater and the possibility of using it for various purposes in the Roztocze National Park (RNP), Poland. The results we report here open the way to further research into treatment technologies that could be applied to make rainwater suitable for watering the animals living in the park.

2. Materials and Methods

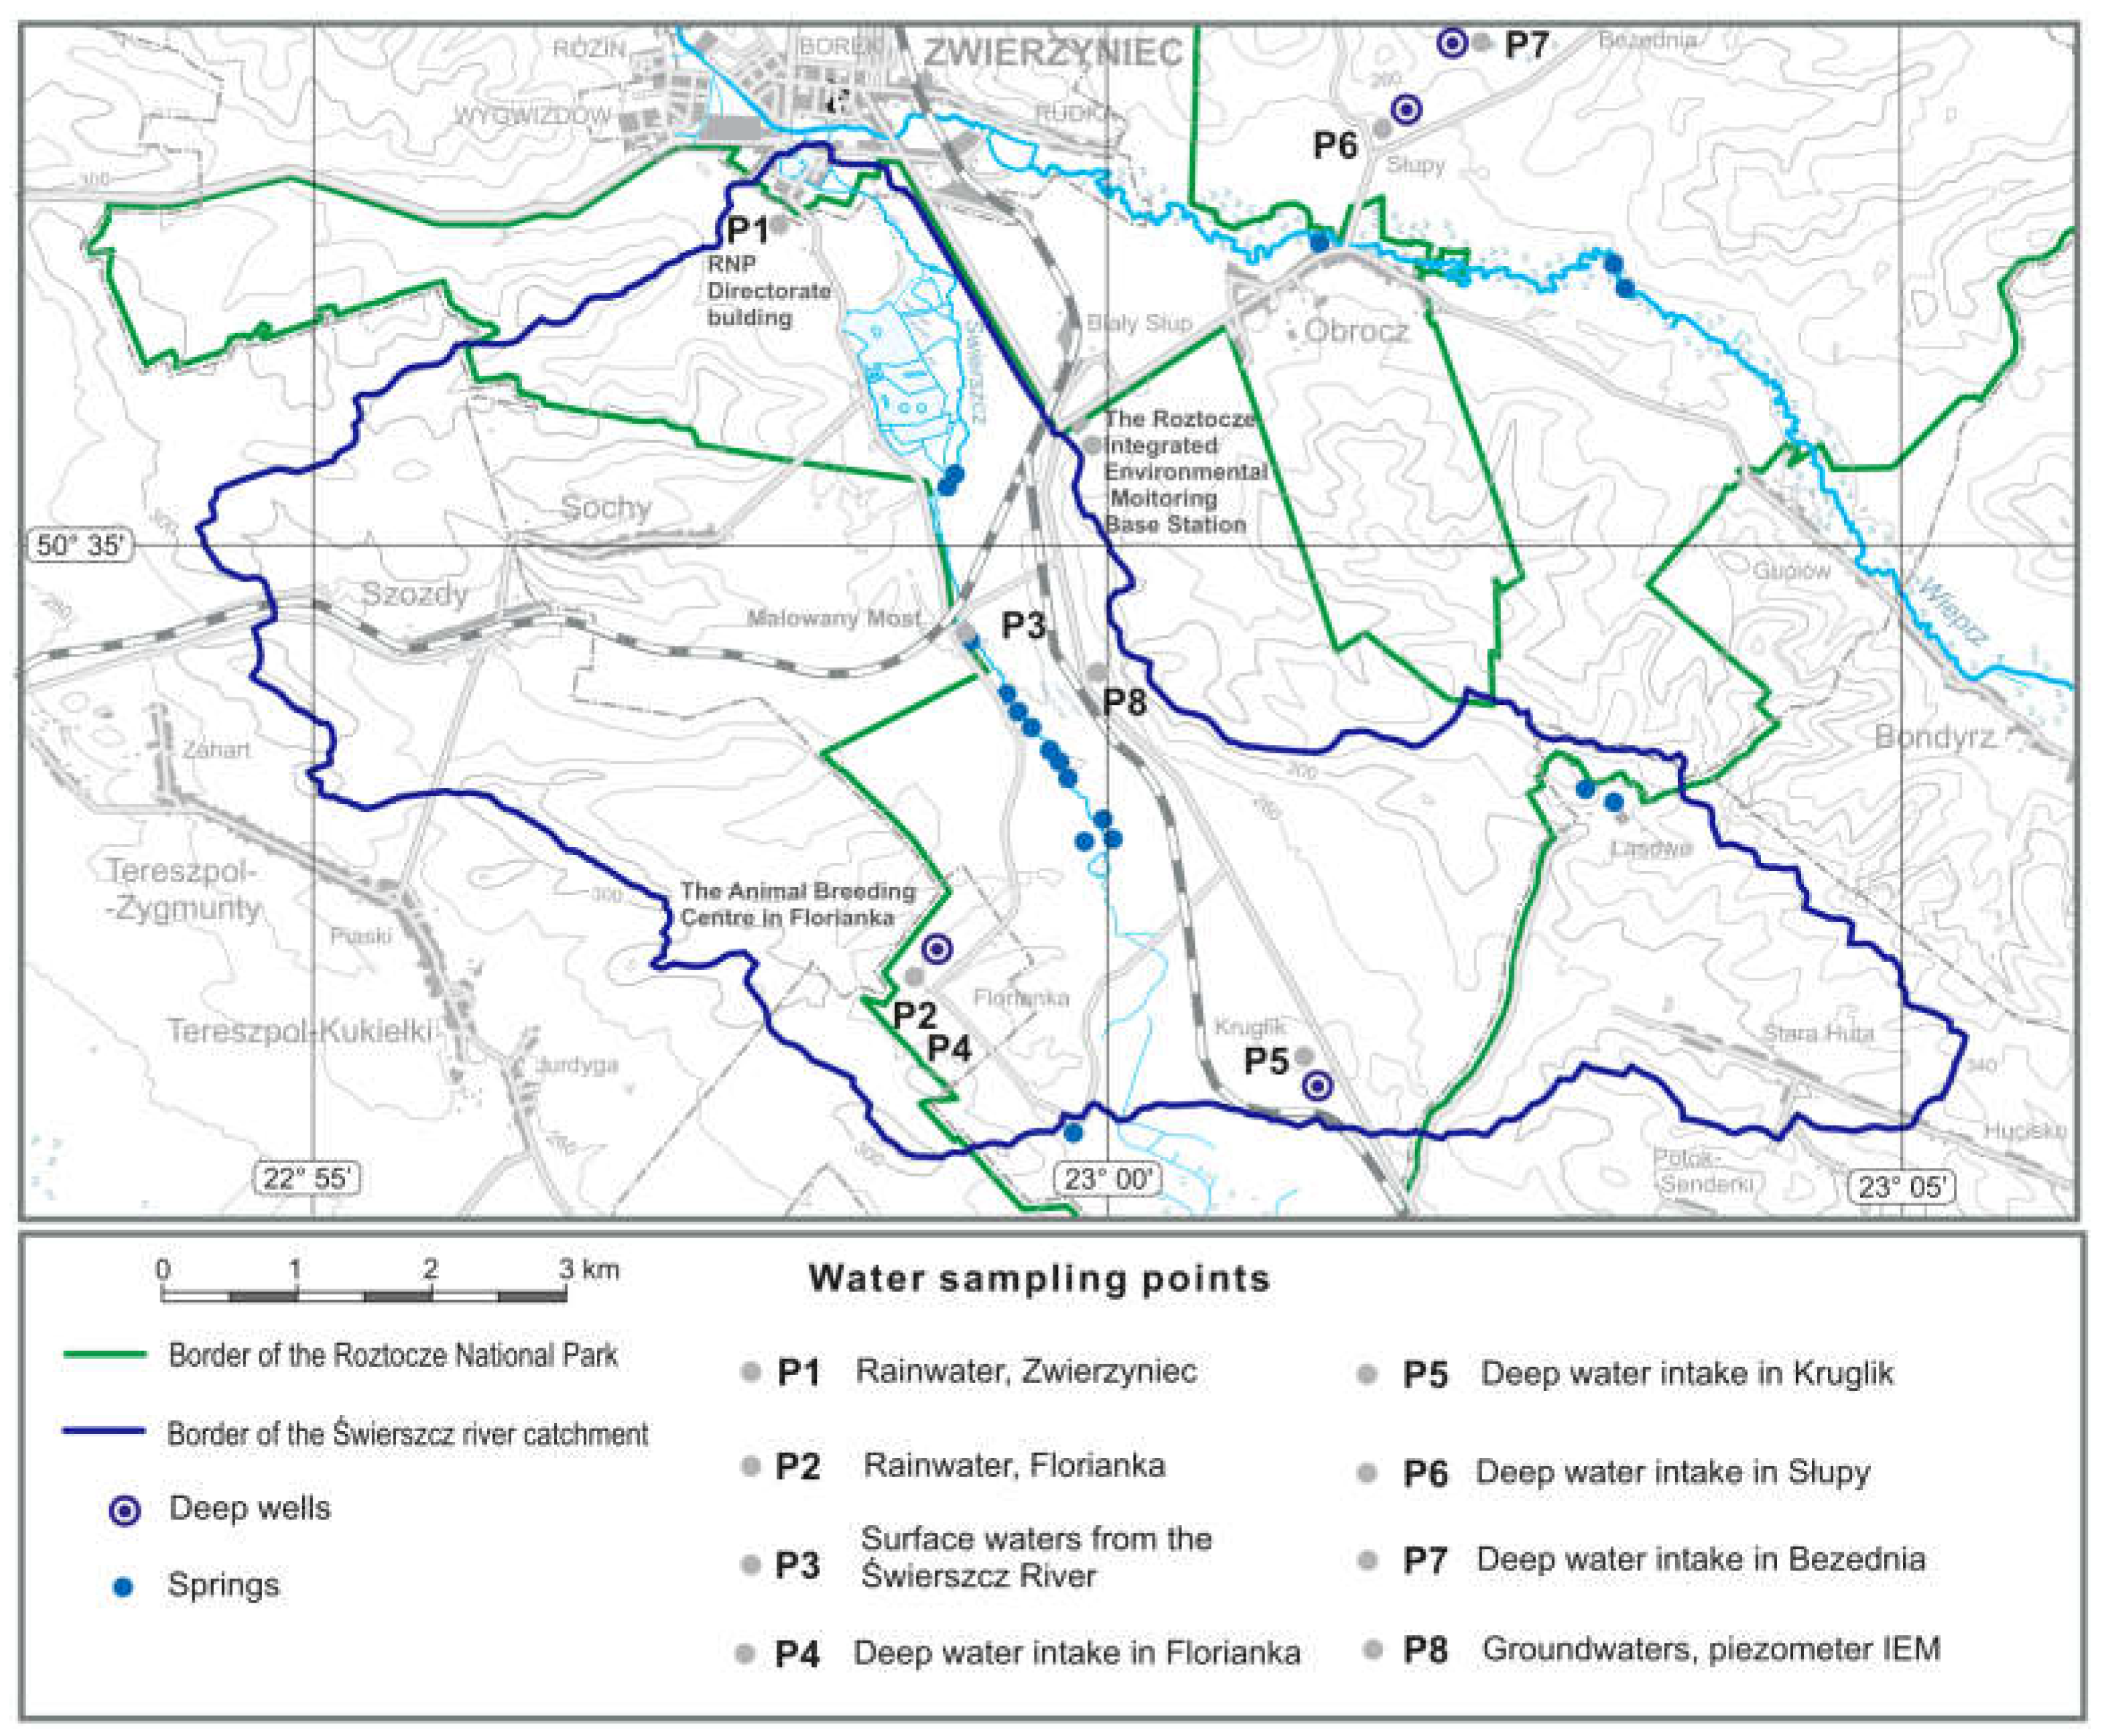
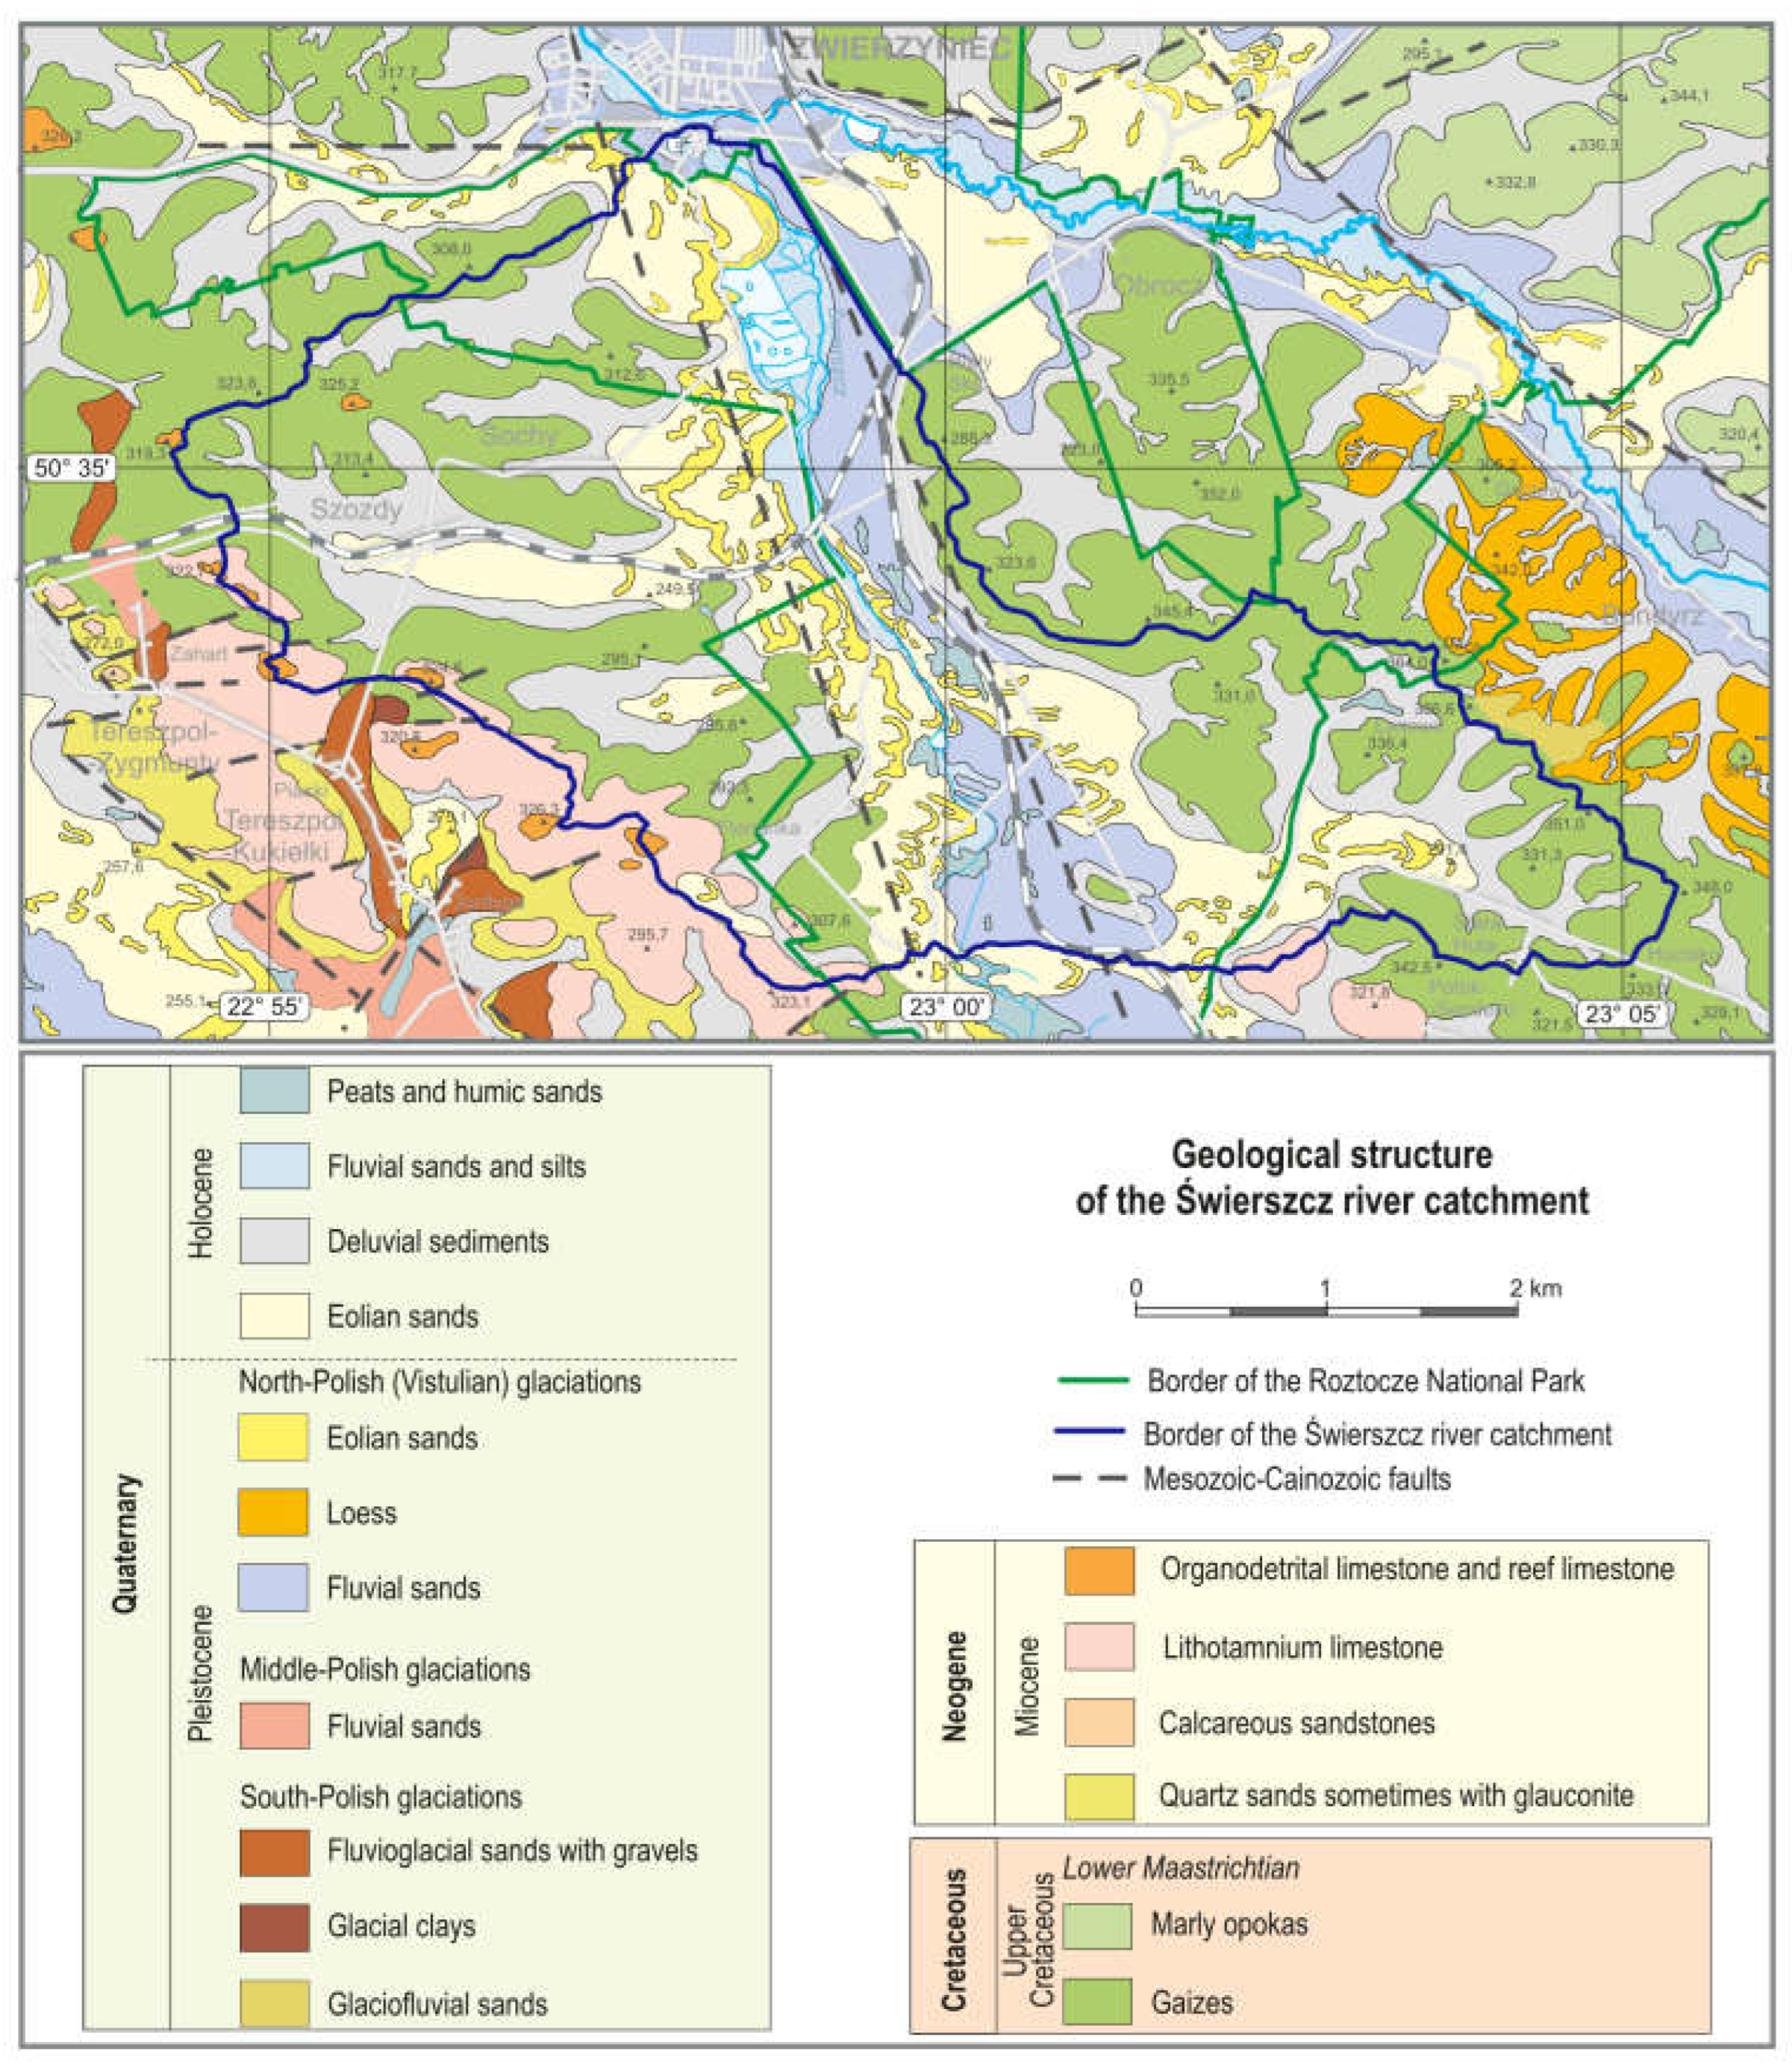
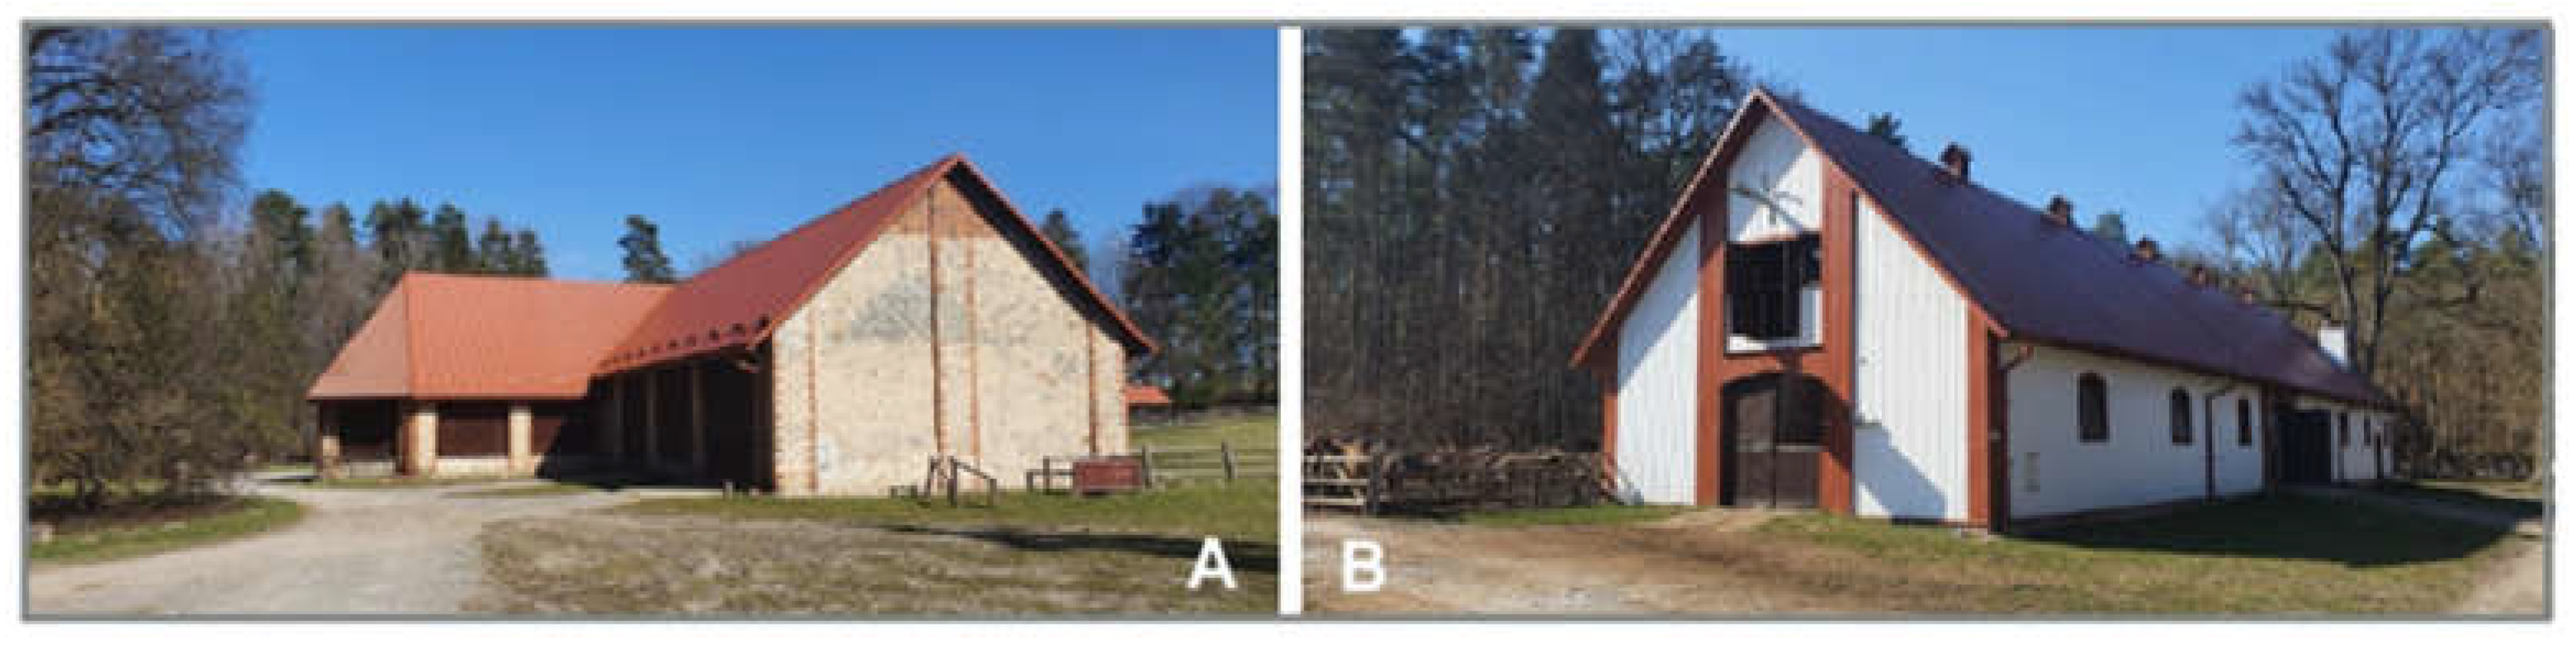
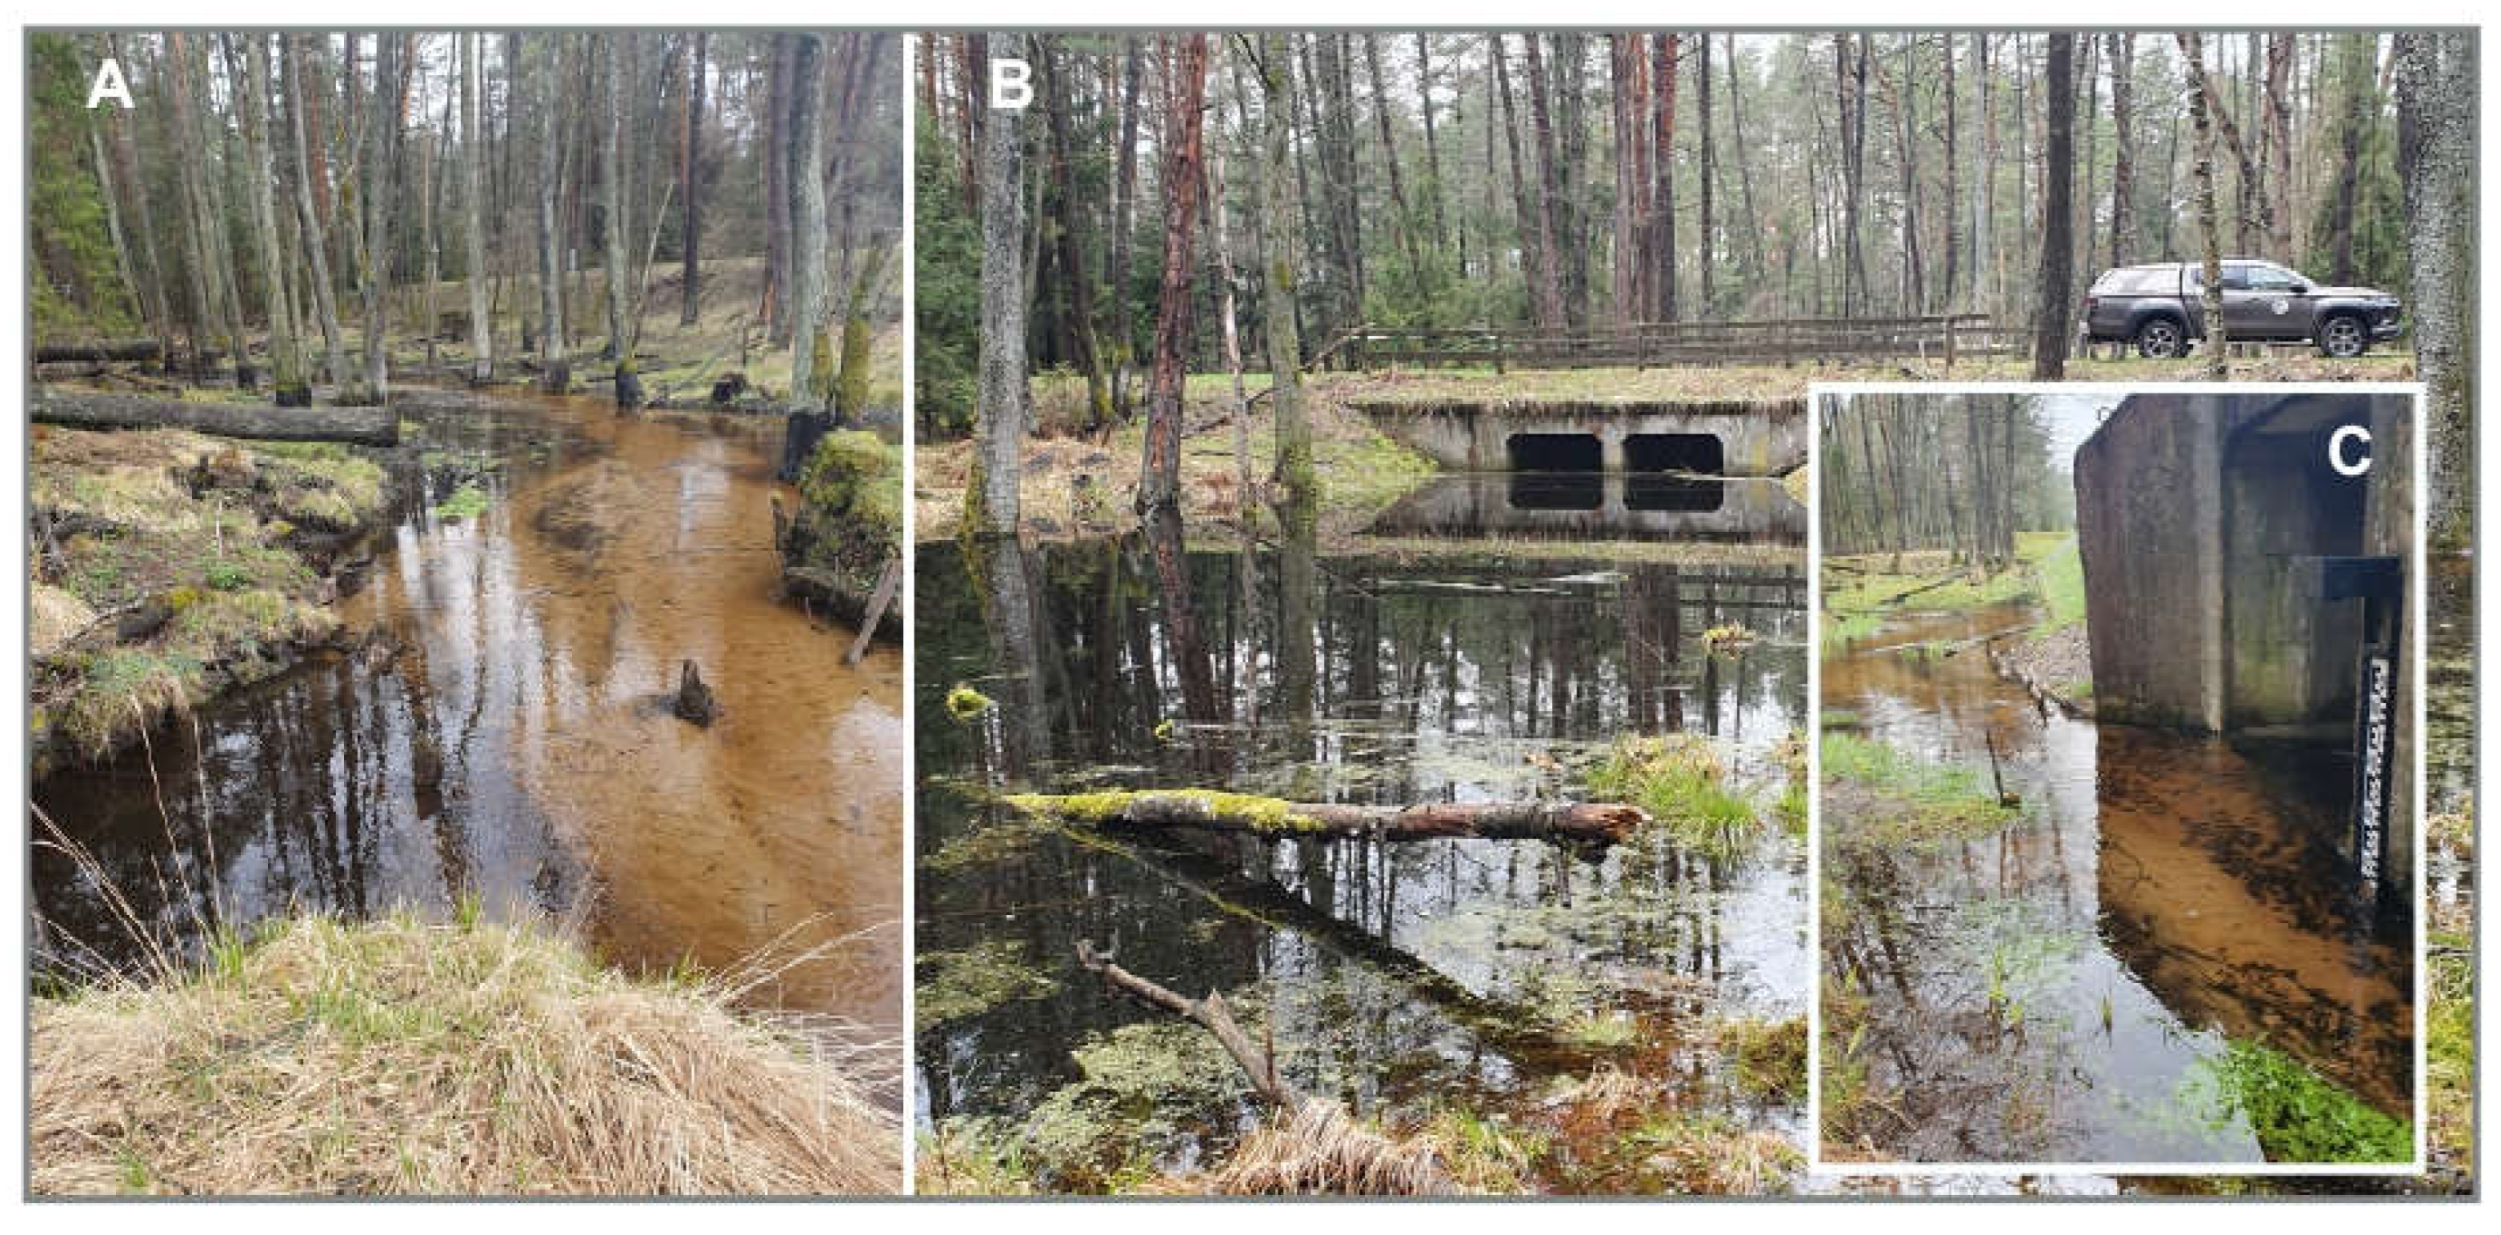
2.1. Characteristics of the Study Area

The RNP was established in 1974. It is located in Roztocze, which is a geographical region of south-eastern Poland straddling the border between Poland and Ukraine. The area consists of limestone hills that stretch from the Lublin Upland to Podolia. Roztocze is distinguished by its characteristic landscape, which is unique in Europe [20,21]. It is distinguished from neighbouring areas by its topography, geological structure, hydrological regime and climate. Moreover, the soils and vegetation are also different. Various types of forests make up as much as 95% of the RPN [22].
The RNP occupies an area of 8482.83 ha. Pursuant to the Nature Conservation Act, the main purpose of the park is to protect the region’s natural and cultural heritage and to provide a setting for nature education, tourism and scientific research. RNP employees also monitor the natural conditions and processes in the park, as well as the socio-economic phenomena in its buffer zone [23].
The RNP runs the Integrated Monitoring of the Natural Environment (IMNE) programme for the model catchment area of the River Świerszcz. In this area and its vicinity are located the rainwater, surface water and groundwater sampling points from which water was collected for the physicochemical, organoleptic and microbiological tests reported in the present study (Figure 1).
The catchment of the River Świerszcz is situated in the central part of the RNP and covers an area of 4651 ha. Forty percent (40%) of the catchment lies within the park. The catchment is a wooded space, with forests of various types occupying 64% of its area. The remaining part of the catchment is mainly covered by arable land, meadows and pastures belonging to the villages of Sochy, Szozdy, Stara Huta and Lasowe. The forest settlement of Florianka is dominated by meadows and pastures, which the park uses for breeding primitive breeds of cattle and sheep, and in particular, the Polish konik horse.
In the northern part of the catchment, in the lower section of the River Świerszcz are located Stawy Echo (Echo Ponds) (52 ha), which are fed by the river; a water axis with ponds; and the so-called “church” pond. The Świerszcz is an approx. 9 km long mid-forest river. It has its source in swamp forests and raised bogs at an altitude of approx. 250 m above sea level. The estuary to the River Wieprz is located at an altitude of 220 m above sea level [24].
The catchment of the River Świerszcz is part of two subregions: Roztocze Szczebrzeszyńskie and Roztocze Tomaszowskie [25]. The catchment is crossed from NE to SW by the valley of the Świerszcz stream and is lined with river and aeolian sands, forming dune ridges and dunes. The eastern and western parts of the catchment are covered with Upper Cretaceous gaizes, marls and opokas [26] (Figure 2).
The hydrological regime of the catchment of the River Świerszcz is influenced by climatic and terrain conditions. Climatic factors affect the amount of water introduced into the water cycle and the seasonal and annual variability of water supply. Terrain conditions, mainly the geological structure and relief, soil, vegetation and land use, determine surface water and groundwater retention and the amount of surface runoff. Simultaneously, these factors modify the annual and seasonal outflow rhythm resulting from the distribution of precipitation, infiltration and evapotranspiration.
According to Romer’s classification [27], the climate of Roztocze, where the RNP is situated, is a Central Uplands climate of the region of the Lublin–Lviv Uplands and Ridges (D4). It is a temperate transitional climate, which has a slightly higher proportion of continental features in relation to other regions of Poland [28]. The RNP is one of the coolest areas of the region, with an average annual air temperature of approx. 7.4–7.5 °C, annual precipitation typically ranges from 600 to 650 mm, and the annual average sunshine time ranges from 1550 to 1600 h. The RNP is characterised by a high topoclimatic diversity due to its varied topography. Large differences in elevation and sun exposure lead to differences in plant species composition, and consequently, to the density and height of the vegetation cover [28].
The surface water network in the RPN area is very sparse and covers only 52.6 hectares, which is only 0.62% of the total park area. This situation is mainly due to the high permeability of the bedrock and its water-holding capacity, which has the effect of retaining water from precipitation. In turn, groundwater is found in porous fractured marls, opokas and gaizes of the Upper Cretaceous, as well as in sandy sediments and Quaternary gravels, which fill buried river valleys. The waters of the Cretaceous layers mix with the waters filling the alluvia in the river valleys. The whole forms a circulation-and-drainage system called the Roztocze Water Level, which has large reserves of groundwater [29].
The flow of the River Świerszcz is variable and depends on the climatic and terrain conditions. In the recent hydrological years, variable river flows were recorded in the “Malowany most” (“Painted bridge”) profile (P3), which closes the 18.15 km2 catchment area of the River Świerszcz. Reports from the “Roztocze” Base Station of the IMNE (BS IMNE) show that the highest flows were recorded in 2013 at an average level of 0.95 m3/s. The maximum daily flow then was 0.575 m3/s, and the minimum one was 0.056 m3/s. The lowest flows were registered in the hydrological year 2019/2020, when, after a series of dry and hot years, the supply of the stream with deep waters of the Cretaceous level clearly decreased. The average annual flow was only 0.007 m3/s, with a maximum of 0.030 m3/s and a minimum, similar to the year 2019, below 0.002 m3/s.
All villages in the catchment of the River Świerszcz are connected to a mains water supply network, with the exception of the settlements of Florianka and Lasowe, which are both located in a forest. The Florianka settlement where The Animal Breeding Center is located has its own water intake and water supply system. Wastewater is discharged to a hybrid constructed wetland [30]. The sanitation coverage level of the villages of the catchment area of the River Świerszcz is low. The town of Zwierzyniec and the village of Sochy have their own sewage systems. Some households are fitted with domestic wastewater treatment plants. However, most households discharge wastewater into septic tanks.
The ongoing climate change and the increasing demand for water lead, among other issues, to the lowering of the groundwater level and a decrease in well efficiency. This phenomenon was observed in Florianka, which is a unique settlement on the map of the RNP. Florianka is home to the Animal Breeding Center devoted to the conservation of the Polish konik horse, which is the official symbol of the park, and primitive cattle and sheep breeds: white-back cows, red cows and Uhruska sheep. There is also a field base for educational and tourist activities called Izba Leśna (Forest Room). Approx. 35,000 tourists visit this place every year. In the lower section of the River Świerszcz, there is a “sanctuary” of the Polish konik horse. A herd of up to 25 horses lives here throughout the year, grazing in an area of approx. 260 ha.
One of the measures that can be taken to counteract the effects of climate change is rainwater harvesting and use, which can secure access to fresh water. The idea of the RWHS, taking into account various ways of using rainwater, is schematically presented in Figure 3. Some of the applications require the maintenance of appropriate water quality. Therefore, this study was undertaken to determine the compliance of rainwater in the place of the planned RWHS with applicable legal standards. On the other hand, data on the amount of rainwater that can be harvested and put to use in the RNP is provided in a paper by Grabowski et al. [31].

2.2. Study Methods and Statistical Analysis

Water quality tests for this study were carried out in the RNP in the years 2021–2022. They included the determination of selected microbiological, organoleptic and physicochemical properties of rainwater, surface water and groundwater. The analysis covered (1) P1—the quality of rainwater collected from the roofs of two farm buildings located close to the RNP Directorate building in Zwierzyniec, which was stored in a concrete tank with a capacity of 20 m3 (Figure 4); (2) P2—the quality of rainwater harvested from two roofs of farm buildings located in the Animal Breeding Centre in Florianka (Figure 5); (3) P3—the quality of surface water sampled from the River Świerszcz in the so-called “Malowany most” profile (Figure 6); and (4) P4, P5, P6 and P7—the quality of groundwater sampled from deep wells in the RNP’s forest settlements of Florianka, Kruglik, Słupy and Bezednia, respectively (Figure 1).
During the study period, the rainwater and surface water quality were tested in ten measurement series each. The quality of the groundwater (P4–P7) from deep wells was tested only once, in April 2021. In Poland, pursuant to [32], the chemical status of groundwater bodies is to be tested at least once during a 6-year cycle of updating the water management plan for catchment areas.
Microbiological tests included the determination of the total microbial counts at 22 and 36 °C, as well as the counts of the following bacteria: coliforms, Escherichia coli, intestinal enterococci and Pseudomonas aeruginosa. Organoleptic tests were run to determine the presence of a foreign odour and the threshold odour number (TON). Physical and chemical tests included turbidity, colour, pH, electrical conductivity (specific conductance) at 25 °C, ammonium ion, nitrates, nitrates and total hardness (CaCO3), as well as the concentrations of manganese, iron and chlorides.
The water quality tests were carried out in accordance with the Polish standards in the accredited Research Services Laboratory of the Lublin Cooperative of Dairy Services (Laboratorium Usług Badawczych Lubelskiej Spółdzielni Usług Mleczarskich) in Lublin. The list of standards and test procedures is given in Table 1.
Basic descriptive statistics were calculated for the test results: minimum, maximum, mean, median, standard deviation, coefficient of variation and variation group. Variation groups were determined on the basis of Mucha’s classification of variation [33]. The distributions of the values obtained in the microbiological and physicochemical tests are presented in box plots for the following four groups: rainwater from the Directorate building (P1), rainwater from the roof of the building in Florianka (P2), water from the River Świerszcz (P3) and groundwater from wells (P4–P7). Since the data were not normally distributed (as revealed using a Shapiro–Wilk test), the non-parametric Kruskal–Wallis test was used to compare the differences in the distributions of the values of the test parameters between groups [34]. When differences in distributions were found, post hoc comparisons of the mean ranks of all pairs of groups were performed [35]. Statistical analysis for the water quality parameters was carried out using Statistica v. 14.0. The significance level α = 0.05 was assumed in the statistical tests.
The quality test results for rainwater, surface water and groundwater were compared with the standards stipulated in the Polish legal acts defining the suitability of water for drinking [36] and the purity classes of surface water [37] and groundwater [32] (Table 2). The standards for drinking water do not specify reference values for the total microbial count at 22 °C and coliforms.

3. Results

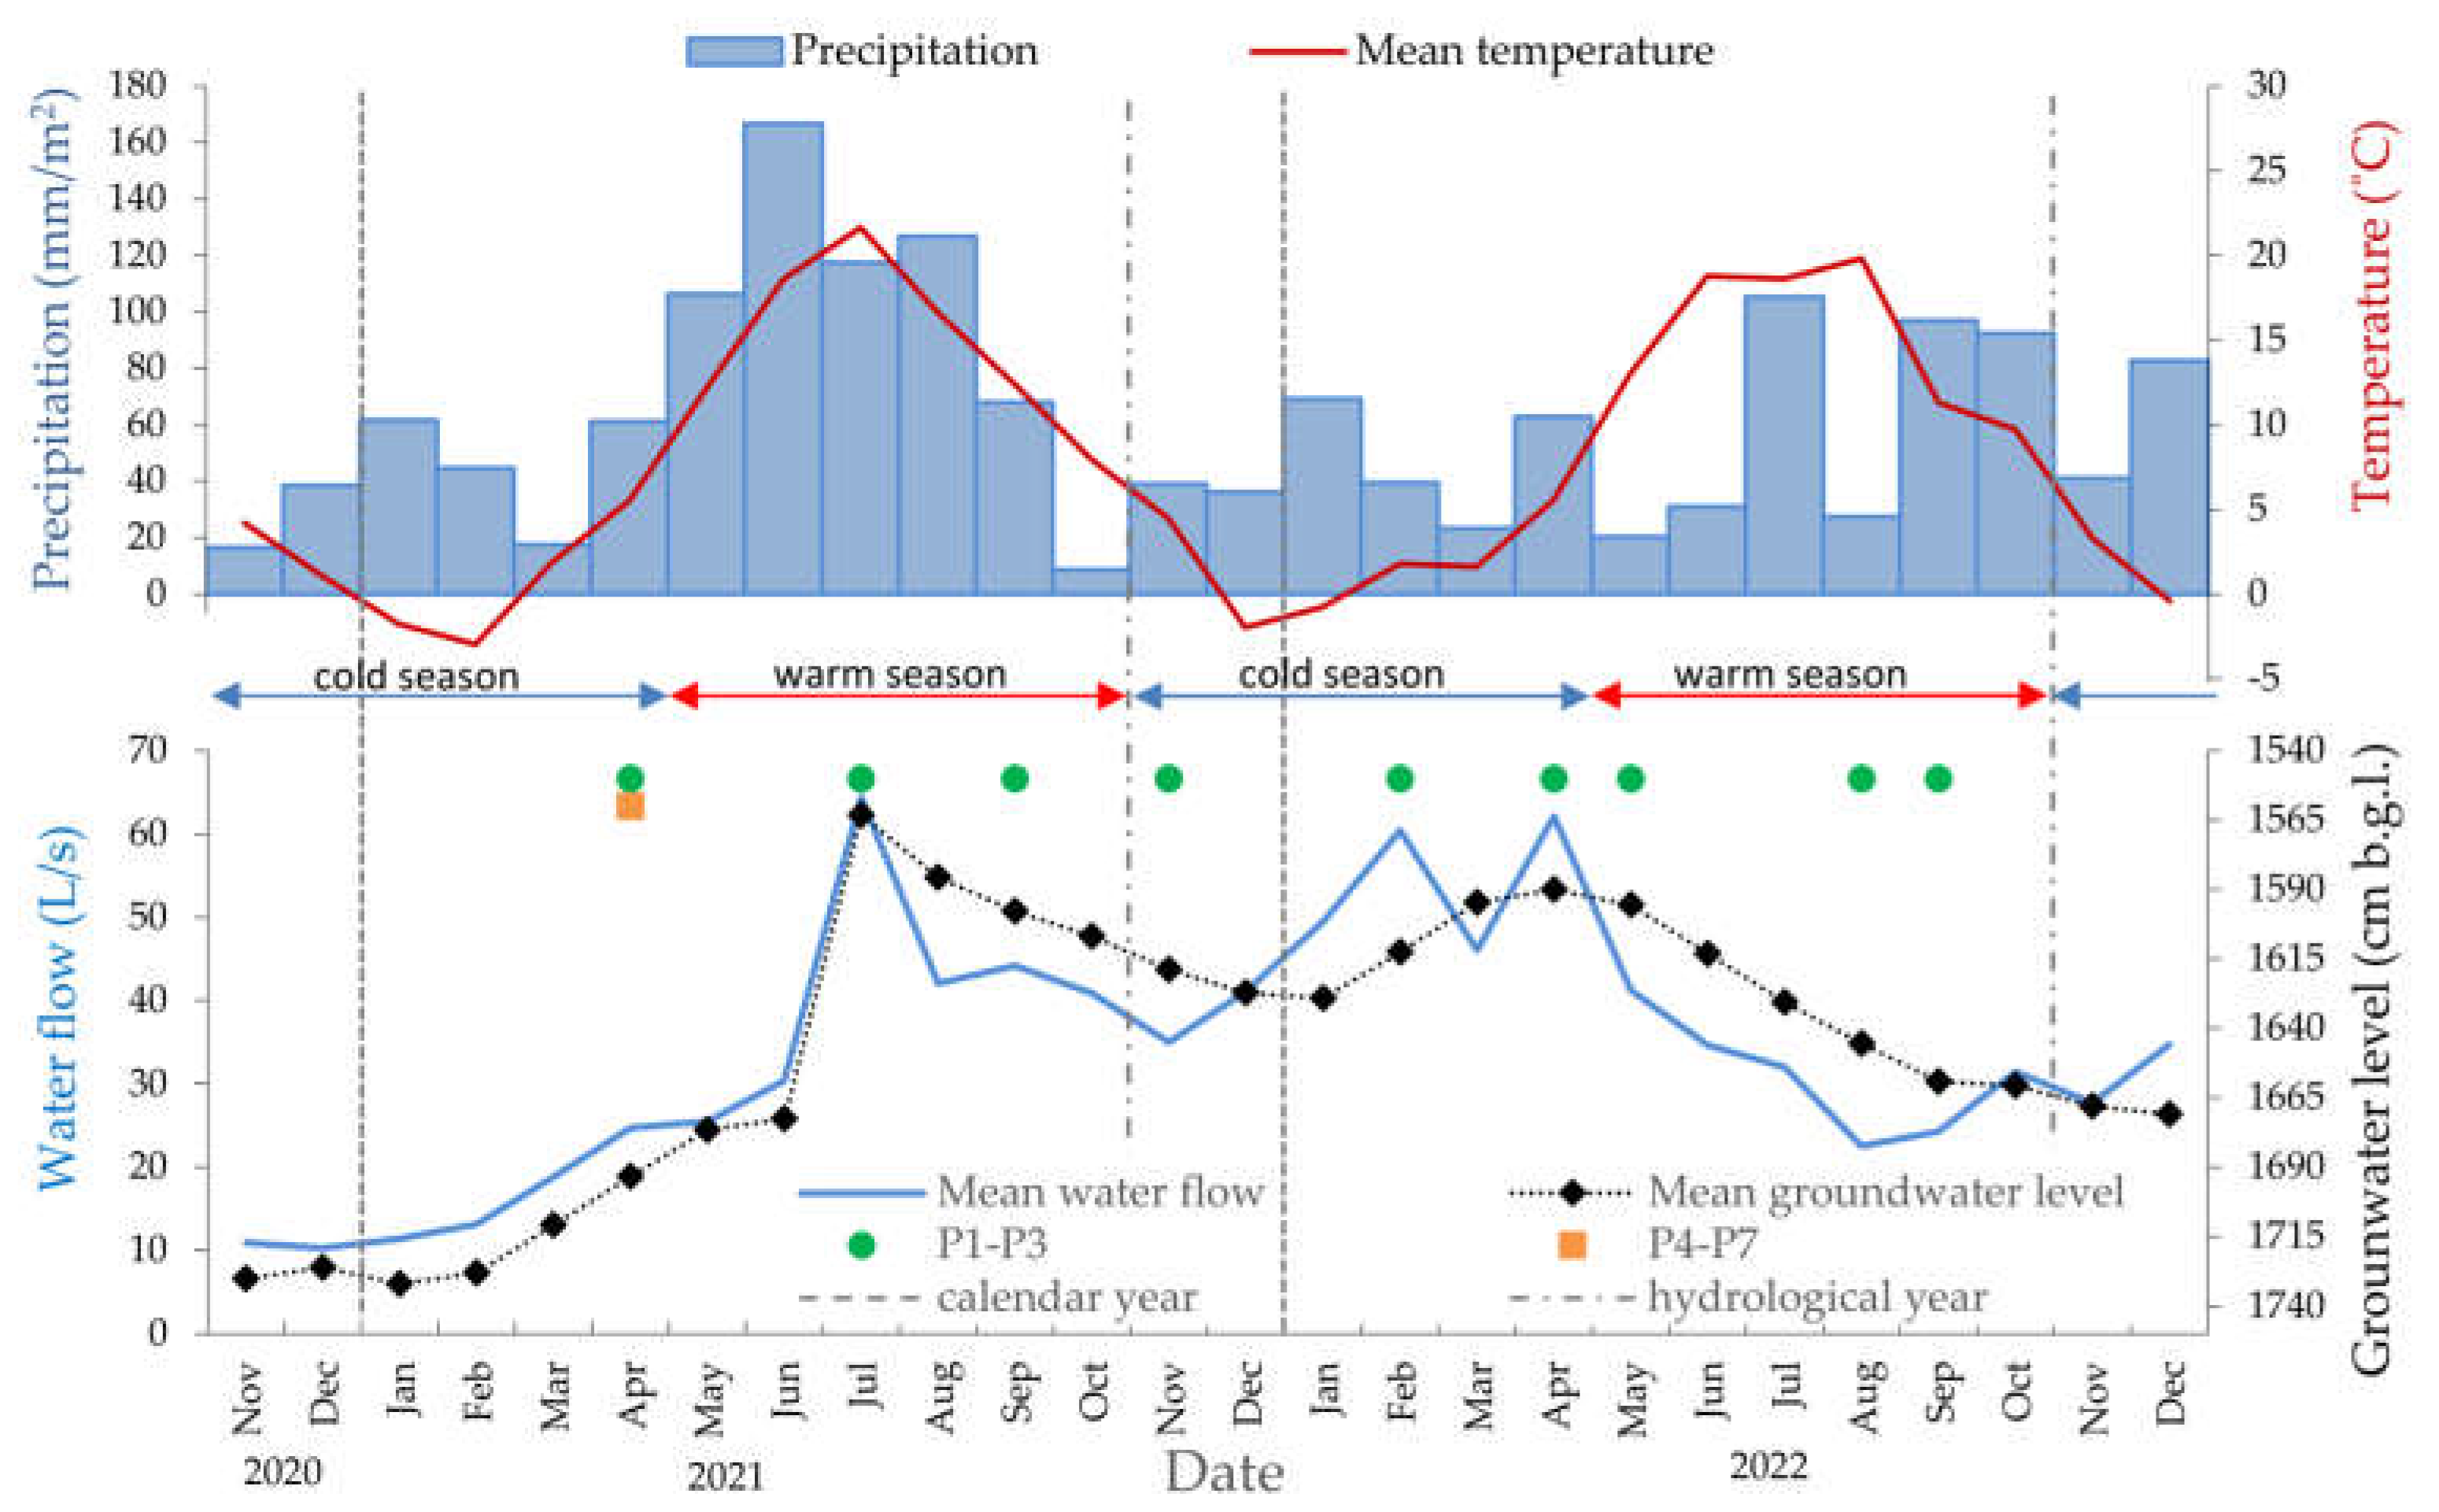
3.1. Hydrometeorological Conditions in the Catchment of the River Świerszcz

As stated in the previous section, the quality tests of various types of water from the catchment of the River Świerszcz were carried out in the years 2021–2022. In order to determine the quantitative background for the waters tested, we also analysed the meteorological (temperatures and precipitation) and hydrological (water flow and groundwater levels) conditions in the catchment of the River Świerszcz recorded for the same period (Figure 7).
Since groundwater and surface water reserves are strictly dependent on the temperatures and precipitation levels in a given area over a longer period, meteorological data from the years 2021–2022 were compared with data for two decades collected between 2001 and 2020, as reported in a paper by Grabowski et al. [31]. Hydrological data (water flows of the River Świerszcz and groundwater table levels), on the other hand, were compared with data for the years 2012–2020 contained in the reports of the RNP’s Roztocze BS IMNE.

3.1.1. Air Temperature

According to the measurements of the Roztocze BS IMNE, the average annual air temperatures in the hydrological years 2020/2021 and 2021/2022 were 8.1 °C and 8.5 °C, respectively, which were similar to the average of 8.3 °C for the years 2001–2020 [31]. In the hydrological years 2020/2021 and 2021/2022, the highest air temperatures were recorded in the summer months of July 2021 (21.7 °C) and August 2022 (19.8 °C) (Figure 7). These temperatures were higher than the average July and August temperatures in the years 2001–2020, which were 19.3 and 18.4 °C, respectively [31]. The lowest temperatures in the hydrological years 2020/2021 and 2021/2022 were registered in the winter months of February (−3 °C) and December (−2 °C), respectively (Figure 7). To compare, the lowest temperatures in the years 2001–2020 were observed in January and February and averaged −2.7 and −1.5 °C, respectively [31].

3.1.2. Precipitation

According to the measurements of the Roztocze BS IMNE, in the hydrological years 2020/2021 and 2021/2022, the total annual precipitation in the study area was 839 mm and 744 mm, respectively. These results indicate that these years were quite wet, as the recorded total precipitation levels were considerably higher than the average total annual precipitation for the years 2001–2020, which was 693 mm [31]. In the cold season (November–April) of the hydrological year 2020/2021, the study area had 245.8 mm of rain/snow, which accounted for 29.3% of total annual precipitation. In the warm season (May–October), there was 593.6 mm of rain, which was 70.7% of the total annual precipitation. In the hydrological year 2021/2022, the precipitation in the cold season was 370.4 mm (49.8% of total annual precipitation). On the other hand, the precipitation level in the warm season was comparable to the previous hydrological year at 373.3 mm, which was 50.2% of total annual precipitation.
In the hydrological year 2020/2021, the highest precipitation level was recorded in the spring and summer months (May–August). The water demand in the RNP was also the highest during this period. The lowest rain/snowfall was recorded in the autumn and winter months (October to March) (Figure 7). As the data show, the distribution of precipitation in the hydrological year 2020/2021 was similar to that observed in the years 2001–2020 [32]; however, the total precipitation in the spring and summer months of 2020/2021 was much higher than in the 20-year period. A different situation was observed in 2021/2022, with similar total monthly precipitation levels across the year (Figure 7), which was favourable from the point of view of nature. Although the total rainfall in July 2022 was high at 105 mm, June and August of that year received only 31 and 27 mm of rain, respectively, making it a very dry summer. Furthermore, the possibility of harvesting and storing rainwater in this period was very limited. Fortunately, higher precipitation levels in the autumn and winter months of the hydrological year 2021/2022 recharged the groundwater table and increased the flow rates of the River Świerszcz (Figure 7).
The study by Grabowski and colleagues [31] indicated that the two decades between 2001 and 2020 were characterised by high dynamics of often anomalous weather phenomena, especially with regard to the average annual air temperatures and annual rainfall, which undoubtedly had an impact on the levels of groundwater and flows in the River Świerszcz in the years 2021–2022.

3.1.3. Water Flows in the River Świerszcz

To analyse the changes in the amount of surface water in the catchment area of the River Świerszcz in the years 2021–2022, the water levels and river flows were measured at the Painted Bridge measuring point (P3) at the outlet of the 18.15 km2 catchment. The seasonal outflow rhythm of the River Świerszcz during the study period was characteristic of rain-fed rivers. In the hydrological year 2020/2021, the lowest average monthly flows were recorded from November to January, and the highest ones were measured in July (Figure 7). The substantial differences in average monthly flows were the result of extremely high precipitation in the summer. In 2021, during the 10 days between 23 June and 3 July, the area received 253 mm of rain, which was 35% of the average annual precipitation. After these heavy rainfalls, there was a clear increase in supply from the main groundwater aquifer, and outflow from the upper peat bog part of the catchment of the River Świerszcz was renewed. In the warm season of 2021, river flow was similar to the long-term average at 41.10 L/s. In the cold season, it was 31.03 L/s. In the hydrological year 2021/2022, the water flow distribution for the River Świerszcz was completely different. In the warm season, the river flow was 31.3 L/s and was lower than the flow in the cold season when it was 46.7 L/s. This was due to the more even distribution of precipitation throughout the year, as mentioned earlier. In the hydrological year 2021/2022, high water flows were observed in winter and spring. Flows in February and April were 60.42 and 62.11 L/s, respectively (Figure 7). Despite high rainfall in the summer, the average flow of the River Świerszcz in the hydrological year 2020/2021 was 27.99 L/s. In the next hydrological year 2021/2022, the river’s average annual flow increased to 40.03 L/s. This value was only slightly lower than the river’s average flow for the 20 years between 2012–2020, which was 42 L/s.

3.1.4. Fluctuations in the Groundwater Table in the Catchment Area of the River Świerszcz

At the beginning of the hydrological year 2020/2021, the depth of the groundwater table in the catchment area of the River Świerszcz was −1725 cm below ground level. In January 2021, the groundwater table dropped slightly to −1733 cm below ground level to then rise again starting from March 2021. Over the next three months, water levels rose quite quickly at about 20 cm per month. In June 2021, the water table reached the level of −1675 cm below ground level. Very heavy rains at the turn of June and July 2021 contributed to the rapid rise of the water table by as much as 130 cm to its maximum level in the hydrological year 2020/2021. On 11 July 2021, the depth of the water table was −1544 cm below ground level. In the following months of the study, the groundwater level fluctuated slightly, falling to −1613 cm below ground level at the end of October 2021. The annual amplitude of groundwater table fluctuations in the hydrological year 2020/2021 was very high at 190 cm. The average annual water table level in that year was 16 cm lower than the average for the years 2012–2020. It is worth noting that the depth of the water table at the end of the hydrological year 2020/2021 was as much as 112 cm higher than at its beginning. This demonstrates that high precipitation increased the amount of groundwater reserves in the catchment area of the River Świerszcz.
In the hydrological year 2021/2022, the annual amplitude of the groundwater table was lower at 81 cm. From January to April 2022, a slow rise in the water table was observed. In April, the water level reached a maximum of −1590 cm below ground level. From May 2022, a slow drop in the groundwater level was observed to −1671 cm below ground level in December.
The data reported above show that temperature and precipitation had a significant impact on the fluctuations in the groundwater table and water flows in the River Świerszcz in the RNP. A slightly delayed response of the groundwater table to the high amounts of rainfall was observed in the summer months of 2021. It can also be claimed that the uniform precipitation throughout 2022 was reflected in the smaller fluctuations of the groundwater table and water flows in the River Świerszcz. Owing to the relatively high precipitation in 2021/2022, the water level of the Cretaceous layer in the park was replenished.

3.2. The Quality of Rainwater Compared with the Quality of Surface Water and Groundwater and the Possibility of their Use

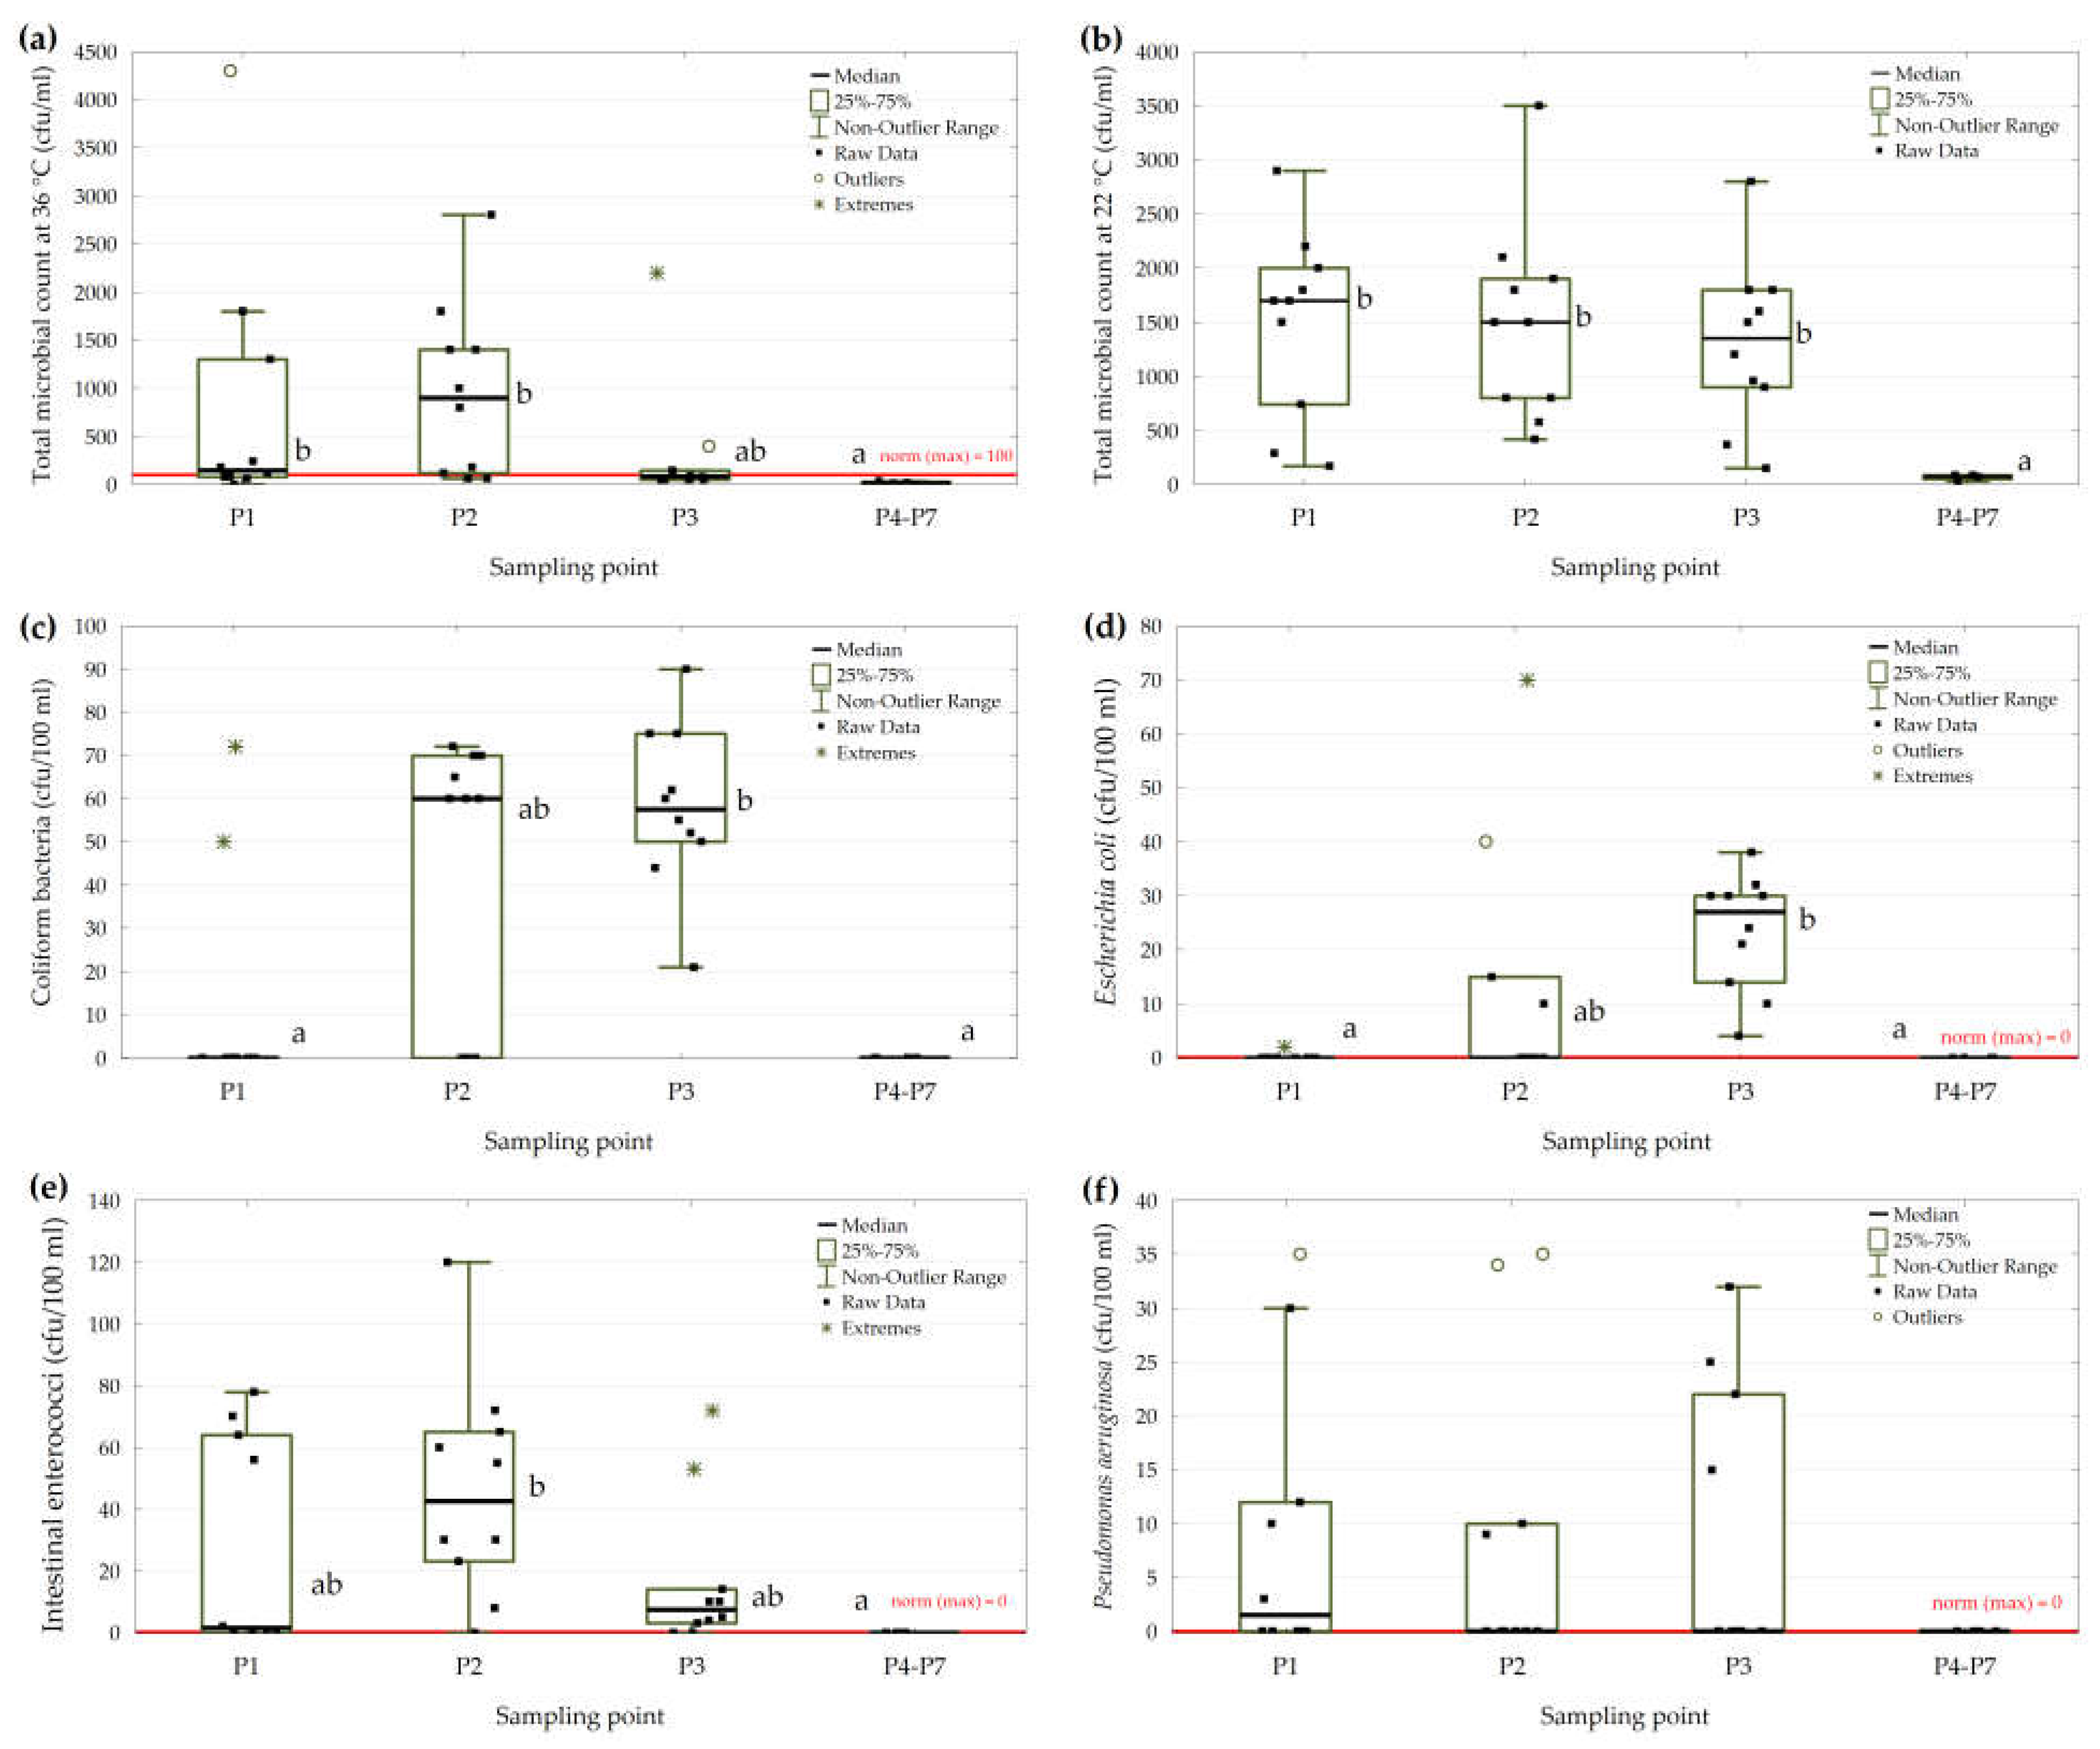
3.2.1. Analysis of Selected Microbiological Indicators

Table 3 compares the descriptive statistics of the microbiological parameters of rainwater with those of flowing water and groundwater. The distributions of the obtained values of the microbiological test for the analysed types of water are presented in box plots (Figure 8), together with information on the statistical differences.
Statistically significant differences were found in the distribution of the total microbial counts at 36 °C (Kruskal–Wallis H = 12.38, p = 0.006). The rainwater collected at points P1 and P2 contained significantly higher bacterial counts than water collected from deep wells, but no significant differences were found in relation to the flowing waters at P3 (Figure 8a). The rainwater sampled at P1 and P2 showed 40% and 20% compliance with drinking water standards, respectively. The average total microbial count at 36 °C in rainwater (P1 and P2) was more than 8 times higher than the limit value stipulated for drinking water (Table 1, Table 2 and Table 3) [36]. This contamination of rainwater was likely to have been influenced by bird droppings found on the surfaces of the roofs from which rainwater was harvested. A much lower average total microbial count at 36 °C was determined for water from the River Świerszcz, which, however, was also more than 3 times higher than the drinking water limit (Table 2 and Table 3) [36]. In the case of rainwater sampled at point P1 and river water (P3), the variation in total bacterial counts at 36 °C (Table 3) was extremely high. The only type of water in which the drinking water limit was not exceeded was the deep well water (P4–P7) [36]. However, even here, small numbers of microorganisms were present at 36 °C (Table 3).
Statistically significant differences were found in the distribution of the total microbial counts at 22 °C (Kruskal–Wallis H = 10.67, p = 0.014). The rainwater collected at points P1 and P2 contained significantly more bacteria than the water sampled from deep wells, but no significant differences were found relative to the flowing water at P3 (Figure 8b).
Statistically significant differences were observed in the distribution of coliform counts (Kruskal–Wallis H = 14.33, p = 0.003). The rainwater collected at points P1 and P2 did not contain significantly higher numbers of bacteria compared with the well water. However, there were fewer bacteria in the rainwater sampled at point P1 than in the water collected from the River Świerszcz (P3) (Figure 8c). Water from the deep wells (P4–P7) was the only type that did not contain coliform bacteria.
Relationships similar to those for coliform counts were found for Escherichia coli (Kruskal–Wallis H = 19.06, p < 0.001) (Figure 8d). Again, the deep waters (P4–P7) were the only ones to comply with the drinking water standard [36]. In rainwater collected at sampling point P1, Escherichia coli was found only once, namely, in July 2021, and its count exceeded the drinking water limit (Table 3). Compliance with drinking water standards for rainwater was 90% and 40% for P1 and P2, respectively. The largest counts of Escherichia coli were found in water coming from the River Świerszcz.
The types of water we tested differed statistically in the distribution of intestinal enterococci counts (Kruskal–Wallis H = 9.46, p = 0.024). Significantly higher numbers of these bacteria were found in the rainwater collected at point P2 than in the water collected from the deep wells (P4–P7). By contrast, there were no significant differences in the number of intestinal enterococci in water sampled at points P1 and P3 (Figure 8e). Compliance with drinking water standards for rainwater was 40% and 10% for P1 and P2, respectively. Samples of deep well water (P4–P7) were the only ones in which the drinking water standard stipulated for intestinal enterococci was not exceeded [36].
There were no statistically significant differences in the distribution of Pseudomonas aeruginosa counts between the tested waters (Kruskal–Wallis H = 2.636, p = 0.451) (Figure 8f). However, both rainwater and river water contained small amounts of these bacteria (Table 3). The groundwater samples (P4–P7) were the only ones in which the permissible limit of Pseudomonas aeruginosa in drinking water was not exceeded [36]. Compliance with drinking water standards for rainwater was 50% and 60% for P1 and P2, respectively.

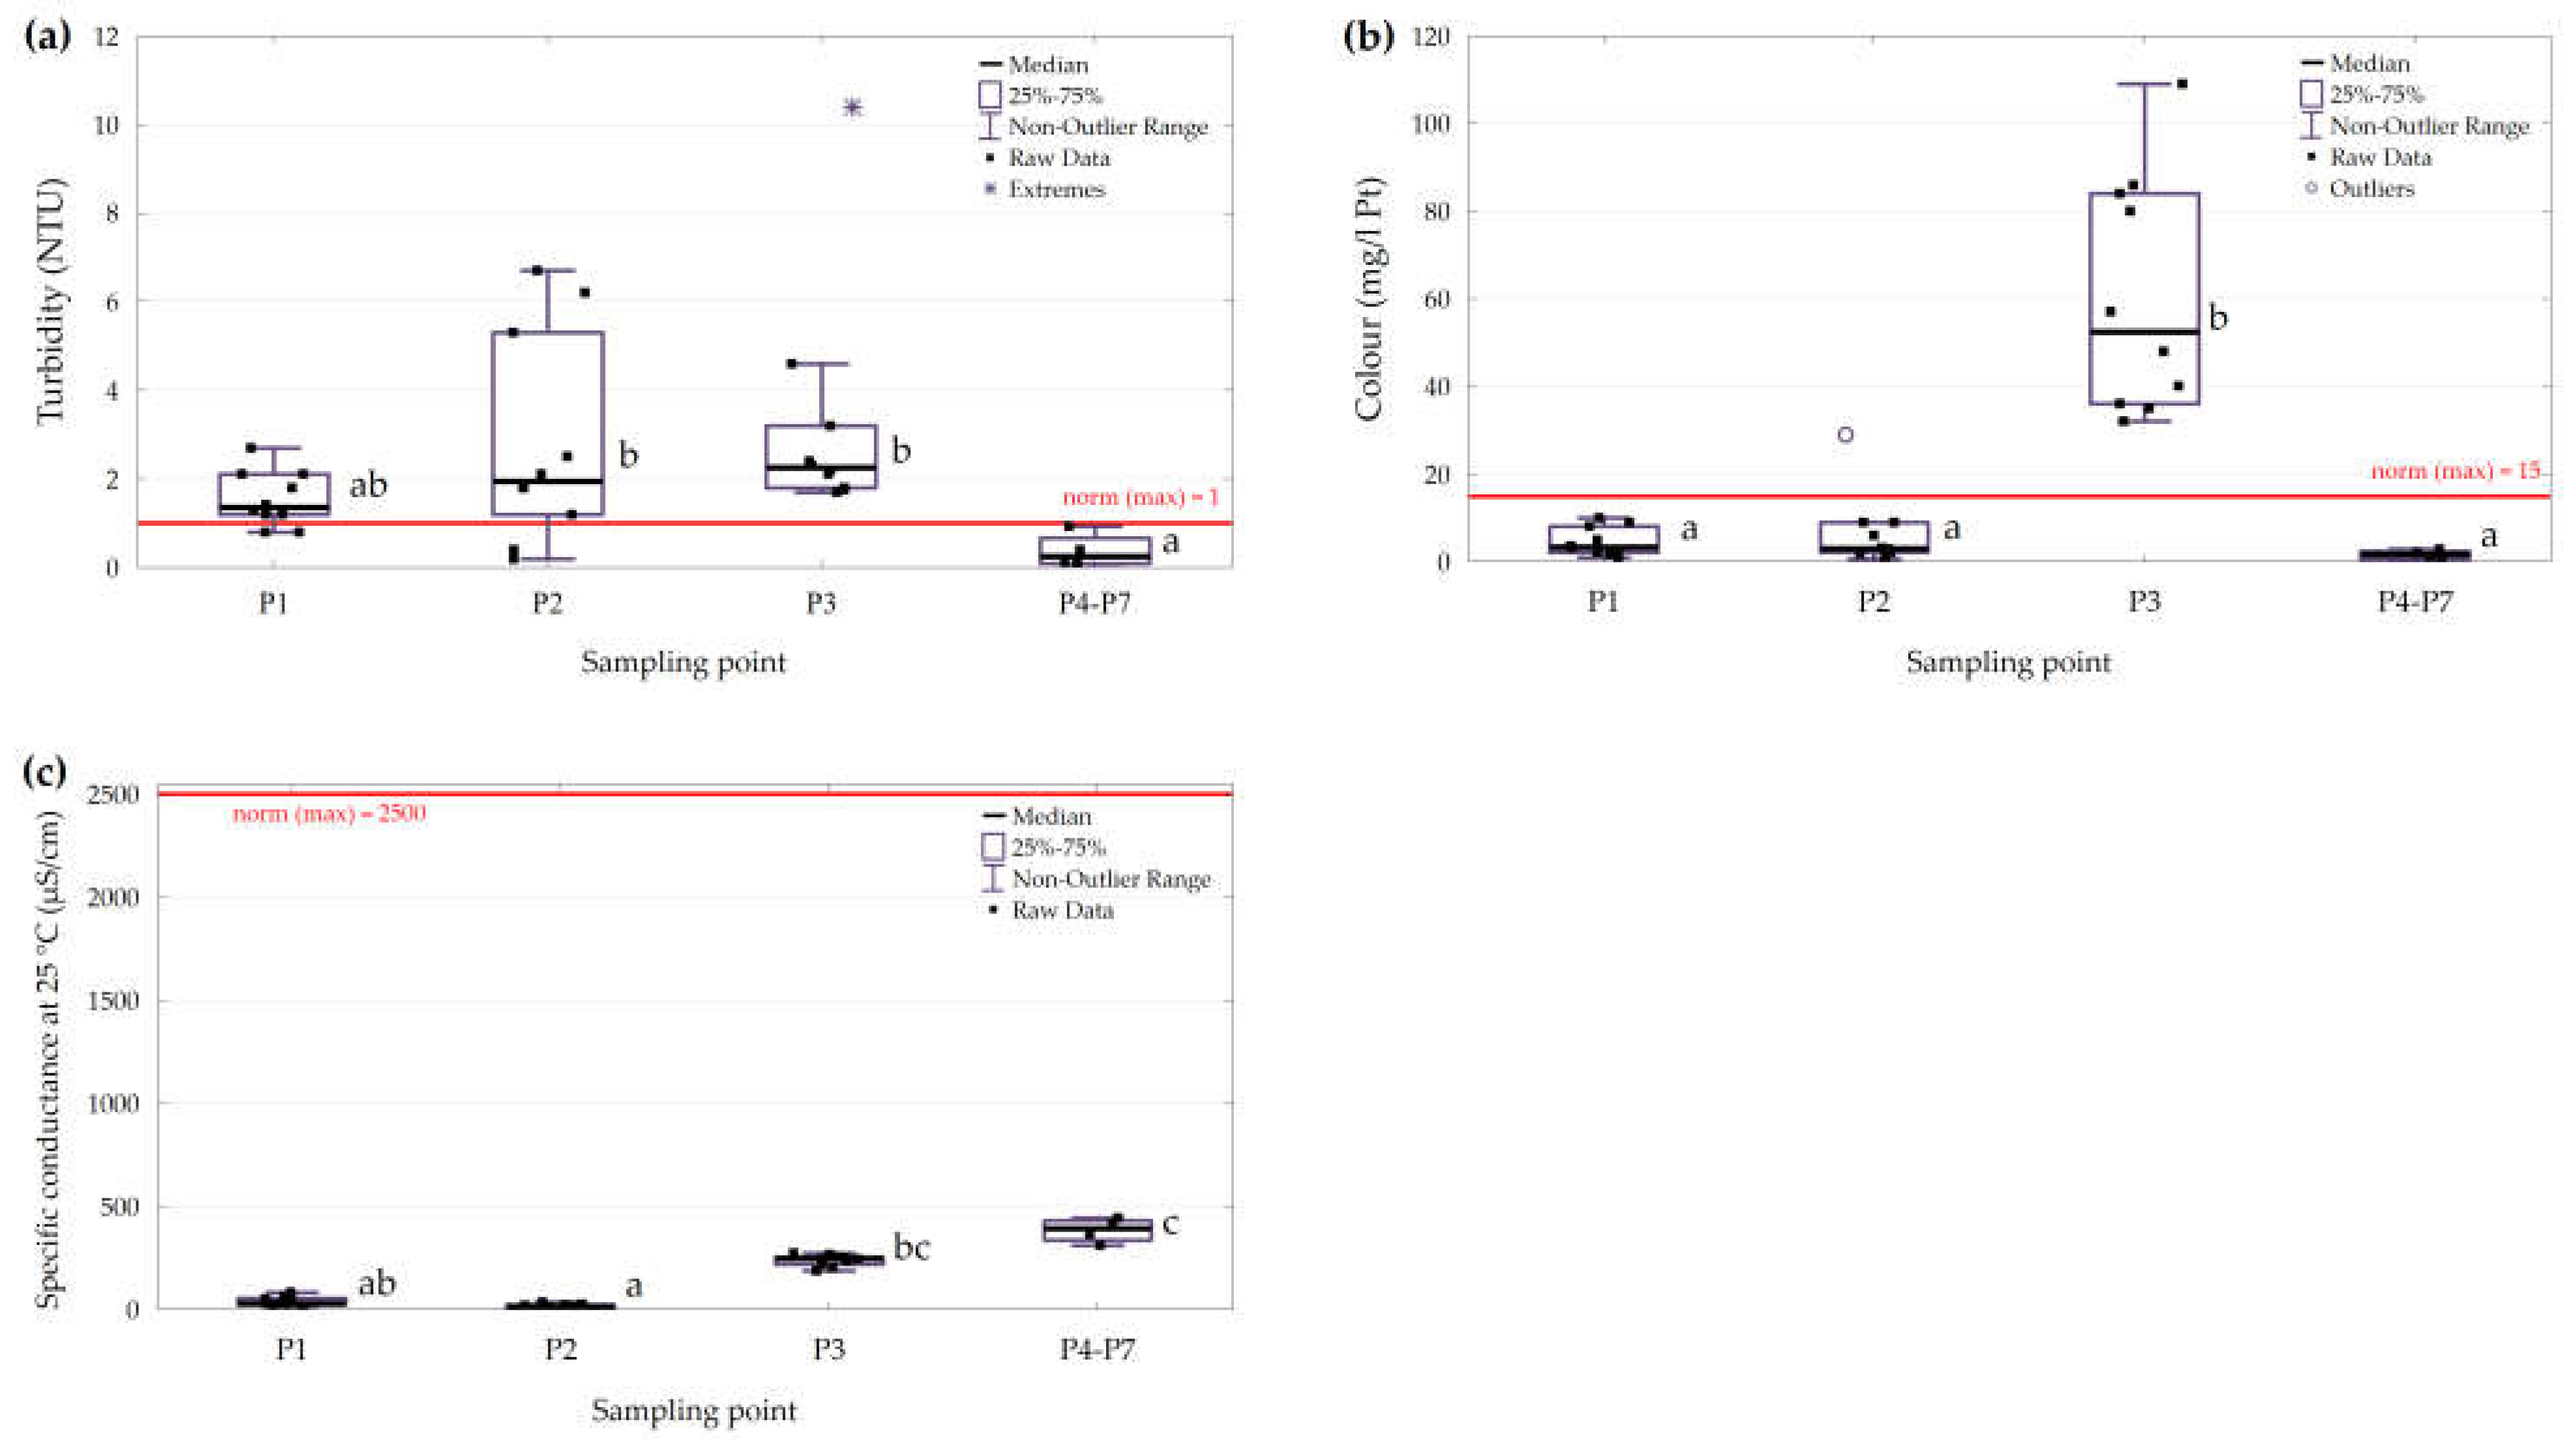
3.2.2. Analysis of Selected Physical Indicators

Table 4 compares the descriptive statistics of the physical parameters of rainwater with those of flowing water and groundwater. Figure 9 shows box plots of the physical test results for the analysed types of water.
The water groups we tested showed statistically significant differences in turbidity (Kruskal–Wallis H = 12.60, p = 0.006). No significant differences in turbidity were found between the rainwater samples collected at points P1 and P2, but rainwater collected at point P2 and river water sampled from the Świerszcz P3 had significantly higher turbidity than water sampled from the deep wells. However, no differences in turbidity were found between rainwater collected at point P1 and the water from the deep wells (P4–P7) (Figure 9a). Groundwater was the only type for which the standard for acceptable levels of turbidity in drinking water was not exceeded [36]. In the case of the remaining water groups (rainwater and surface water), the turbidity values slightly exceeded the permissible limit for drinking water. Compliance with drinking water standards for rainwater was 20% and 60% for P1 and P2, respectively.
There were no significant differences in the colour between rainwater collected at points P1 and P2 and water from the deep wells (P4–P7). By contrast, water from the River Świerszcz had a significantly higher colour value (Kruskal–Wallis H = 22.19, p < 0.001) (Figure 9b), which considerably exceeded the limit for drinking water [37]. The colour of rainwater (P1 and P2) and water from the deep wells (P4–P7) met the guidelines for drinking water. The colour standard for drinking water was exceeded only once at P2 (Figure 9b). Compliance with drinking water standards for rainwater was 100% and 90% for P1 and P2, respectively.
The tests showed significant differences in the specific conductance between the different water groups (Kruskal–Wallis H = 28.11, p < 0.001). The lowest conductance value was obtained for rainwater sampled at P2, with an average of 16.6 µS/cm. A slightly higher conductance (not statistically significant) was found in rainwater collected at P1, with an average of 40.3 µS/cm. Conductance values for rainwater at both measurement points (P1 and P2) were significantly lower than for the deep well water (P4–P7) (Figure 9c). None of the tested waters exceeded the specific conductance standards for drinking water.

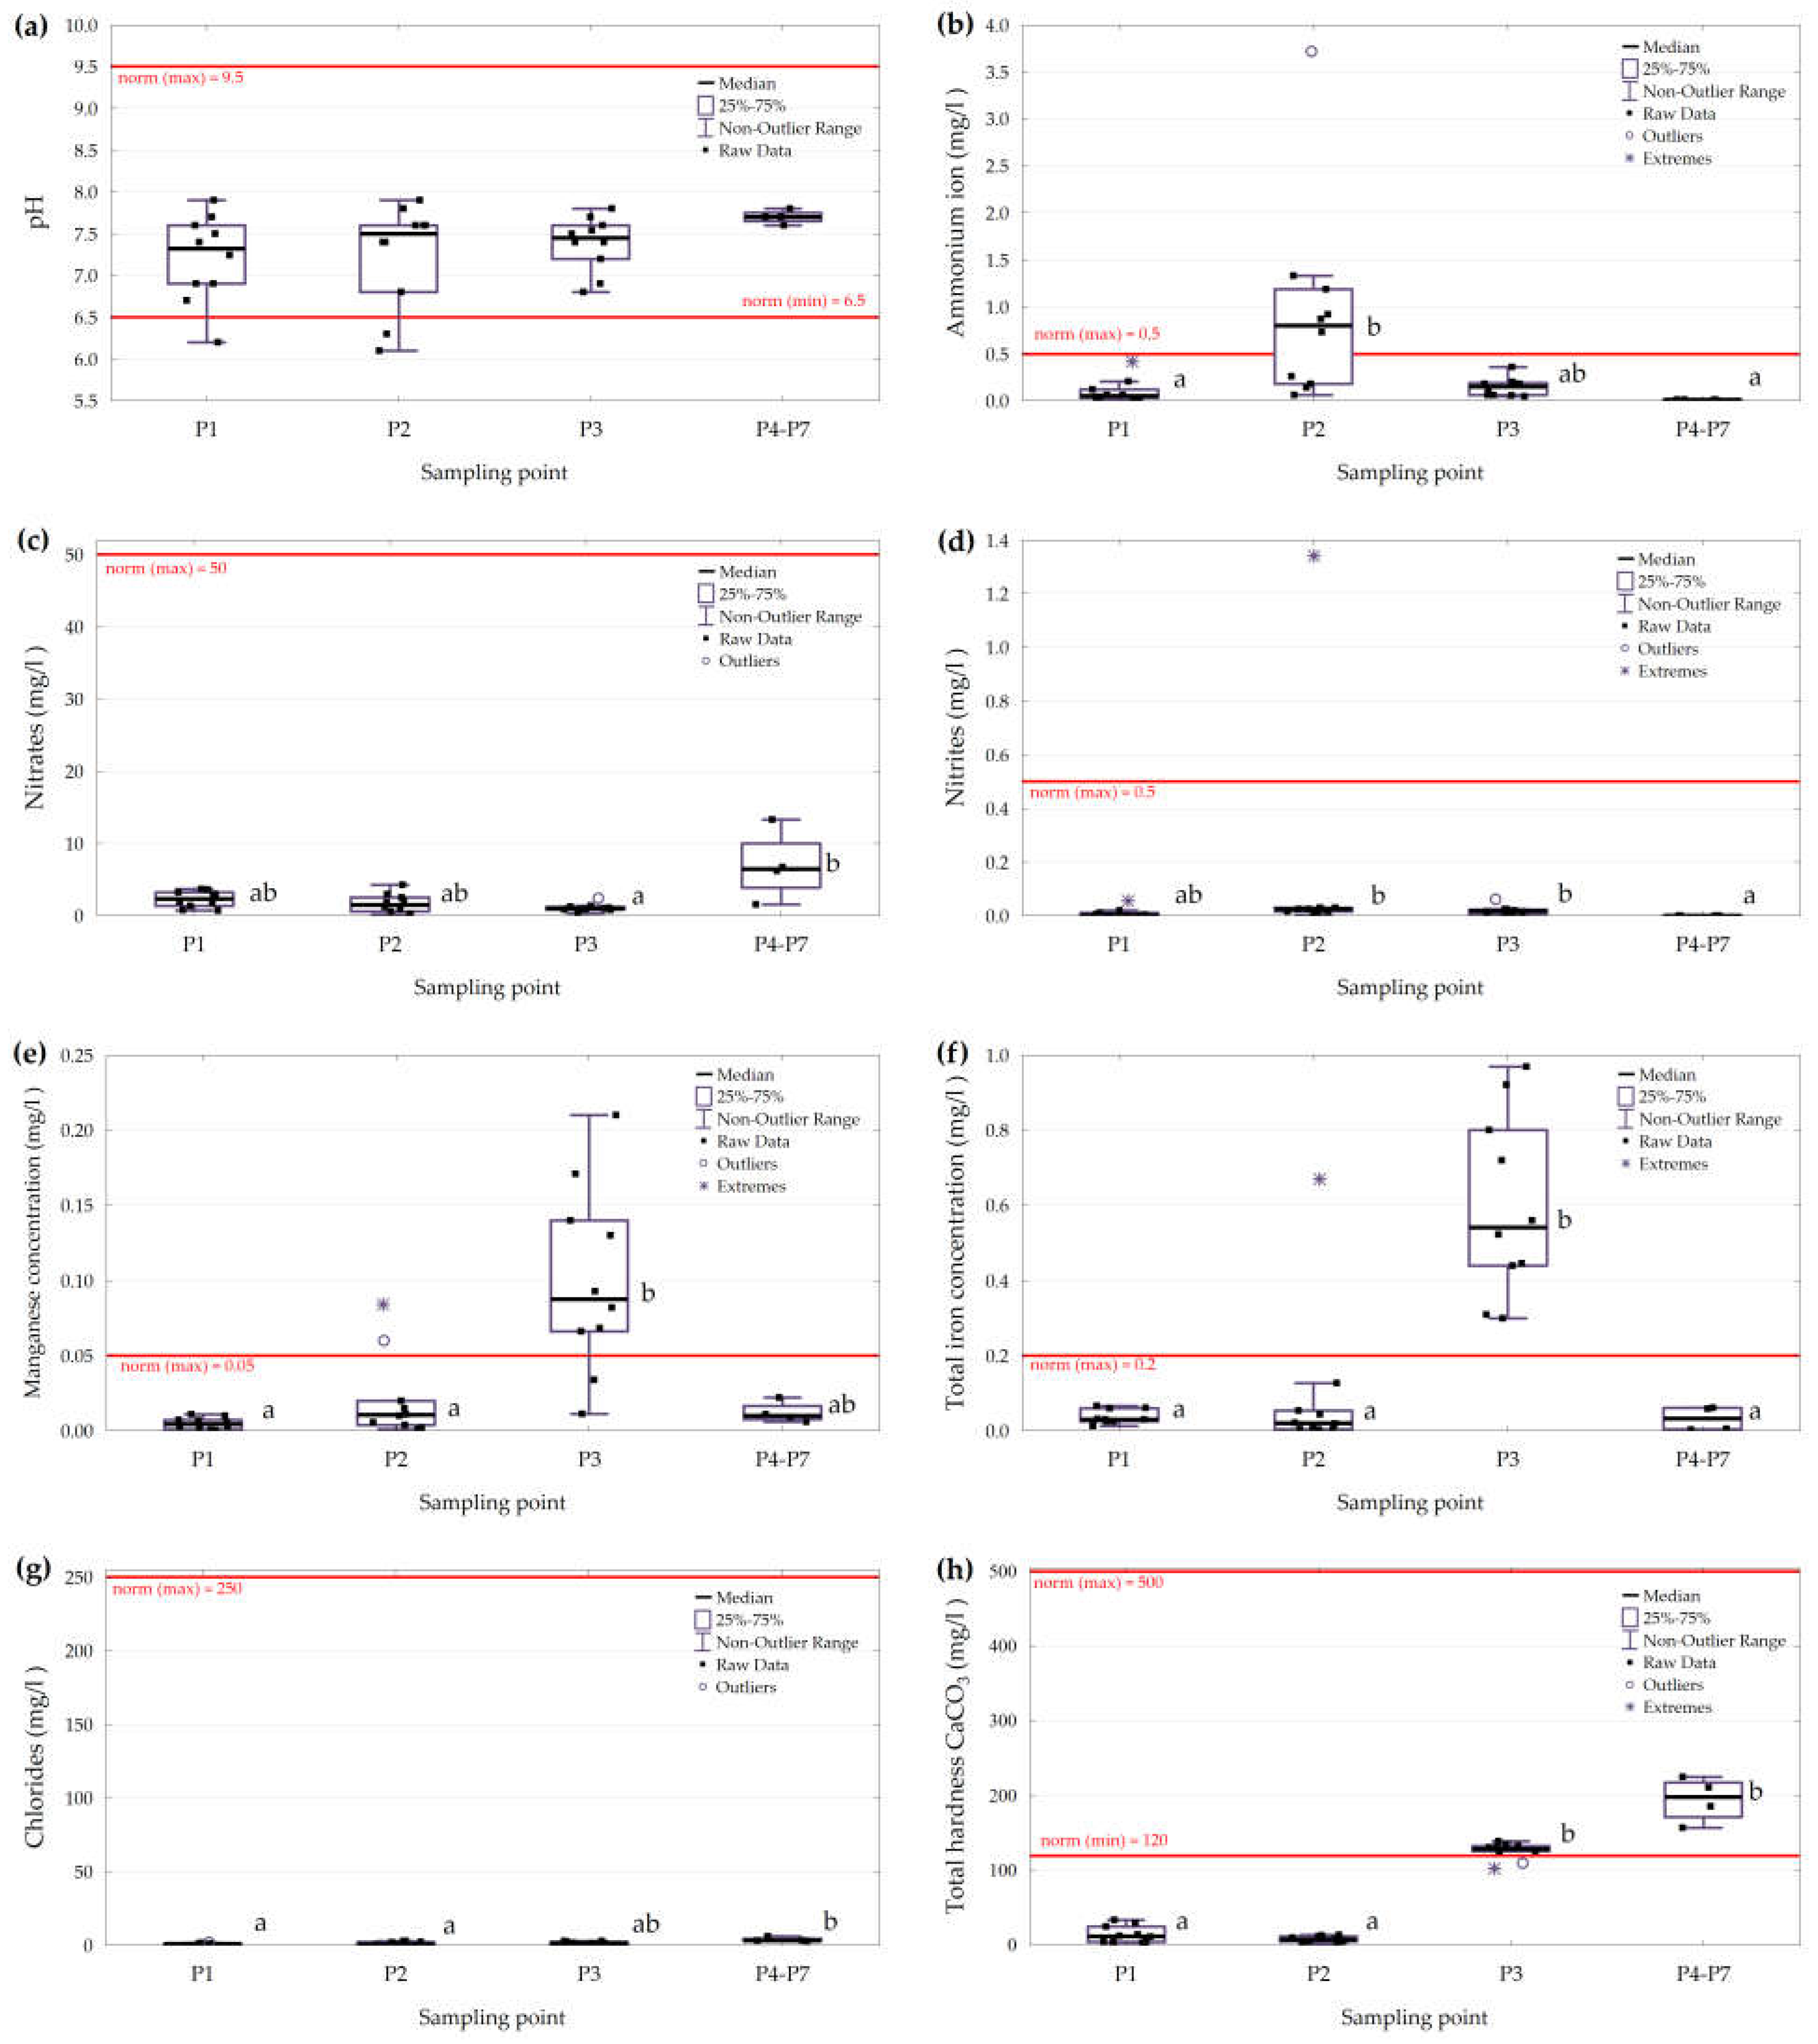
3.2.3. Analysis of Selected Chemical Indicators

Table 5 compares the descriptive statistics of the chemical parameters of rainwater with those of flowing water and groundwater. Figure 10 shows box plots of the chemical test results for the analysed types of water.
There were no statistically significant differences in the distribution of water pH values (Kruskal–Wallis H = 4.59, p = 0.204) between the tested measurement points (Figure 10a). In most cases, rainwater, river water and water from the deep wells met the standard for pH in drinking water [36]. However, rainwater (sampled from points P1 and P2) had reduced pH values < 6.5 in several instances in August and September 2022 when there was relatively little precipitation, and the rain could have been “acid rain”. Compliance with the drinking water standards for rainwater was 90% and 80% for P1 and P2, respectively.
In the study, we found significant differences in the content of ammonium ions between the tested water groups (Kruskal–Wallis H = 18.05, p < 0.001). Significantly higher differences in the content of ammonium ions were recorded at point P2 than at points P1, P3 (river water) and P4–P7 (deep well water). The acceptable ammonium ion limit of 0.5 mg/L for drinking water was only exceeded in rainwater collected at point P2 (Figure 10b). Compliance with drinking water standards for rainwater was 100% and 40% for P1 and P2, respectively. The increased content of ammonium ions in water samples taken at point P2, similar to the increased bacterial counts at 36 °C, could have been caused by the contamination of rainwater with bird droppings found on the surface of the roofs from which rainwater was collected. Previously, Evans et al. [13] and Jóźwiakowski et al. [10] also drew attention to this problem. Since these roofs are located in the Animal Breeding Centre in the very heart of the RNP, the number of birds in this place (P2) may be higher than in the town center of Zwierzyniec, where point P1 is located.
In the case of nitrates (Figure 10a), no exceedance of the drinking water standard of 50 mg/L was recorded in any of the measuring points (P1–P7). The acceptable limit (0.5 mg/L) of nitrites, on the other hand, was exceeded only once at point P2 (Figure 10d). Compliance with drinking water standards for rainwater was 100% and 90% for P1 and P2, respectively. However, there were statistically significant differences in the content of nitrates and nitrites between the groups (nitrates: Kruskal–Wallis H = 10.44, p = 0.015; nitrites Kruskal–Wallis H = 14.80, p = 0.002). The highest contents of nitrates were found in groundwater (P4–P7), but the values were not significantly different from those recorded for rainwater (P1 and P2). In the case of nitrites, the lowest concentrations were recorded in groundwater, and they were significantly lower than those for rainwater sampled at P2 and river water (P3), but not significantly lower than those for rainwater from point P1.
There were significant differences in the content of manganese in the tested waters (Kruskal–Wallis H = 20.26, p < 0.001), which resulted mainly from the increased content of this element in the waters of the River Świerszcz (P3) (Figure 10e). At P3, the permissible limit of 0.05 mg/L of manganese in drinking water was exceeded for most of the study period. The limit was also exceeded twice in rainwater sampled at point P2. Compliance with the drinking water standards for rainwater was 100% and 80% for P1 and P2, respectively. Generally, however, no differences in manganese content were found between rainwater and groundwater.
Significant differences were also found in the content of total iron between the tested water types (Kruskal–Wallis H = 18.90, p < 0.001). The highest levels of iron, similar to manganese, were recorded in the waters of the River Świerszcz (P3) (Figure 10f). At P3, the permissible limit for iron in drinking water, namely, 0.2 mg/l, was exceeded throughout the study period. The limit was also exceeded once in rainwater sampled at point P2. Compliance with drinking water standards for rainwater was 100% and 90% for P1 and P2, respectively.
In the case of chlorides, the drinking water standard of 250 mg/L was not exceeded in any of the measurement points (Figure 10g). The lowest content of chlorides was found in rainwater (P1 and P2) and the highest was found in groundwater (P4–P7).
The tests showed that there were significant differences in general hardness between the sampling points (Kruskal–Wallis H = 25.72, p < 0.001). Rainwater collected from points P1 and P2 had lower total hardness than the minimum standard (120 mg/L) stipulated for drinking water (Figure 10h). Compliance with the drinking water standards for rainwater was 0% for both P1 and P2. These findings indicated that the rainwater was very soft and did not contain calcium compounds, which is why it should not be recommended for drinking in large quantities. Significantly higher total hardness values were recorded for water from the River Świerszcz (P3) and deep wells (P4–P7). These results confirmed that these waters originated from the Upper Cretaceous aquifer.

4. Discussion

In the context of ongoing climate change and the increasing problems of access to water, various aspects of the use of rainwater for drinking purposes, as well as for other utilitarian purposes (such as land irrigation, toilet flushing and car washing) are being considered in scientific studies carried out in various countries [38,39]. Water scarcity is faced not only by countries with hot climates but increasingly in other countries, including Poland. In the case of using rainwater to provide people and animals with access to drinking water, appropriate standards set by the World Health Organization and national sanitary institutions should be maintained. Ongoing studies on rainwater quality show that frequently, these standards are not met and the stored water requires appropriate treatment, which can significantly reduce the content of pollutants [40].
Violation of potable water standards is also confirmed by the water quality results presented in this study, both in terms of microbiological and physicochemical parameters. In the water samples tested, drinking water standards were exceeded in the cases of the total microbial count at 36 °C, Escherichia coli, intestinal enterococci and Pseudomonas aeruginosa. As presented here, similar numbers of coliform bacteria in rainwater outflowing from the roofs of garage buildings in the National Park were also noted in 2015 [10]. These authors stated that this was caused by animal faeces on the surface of the roofs. Other authors also drew attention to problems with microbiological quality [13,41,42]. In some samples of rainwater, the standards were also exceeded for physicochemical parameters, such as turbidity; colour; pH; and ammonium ions, nitrites, manganese or total iron concentrations. However, the cases of colour, ammonium ions and total iron were isolated cases. Furthermore, in all samples of rainwater at both measurement points (P1 and P2) too low total hardness was found.
Various factors, such as air pollution and water storage in tanks, are indicated as the reasons for the violation of the standards [12]. Some authors presented that the need to store rainwater in tanks for a longer period is one of the main factors hindering their use for drinking purposes. On the other hand, it was reported that after 6 weeks of storage at temperatures of 12 °C, rainwater became sanitary safe with significantly reduced microbial contamination [43].
Tengan and Akoto [44] mentioned that the rainwater quality and the content of various pollutants, including heavy metals, are also affected by the roof covering from which rainwater is collected. The quality of the collected rainwater may also be influenced by the design of the water collection system and the types of tank inlets that are designed to reduce the amount of collected pollutants [45].
The research was carried out in a national park that can be considered a very clean region. There are no heavy industry plants operating in its area that may have caused, for example, heavy metal pollution, which occurs in urbanised and industrialised areas of Poland [46]. However, some measurements of water samples confirm to a greater or lesser extent the existing problems with the quality of rainwater. In the studies carried out in Poznań, the quality of rainwater collected in underground reservoirs in terms of most physical and chemical parameters met the Polish and EU requirements on drinking water standards. The main problem, however, concerns the quality and high microbiological variability of water [47]. Strzebońska et al. [48] stated that in another Polish city, namely, Krakow, rainwater does not exceed the level of chemical compounds adopted for drinking water; however, it is significantly contaminated in terms of microbiological parameters, and thus, rainwater does not meet the drinking water standards, but is suitable for non-potable use. These results are also confirmed by research conducted in Rzeszów [43,49], in which authors concluded that rainwater is unsuitable for applications requiring drinking water quality due to a large number of psychrophilic, mesophilic and faecal bacteria. The best microbiological quality was obtained for rainwater collected from roofs in autumn and spring [43].
Worldwide research most often focuses on the collection and use of rainwater for housing purposes due to water shortages. These studies covered both urban and rural areas. In this publication, we present the issue of protecting water resources in environmentally important areas, which include national parks. Climatic changes were also observed in the RNP, such as the drying of Ponds Echo [31].
Fortunately, the favorable water balance in 2020–2022 largely offset the effects of drought in previous years. These effects are still visible in natural phenomena, but almost imperceptible in hydrological phenomena. Taking into account the forecasts of changes determined by regional climate models [50], the temperature increase will continue, especially in winter to 3 °C. Forest stand dynamics forecast models assume a warm dry climate scenario. This results in maintaining the status quo for pine stands. On the other hand, changes in the species structure of these stands are forecasted via an increase in the number of beech, fir and hornbeam trees. A decrease in the importance of species sensitive to water shortage (alder and spruce) is expected. The species to gain importance will be hornbeam and linden [51].
The year 2021 was the second consecutive year when the ecosystems of the Świerszcz catchment did not suffer from a lack of water during the growing season. Two consecutive wet years caused natural effects. Bark beetle gradations in pine and spruce stands ended and the process of fir dieback slowed down. A clear improvement was also noted in the degree of hydration in peatland ecosystems. The condition of peat moss improved, and undesirable expansive species began to withdraw from water-dependent natural habitats.
The water flow in the Świerszcz River, which was much lower than the long-term average, resulted from the extremely low supply associated with the lowering of the groundwater level in the main Cretaceous aquifer. Significant reconstruction of the power supply took place only in the second half of the hydrological year and was associated with increased precipitation. Regarding this aspect, the protection of groundwater abundance, and to a greater extent, the acquisition and use of rainwater also in nature-protected areas, is gaining in importance. Moreover, attention should be paid to the quality of water in the Świerszcz River, which, for some parameters, was worse than rainwater. This indicates that steps can be taken to improve its quality here as well. Examples of improvement methods can be found, e.g., in [52].

5. Conclusions

The results of this study indicate that rainwater harvested in the RNP had good organoleptic, physicochemical and microbiological properties. In some samples, rainwater purity met the standards for water intended for consumption by humans or animals. It was similar to the groundwater quality and better than the quality of surface water taken from the River Świerszcz. The findings show that rainwater was very soft and did not contain calcium compounds, which is why it should not be recommended for drinking in large quantities. The rainwater periodically had reduced pH values < 6.5, mainly due to low precipitation in the summer, which was probably “acid rain”. The permissible standards, mainly for turbidity, ammonium ions and microbiological indicators, were periodically exceeded in the tested rainwater. This was likely caused by contamination of roof surfaces with bird droppings. These exceedances did not exclude the use of rainwater for economic purposes, e.g., flushing toilets, washing vehicles or watering green areas, which may significantly reduce the abstraction of high-quality groundwater from the Upper Cretaceous aquifer. The rainwater that is planned to be used as drinking water for the Polish konik horses living in the park will have to be pre-treated via filtration and disinfection processes (e.g., with a UV lamp).

Author Contributions

Conceptualization, T.G. and K.J.; methodology, T.G. and K.J.; software, T.G. and A.B.; validation, T.G., K.J., A.B., P.S. and B.R.; formal analysis, T.G. and A.B.; investigation, T.G.; resources, T.G., P.S. and B.R.; data curation, T.G., P.S. and B.R.; writing—original draft preparation, T.G. and K.J.; writing—review and editing, T.G., K.J. and A.B.; visualization, T.G. and A.B.; supervision, T.G. and K.J.; project administration, T.G. and K.J.; funding acquisition, T.G. and K.J. All authors have read and agreed to the published version of the manuscript.

Funding

The paper was written as part of a PhD thesis entitled “Development and implementation of a system for the collection and use of rainwater for watering animals in the Roztocze National Park” prepared by Tadeusz Grabowski. The study was funded by project no. DWD/4/88/2020, financed by the Ministry of Education and Science (Ministerstwo Edukacji i Nauki, Poland).

Institutional Review Board Statement

Not applicable.

Informed Consent Statement

Not applicable.

Data Availability Statement

Not applicable.

Acknowledgments

This paper is a result of cooperation between Roztocze National Park (RNP) based in Zwierzyniec, the University of Life Sciences in Lublin and the Maria Curie Skłodowska University in Lublin (UMCS). The authors would like to thank the director and staff of the RNP for creating a climate for creative work. Special thanks are given to the staff of the RNP Integrated Environmental Monitoring Base Station and the staff of the Department of Hydrology and Climatology of the Maria Curie-Skłodowska University (UMCS) for many years of research on the natural environment of Roztocze and RNP and for their kindness and assistance in compiling the paper.

Conflicts of Interest

The authors declare no conflict of interest.

References

  1. Palla, A.; Gnecco, I.; Lanza, L.; La Barbera, P. Performance analysis of domestic rainwater harvesting systems under various European climate zones. Resour. Conserv. Recycl. 2012, 62, 71–80. [Google Scholar] [CrossRef]
  2. Musayev, S.; Burgess, E.; Mellor, J. A global performance assessment of rainwater harvesting under climate change. Resour. Conserv. Recycl. 2018, 132, 62–70. [Google Scholar] [CrossRef]
  3. Semaan, M.; Day, S.D.; Garvin, M.; Ramakrishnan, N.; Pearce, A. Optimal sizing of rainwater harvesting systems for domestic water usages: A systematic literature review. Resour. Conserv. Recycl. 2020, 6, 100033. [Google Scholar] [CrossRef]
  4. Herrmann, T.; Schmida, U. Rainwater utilisation in Germany: Efficiency, dimensioning, hydraulic and environmental aspects. Urban Water 1999, 1, 307–316. [Google Scholar] [CrossRef]
  5. Sazakli, E.; Alexopoulos, A.; Leotsinidis, M. Rainwater harvesting, quality assessment and utilization in Kefalonia Island, Greece. Water Res. 2007, 41, 2039–2047. [Google Scholar] [CrossRef]
  6. Ghisi, E.; Bressan, D.L.; Martini, M. Rainwater tank capacity and potential for potable water savings by using rainwater in the residential sector of southeastern Brazil. Build. Environ. 2007, 42, 1654–1666. [Google Scholar] [CrossRef]
  7. Zhang, Y.; Chen, D.; Chen, L.; Ashbolt, S. Potential for rainwater use in high-rise buildings in Australian cities. J. Environ. Manag. 2009, 91, 222–226. [Google Scholar] [CrossRef]
  8. Abdulla, F.A.; Al-Shareef, A. Roof rainwater harvesting systems for household water supply in Jordan? Desalination 2009, 243, 195–207. [Google Scholar] [CrossRef]
  9. Farreny, R.; Morales-Pinzón, T.; Guisasola, A.; Tayà, C.; Rieradevall, J.; Gabarrell, X. Roof selection for rainwater harvesting: Quantity and quality assessments in Spain. Water Res. 2011, 45, 3245–3254. [Google Scholar] [CrossRef]
  10. Jóżwiakowski, K.; Listosz, A.; Gizińska-Górna, M.; Pytka, A.; Marzec, M.; Sosnowska, B.; Chołody, M.; Dyczko, A. Quality of rainwaters outflowing from roofs of garage buildings of park authority of roztocze national park. J. Ecol. Eng. 2016, 17, 208–215. [Google Scholar] [CrossRef]
  11. Zdeb, M.; Zamorska, J.; Papciak, D.; Słyś, D. The Quality of Rainwater Collected from Roofs and the Possibility of Its Economic Use. Resources 2020, 9, 12. [Google Scholar] [CrossRef]
  12. Forster, J. The influence of location and season on the concentrations of macroions and organic trace pollutants in roof runoff. Water Sci. Technol. 1998, 38, 83–90. [Google Scholar] [CrossRef]
  13. Evans, C.; Coombes, P.; Dunstan, R. Wind, rain and bacteria: The effect of weather on the microbial composition of roof-harvested rainwater. Water Res. 2006, 40, 37–44. [Google Scholar] [CrossRef] [PubMed]
  14. Wu, L.; Gao, J.; Zhao, W.; Xu, X.; Yin, Y.; Wu, L. Quality assessment of rainwater and harvested rainwater stored in different types of cisterns. Water Sci. Technol. Water Supply 2016, 17, 652–664. [Google Scholar] [CrossRef]
  15. Slyś, D. Potential of rainwater utilization in residential housing in Poland. Water Environ. J. 2009, 23, 318–325. [Google Scholar] [CrossRef]
  16. Struk-Sokołowska, J.; Gwoździej-Mazur, J.; Jadwiszczak, P.; Butarewicz, A.; Ofman, P.; Wdowikowski, M.; Kaźmierczak, B. The Quality of Stored Rainwater for Washing Purposes. Water 2020, 12, 252. [Google Scholar] [CrossRef]
  17. Evans, C.A.; Harrison, T.; Coombes, P.J.; Dunstan, H.R.; Dunstan, R.H. Identifying the major influences on the microbial composition of roof harvested rainwater and the implications for water quality. Water Sci. Technol. 2007, 55, 245–253. [Google Scholar] [CrossRef]
  18. Hoss, C.G.; Tavares, J.M.R.; Moreira, A.J.G.; Filho, P.B.; Matthiensen, A. Assessing the Potential for Rainwater Harvesting Use in a Concentrated Animal Feeding Operation Region in the South of Brazil. Sustainability 2022, 14, 12523. [Google Scholar] [CrossRef]
  19. Chubaka, C.E.; Ross, K.E.; Edwards, J.W. Rainwater for drinking water: A study of household attitudes. WIT Trans. Ecol. Environ. 2017, 216, 299–311. [Google Scholar] [CrossRef]
  20. Buraczyński, J. Roztocze Natural Environment Lublin; Wydawnictwo: Lublin, Poland, 2002; p. 341. (In Polish) [Google Scholar]
  21. Grabowski, T.; Harasimiuk, M.; Kaszewski, B.M.; Kravchuk, Y.; Lorens, B.; Michalczyk, Z.; Shabliy, O. Roztocze Nature and Man; Roztocze National Park: Zwierzyniec, Poland, 2015; p. 527. (In Polish) [Google Scholar]
  22. Protection Plan of the Roztocze National Park, Regulation of the Minister of the Environment of April 19, 2018, Journal of Law (Dz. U.) 2018, Item 1081 (In Polish). Available online: https://isap.sejm.gov.pl/isap.nsf/DocDetails.xsp?id=WDU20180001081 (accessed on 20 April 2023).
  23. The Nature Conservation Act of April 16, 2004, Journal of Laws (Dz. U.) 2004, No. 92, Item 880 (In Polish). Available online: https://isap.sejm.gov.pl/isap.nsf/DocDetails.xsp?id=WDU20040920880 (accessed on 20 April 2023).
  24. Stachyra, P.; Grabowski, T.; Kaszewski, B.M. Report on the Implementation of the Research and Measurement Program of the Integrated Monitoring of the Natural Environment at the Roztocze Base Station of the Roztocze National Park in 2012; ZMŚP Roztocze Base Station 2013; Roztocze National Park: Zwierzyniec, Poland, 2013. (In Polish) [Google Scholar]
  25. Buraczyński, J.; Grzechnik, L.; Meksuł, M. RNP on the background of phisico-geographical regions. In Roztocze National Park, Environment and Human Being; Kałamucki, K., Grabowski, T., Eds.; Cartographic Monograph; RPN: Zwierzyniec, Poland, 2013. (In Polish) [Google Scholar]
  26. Brzezińska-Wójcik, T.; Harasimiuk, M.; Krukowski, M. Geology Superficjal sediments. In Roztocze National Park, Environment and Human Being; Kałamucki, K., Grabowski, T., Eds.; Cartographic Monograph; RPN: Zwierzyniec, Poland, 2013. (In Polish) [Google Scholar]
  27. Romer, E. Climatic Regions of Poland; Prace Wrocławskiego Towarzystwa Naukowego: Wrocław, Poland, 1949; Seria B, No 16; p. 23. (In Polish) [Google Scholar]
  28. Kaszewski, B.M.; Siwek, K. Climate. In Roztocze National Park—Nature and Man; Reszel, R., Grądziel, T., Eds.; Roztocze National Park: Zwierzyniec, Poland, 2015; pp. 61–65. (In Polish) [Google Scholar]
  29. Bartoszewski, S.; Michalczyk, Z. Water relations. In Roztocze National Park—Nature and Man; Reszel, R., Grądziel, T., Eds.; Roztocze National Park: Zwierzyniec, Poland, 2015; pp. 53–60. (In Polish) [Google Scholar]
  30. Micek, A.; Jóźwiakowski, K.; Marzec, M.; Listosz, A. Technological Reliability and Efficiency of Wastewater Treatment in Two Hybrid Constructed Wetlands in the Roztocze National Park (Poland). Water 2020, 12, 3435. [Google Scholar] [CrossRef]
  31. Grabowski, T.; Jóźwiakowski, K.; Bochniak, A.; Micek, A. Changes in the Amount of Rainwater in the Roztocze National Park (Poland) in 2001–2020 and the Possibility of Using Rainwater in the Context of Ongoing Climate Variability. Water 2022, 14, 1334. [Google Scholar] [CrossRef]
  32. Regulation of the Minister of Maritime Economy and Inland Navigation of October 11, 2019. On the Criteria and Method of Assessing the Status of Groundwater Bodies, Journal of Law (Dz. U.) 2019, Item. 2148 (in Polish). Available online: https://isap.sejm.gov.pl/isap.nsf/DocDetails.xsp?id=WDU20190002148 (accessed on 20 April 2023).
  33. Mucha, J. (Department of Mine Geology, AGH Kraków, Krakow, Poland). Unpublished work. 1994. [Google Scholar]
  34. Kruskal, W.H.; Wallis, W.A. Use of ranks in one-criterion variance analysis. J. Amer. Stat. Assoc. 1952, 47, 583–621. [Google Scholar] [CrossRef]
  35. Siegel, S.; Castellan, N.J. Nonparametric Statistics for the Behavioral Sciences, 2nd ed.; McGraw-Hill: New York, NY, USA, 1988. [Google Scholar]
  36. Regulation of the Minister of Health of 7 December 2017 on the Quality of Water Intended for Human Consumption, Journal of Law (Dz. U.) 2017, Item 2297. Available online: https://isap.sejm.gov.pl/isap.nsf/DocDetails.xsp?id=WDU20170002297 (accessed on 20 April 2023).
  37. Regulation of the Minister of Infrastructure of June 25, 2021 on the Classification of Ecological Status, Ecological Potential and Chemical status and the Method of Classifying the Status of Surface Water Bodies, as well as Environmental Quality Standards for Priority Substances, Journal of Law (Dz.U.) 2021, Item 1475 (In Polish). Available online: https://isap.sejm.gov.pl/isap.nsf/DocDetails.xsp?id=WDU20210001475 (accessed on 20 April 2023).
  38. Nnaji, C.C.; Nnam, J.P. Assessment of potability of stored rainwater and impact of environmental conditions on its quality. Int. J. Environ. Sci. Te. 2019, 16, 8471–8484. [Google Scholar] [CrossRef]
  39. Nalwanga, R.; Muyanja, C.K.; McGuigan, K.G.; Quilty, B. A study of the bacteriological quality of roof-harvested rainwater and an evaluation of SODIS as a suitable treatment technology in rural Sub-Saharan Africa. J. Environ. Chem. Eng. 2018, 6, 3648–3655. [Google Scholar] [CrossRef]
  40. Morales-Figueroa, C.; Castillo-Suárez, L.A.; Linares-Hernández, I.; Martínez-Miranda, V.; Teutli-Sequeira, E.A. Treatment processes and analysis of rainwater quality for human use and consumption regulations, treatment systems and quality of rainwater. Int. J. Environ. Sci. Technol. 2023. [Google Scholar] [CrossRef]
  41. Hamilton, K.; Reyneke, B.; Waso, M.; Clements, T.; Ndlovu, T.; Khan, W.; DiGiovanni, K.; Rakestraw, E.; Montalto, F.; Haas, C.N.; et al. A global review of the microbiological quality and potential health risks associated with roof-harvested rainwater tanks. NPJ Clean Water 2019, 2, 7. [Google Scholar] [CrossRef]
  42. Hamilton, K.A.; Parrish, K.; Ahmed, W.; Haas, C.N. Assessment of Water Quality in Roof-Harvested Rainwater Barrels in Greater Philadelphia. Water 2018, 10, 92. [Google Scholar] [CrossRef]
  43. Zdeb, M.; Zamorska, J.; Papciak, D.; Skwarczyńska-Wojsa, A. Investigation of Microbiological Quality Changes of Roof-Harvested Rainwater Stored in the Tanks. Resources 2021, 10, 103. [Google Scholar] [CrossRef]
  44. Tengan, B.M.; Akoto, O. Comprehensive evaluation of the possible impact of roofing materials on the quality of harvested rainwater for human consumption. Sci. Total. Environ. 2022, 819, 152966. [Google Scholar] [CrossRef]
  45. Dissanayake, J.; Han, M. Effect of Inlet/Outlet Configuration on Water Quality in a Rainwater Harvesting Tank. Water 2020, 12, 1970. [Google Scholar] [CrossRef]
  46. Michalski, R.; Pecyna-Utylska, P. Chemical characterization of bulk depositions in two cities of Upper Silesia (Zabrze, Bytom), Poland. Case study. Arch. Environ. Prot. 2022, 48, 106–116. [Google Scholar] [CrossRef]
  47. Mazurkiewicz, K.; Jeż-Walkowiak, J.; Michałkiewicz, M. Physicochemical and microbiological quality of rainwater harvested in underground retention tanks. Sci. Total. Environ. 2022, 814, 152701. [Google Scholar] [CrossRef] [PubMed]
  48. Strzebońska, M.; Gruszecka-Kosowska, A.; Kostka, A. Chemistry and Microbiology of Urban Roof Runoff in Kraków, Poland with Ecological and Health Risk Implications. Appl. Sci. 2020, 10, 8554. [Google Scholar] [CrossRef]
  49. Zdeb, M.; Zamorska, J.; Papciak, D. The Effect of the Type of Roofing and the Seasons on the Microbiological Quality of Rainwater. Ekon. Srod. 2018, 3, 71–82. [Google Scholar]
  50. Kaszewski, B.M.; Siwek, K.; Gluza, A.; Shuber, P. Climate. In Roztocze: Nature and Man; Grabowski, T., Harasimiuk, M., Kaszewski, B.M., Kravchuk, Y., Lorens, B., Michalczyk, Z., Shabliy, O., Eds.; Roztocze National Park: Zwierzyniec, Poland, 2015; pp. 123–133. (In Polish) [Google Scholar]
  51. Kozak, I.; Czekajska, P.; Kozak, H.; Stępień, A.; Kociuba, P. Simulation of the dynamics of pine stands in the Polish and Ukrainian part of Roztocze in the conditions of climate change. Leśne Pr. Badaw. 2013, 74, 215–226. (In Polish) [Google Scholar] [CrossRef]
  52. Oden, M.K. Evaluation of water quality in the Kizilirmak River (Central Anatolian) using physicochemical parameters and process proposal for improvement in water quality-a case study. Desalination Water Treat. 2019, 137, 226–233. [Google Scholar] [CrossRef]
Figure 1. Location of water-sampling points in the Świerszcz river catchment. Own elaboration.
Applsci 13 06110 g001
Figure 2. Geological structure of the River Świerszcz catchment. Own elaboration based on [26].
Applsci 13 06110 g002
Figure 3. Schematic model of the rainwater applications in the designed RWHS.
Applsci 13 06110 g003
Figure 4. RNP directorate area: (A) historic farm building and (B) garages.
Applsci 13 06110 g004
Figure 5. The Animal Breeding Centre in Florianka: (A) barn and (B) horse stables.
Applsci 13 06110 g005
Figure 6. The River Świerszcz in the “Malowany most” profile: (A) riverbed, (B) view on the bridge and (C) sampling point (P3).
Applsci 13 06110 g006
Figure 7. Hydrometeorological conditions in the test period and water sampling dates: P1–P3 (rainwater and flowing water) and P4–P7 (groundwater).
Applsci 13 06110 g007
Figure 8. Boxplots for microbiological parameters of the investigated water types. A comparison of the quality of rainwater (P1, P2), river water (P3) and water from deep wells (P4–P7) with drinking water standards. ab Distributions of results in groups not containing the same letter differed significantly at α = 0.05 (Kruskal–Wallis test). Boxplots for: (a) total microbial counts at 36 °C, (b) total microbial counts at 22 °C, (c) coliform bacteria, (d) Escherichia coli, (e) intestinal enterococci, (f) Pseudomonas aeruginosa.
Applsci 13 06110 g008
Figure 9. Boxplots of the physical parameters of the tested water groups. Comparison of the quality of rainwater (P1, P2), river water (P3) and water from the deep wells (P4–P7) with drinking water standards. abc Distributions of results in groups not containing the same letter differed significantly at α = 0.05 (Kruskal–Wallis test). Boxplots for: (a) turbidity, (b) colour, (c) specific conductance at 25 °C.
Applsci 13 06110 g009
Figure 10. Boxplots of the chemical parameters of the tested water groups. A comparison of the quality of rainwater (P1, P2), river water (P3) and water from the deep wells (P4–P7) with the corresponding drinking water standards. ab Distributions of results in the groups not containing the same letter differed significantly at α = 0.05 (Kruskal–Wallis test). Boxplots for: (a) pH, (b) ammonium ion, (c) nitrates, (d) nitrites, (e) manganese, (f) total iron, (g) chlorides, (h) total hardness CaCO3.
Applsci 13 06110 g010
Table 1. Standards and procedures used in the water quality tests.
Test TypeParameterPolish Standards NumbersUnit
Microbiological testsTotal microbial count at 36 °CPN-EN ISO 6222:2004cfu/mL
Total microbial count at 22 °CPN-EN ISO 6222:2004cfu/mL
ColiformsPN-EN ISO 9308-1:2014-12+A1:2017-04cfu/100 mL
Escherichia coliPN-EN ISO 9308-1:2014-12+A1:2017-04cfu/100 mL
Faecal enterococciPN-EN 7899-2:2004cfu/100 mL
Pseudomonas aeruginosaPN-EN ISO 16266:2009cfu/100 mL
Organoleptic testsPresence of a foreign odourPN-EN 1622:2006-
Threshold odour number (TON)PN-EN 1622:2006-
Physicochemical testsTurbidityPN-EN ISO 7027-1:2016-07NTU
ColourPN-EN ISO 7887:2012mg/L Pt
pHPN-EN ISO 10523:2012-
Specific conductance at 25 °CPN-EN 27888-1999µS/cm
Ammonium ionPN-ISO 7150-1:2002mg/L
NitratesPN-82/C-045576.08mg/L
NitritesPN-EN 26777:1999mg/L
ManganesePN-EN ISO 17294-2:2016-11µg/L
Total ironPN-EN ISO 17294-2:2016-11µg/L
ChloridesPN-ISO 9297:1994mg/L
Total hardnessPN-ISO 6059:1999mg/L CaCO3
Table 2. Drinking water quality standards and purity classes for surface water and groundwater stipulated in Polish legal acts [32,36,37].
Test ParametersUnitQuality Standards for Drinking Water [36]Surface Water Purity Classes [37]Groundwater Purity Classes [32]
I II IIIIIIIVV
Microbiological parameters
Total microbial count at 36 °Ccfu/mL100-------
Escherichia colicfu/100 mL0-------
Intestinal enterococcicfu/100 mL0-------
Pseudomonas aeruginosacfu/100 mL0-------
Physicochemical parameters
TurbidityNTU1-------
Colourmg/L Pt15-------
pH-6.5–9.57.5–8.27.3–8.26.5–9.5<6.5 or >9.5
Specific conductance at 25 °CµS/cm2500≤364≤454700250025003000>3000
Ammonium ion *mg/L0.5≤0.477≤0.545 0.511.53>3.0
Nitrates *mg/L50≤5.752≤8.407102550100>100
Nitrites *mg/L0.5≤0.033≤0.0890.030.50.51>1.0
Manganesemg/L0.05--0.050.411>1.0
Total iron mg/L0.2--0.21510<10
Chloridesmg/L250≤13.3≤18.760150250500>500
Total hardness CaCO3mg/L60–500≤203≤236-----
* Since the regulation of the Polish Minister of Infrastructure [37] lists the following forms of nitrogen: N-NH4, N-NO3 and N-NO2; the concentrations of nitrogen in the form of ammonium ion, nitrates and nitrites in surface waters was calculated using the following equations: NH4 = N-NH4/0.776, NO3 = N-NO3/0.226 and NO2 = N-NO2/0.304.
Table 3. Descriptive statistics of the microbiological parameters of rainwater versus flowing water and groundwater.
PointValid NMeanMedianMin.Max.Std. Dev.Coef. Var.Var. GroupCompliance * (%)
Total microbial count at 36 °C (cfu/mL)
P110816.7150043001369.2167.6Extremely high40
P210962.4900622800908.794.4High20
P31032586502200667.2205.3Extremely high60
P4–P7417.251603715.590.0High100
Total microbial count at 22 °C (cfu/mL)
P110150017001702900861.657.4High-
P210149015004203500919.061.7High-
P310130813501502800771.259.0High-
P4–P7467.577.5308526.038.5Moderate-
Coliforms (cfu/100 mL)
P11012.2007226.2215.1Extremely high-
P21045.76007231.869.7High-
P31058.457.5219019.132.8Moderate-
P4–P74000000Low-
Escherichia coli (cfu/100 mL)
P1100.20020.6316.2Extremely high90
P21013.5007023.6174.6Extremely high60
P31023.32743810.946.8High0
P4–P74000000Low100
Intestinal enterococci (cfu/100 mL)
P11027.11.507834.8128.3Very high40
P21046.342.5012035.676.8High10
P31017.17.507224.8144.8Very high20
P4–P74000000Low100
Pseudomonas aeruginosa (cfu/100 mL)
P11091.503513.2146.7Very high50
P2108.8003514.1160.2Extremely high60
P3109.4003212.8136.2Very high60
P4–P74000000Low100
* Compliance with the drinking water standard.
Table 4. Descriptive statistics of the physical parameters of rainwater versus flowing water and groundwater.
PointValid NMeanMedianMinMaxStd. Dev.Coef. Var.Var. GroupCompliance * (%)
Turbidity (NTU)
P1101.541.360.82.70.6240.1High20
P2102.821.950.26.72.3784.1High20
P3103.242.251.710.42.6682.0High0
P4–P740.380.250.080.930.39103.1Very high100
Colour (mg/L Pt)
P1104.593.400.97103.2771.3High100
P2106.583.040.59298.42127.9Very high90
P31060.752.53210927.0544.6High0
P4–P741.601.740.12.831.1974.4High100
Specific conductance at 25 °C (µS/cm)
P11040.25630.8516.2184.6422.8556.8High100
P21016.6013.436.9237.3210.0860.7High100
P310238.3246.518627227.6211.6Low100
P4–P74384.5392.531044359.1715.4Low100
* Compliance with the drinking water standard.
Table 5. Descriptive statistics of the tested chemical parameters of rainwater compared with those of flowing water and groundwater.
PointValid NMeanMedianMinMaxStd. Dev.Coef. Var.Var. GroupCompliance * (%)
pH **
P1106.907.326.27.90.507.25Low90
P2106.797.506.17.90.608.84Low80
P3107.267.456.87.80.314.27Low100
P4–P747.697.707.67.80.081.041Low100
Ammonium ion (mg/L)
P1100.0980.050.0030.420.13129.9Very high100
P2100.9400.800.063.721.08114.6Very high40
P3100.1460.150.0490.360.1066.9High100
P4–P740.0110.010.0080.0120.0017.6Low100
Nitrates (mg/L)
P1102.312.370.733.721.1449.3High100
P2101.681.530.144.251.3178.0High100
P3101.100.9750.372.40.5348.4High100
P4–P746.976.491.5913.34.8269.1High100
Nitrites (mg/L)
P1100.0100.0030.00020.0560.02171.1Extremely high100
P2100.1510.0240.00231.340.42276.2Extremely high90
P3100.0190.0180.00380.0620.0287.8High100
P4–P740.000450.000450.00020.00070.0064.2High100
Manganese concentration (mg/L)
P1100.0050.0040.00020.0110.0081.2High100
P2100.0210.0100.0010.0840.03131.5Very high80
P3100.1010.0880.01130.210.0661.5High20
P4–P740.0120.010.0060.0220.0158.1High100
Total iron concentration (mg/L)
P1100.03580.0310.0130.0660.0254.5High100
P2100.09550.0210.0030.6700.21215.1Extremely high90
P3100.5990.5410.2990.9690.2440.4High0
P4–P740.03250.0330.0030.0620.0399.6High100
Chlorides (mg/L)
P1101.0201.0250.1342.180.5856.757High100
P2101.3390.730.133.061.1686.643High100
P3101.6841.750.2013.111.0663.205High100
P4–P743.933.2853.1561.3835.18Moderate100
Total hardness CaCO3 (mg/L)
P11014.5912.13.373411.3577.792High0
P2108.167.5952.3144.1450.675High0
P310126.1128.510313911.288.944Low100
P4–P74194.75198.515722529.8915.35Low100
* Compliance with the drinking water standard. ** During the calculations of mean pH, the individual pH values were converted to the corresponding hydrogen ion activity.
Disclaimer/Publisher’s Note: The statements, opinions and data contained in all publications are solely those of the individual author(s) and contributor(s) and not of MDPI and/or the editor(s). MDPI and/or the editor(s) disclaim responsibility for any injury to people or property resulting from any ideas, methods, instructions or products referred to in the content.

