Abstract
This paper presents the results of experimental measurements of the number of aerosol particles in cleanroom air of a biotechnology laboratory for DNA analysis. The aerosol content in the air can harm the accuracy of any analysis performed. The experimental measurements demonstrate compliance with the ISO cleanroom requirements for class 7. The indoor environment of the investigated biotechnology laboratory cleanroom can be classified as ISO cleanroom class 8. The particle count values depend on the month in which the measurement is made. The location of the measurement site, on the other hand, does not have too much influence. Our results showed that the values of particle number in the laboratory ranged from 325,965 to 2,740,877 pc/m3 for particles of 0.5 μm and more. From these measurements, it can be concluded that the biotechnology laboratory premises were not very suitable locations to perform for the intended DNA tests since microbiological contamination had the capacity to distort the results of these tests. As such, the authors propose several strategies to improve the current situation. These strategies are based on changing the laboratory work organization and cleaning methodology. In addition, the monitoring of particles with a size of 5 µm or more is recommended.
1. Introduction
The control of airborne particles and biological contaminants is a key factor in various industries to avoid product defects, ensure process quality, and protect personnel and the environment (Romano et al., 2020) [1]. Additionally, cleanrooms and controlled environments are spaces where air pollution and thermohygrometric parameters are strictly controlled. Airborne particulate monitoring is mandated as part of good manufacturing practices (Raval et al., 2012) [2]. Sandle (2015) asserts that pharmaceutical manufacturing, both non-sterile and especially sterile processing, should be designed and manufactured in areas that minimize the potential for contamination by controlling environmental cleanliness and minimizing the possibility of personnel introducing contamination into the process. Noha et al. (2005) found that the airflow characteristics of a cleanroom for the photolithography process are largely influenced by the porosity of the access panel and the setting of the dampers, and that cross-contamination varies with source location and time as a result of the concentration ratio [3,4]. Most electronic cleanrooms are populated with process tools that emit high-temperature heat and particles. This accumulation of heat and particles within cleanrooms causes higher-than-normal airflow resistance and reduces cleanroom quality (Lin et al., 2011) [5]. The main purpose of cleanrooms is to prevent the contamination of cleanrooms with microparticles in order to ensure the reliability of precision processes and the associated safety of personnel. Cleanrooms can be found in high-precision industries (e.g., TFT LCDs), semiconductors, microelectronics, and biotechnology (Shih et al., 2011) [6]. Zhang et al. (2022) state that humans are the main source of particle contamination in biological cleanrooms [7]. The emitted particles can carry microorganisms and these can greatly affect cleanliness.
An aerosol is defined as a suspension of a liquid or solid in a gas, and the size of aerosol particles ranges from 0.001 μm to 100 μm (Colbeck et al., 2014) [8]. The particles can be of organic or inorganic origin. Inorganic particles include dust from the weathering of rocks; chemical fibers from clothing; dust from tire wear; unburned residues from liquid, gaseous, and solid fuels; dust from the wear or demolition of buildings; and, for example, cosmic dust (Koncz, 1975, states that an estimated 14.3–106 tonnes of cosmic dust settle on Earth each year) [9]. Organic dust includes, but is not limited to, residues of plant or animal origin (e.g., human skin debris), natural fibers, bacteria, viruses, fungi, molds, etc. Aerosols generated in the outdoor environment can enter the indoor environment in three basic ways: natural ventilation, mechanical ventilation, and infiltration (Chen and Zhao, 2011) [10]. The concentration and quality of aerosols can vary significantly from place to place. This is influenced by the activities that take place in the indoor environment or occur near the facility where the indoor environment is being assessed. It also depends on how the building’s ventilation system is designed and whether an air purification system is in place (Fermo et al., 2020) [11].
Low aerosol concentrations in indoor air are essential for many areas of human activity. These include the manufacture of sensitive electrical components and precision mechanical products, the pharmaceutical industry, the medical industry, and laboratories (Cobo et al., 2007) [12]. In the manufacture of sensitive electrical components, high concentrations of particles can lead to quality degradation or even failure or malfunction. In the pharmaceutical industry, this can lead to the contamination of drugs; in healthcare, it can increase the likelihood of the infection of patients in the operating room; and in laboratories, it can falsify experimental results (Kamar et al., 2015) [13]. Indoor environmental quality research has been conducted into, for example, pharmaceutical laboratories (Yang et al., 2021; Yau et al., 2012) [14,15], assisted reproduction laboratories (Boone et al., 1999) [16], and biosafety laboratories (Feng et al., 2019) [17]. Elevated aerosol concentrations in microbiology laboratories that do not use biological agents of concern do not pose an immediate threat to laboratory personnel but can directly affect experimental results. Indoor and outdoor air naturally contain microorganisms that can enter test samples. For example, the author Koncz (1975) reports that the number of living microorganisms in the street ranges from 1000 to 10,000 in 1 m3 [9]. At the same time, he assumes that their quantity in living spaces is even higher (Koncz, 1975) [9]. Thus, the interest of microbiological laboratory operators is to keep the concentration of living organisms in the air as low as possible. Correlations have been observed between the total number of particles in the indoor environment and the concentration of bacteria in the air, especially around operating rooms (Mirhoseini et al., 2015) [18]. Thus, there is an assumption that by reducing the concentration of particles in the air, the concentration of microorganisms in the air will naturally decrease.
There is some degree of a gap in scientific knowledge regarding air cleanliness in laboratories dedicated to microbiological research. The cleanliness of the internal environment is important in these laboratories because an increased concentration of particles can affect the results of measurements. For example, if a contaminated sample is sequenced, microorganisms may also that the sample did not originally contain may also be sequenced.
The authors of this study aim to fill this gap and contribute to the discussion on cleanrooms in laboratories. On this basis, a study was carried out. This experimentally verified the condition of the room climate during a particular procedure of a biotechnological laboratory cleanroom. The classification of air purity and the analysis of the measured particle concentrations in the laboratory room were conducted based on the evaluation of the measurement results. It was determined that, based on the classification, further possible measures may need to be pursued in order to reduce the particle concentration in the measured room. The aim of the article was also to determine the differences in measurements at different times of the year and to discuss the possible effects of atmospheric conditions on the classification of air purity.
2. Materials and Methods
2.1. Measured Cleanroom Area
The measurements were performed in a biotechnological laboratory for DNA analysis equipped with air filtration (HEPA—filter class E12: filters are designed to trap particles of 0.3–1 μm at an efficiency of EN 779 > 99.5%) and air conditioning systems. The ventilation of the biotechnology laboratory was carried out using positive pressure. The office was ventilated naturally (through windows). The laboratory was separated from the corridor by a door with a self-closing device. However, the door did not have a sufficient sealing function and did not separate the laboratory from the surroundings. The connecting corridor near the laboratory led to the area where the offices were located. This area was also separated by a door with a self-closing device. The floor area of the laboratory was 15.66 m2, the clear height of the room was 2.75 m and the volume of the room was 43.06 m3.
The control measurement was performed in the office area next to the biotechnology laboratory. The office was also equipped with air conditioning. The floor area of the office was 13.68 m2, the clear height of the room was 2.75 m, and the volume of the room was 37.62 m3.
The office and the laboratory were usually used by 1 to 2 people. PVC was used as flooring in the laboratory and office.
A schematic drawing of the biotechnology laboratory and office space can be seen in Figure 1 and Figure 2.
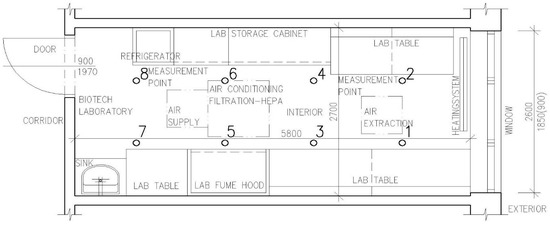
Figure 1.
Schematic drawing of the biotechnological laboratory (dimensions in mm; measurement points no. 1 to 8).
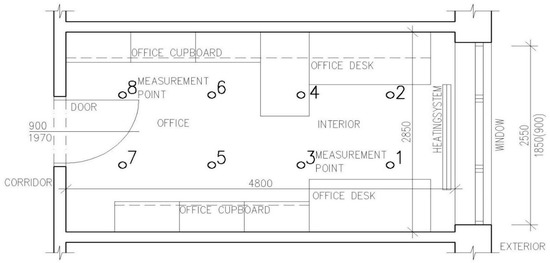
Figure 2.
Schematic drawing of the office (dimensions in mm; measurement points no. 1 to 8).
The laboratory room had undirected airflow (see 14644-4). The laboratory room was not kept under positive pressure.
2.2. Sampling Procedure
Particle count measurements were performed using a Fluke 985 laser particle counter (FLUKE, Everett, WA, USA). The particle counter had a valid calibration until February 2023. The measurements were performed on a total of six channels (0.3 μm, 0.5 μm, 1.0 μm, 2.0 μm, 5.0 μm, and 10.0 μm). The basis for determining the measurement method was the technical standard ISO 14 644-1 (hereinafter referred to as the technical standard) [19]. The ISO 14 644-1 air purity classes are listed in Table 1. A network of eight measurement points was established in each room. These points were located in the center of gravity of the equally sized areas into which each room was divided. The number of points was increased compared to the requirements of the technical standard for the statistical processing of measurement data. The measurements were performed at a vertical height of h = 1500 mm. The mouth of the measuring probe of the device was directed vertically upwards. The volume of the aspirated air for each measurement was V = 5.7 dm3. The suction time was t = 120 s. The classification of the air purity class of the laboratory and the office was carried out according to part 4 of the technical standard ISO 14 644-1.

Table 1.
Air Cleanliness Classes according to the technical standard ISO 14644-1 [16].
In addition, room temperature t [°C], relative humidity ϕ [%], and outdoor air velocity v [m·s−1] were measured using KIMO AMI 300 multifunction equipment (KIMO Instruments, Saint-Priest, France). Absolute atmospheric pressure was measured using a Greisinger GPB 3300 barometer (Greisinger Electronic GmbH, Regenstauf, Germany), with a measurement deviation of ±2 hPa. The values related to the microclimatic conditions were measured a total of three times: namely, at the beginning of the measurement of the number of particles, approximately in the middle of the measurement, and at the end of the measurement. The arithmetic mean was then calculated from the individual values. The variability of the measured values was very low (coefficient of variation less than 0.01%). Two people were present in the room during the measurement, i.e., a full operation measurement strategy was chosen.
In total, three sets of measurements were performed in different months of the year—February, May, and July. These measurements will be referred to hereafter as measurements A, B, and C.
2.3. Statistical Processing of the Measured Data
TIBCO Statistica 14 software (TIBCO, Palo Alto, CA, USA) was used for the statistical processing of the measured data. All tests were performed at a significance level of α = 0.05. With normal distribution and homogeneous dispersion of the data set, ANOVA and Tukey’s multiple comparison tests were used to test the hypotheses that statistically significant differences occur at the significance level.
In other cases, non-parametric Kruskal–Wallis multiple comparison tests were performed.
When two sets of measurement data were compared, the parametric t-test or the nonparametric Mann–Whitney test was used.
The Shapiro–Wilk test was used to test the hypothesis of whether the data set had a normal distribution. The Shapiro–Wilk test uses a statistic, W, calculated from the values of the data and the expected values for a normal distribution. The Shapiro–Wilk test is very sensitive to deviations from the normal distribution, but it can also be sensitive to the size of the data set. For this reason, the Q–Q plot was used as a supporting method. The homogeneity of variance of the data set was tested using Levene’s test.
3. Results
3.1. Microclimatic Conditions
Table 2 shows the values of temperature (t), relative humidity (ϕ), and absolute pressure (pa). The air velocity was also measured for the outdoor environment. From the results, it can be asserted that the temperature in the measured area of the laboratory was kept approximately constant. The temperature in the office was more affected by the ambient atmospheric conditions. The value of relative humidity varied significantly in both measured rooms. In February, a hygienically unsatisfactory value for relative humidity was measured in both the laboratory and the office.
Table 2.
Microclimatic conditions (average values).
3.2. Classification of Air Cleanliness Classes in the Laboratory
The diagrams in Figure 3A–C show the cumulative particle number values for the respective fractions of 0.5 μm, 1.0 μm, and 5.0 μm. The measured values were compared with the limit values specified for ISO class 7 (indicated by the red dashed line in the graph). The cumulative particle number limit values for each fraction and ISO class according to EN ISO 14644-1. According to the ISO standard under consideration, once the measured value exceeds the limit value at any point, the measured area does not meet the cleanliness class. The laboratory space could be classified as ISO class 8 on the basis of the measured values and the technical standard employed.
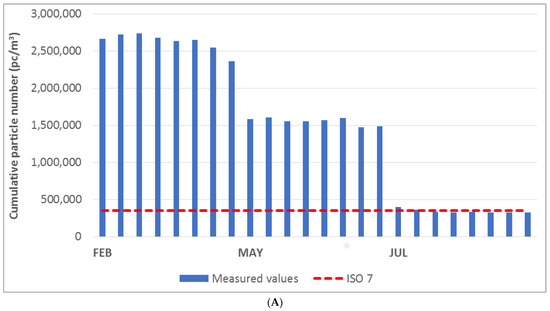
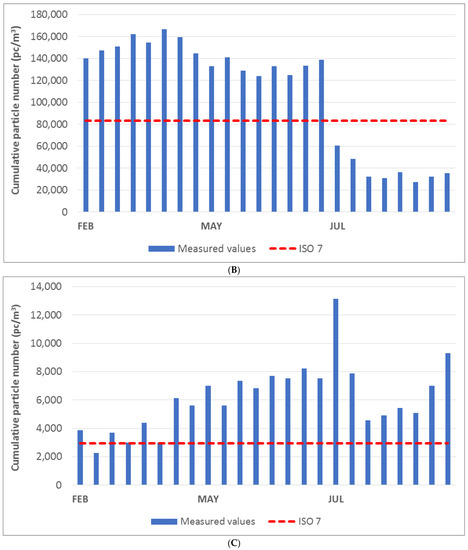
Figure 3.
(A) Cumulative particle number for fraction > 0.5 μm in the laboratory. (B) Cumulative particle number for fraction > 1.0 μm in the laboratory. (C) Cumulative particle number for fraction > 5.0 μm in the laboratory.
The diagrams show that the laboratory area did not meet the limit for ISO class 7 in any month of measurement. In the month of June, the measured cumulative particle number values were significantly lower than those observed in other months. The exception to this was the cumulative particle size value above 5.0 μm.
3.3. Classification of Air Cleanliness Classes in the Office
The cumulative particle values for the 0.5, 1.0, and 5.0 μm fractions in the office area are given in Figure 4A–C. It is clear from the diagrams that the limit values given for ISO class 7 were exceeded in all cases (individual measurements, individual fractions). The limit values for ISO class 8 were exceeded for cumulative particle values for >5.0 μm in all months of measurement (see diagram in Figure 4C). Based on the measurement results, the office area could therefore be classified as ISO 9.
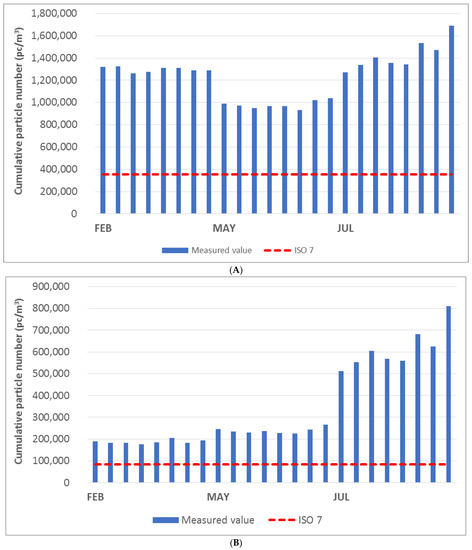
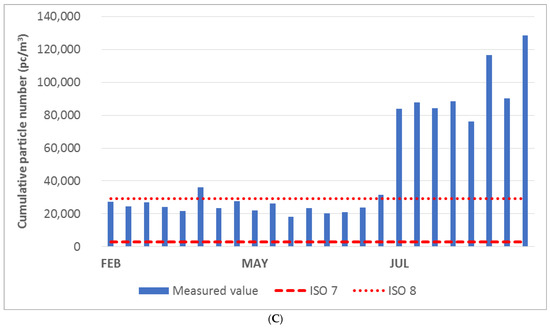
Figure 4.
(A) Cumulative particle number for fraction > 0.5 μm in the office. (B) Cumulative particle number for fraction > 1.0 μm in the office. (C) Cumulative particle number for fraction > 5.0 μm in the office.
3.4. Comparison of the Difference Values
First, we tested the hypothesis of whether individual particle number differences were statistically significantly different in each month. This hypothesis was tested for both the laboratory and the office space. Table 3 shows that statistically significant differences were found between February and July for the following fractions: 0.3–0.5 μm, 0.5–1.0 μm, 1.0–2.0 μm, and 5.0–10.0 μm. However, for the smaller size fractions (0.3–0.5 μm, 0.5–1.0 μm, 1.0–2.0 μm), all values were very close to the α significance level.
Table 3.
Calculated p values for the laboratory.
The calculated p values for the office areas are shown in Table 4. From this table, it can be seen that the values were often very close to the α significance level. The exception was in the difference between February and May for the 5.0–10.0 μm fraction or the >10.0 μm fraction.
Table 4.
Calculated p values for the office.
Next, a hypothesis was tested as to whether there were statistically significant differences in particle counts between the measured areas, i.e., the laboratory and the office area, in the month in which the measurements were taken. Across all months and all fractions, the hypothesis that there were no statistically significant differences was rejected at the α = 0.05 significance level. The p values were always less than 0.001.
4. Discussion
The results of the measurements showed that the laboratory area could be classified as falling into ISO cleanliness class 8. This result was similar to those of the measurements that were performed in a different pharmaceutical laboratory (Yau et al., 2012) [15]. In this instance, pharmaceutical laboratories were classified as either ISO cleanliness class 7 or 8. Unfortunately, this study did not contain information about HVAC, mode of work, and materials used in more detail.
A study by (Yang et al., 2021) [14] was carried out in a biopharmaceutical production line. This study contained the description of HVAC, layout, and other equipment in more detail. Measured rooms were equipped with a buffer room and airlock to prevent the invasion of pollutants. Due to the HVAC used, the measured particle number values were very low. These values ranged from 281 to 3194 pc/m3 (for particles larger than 0.5 μm) depending on the location of the measurement and the type of room. HEPA H14 was used for air cleaning in these rooms, i.e., a filter was used with the ability to capture up to 99.995% of particles with a diameter greater than 0.3 μm. For comparison, in our study, the HEPA E12 filter was used (99.5% particle capture with a diameter greater than 0.3 μm). In the study by (Tan et al., 2021) [20], HEPA H13 was used in the operating rooms. Here, values ranged from 7944 to 21,631 pc/m3 for PM 0.5. The authors (Kamar et al., 2015) [13] state that the HEPA filter H14 was probably used in the operating room. Here, the values ranged from nearly 10,000 to approximately 70,000 pc/m3 depending on the location of the measurement point. However, it is not possible to estimate from the results of studies as to why such large differences between the results of different research, e.g., the Yang et al. (2021) study and the Kamar et al. (2015) study. Comparing the results of our study with those of other studies, it is clear that the use of the type of filter can have a decisive influence on the number of particles in the room.
There are no national standards for laboratory room cleanliness, the factor tested in our study. Yau et al. (2012) state that the laboratory area must meet at least ISO 14644 class 7. This is likely an internal standard of the laboratory. From the results of our study, the biotechnology laboratory space was classified as ISO class 8. Particles with a size of 5.0 μm and above play an important role in this from the point of view of the possibility of sample contamination by microorganisms. The authors (Tan et al., 2021) [20] state that the measurement of PM5 and PM10 can be used to monitor microbiological contamination. Unfortunately, the cumulative particle counts for the fraction >5.0 μm in the laboratory exceeded the limit value for ISO class 7. There are several ways to further reduce the particle concentration.
First of all, these are structural and technical adaptations that can be made to laboratory rooms. The laboratory should be equipped with a buffer room and an airlock (see Yang et al., 2021) [14]. Further, Feng et al. (2019) mention ensuring appropriate air distribution in the room [17]. This can be ensured by an adequate and stable pressure gradient between the laboratory and the surroundings, as well as by setting up an equalization room (Feng et al., 2019). Other methods can include modifying the ventilation system, increasing the level of filtration, etc. However, all these modifications would require structural engineering modifications that are costly and not feasible under the given conditions.
Another strategy to reduce particulate concentrations may be to change the way the laboratory is used, i.e., update or change laboratory regulations altogether. These changes may relate to limiting or reducing the number of people moving around the laboratory, which naturally increases particulates in the indoor environment (Mukai et al., 2009), (Whyte, 2001) [21,22]. In addition, changes may relate to the requirements for clothing used in the laboratory (requiring the wearing of cleanroom coveralls, e.g., with an integrated hood, or requiring the wearing of headgear), with the prohibition or restriction of the use of materials that release large amounts of particles (paper cut, cotton fabrics, etc.). For comparison, Zhang et al. (2022) reported in an experiment in a biopharmaceutical cleanroom that, according to the mass balance equation for particles, the quantitatively equivalent value of human particle emission rates is 50,000–180,000 particles per minute per person [7]. Strauss et al. (2011) state that humans emit approximately 1.7 × 10⁴ particles per minute into the cleanroom, increasing the local particle concentration by 1742 ± 481 pc/m3 per person [23]. Laboratory regulations should also include stricter rules for cleaning. The actual behavior of workers also affects the number of particles in the air, e.g., making up, moving materials, etc. Other requirements for cleanroom maintenance can be found, for example, in EN ISO 14644-5 [24]. This second type of strategy can be used to reduce the number of particles in a microbiology laboratory space because the financial cost required to implement it is relatively low.
Once more stringent requirements for laboratory operations have been introduced, it is important to ensure that the frequency of particles in the laboratory space is measured at regular intervals to monitor the effectiveness of the measures. It would also be advisable to combine measurements of particle abundance with bioaerosol measurements (Parat et al., 1999) [25].
Particle concentration in laboratories was generally lower in the month of July, especially for the cumulative values of particles >0.5 μm and >1.0 μm. In these cases, the measured values were close to the limits for ISO purity class 7. This fact may have been due to the number of people moving through this space. The month of July is the end of the academic year and after this point the workload in the laboratories decreases.
When using the control measurements in the office, the opposite was true. In general, higher particle concentrations were measured in July. This was especially the case for particles larger than 5.0 µm. This potentially indicated a more intensive air exchange between the interior of the office and the exterior. Air exchange is normally provided by open windows. The university building was located near streets with increased traffic intensity.
5. Conclusions
The cleanliness of the indoor environment of cleanrooms is expressed by the content of aerosol particles in the air of the measured room. The standard EN ISO 14644-1 defines the cleanliness classes of cleanroom air as a function of the concentration of aerosol particles and the diameter of these particles [18]. The experimental measurements presented in this paper confirmed that the indoor environment of the biotechnology laboratory corresponds to the air cleanliness classes in ISO 8. Based on the evaluation of the measurement results, it is recommended that organizational and technical modifications be made to laboratory operation. The results of this experimental measurement in the biotechnology laboratory confirm the results of previous comparable experiments conducted in other types of cleanrooms (e.g., Zhang et al., 2022; Strauss et al., 2011) [7,23].
Author Contributions
Conceptualization, P.J.; Methodology, P.J. and P.T.; Data curation, T.V. and J.R.; Writing—original draft, P.J., P.T. and G.M.; Writing—review & editing, T.V. and J.R.; Visualization, T.V. and J.R.; Supervision, J.R. All authors have read and agreed to the published version of the manuscript.
Funding
This research was funded by v.2020.3 Kultúrna a edukačná grantová agentúra Ministerstva školstva, vedy, výskumu a športu Slovenskej republiky: 015TUKE-4/2022.
Institutional Review Board Statement
Not applicable.
Informed Consent Statement
Not applicable.
Data Availability Statement
The data presented in this study are available on request from the corresponding author. The data are not publicly available because upon agreement with the laboratory operator, the measurement results will only be placed on the local data storage.
Conflicts of Interest
The authors declare no conflict of interest.
References
- Romano, F.; Milani, S.; Joppolo, C.M. Airborne particle and microbiological human emission rate investigation for cleanroom clothing combinations. Build. Environ. 2020, 180, 106967. [Google Scholar] [CrossRef]
- Raval, J.S.; Koch, E.; Donnenberg, A.D. Real-time monitoring of non-viable airborne particles correlates with airborne colonies and represents an acceptable surrogate for the daily assessment of cell-processing cleanroom performance. Cytotherapy 2012, 14, 1144–1150. [Google Scholar] [CrossRef] [PubMed]
- Sandle, T. Pharmaceutical Microbiology: Essentials for Quality Assurance and Quality Control; Woodhead Publishing: Sawston, UK, 2015. [Google Scholar]
- Noha, K.C.; Oha, M.D.; Leeb, S.C. A numerical study on airflow and dynamic cross-contamination in the super cleanroom for photolithography process. Build. Environ. 2005, 40, 1431–1440. [Google Scholar] [CrossRef]
- Lin, T.; Tung, Y.C.; Hu, S.C.; Chen, Y.J. Experimental study on airflow characteristics and temperature distribution in non-unidirectional cleanrooms for electronic industry. Build. Environ. 2011, 46, 1235–1242. [Google Scholar] [CrossRef]
- Shih, Y.C.; Yang, A.S.; Lu, C.W. Using air curtain to control pollutant spreading for emergency management in a cleanroom. Build. Environ. 2011, 46, 1104–1114. [Google Scholar] [CrossRef]
- Zhang, F.; Shiue, A.; Fan, Y.; Liu, J.; Meng, H.; Zhang, J.; Leggett, G. Dynamic emission rates of human activity in biological cleanrooms. Build. Environ. 2022, 226, 109777. [Google Scholar] [CrossRef]
- Colbeck, I.; Lazaridis, M. Aerosol Science: Technology and Application; John Wiley & Sons, Ltd.: Hoboken, NJ, USA, 2014. [Google Scholar]
- Koncz, I. Dust Removal and Separation; Alfa: Bratislava, Slovakia, 1975. (In Czech) [Google Scholar]
- Chen, C.; Zhao, B. Review of relationship between indoor and outdoor particles: I/O ratio, infiltration factor and penetration factor. Atmos. Environ. 2011, 45, 275–288. [Google Scholar] [CrossRef]
- Fermo, P.; Comite, V.; Falciola, L.; Guglielmi, V.; Miani, A. Efficiency of an Air Cleaner Device in Reducing Aerosol Particulate Matter (PM) in Indoor Environments. Int. J. Environ. Res. Public Health 2020, 17, 18. [Google Scholar] [CrossRef] [PubMed]
- Cobo, F.; Grela, D.; Concha, Á. Airbone particle monitoring in clean room environments for stem cell cultures. Biotechnol. J. 2008, 3, 43–52. [Google Scholar] [CrossRef] [PubMed]
- Kamar, H.M.; Kamsah, N.; Yinn, W.K.; Musa, M.N.; Deris, M.S. Field measurement of airbone particulate matters concentration in a hospital´s operating room. J. Teknol. (Sci. Eng.) 2015, 77, 63–67. [Google Scholar] [CrossRef]
- Yang, Z.; Hao, Y.; Shi, W.; Shao, X.; Dong, X.; Cheng, X.; Li, X.; Ma, X. Field test of pharmaceutical cleanroom cleanliness subject to multiple disturbance factors. J. Build. Eng. 2021, 42, 103083. [Google Scholar] [CrossRef]
- Yau, Y.H.; Chew, B.T.; Saifullah, A.Z.A. Studies on the indoor air quality of Pharmaceutical Laboratories in Malaysia. Int. J. Sustain. Built Environ. 2012, 1, 110–124. [Google Scholar] [CrossRef]
- Boone, W.R.; Johnson, J.E.; Locke, A.-J.; Crane, M.M.; Price, T.M. Control of air quality in an assisted reproductive technology laboratory. Fertil. Steril. 1999, 71, 150–154. [Google Scholar] [CrossRef] [PubMed]
- Feng, X.; Zhang, Y.; Xu, Z.; Song, D.; Cao, G.; Liang, L. Aerosol containment by airflow in biosafety laboratories. J. Biosaf. Biosecurity 2019, 1, 63–67. [Google Scholar] [CrossRef]
- Mirhoseini, S.H.; Nikaeen, M.; Khanahmad, H.; Hatamzadeh, M.; Hassanzadeh, A. Monitoring of airborne bacteria and aerosols in different wards of hospitals—Particle counting usefulness in investigation of airborne bacteria. Ann. Agric. Environ. Med. 2015, 22, 670–673. [Google Scholar] [CrossRef] [PubMed]
- ČSN EN ISO 14644-1; Cleanrooms and Associated Controlled Environments—Part 1: Classification of air Cleanliness by Particle Concentration. ISO: Geneva, Switzerland, 2019.
- Tan, H.; Wong, Y.K.; Nyakuma, B.B.; Kamar, H.M.; Wen Tong Chong, W.T.; Wong, S.L.; Kang, H.S. Systematic study on the relationship between particulate matter and microbial counts in hospital operating rooms. Environ. Sci. Pollut. Res. 2022, 29, 6710–6721. [Google Scholar] [CrossRef] [PubMed]
- Mukai, C.; Siegel, J.A.; Novoselac, A. Impact of Airflow Characteristics on Particle Resuspension from Indoor Surfaces. Aerosol Sci. Technol. 2009, 43, 1022–1032. [Google Scholar] [CrossRef]
- Whyte, W. Cleanroom Technology: Fundamentals of Design, Testing and Operation; John Wiley & Sons Ltd.: Hoboken, NJ, USA, 2001. [Google Scholar]
- Strauss, L.; Larkin, J.; Zhang, K.M. The use of occupancy as a surrogate for particle concentrations in recirculating, zoned cleanrooms. Energy Build. 2011, 43, 3258–3262. [Google Scholar] [CrossRef]
- ČSN EN ISO 14644-5; Cleanrooms and Associated Controlled Environments—Part 5: Operations. ISO: Geneva, Switzerland, 2005.
- Parat, S.; Perdrix, A.; Mann, S.; Baconnier, P. Contribution of particle counting in assessment of exposure to airborne microorganisms. Atmos. Environ. 1999, 33, 951–959. [Google Scholar] [CrossRef]
Disclaimer/Publisher’s Note: The statements, opinions and data contained in all publications are solely those of the individual author(s) and contributor(s) and not of MDPI and/or the editor(s). MDPI and/or the editor(s) disclaim responsibility for any injury to people or property resulting from any ideas, methods, instructions or products referred to in the content. |
© 2023 by the authors. Licensee MDPI, Basel, Switzerland. This article is an open access article distributed under the terms and conditions of the Creative Commons Attribution (CC BY) license (https://creativecommons.org/licenses/by/4.0/).