Article

Cross-Regional Dynamic Transfer Characteristics of Liquid Oil Contamination Induced by Random Contact in Machining Workshops in Shanghai, China

1
School of Environment and Architecture, University of Shanghai for Science and Technology, Shanghai 200093, China
2
School of Mechanical Engineering, Tongji University, Shanghai 200092, China
*
Author to whom correspondence should be addressed.
Appl. Sci. 2022, 12(9), 4765; https://doi.org/10.3390/app12094765
Submission received: 7 April 2022 / Revised: 5 May 2022 / Accepted: 7 May 2022 / Published: 9 May 2022
(This article belongs to the Topic Industrial Engineering and Management)

Abstract

:
In industrial sites, the movement and contact behaviors of workers are random, but their frequency and statistical characteristics can be determined. Particularly in machining workshops, metalworking fluids (MWFs) cause liquid oil contamination on the processed workpieces, and the contamination spreads to the entire workshop given the random contact of workers or the handling of workpieces. This study proposes a contact transmission model based on the Markov chain to quantify oil contamination transfer. First, the transfer efficiency between the glove and the workpiece, which is regarded as a key model parameter in this research, was determined through experiments. The model was used to characterize and predict the spread of oil contamination across different regions, including production and assembly areas. Specifically, the oil contamination concentrations on workbench surfaces in seven locations of a machining workshop in Shanghai GKN HUAYU Driveline Systems Co., Ltd. (SDS) were measured on-site. Findings showed that the model could feasibly depict the transfer process of oil contamination across different surfaces. Then, the variation law of oil contamination concentration on the workbench surfaces over time was analyzed, the oil contamination distribution map of the entire workshop plane was drawn, and the effectiveness of two cleaning measures to reduce oil contamination concentrations was compared. The proposed contact transmission model offers a basis for identifying highly polluted surfaces in machining workshops and controlling the spread of liquid oil contamination.

1. Introduction

The development of the machining industry has led to the massive use of metalworking fluids (MWFs). When machine parts collide strongly, MWFs atomize or evaporate, generating numerous solid particles and oil mist droplets. Then, these pollutants spread to the entire workshop environment along with the airflow in the machining workshop [1,2,3]. Particles with a diameter of fewer than 10 μm can stay in the air for a long time and thus are regarded as suspended particles; these pollutants easily enter the respiratory system and seriously endanger human health [4,5]. Studies have shown that suspended oil droplets can pass through the respiratory tract to reach and be deposited in the lungs [6,7]. Long-term exposure to suspended particles can cause respiratory diseases, such as sinusitis, asthma, and hoarseness of the throat [8,9], and it may even lead to kidney cancer [10]. Meanwhile, anatomized MWFs are thrown off the inner wall of machines along with the rotation of turning tools to form surface-adhering oil contamination. Large-size droplets in the air also settle on surfaces in the workshop to form sedimentary contamination [7]. This kind of surface oil contamination presents challenges to the normal operation of machines [11,12]. A study has shown that 60% to 80% of the hydraulic system’s failure events of computer numerical control turning tools are caused by oil contamination on surfaces [13].
Most of the existing research focuses on suspended particles in workshops, particularly the emission mechanism of oil mist droplets during cutting and their transfer process in the air. The three generally recognized emission mechanisms are evaporation–condensation, impact-induced splashing, and fall-off [14,15]. MWFs are emitted into the air through the abovementioned three ways to form suspended particles. Thus, the concentration of suspended particles in the air should be measured, and the movement of suspended particles based on indoor airflows should be predicted. Long et al. [16] developed an online monitoring system to monitor the dynamic concentration of oil mist in the air in a workshop in real-time. Their results showed that the oil mist concentration seriously exceeded the limit of the machining workshop. Wang et al. [17,18] studied the movement of indoor oil mist droplets in two forms; namely, upper-receiving and push–pull ventilation, through computational fluid dynamics (CFD) simulation. They also studied the oil mist diffusion between two adjacent workshops.
The abovementioned findings demonstrated the spread of oil mist droplets in workshop environments and their distribution characteristics. Numerical simulation is a commonly used research method because it can effectively reproduce the dynamic movement of oil mist. However, few studies focused on the spread of liquid oil contamination on workshop surfaces. As the oil mist itself undergoes sedimentation, it forms deposited liquid oil contamination on surfaces. In addition, MWFs adhere to workpieces during machining. Similarly, oil contamination on workbenches cannot be ignored. Figure 1 shows the distribution of oil contamination on different workbenches in a workshop in Shanghai GKN HUAYU Driveline Systems Co., Ltd. (SDS). Given the contact behavior of workers, the oil contamination on the surface is transferred through workers’ hands (active media) and workpieces (passive media), and it alters the quality of various surfaces in the workshop, including the production and assembly areas. Furthermore, as the contact behaviors between people and surfaces are extremely random, the Markov chain is introduced in this study to describe the process. The Markov chain is a commonly used mathematical model for describing random processes, and it can represent the transition process of discrete random states in the state space. In particular, for any moment, the state transition probabilities before and after this moment are independent of each other. The Markov chain was widely used for solving various pollutant transmission problems [19,20].
In fact, most existing studies have directly used the Markov chain [21,22] or combined it with CFD [23,24,25] to predict the spread process and distribution of bacteria and viruses in indoor environments. Nicas et al. [26] used the Markov chain to predict the number of pathogens in air, human hands, and surfaces of textiles and non-textiles in a room. They found that the number of pathogens on textile surfaces accounted for a large proportion. Consequently, they proposed that regular cleaning of textile surfaces can effectively reduce the risk of virus infection. For the spread of pathogens caused by contact behavior, notable results were also obtained [27,28,29,30]. Furthermore, Hao et al. [31] established a surface contamination transmission network based on the Markov chain and reproduced two norovirus outbreaks on passenger planes. They found that passengers in the aisle are at greater risk of contracting the virus. Xiao et al. [32] simulated the dynamic spread of Staphylococcus in a ward by using a Markov chain model. After obtaining the temporal and spatial patterns of bacterial distribution, they analyzed the effectiveness of two interventions in inhibiting the spread of bacteria on surfaces. The abovementioned research results indicate that the Markov chain can be used to describe the spread of pollution caused by contact behavior.
Offices and hospitals, and even airplane cabins, have narrow spaces. Their indoor layouts are compact, and the distance between their surfaces is extremely close. From a contact behavior standpoint, contamination can easily spread to any surface in the entire space of such sites. By contrast, the span of industrial sites is large, and the layout of machining workshops is usually divided into multiple areas with varying functions, such as production and assembly areas, with each area divided into multiple units. These factors cause the spread of oil contamination in industrial sites to be more complicated than those in civil buildings. Another consideration is that the workbenches of different units are far apart in industrial sites. In addition to activities in one’s own working area, workers rarely move to other areas during working hours. In other words, the workpieces are the dominant carrier for the spread of oil contamination across regions in workshops.
Different from the research about civil sites, this study uses the Markov chain to investigate the spread of oil contamination across different areas in workshops. For a production area, oil pollution is spread in each production unit, but this is not the case between adjacent production units. For an assembly area, the source of oil contamination is the workpiece, and then the transportation of the workpiece interlinks the spread of oil contamination between two areas. Here, the proposed contact transmission model based on the Markov chain is used to quantify the transfer of oil contamination. The feasibility of the proposed model is verified via on-site measurement. On the basis of the proposed model, the variation law of oil contamination concentration on workbench surfaces in different areas over time is analyzed, the oil contamination distribution map of the entire workshop plane is drawn, and the effectiveness of different cleaning measures to reduce the overall concentration of oil contamination in the workshop is compared.

2. Method

2.1. Contact Transmission Model for Oil Contamination

Workers’ processing, handling, and assembling of workpieces cause the spread of oil contamination. The transfer process of oil contamination occurs in three states, namely, by means of workers’ gloves, workbench surfaces, and workpiece surfaces. The transfer process follows the principle of mass conservation. Here, the Markovian process was introduced to analyze the transfer of oil contamination on various surfaces in a workshop. The workbench surfaces were numbered continuously from 1 to m. Then, the gloves were numbered continuously from m + 1 to m + q, where q represents the number of workers. A state space S was formulated according to Equation (1). Oil contamination carried by the workpieces can be regarded as a process parameter in which oil contamination is transferred between the glove and the workbench. Thus, in this study, the state space S did not consider the state of oil contamination carried by the workpieces.
S = 1 ,   2 ,   ,   m ,   m + 1 ,   m + 2 ,   ,   m + q
The modeling process of the contact transmission model can be described as follows.
According to the actual layout of the SDS workshop, the workshop is divided into two main areas: the production area and the assembly area. The production area is composed of I production units. Assume that each production unit has a machines and b workbenches, and each machine can produce c workpieces per minute. Each workpiece carries d mg of liquid oil contamination after a cutting is completed. Meanwhile, the assembly area is composed of J assembly units. In general, an assembly worker oversees each assembly unit to complete the subsequent manipulation. For the production area, although each production unit is adjacent to each other, the workers only move to their own production unit. In other words, oil contamination is not transferred between the adjacent production units. For a single production unit, the worker puts the unprocessed workpiece into a machine. After waiting for the production to be completed, the worker takes out the workpiece and puts it on a workbench. Then, the worker puts in a new workpiece and repeats the process. Workers place the workpiece on the workbench to mark and lubricate it. When the number of workpieces loaded on each workbench reaches e, they are transported to the assembly area. Usually, automatic transport vehicles are used in the workshop to transport workpieces from the production area to the assembly area, forming a connection between the two areas. However, the automatic vehicles transport the workpieces from the workbench in the production area to the assembly unit in the assembly area in a random manner. After the workers in the assembly unit perform secondary processing, such as assembling and wiping, the workpieces are put into a new transport vehicle and sent to the warehouse. The surface of the warehouse represents the terminated state of the oil contamination, and the transfer process inside the workshop is unaffected; thus, this state is also not included in the state space S.
On the basis of the assumed scenario, the oil contamination concentrations of workpieces, workbenches (or assembly tables), and workers’ gloves at a certain time interval t were calculated. The workpiece was regarded as the medium through which oil contamination spreads across regions, and its concentration was considered to be the main factor affecting the distribution of oil contamination in the assembly area. The calculation of oil contamination concentration is described in the next subsections.

2.2. Transfer of Oil Contamination

The concentration of oil contamination for each state in state space S at different times is calculated according to the principle of mass conservation. The transfer of oil contamination can be described using the discrete-time Markov chain following the research on the transmission of the SARS virus in a hospital by Xiao et al. [28]. The quantity of oil contamination on workbenches and gloves is calculated according to Equations (2) and (3). Here, the transfer process does not consider the influence of MWF type and other factors.
N s = τ h s N h A h A c τ s h N s A s A c + N s = A c A h τ h s N h + 1 A c A s τ s h N s
N h = τ s h N s A s A c τ h s N h A h A c + N h = A c A s τ s h N s + 1 A c A h τ h s N h
In the contact transmission model, oil contamination is considered to be evenly distributed on the surface. Equations (4) and (5) are used to calculate the oil contamination concentration in various states.
C s = A c A h τ h s C h A h + ( 1 A c A s τ s h ) C s A s A s = ( 1 A c A s τ s h ) C s + A c A s τ h s C h
C h = A c A s τ s h C s A s + ( 1 A c A h τ h s ) C h A h A h = A c A h τ s h C s + ( 1 A c A h τ h s ) C h
By using matrix notations, Equations (4) and (5) can be written in compact form as follows:
C s C h = C s C h 1 A c A s τ s h A c A h τ s h A c A s τ h s 1 A c A h τ h s
where C s and C h represent the oil contamination concentration on workbenches and gloves after one touching behavior, and C s and C h represent the oil contamination concentration before touching.
According to Equations (2)–(5), oil contamination on surfaces after one touching action only depends on the state before the action rather than the sequence of states that precede it, which conforms to the definition of Markov chains. Therefore, each behavior consisting of a series of touching actions can be regarded as a discrete-time Markov chain, while the surfaces of workbenches and gloves can be regarded as different states in the Markov chain. The square matrix in Equation (6) can be regarded as a simple transition matrix for the Markov chain.
For the entire workshop, we assume the presence of m + q representative surfaces, including the workbench and glove surfaces. For one type of behavior, including n touching actions, the final conditions can be obtained as follows:
C n = C n 1 P n E
with C k = C 1 k ,   C 2 k ,   ,   C m + q k , k numbers from 0 to n, P n = 1 A c i , j A i τ i j A c i , j A i τ i j A c i , j A j τ j i 1 A c i , j A j τ j i , i and j represent any two contacting surfaces, and E = diag e b 1 Δ T , e b 2 Δ T , , e b m + q Δ T , where C n indicates a row vector of m + q elements representing the oil contamination concentration on surfaces after the nth contact; C i k refers to the oil contamination concentration on the ith surface after the kth contact; P n is the transition matrix with a dimension of m + q × m + q in the nth contact when the ith surface comes in contact with the jth surface, and the remaining elements in the transition matrix are all 1; E is a diagonal matrix with the dimension of m + q × m + q to indicate the effect of evaporation of liquid oil contamination on the surfaces; b i is the evaporation rate of the liquid oil contamination on the ith surface (this work does not consider evaporation, so b i equals zero); and Δ T is the time duration between the prior behavior and the present one.

3. Experiments for Transfer Efficiency

As an input of the model, transfer efficiency is an important parameter in ensuring the accuracy of the simulation result. Different types of materials and the magnitude of contact force may lead to varying transfer efficiencies. Furthermore, other influencing factors, such as contact time and effective contact area, should be considered. Most of the workbench surfaces in the workshop are made of iron sheets. Here, the transfer efficiencies of oil contamination from the iron piece to the glove and from the glove to the iron piece were determined through experiments.
The measurements of transfer efficiencies from the iron pieces to the gloves were used to describe the transfer process. Different masses of weights were selected for the rubber gloves to replace the different contact forces. First, an analytical balance (ME104/02, METTLER TOLEDO, Shanghai, China) was used to weigh the clean iron piece, denoted as m 1 . Second, a certain amount of MWFs was uniformly applied to the iron piece, and then the piece was weighed again with an analytical balance, with the reading denoted as m 2 . Third, a pair of tweezers was used to put a glove with a certain mass of weight on the iron piece for 10 s without initial velocity, and then the piece was weighed with the reading and denoted as m 3 . After collecting the data, the transfer efficiency was calculated as m 2 m 3 m 2 m 1 [28]. The measurement method of the transfer efficiency from the gloves to the iron pieces was the same. Each contact time was guaranteed to be 10 s, and other influencing factors were the same in the experiment.
The contact force was reflected by controlling the mass of the weight from 50 to 500 g at an equal interval of 50 g. The transfer efficiency experiment was repeated three times for each contact force, and then the corresponding transfer efficiency was calculated. The results showed that the transfer efficiency of oil contamination from the rubber glove to the iron piece fluctuates between 0.3 and 0.4, and the transfer efficiency from the iron piece to the rubber glove is generally stable at 0.5. Therefore, in this model, the transfer efficiency of oil contamination from the glove to the workbench (or workpiece) and from the workbench (or workpiece) to the glove was set to 0.35 and 0.5, respectively.

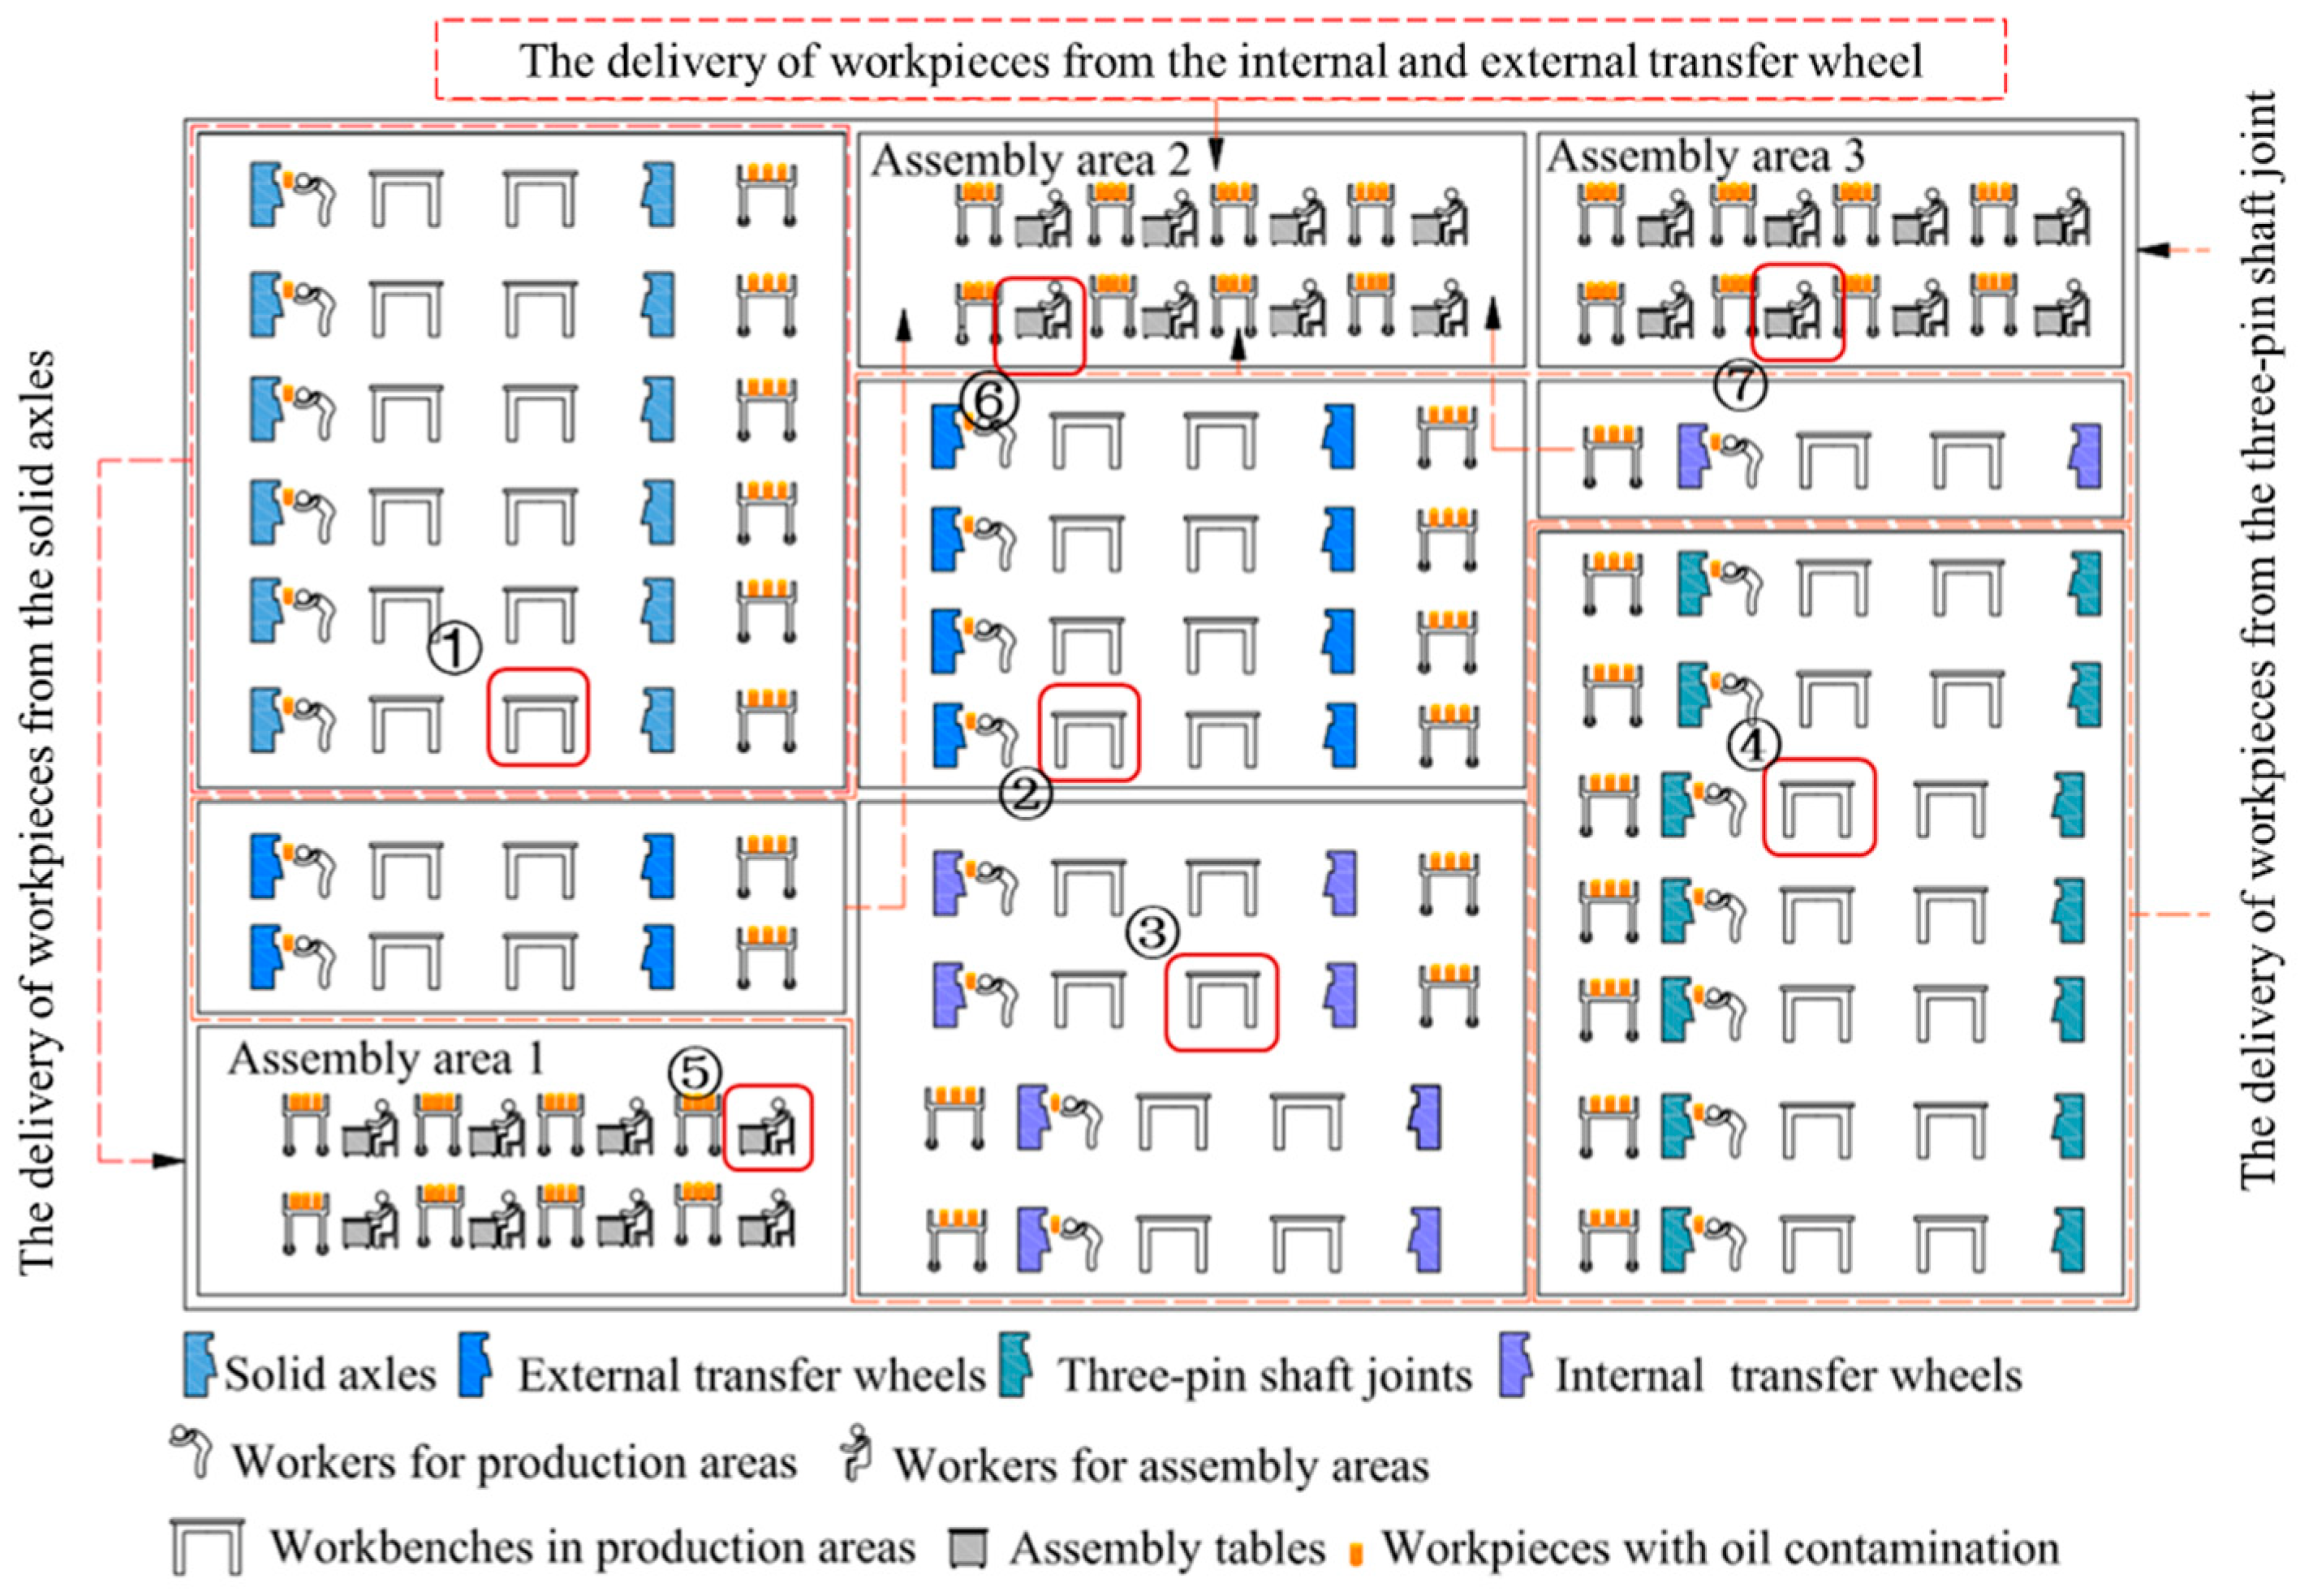
4. On-Site Measurement

In the SDS A3 workshop, the oil contamination concentration on the workbench in seven positions was measured on-site. Figure 2 shows the internal layout of the SDS A3 workshop. The solid numbered circle with a red ellipse shows the position of the measured workbench. The red dashed box shows three different types of production units. The red dotted arrow indicates the delivery route of the workpiece from the production area to the assembly area.
The SDS A3 workshop has different production units, such as the solid axle, internal and external transfer wheels, and three-pin shaft joint. Assume that the production area has 24 production units, and each production unit is equipped with two workbenches. A total of 24 workbenches are in the assembly area, and different types of workpieces are delivered to the corresponding assembly area. The solid axles, internal and external transfer wheels, and three-pin shaft joints are delivered to assembly areas 1, 2, and 3, respectively. Seven workbenches were selected from each production area or assembly area and numbered from 1 to 7. The oil contamination concentrations on surfaces were measured. The steps of the measurement method can be described as follows: arrange the measuring points on the workbench, clean the workbench at the initial moment, cover more than 50% of the surface with several clean filter papers as much as possible, use an electronic balance to weigh all of the filter papers, and record the initial weight as x1 (mg). All clean filter papers were placed on the surface of the measuring point, as shown in Figure 3. After four hours, the contaminated filter papers were retrieved and weighed again with an analytical balance, and the weight was recorded as x2 (mg). The mass of oil stains deposited on the surface of the measuring point is given by x1–x2 (mg). The surface area of a single piece of filter paper is approximately 0.01 m2, and the surface oil concentration of the measuring point represents the weight of the oil deposited on the surface of all filter papers at a single measuring point divided by the total area of the filter paper.
Table 1 shows the masses (in g) of oil contamination on the seven surfaces and the initial mass of oil contamination (in mg/m2) carried by each workpiece from different production units. The mass of oil contamination on the surface is the total mass of oil contamination deposited in four hours.

5. Results and Discussion

5.1. Model Validation

MWFs are widely used in machining workshops as they can lubricate and cool turning tools and flush metal chips produced by cutting [33]. During the machining process, a large number of oil mist particles are generated, most of which are exhausted to the outdoors through local exhaust hoods [34,35], but a small part can still leak through the gaps of the machine and diffuse into the workshop area. Then, part of the MWFs is directly thrown onto the inner surface of the machine by the rotating tool, thereby attaching it to the workpieces. Thus, in this work, we only consider the transfer process of the liquid oil contamination on the workpiece in the workshop.
Figure 4 shows the accumulation of oil contamination on each workbench in the SDS workshop after four hours. The oil contamination concentration on the workbench in the solid axle production unit and its corresponding assembly area is higher than that of the internal and external transfer wheels and the three-pin shaft joint. Table 2 compares the deviations between the measured and predicted values of oil contamination concentration on the surfaces of the seven selected workbenches in the workshop. The results show that the deviation of surface 6 is the largest (20.40%), whereas the smallest deviation is for surface 7 (14.26%). The average deviation of the seven surfaces is 17.58%. As the contact behavior of workers and the transportation of workpieces from the production area to the assembly area by the automatic vehicles are both random, the deviation in the prediction results of oil contamination concentration is reasonable. Table 2 also shows that, except for surface 3, the predicted values of oil contamination concentration on the remaining surfaces are greater than the measured values. This phenomenon may be explained by the actual situation in which workers take cleaning measures during operation, which inhibits the accumulation of oil contamination to a certain extent. In general, the proposed contact transmission model can reflect the real situation of liquid oil contamination transfer in workshops.

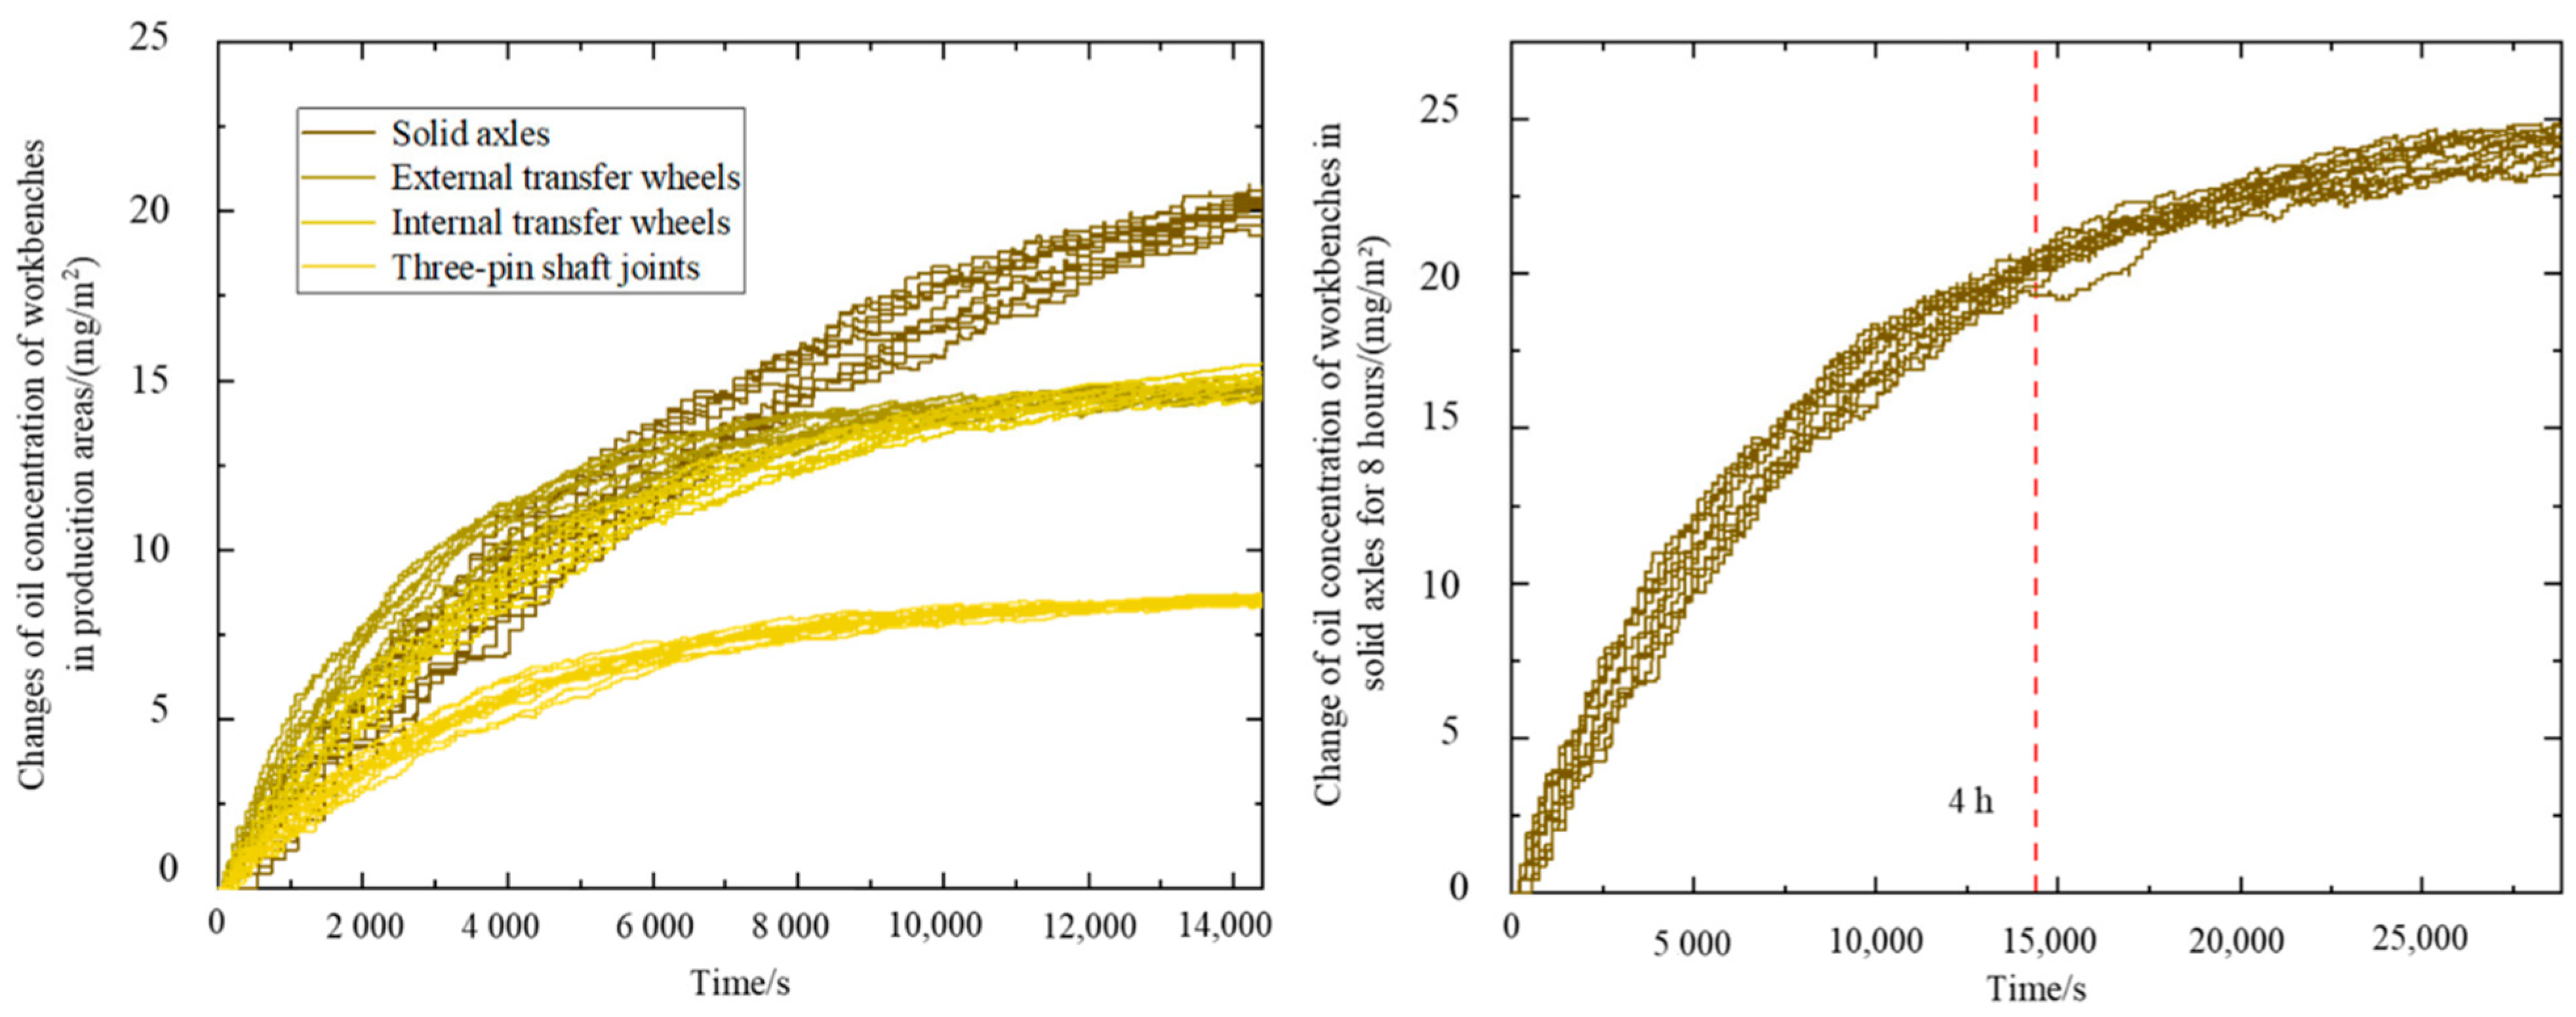
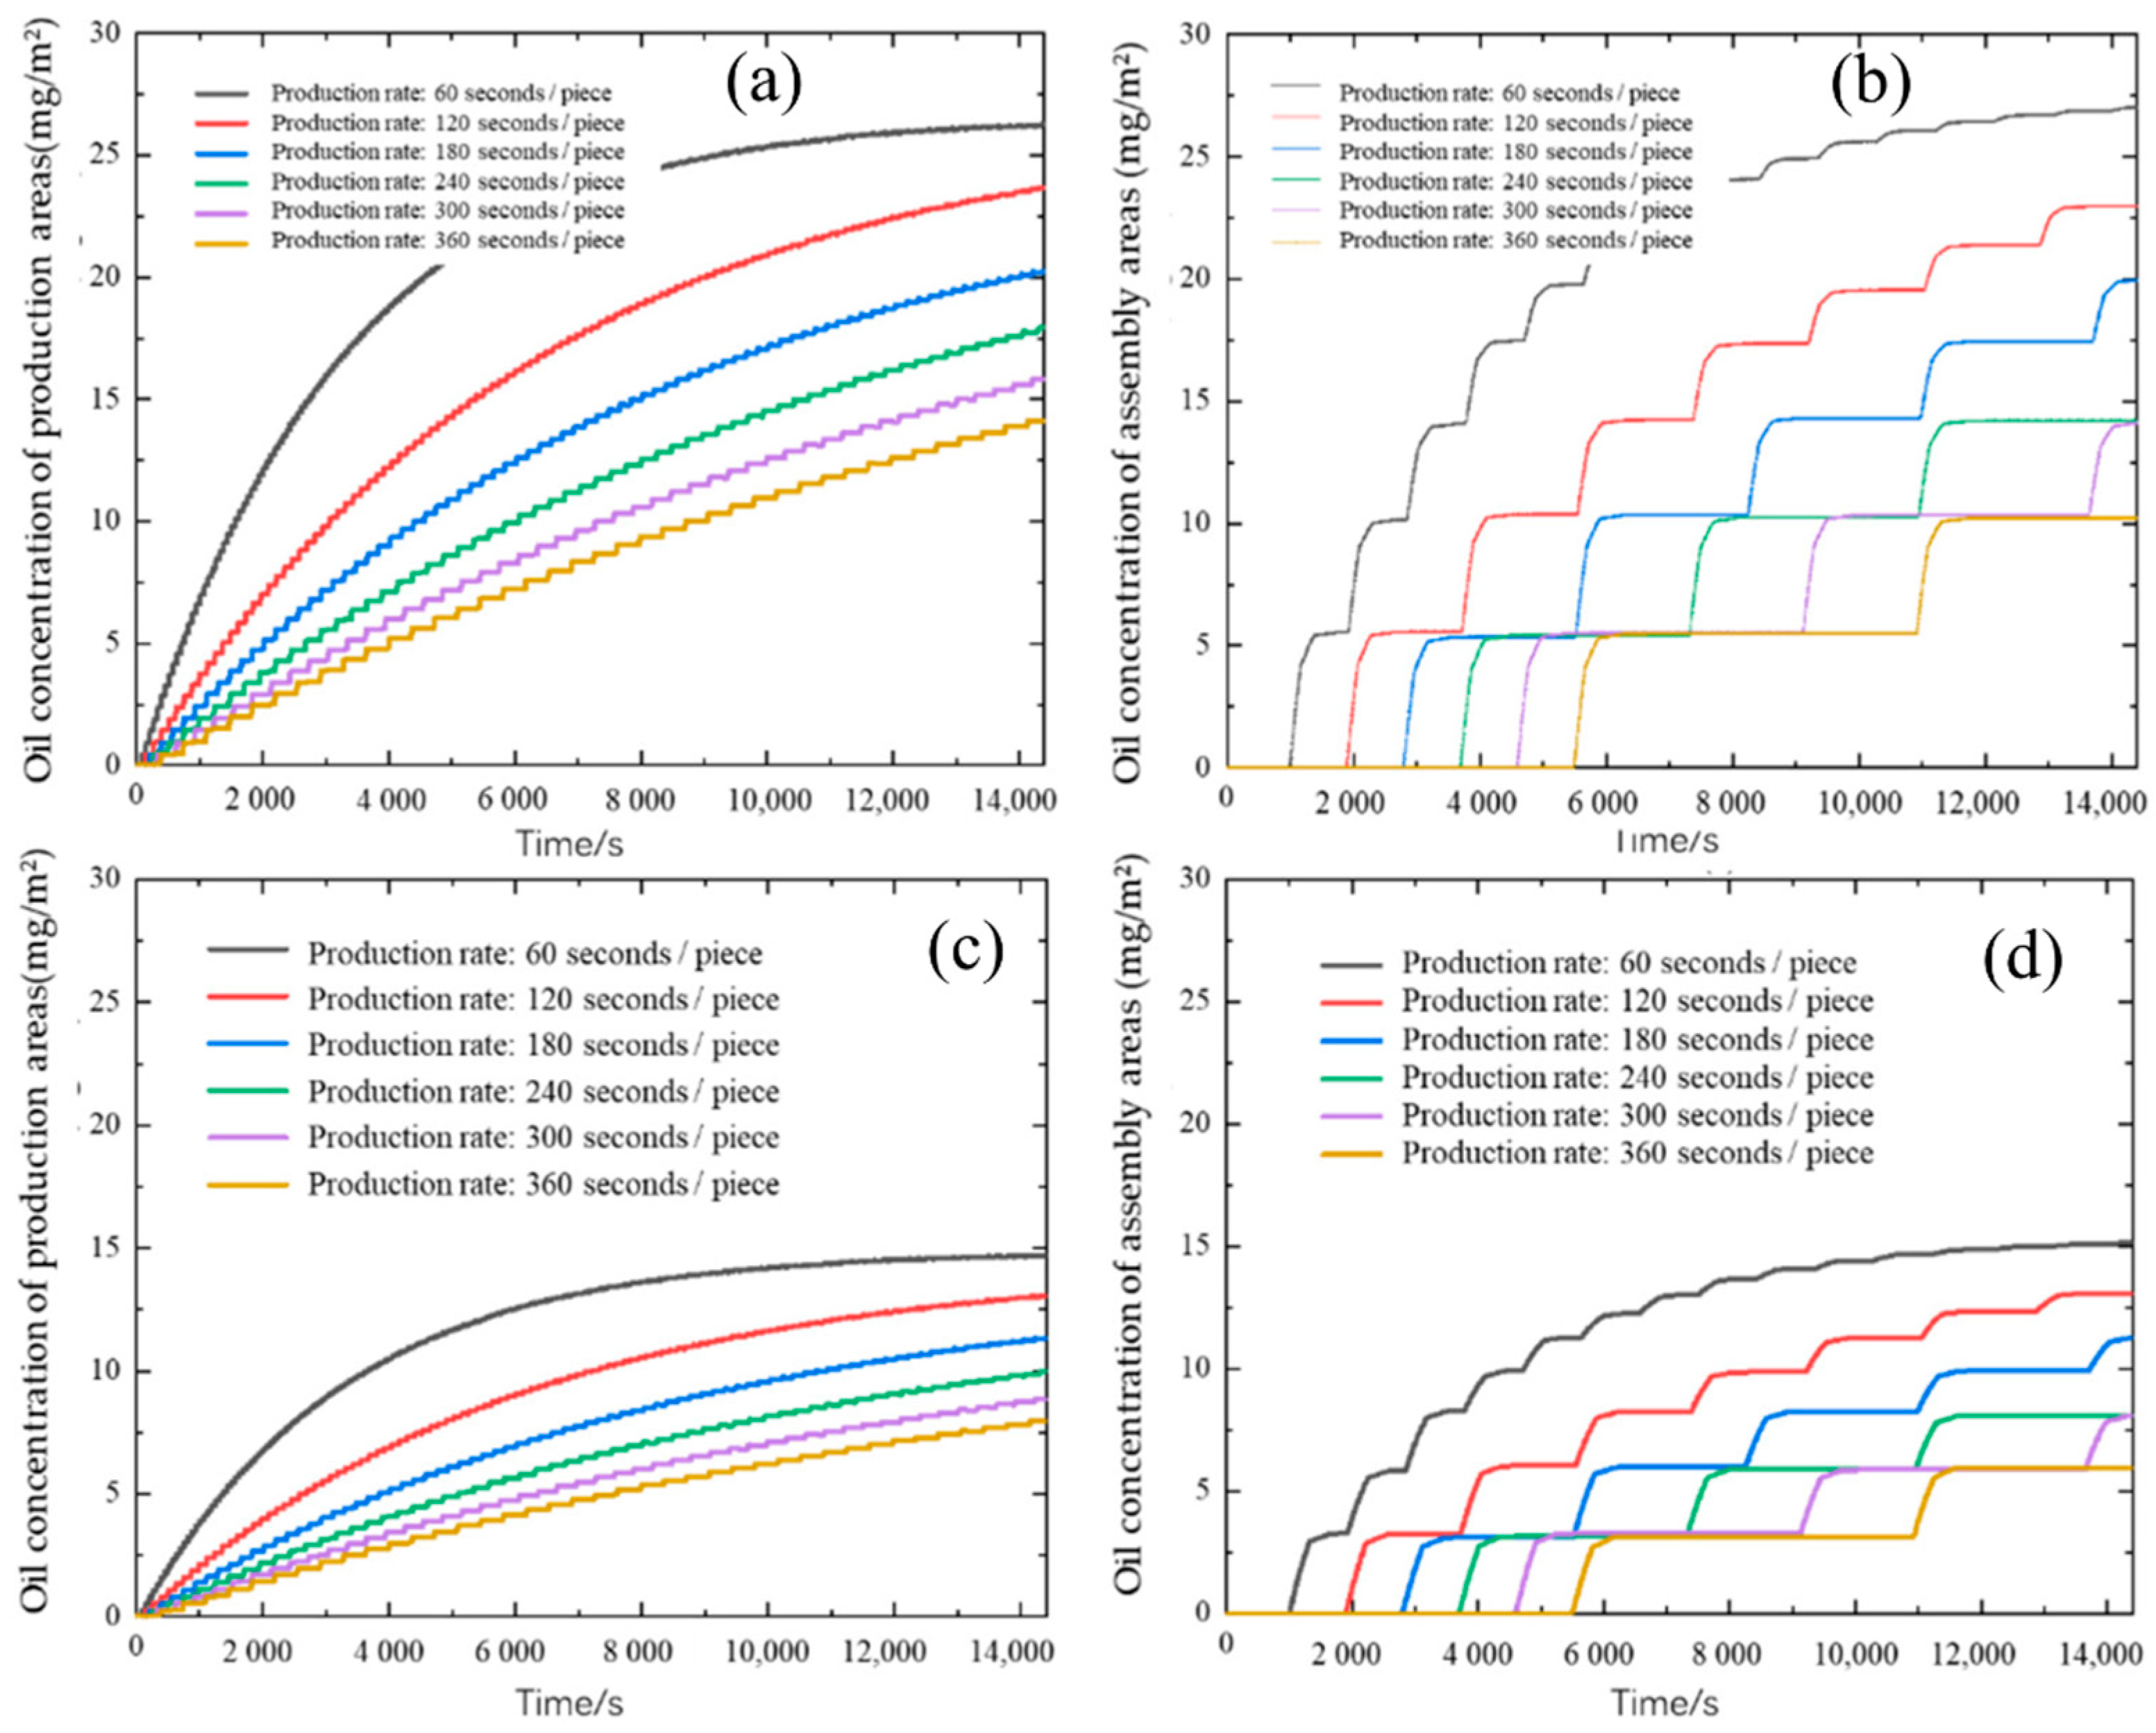
5.2. Concentration of Oil Contamination on the Workbench in the Production Area

The dynamic process of the spread of liquid oil contamination across the areas in the SDS A3 workshop was simulated for four hours. Figure 5 shows the accumulation process of oil contamination concentration on the workbench in the production area within four hours(as well as 8 h for the solid axle area). Given the same production process, the concentration of oil contamination in each production unit is generally the same over time, which conforms to the law of power function growth. The industrial factory is wet processing, but there are still differences in workers’ operation and equipment in the production process. It is considered that it is the same in the model simulation of these production lines. The final stable value of the concentration has a significant relationship with the initial mass of oil contamination carried by the workpiece. Table 1 shows the initial mass of oil contamination carried by the solid axle, in which 1.02 mg is the largest. The rank of the internal and external transfer wheels is the second-highest, and the initial masses of oil contamination of the two parts are extremely close. The three-pin shaft joint has the lowest rank, with an initial mass of almost one-third of the solid axle. Figure 5 also shows that the initial mass of oil contamination carried by the workpiece directly determines the stability of the oil contamination concentration on the workbenches in the different production units. The ranks in terms of the concentrations for the workbenches of the solid axle, internal and external transfer wheels, and three-pin shaft joint production units are generally stabilized at 8.5, 15, and 20 mg/m2 after four hours.

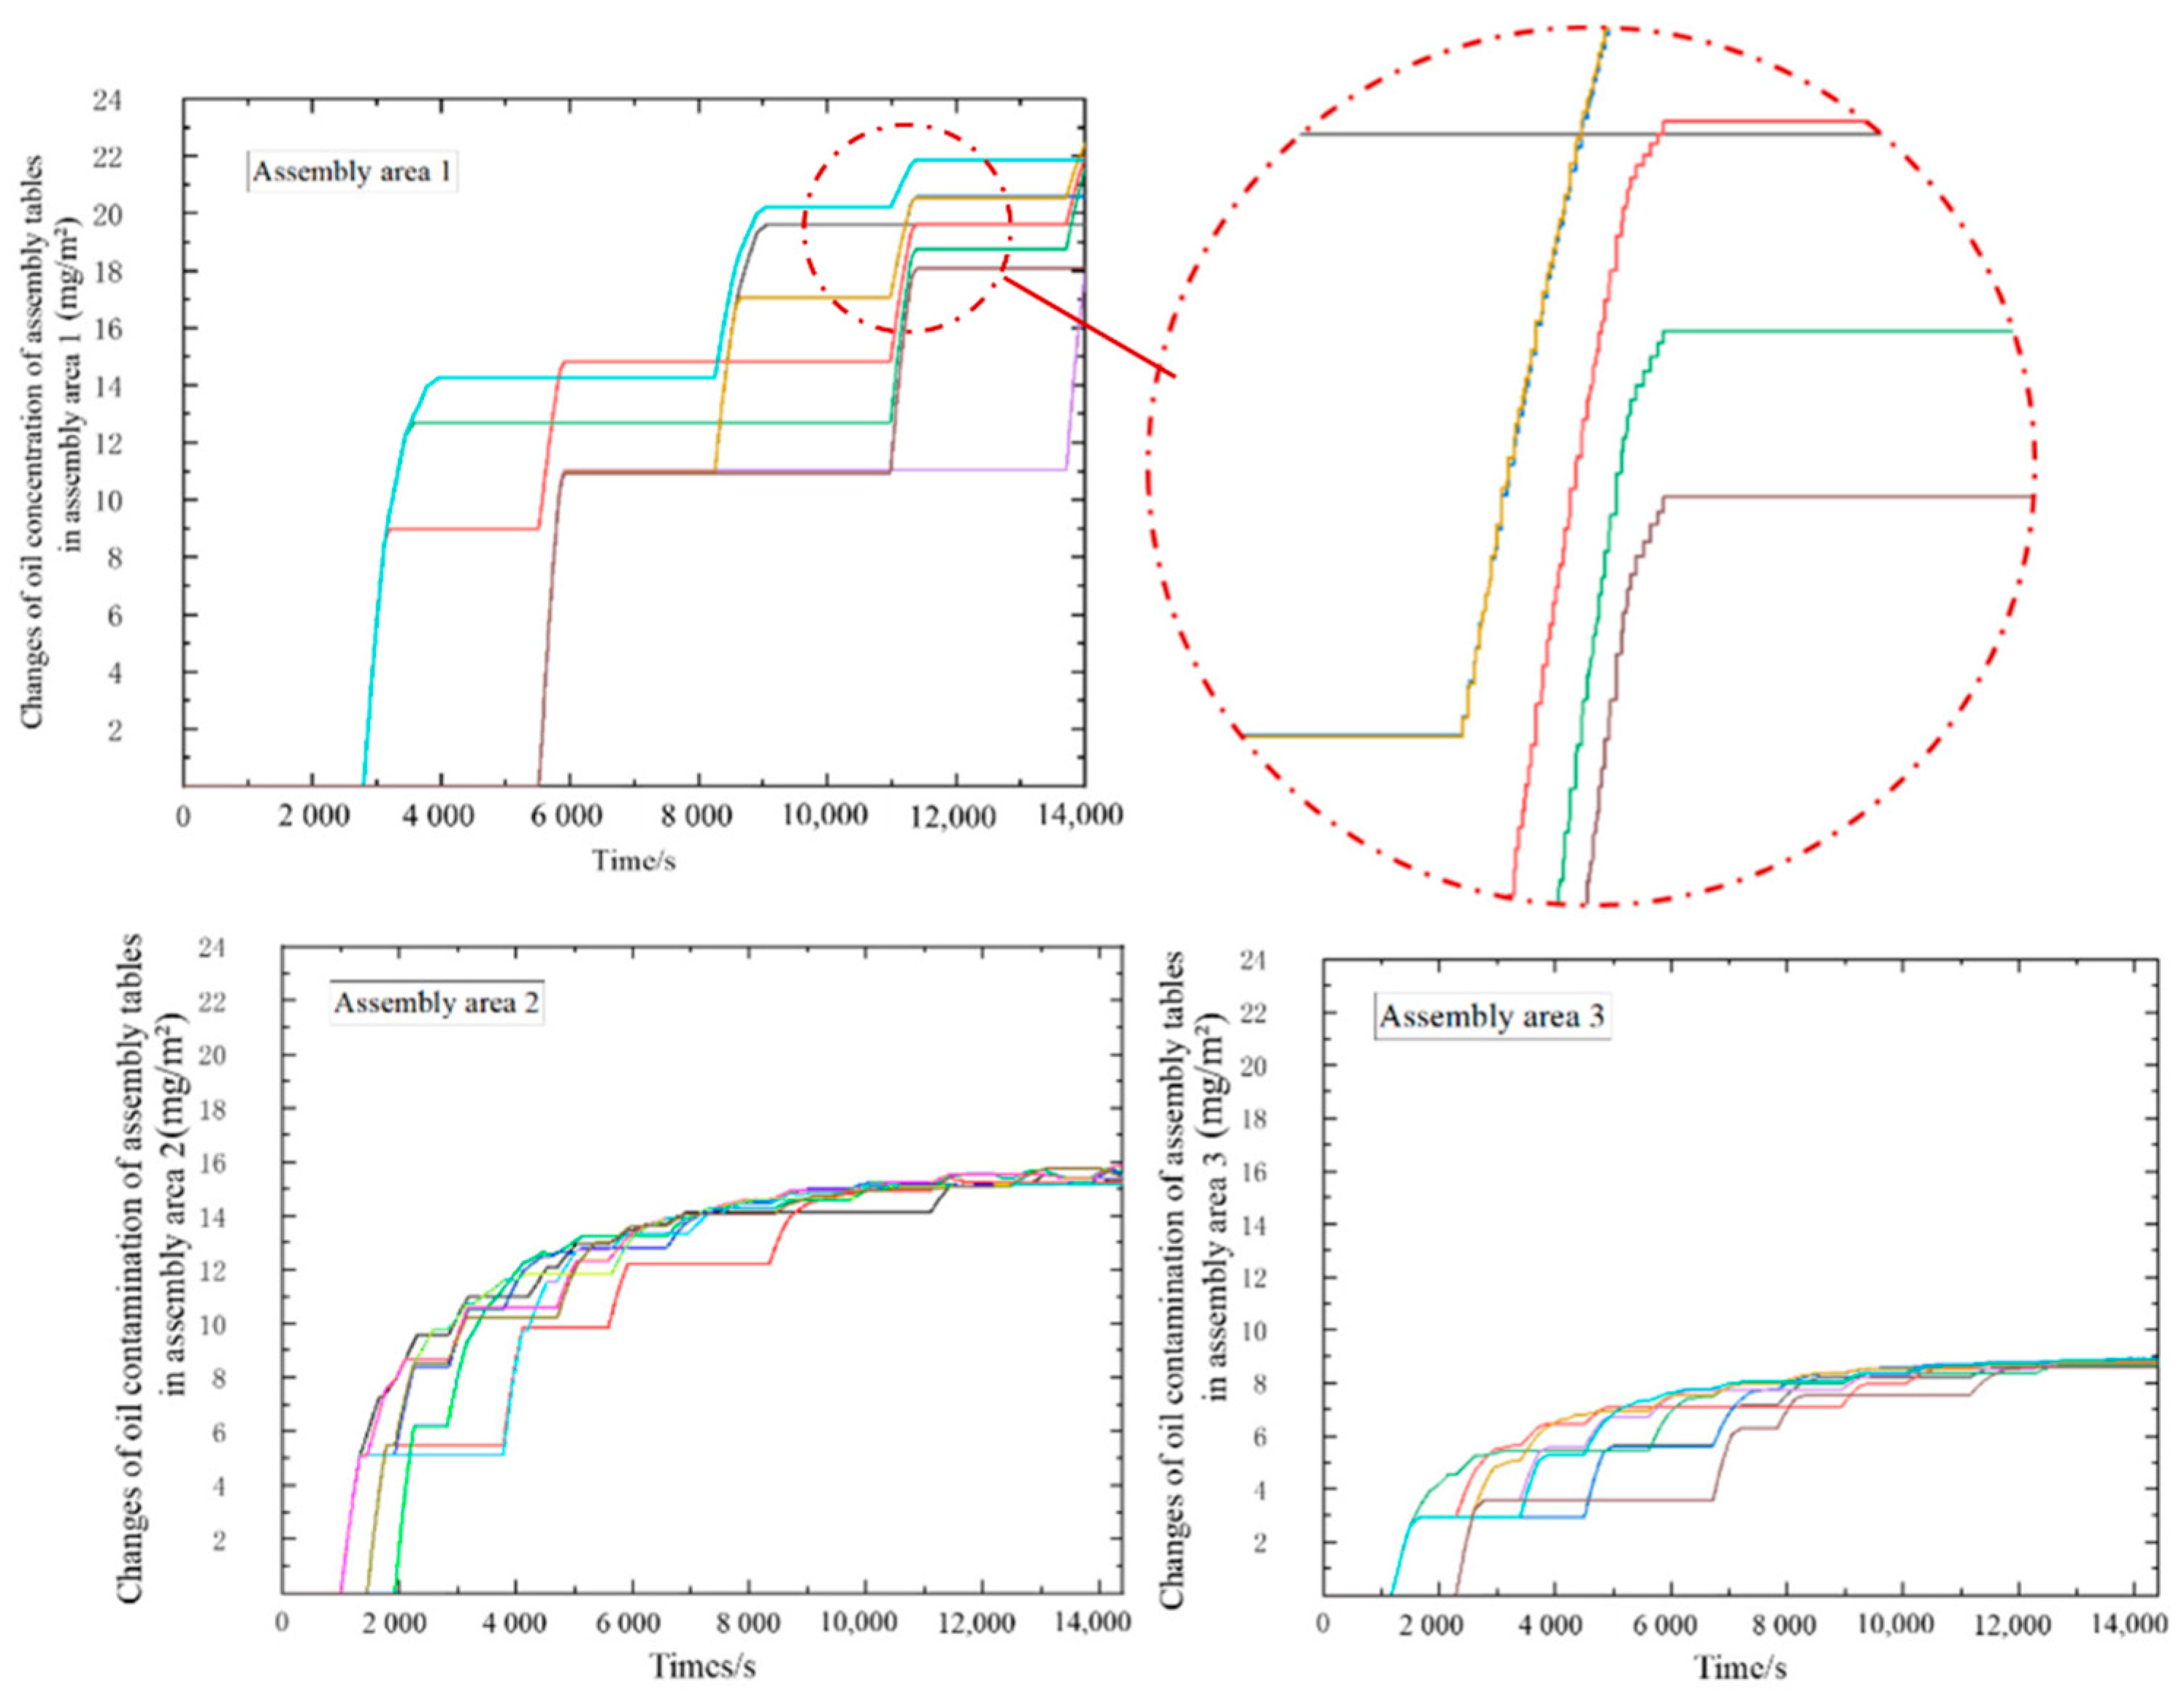
5.3. Oil Contamination Concentrations of the Workbench in the Assembly Area

Figure 6 shows the accumulation process of oil contamination on the workbench in the assembly area within four hours. Given the same assembly unit, the sequence of oil contamination concentration on the workbench changes over time, which conforms to the law of step-growth. The sequence of changes in the oil contamination concentration can be attributed to the workpieces in the production area being randomly transported by the automatic vehicles to the assembly unit, and some assembly units needed to wait for the supply of workpieces from the automatic vehicles to start working. Meanwhile, the step-growth in the concentration can be explained by the supply rate of the workpieces from the automatic vehicles not matching the assembly rate of the workers, i.e., the latter is faster than the former. The final stability value of the oil contamination concentration of the workbench has a significant relationship with the production unit corresponding to the workpiece. Assembly area 1 is responsible for the assembly and wiping of the solid axle, so the oil contamination concentration in this area is highest. After partially magnifying the growth section of the concentration curve in assembly area 1, the concentration does not only increase linearly but also increases in a stepwise manner. The oil contamination carried by the workpiece can be regarded as the source of oil contamination diffusion in the assembly area. As mentioned previously, a worker removes a workpiece from the automatic vehicles and transfers it to the workbench. After completing a series of operations, the worker transfers the workpiece to a new transporter for delivery to the warehouse. Each contact made by the gloves, workbenches, and workpieces causes the oil contamination to be transferred. At the beginning of the assembly, the workbench can be regarded as having a clean surface. As the workpiece assembly progresses, the oil contamination concentration on the workbench gradually increases and eventually reaches a stable value. In general, the trend of oil contamination concentration on the workbench in the assembly area is consistent with that in the production area.

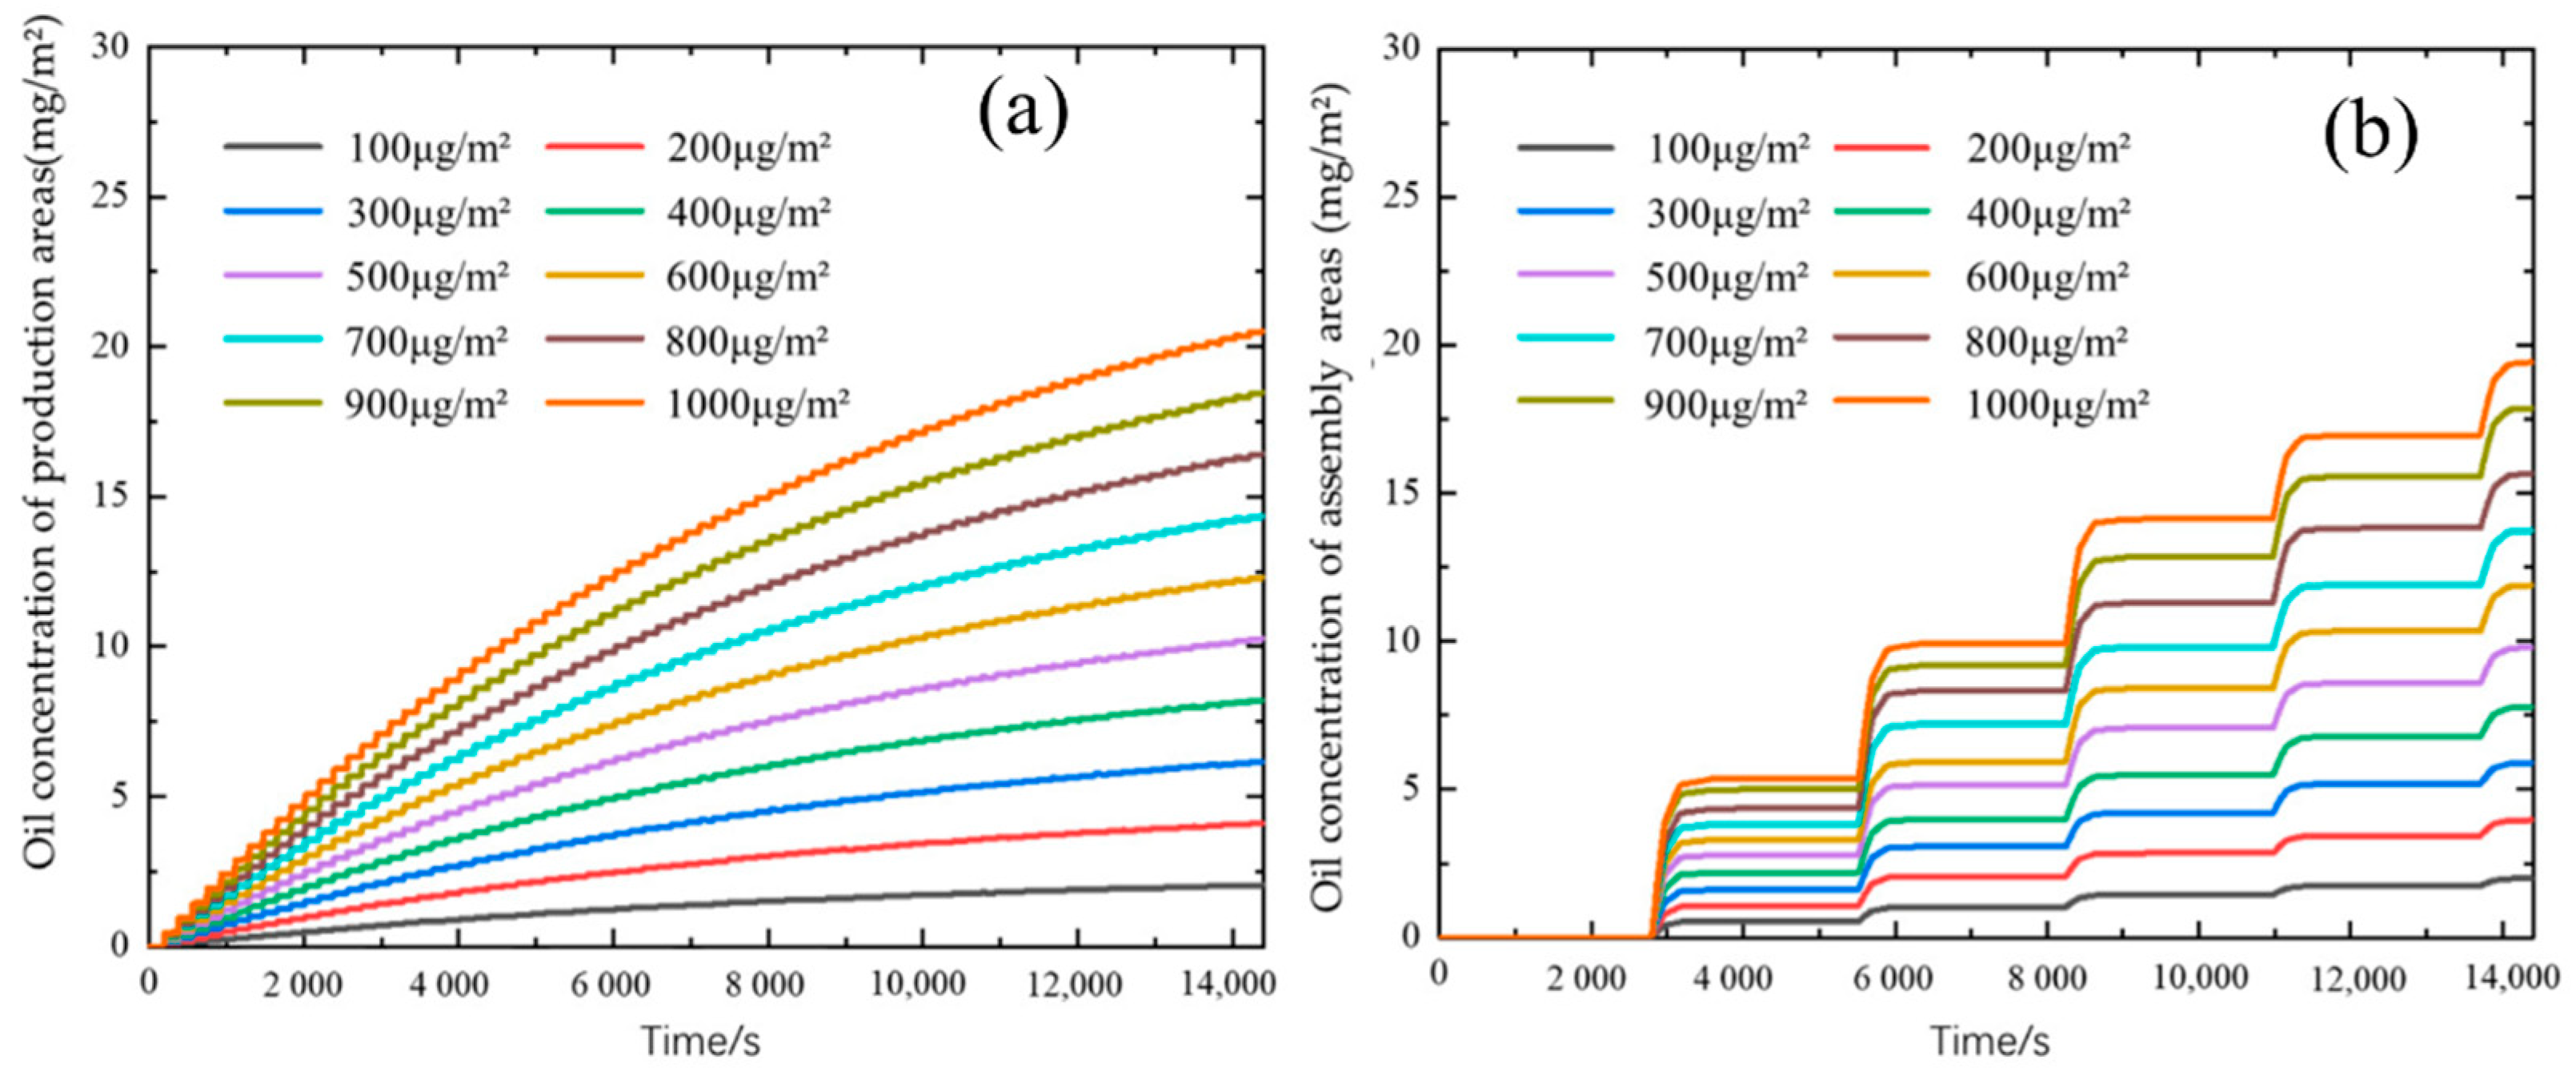
5.4. Statistical Analysis of Oil Pollution Transmission

The initial source of oil pollution comes from the workpiece processed by the machine tool, so the initial concentration can be represented by the oil pollution concentration of the workpiece. Different production units are involved in the spread of oil pollution. Take production unit 1 (Figure 2) as an example of the effects of different initial concentrations on the oil pollution distribution in the production area and assembly area. The corresponding results are shown in Figure 7. The initial oil pollution concentration of production unit 1, from 100 to 1000 μg/m2, is selected. With the increase in the initial oil pollution concentration, the oil pollution in the production area and assembly area per unit time changes faster. The smaller the initial oil concentration, the earlier the oil concentration change curve reaches the equilibrium in both the production area and assembly area. Under different initial oil concentrations, each oil concentration change curve has a proportional relationship with the oil concentration reaching the final time of the simulation. This trend is consistent with the proportion of initial oil concentration. Moreover, in the oil pollution concentration change curve of the assembly table, the greater the initial oil pollution concentration, the shorter the interval time of the curve in the short-equilibrium period, and the greater the slope of the rising section between the different equilibrium periods.
The different production rates of workpieces in the production area inevitably affect the oil concentration distribution in the production area and the change in oil concentration in the assembly area. Production units 1 and 2 are then subjected to characteristic analysis and production rate comparison. In the case of selecting different production units, the size of the production rate is changed, and the range of variation is 60 to 360 s/piece. For each production rate, the model is randomly calculated 100 times. The results of each simulation calculation are averaged to obtain the oil pollution changes in the production area and assembly area.
As shown in Figure 8, when the production rate of a production unit slows down, the accumulated oil pollution per unit time in the production area and assembly area decreases. As for the oil pollution change curve of the assembly area, the speed of the production rate affects the oil pollution of the workbench in this area. As for the starting point of the concentration profile, the faster the production rate, the earlier the contamination. Second, the interval time of the oil pollution concentration to reach the temporary equilibrium has become obvious. The faster the production rate, the shorter the time of temporary equilibrium. Meanwhile, under different production rates, the balance period of each temporary balance has the same oil pollution concentration value because the initial oil pollution concentration and assembly rate have not changed. As shown in Figure 7a and Figure 8c, under the same production rate, the cumulative oil pollution quality per unit time significantly differs. Given the different initial oil pollution concentrations of the two production units, the concentration ratio of each curve is approximately equal to the initial workpiece concentration ratio. This law is similarly reflected in the assembly area.

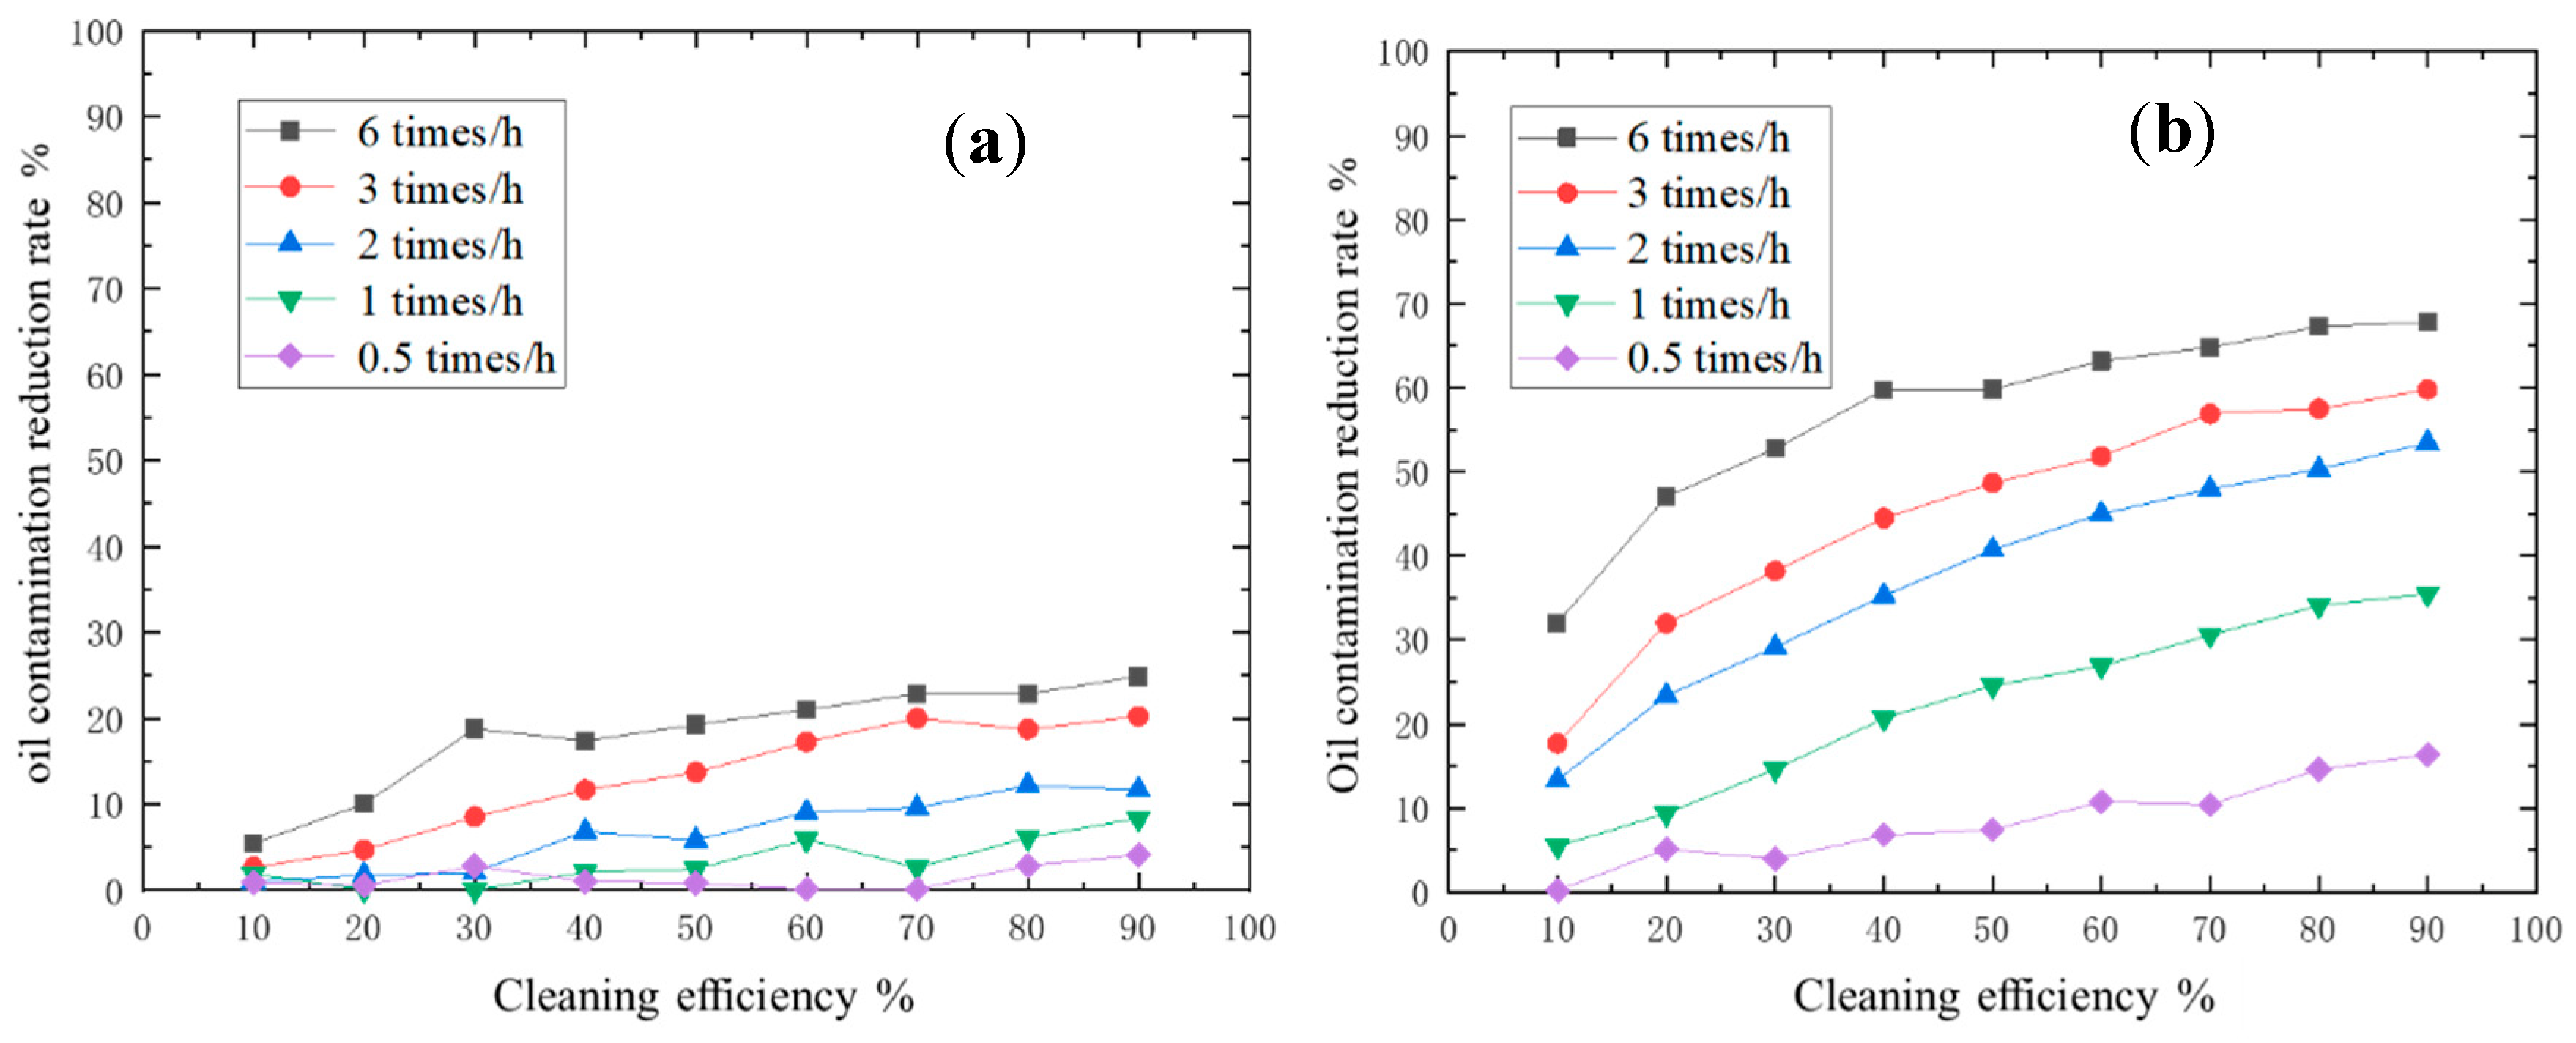
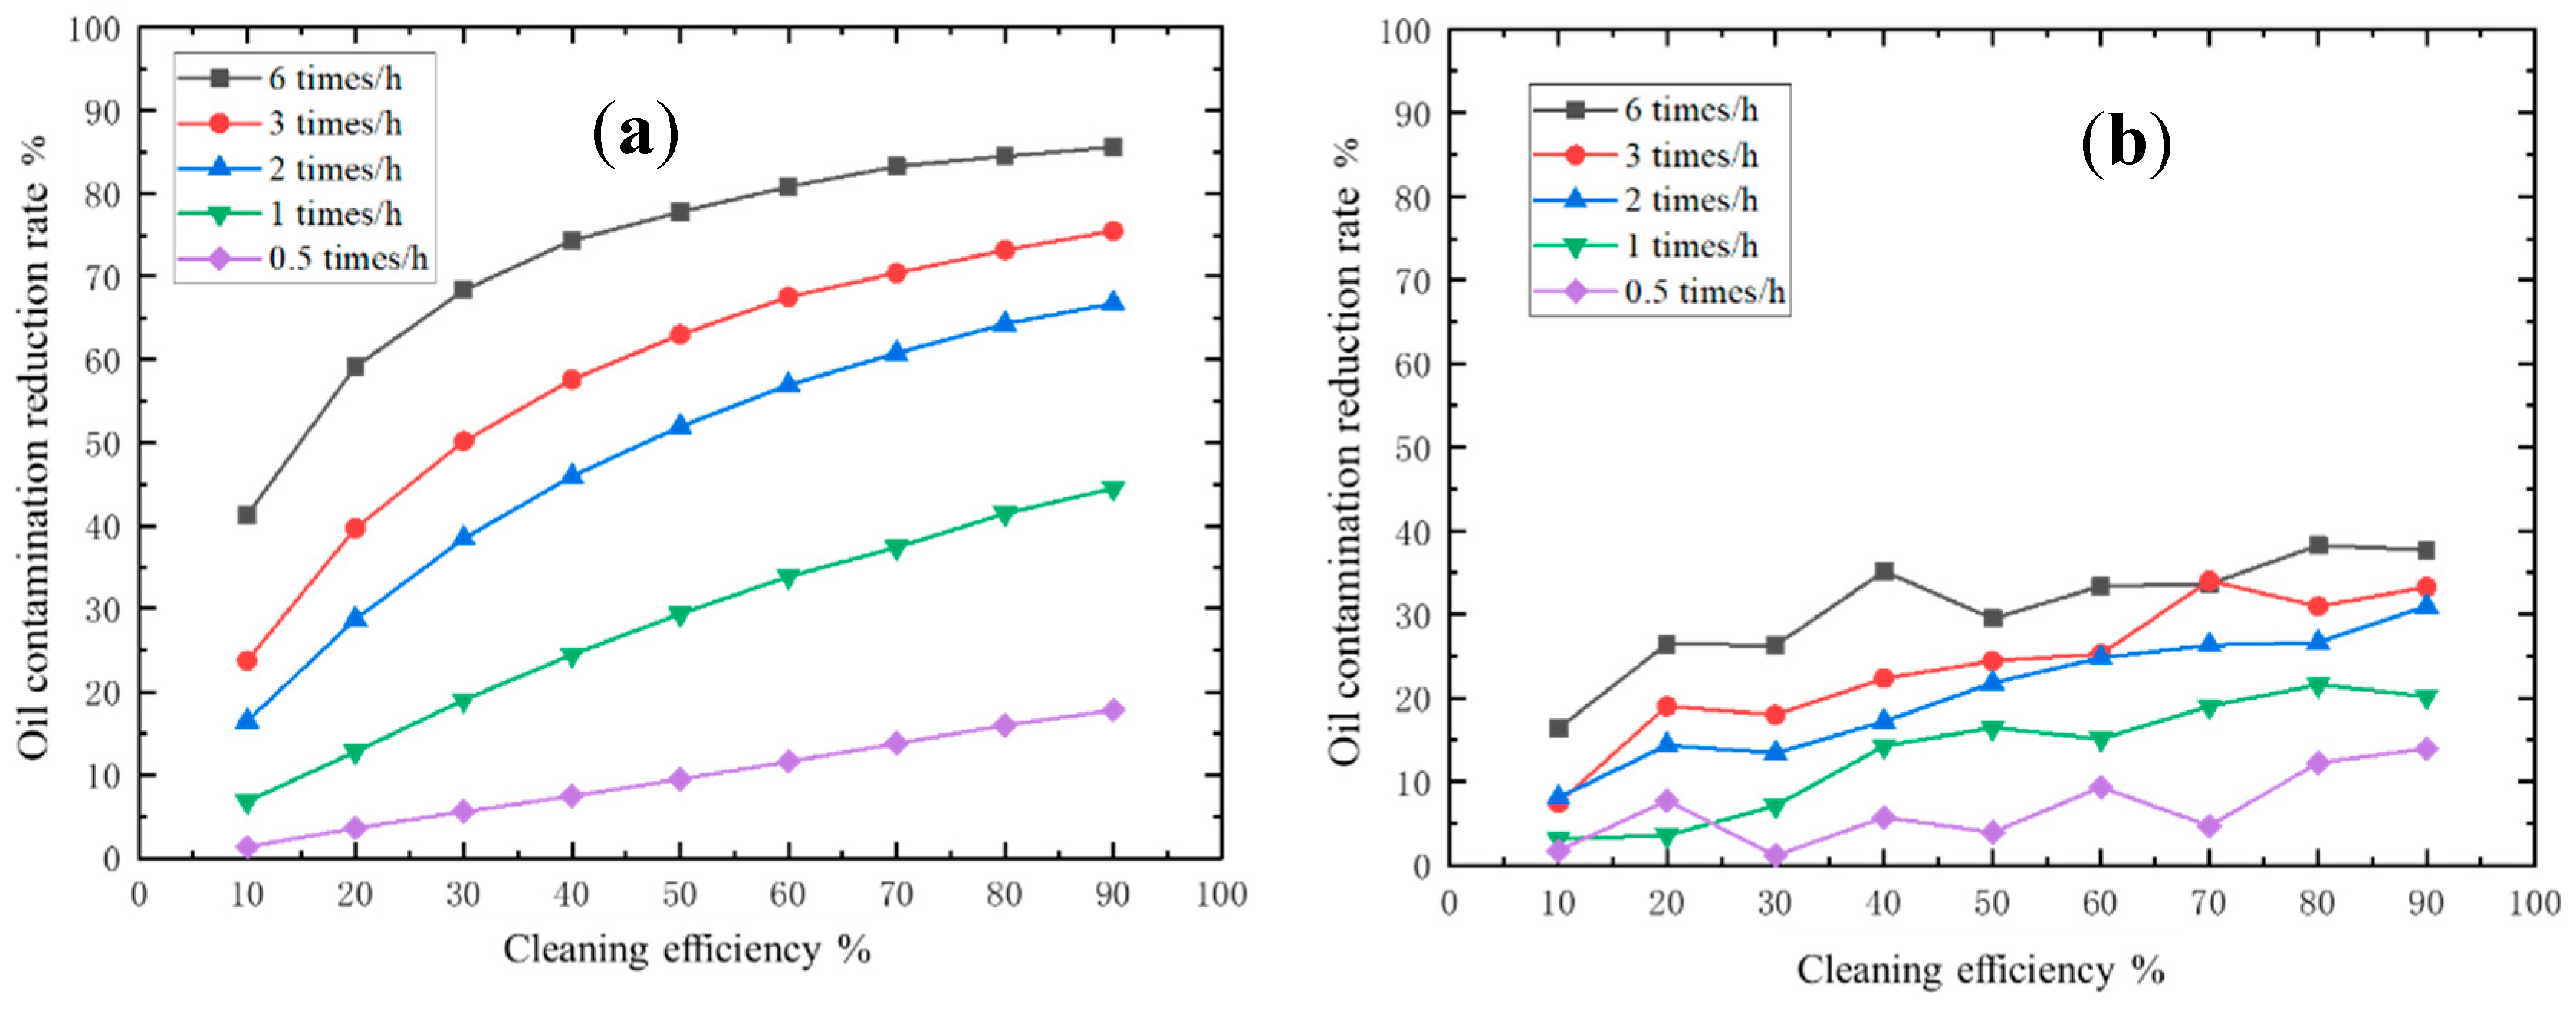
5.5. Two Cleaning Measures

On the basis of the proposed contact transmission model, the effectiveness of the two cleaning measures was analyzed with respect to the reduction in oil concentration on various surfaces in the workshop. The two cleaning measures were cleaning the workbench and cleaning the gloves of workers. As the workpieces produced by the production area are the source of oil contamination, the spread of oil contamination in the assembly area depends on that attached to the workpieces produced in the production area. Therefore, these two cleaning measures are more effective for surfaces in the production area.
Figure 9 shows the relationship between the oil contamination reduction rate on all surfaces and different cleaning rates under different cleaning frequencies after adopting the two cleaning measures. The results show that regardless of the cleaning measure, under the same cleaning frequency, the cleaning effect of all surfaces is positively correlated with the cleaning rate. Cleaning the workbench is more effective than cleaning the gloves of workers in terms of reducing the oil concentration on all surfaces. This finding can be attributed to the wide gap in the area ratio between the workbench and the gloves of workers. In this study, the area of the workbench is 0.5 m2, whereas the area of the glove is only 0.02 m2. Assuming the oil contamination concentration on the workbench is equivalent to that of the gloves, the difference is apparent. Furthermore, although cleaning the gloves can greatly reduce their amount of oil contamination, when these gloves come in contact with the workbench, the amount of oil contamination transferred from the workbench to the gloves accounts for a relatively small proportion of the total oil contamination on the workbench. When the frequency of cleaning gloves reaches once every 10 min and the cleaning efficiency reaches 90%, the reduction rate of all surfaces is approximately 20%, which is much lower than the reduction rate that can be achieved when cleaning the workbench (approximately 65%).
Figure 10 shows the oil contamination reduction rate of the workbench in the production area, which is significantly greater than that in the assembly area. At the fastest cleaning frequency (every 10 min) and the highest cleaning efficiency (90%), the oil contamination reduction rate can reach approximately 85%. However, the oil contamination reduction rate in the assembly area is generally low, and when the cleaning frequency is constant, the reduction rate fluctuates with the cleaning efficiency. This finding may be explained by the automatic transport vehicles being randomly sent to the assembly unit when transporting the workpieces. Sometimes, the workpieces with low oil contamination are evenly distributed to the assembly station; at other times, the workpieces with low oil contamination are only distributed to certain assembly tables, and the other assembly tables are assigned to workpieces with high oil contamination. At these times, the average oil contamination reduction rate of the assembly tables is lower than that under even distribution. In general, cleaning the workbenches in the production area can meet the goal of reducing the oil contamination concentration in various areas of the workshop.
The above analysis suggests a functional relationship between the reduction rate of oil contamination concentration on different surfaces and the cleaning frequency and cleaning efficiency, especially in the production area. Subsequently, the change in oil contamination concentration of the workbench in the production area is fitted. A power function relationship also exists between the oil contamination concentration of the workbench in the production area and the cleaning efficiency. Assuming the oil contamination reduction rate is y, and the cleaning rate is x, the oil contamination reduction rate can be determined by Equation (8). Table 3 shows the fitted values of a and b and the corresponding R 2 under different cleaning frequencies.
y = a x b
Table 3 shows that the fitted values of a and b are not fixed values at different cleaning frequencies, and they vary with the cleaning frequency. Therefore, the relationship between a and b and the cleaning frequency is further fitted. The fitting results are a = 0.2 ln p + 0.0908 and b = 0.301 ln p + 0.8791 . The cleaning frequency has a greater impact on the oil contamination reduction rate than the cleaning rate, so the cleaning strategy should be formulated from the perspective of increasing the cleaning frequency.

6. Conclusions

In this study, a contact transmission model was established to describe the transfer process of liquid oil contamination on various surfaces in different areas of a machining workshop. The contact transmission model was based on the Markov chain, which considers the different contact behaviors of workers in different functional areas. The transfer efficiencies of oil contamination from the workpiece to the glove and from the glove to the workpiece were determined through experiments, and the results are 0.5 and 0.35, respectively. The on-site measurement of oil contamination concentrations on seven workbench surfaces in the actual workshop was performed, and the deviation between the predicted and measured values of oil contamination concentrations was compared, with values within 14.26% to 20.40%. The proposed contact transmission model can reflect the transfer process of liquid oil contamination across the regions in the workshop. The model can predict the changes in oil contamination concentration on the workbenches in the production area and assembly area within four hours. The oil contamination concentration on the workbenches in the production area increases with a power function. In this area, the concentration in the solid axle production unit is the highest. The oil contamination concentration on the workbenches in the assembly area increases in a stepwise manner. This finding can be explained by the mismatch between the assembly speed and supply speed of workpiece transportation. Cleaning the workbench is more effective than cleaning the workers’ gloves in reducing the overall concentration of oil contamination in the workshop. In general, the model proposed in this study can identify the highly polluted areas of the machining workshop and reveal the dynamic transfer process of liquid oil contamination on the surface of the workshop. On the basis of this model, measures to control the spread of oil contamination can be further studied, and effective cleaning strategies can be formulated for machining workshops.

Author Contributions

X.W.: Conceptualization and original draft; J.Z.: Validation; Y.Y.: Investigation; Y.X.: Supervision and review and editing. All authors have read and agreed to the published version of the manuscript.

Funding

This work was supported by the Machinery Industry Innovation Platform Construction Project of China [grant number 2019SA-10-07]; and the Shandong Construction Department Research and Development Project [grant number K2019370].

Institutional Review Board Statement

Not applicable.

Informed Consent Statement

Not applicable.

Data Availability Statement

Not applicable.

Conflicts of Interest

The authors have no competing interest to declare.

Nomenclature

N s The quality of oil contamination on workbenches before touching, kg
N h The quality of oil contamination on gloves before touching, kg
N s The quality of oil contamination on workbenches after touching, kg
N h The quality of oil contamination on gloves after touching, kg
C s The concentration of oil contamination on workbenches before touching, kg/m2
C h The concentration of oil contamination on gloves before touching, kg/m2
C s The concentration of oil contamination on workbenches after one touching behavior, kg/m2
C h The concentration of oil contamination on gloves after one touching behavior, kg/m2
τ h s The transfer efficiency from gloves to workbenches
τ s h The transfer efficiency from workbenches to gloves
A s The area of workbench, m2
A h The area of glove, m2
A c Effective contact area, m2

References

  1. Carlton, G.N.; Flynn, M.R. Influence of spray painting parameters on breathing zone particle size distributions. Appl. Occup. Environ. Hyg. 1997, 12, 744–750. [Google Scholar] [CrossRef]
  2. Gong, G.; Xu, C.; Jiao, J.; Liu, Y.; Xie, S. Investigation of moisture condensation on papermaking plant envelopes in high humidity environment by orthogonal analysis and CFD simulation. Build. Environ. 2011, 46, 1639–1648. [Google Scholar] [CrossRef]
  3. Yang, X.; Wang, Y.; Yang, H.; Yang, Y. Experimental research on free settling properties of different types of single fiber particle in air. Build. Environ. 2020, 185, 107300. [Google Scholar] [CrossRef]
  4. Park, H.; Jang, J.-K.; Shin, J.-A. Quantitative exposure assessment of various chemical substances in a wafer fabrication industry facility. Saf. Health Work 2011, 2, 39–51. [Google Scholar] [CrossRef] [PubMed] [Green Version]
  5. Li, J.F.; Zhou, Y.-F. Occupational hazards control of hazardous substances in clean room of semiconductor manufacturing plant using CFD analysis. Toxicol. Ind. Health 2015, 31, 123–139. [Google Scholar] [CrossRef]
  6. Chen, Y.P. Research of Purification Technology of Air Contaminated with Dust and Oil Mist in Workshop; Hunan University of Technology: Zhuzhou, China, 2016. [Google Scholar]
  7. Mei, X. Investigation on Transmission and Dispersion of Particles in Limited Space with Markov Chain Based Probabilistic Model; Hunan University: Changsha, China, 2019. [Google Scholar]
  8. Donguk, P.; Byungsoon, C.; Shinbum, K.; Hyunseok, K.; Kuidon, J.; Jongdeuk, J. Exposure assessment to suggest the cause of sinusitis developed in grinding operations utilizing soluble metalworking fluids. J. Occup. Health 2005, 47, 319–326. [Google Scholar] [CrossRef] [Green Version]
  9. Oudyk, J.; Haines, A.T.; D’Arcy, J. Investigating respiratory responses to metalworking fluid exposure. Appl. Occup. Environ. Hyg. 2003, 18, 939–946. [Google Scholar] [CrossRef]
  10. Deepika, S.; LaValley, M.; Weiner, D.; Eisen, E.A.; Applebaum, K.M. Applebaum, Increased risk of renal cell carcinoma following exposure to metalworking fluids among autoworkers. Ann. Epidemiol. 2015, 25, 703–704. [Google Scholar] [CrossRef]
  11. Li, H.; Li, Z. Fault diagnosis and analysis of hydraulic system of CNC machine tool. Intern. Comb. Eng. Parts 2018, 13, 136–137. (In Chinese) [Google Scholar] [CrossRef]
  12. Nie, S.; Wen, J.; Li, Y.; Tang, X.; Huang, G. Filter allocation and replacement strategies in fluid power system under uncertainty: A fuzzy robust nonlinear programming approach. Optim. Eng. 2012, 13, 319–347. [Google Scholar] [CrossRef]
  13. Tong, W.; Liu, S.D. Oil contamination control of hydraulic system of engineering machine. J. Tongji Univ. 2001, 29, 1507–1509. (In Chinese) [Google Scholar] [CrossRef]
  14. Khettabi, R.; Nouioua, M.; Djebara, A.; Songmene, V. Effect of MQL and dry processes on pariticle emission and part quality during milling of aluminum alloys. Int. J. Adv. Manuf. Technol. 2017, 92, 2593–2598. [Google Scholar] [CrossRef]
  15. Wang, Y.; Murga, A.; Long, Z.; Yoo, S.-J. Experimental study of oil mist characteristics generated from minimum quantity lubrication and flood cooling. Energy Built Environ. 2020, 2, 45–55. [Google Scholar] [CrossRef]
  16. Long, Z.W.; Wang, Y.W.; Li, S.S.; Zhang, H.; Cheng, X.L. Monitoring and purification of oil mist particles in a machining workshop. HV AC 2019, 49, 50–55. [Google Scholar]
  17. Yang, Y.; Wang, Y.; Song, B.; Fan, J.; Cao, Y.; Duan, M. Transport and control of droplets: A comparison between two types of local ventilation airflows. Powder Technol. 2019, 345, 247–259. [Google Scholar] [CrossRef]
  18. Wang, Y.; Zhao, T.; Cao, Z.; Zhai, C.; Wu, S.; Zhang, C.; Zhang, Q.; Lv, W. The influence of indoor thermal conditions on ventilation flow and pollutant dispersion in downstream industrial workshop. Build. Environ. 2021, 187, 107400. [Google Scholar] [CrossRef]
  19. Mei, X.; Gong, G.; Su, H.; Peng, P.; Liu, J.; Xie, H. A grid-merging operation to accelerate the Markov chain model in predicting steady-state and transient transmission of airborne particles. Build. Environ. 2017, 122, 82–93. [Google Scholar] [CrossRef]
  20. Zeng, L.; Gao, J.; Lv, L.; Zhang, R.; Chen, Y.; Zhang, X.; Huang, Z.; Zhang, Z. Markov-chain-based inverse modeling to fast localize hazardous gaseous pollutant sources in buildings with ventilation systems. Build. Environ. 2020, 169, 106584. [Google Scholar] [CrossRef]
  21. Nicas, M. Markov modeling of contaminant concentrations in indoor air. AIHAJ-Am. Ind. Hyg. Assoc. 2000, 61, 484–491. [Google Scholar] [CrossRef]
  22. Hu, M.; Liu, L.; Liu, M. Calculation method of state transfer matrix in Markov chain model for airborne contaminant transport: Investigation and improvement. Build. Environ. 2020, 185, 107295. [Google Scholar] [CrossRef]
  23. Liu, W.; van Hooff, T.; An, Y.; Hu, S.; Chen, C. Modeling transient particle transport in transient indoor airflow by fast fluid dynamics with the Markov chain method. Build. Environ. 2020, 186, 107323. [Google Scholar] [CrossRef]
  24. Chen, C.; Liu, W.; Lin, C.-H.; Chen, Q. A Markov chain model for predicting transient particle transport in enclosed environments. Build. Environ. 2015, 90, 30–36. [Google Scholar] [CrossRef] [PubMed]
  25. Fontanini, A.D.; Vaidya, U.; Passalacqua, A.; Ganapathysubramanian, B. Contaminant transport at large Courant numbers using Markov matrices. Build. Environ. 2017, 112, 1–16. [Google Scholar] [CrossRef]
  26. Nicas, M.; Sun, G. An Integrated Model of Infection Risk in a Health-Care Environment. Risk Anal. 2006, 26, 1085–1096. [Google Scholar] [CrossRef] [PubMed]
  27. Lei, H.; Li, Y.; Xiao, S.; Lin, C.-H.; Norris, S.L.; Wei, D.; Hu, Z.; Ji, S. Routes of transmission of influenza A H1N1, SARS CoV, and norovirus in air cabin: Comparative analyses. Indoor Air 2018, 28, 394–403. [Google Scholar] [CrossRef] [PubMed] [Green Version]
  28. Xiao, S.; Li, Y.; Wong, T.-W.; Hui, D.S.C. Role of fomites in SARS transmission during the largest hospital outbreak in Hong Kong. PLoS ONE 2017, 12, e0181558. [Google Scholar] [CrossRef]
  29. Xiao, S.; Tang, J.W.; Hui, D.S.; Lei, H.; Yu, H.; Li, Y. Probable transmission routes of the influenza virus in a nosocomial outbreak. Epidmiol. Infect. 2018, 146, 1114–1122. [Google Scholar] [CrossRef] [Green Version]
  30. Xiao, S.L.; Tang, J.L.W.; Li, Y.G. Airborne or fomite transmission for norovirus? A case study revisited. Int. J. Environ. Res. Public Health 2017, 14, 1571. [Google Scholar] [CrossRef] [Green Version]
  31. Lei, H.; Li, Y.; Xiao, S.; Yang, X.; Lin, C.H.; Norris, S.L.; Wei, D.; Hu, Z.; Ji, S. Logistic growth of a surface contamination network and its role in disease spread. Sci. Rep. 2017, 7, 14826. [Google Scholar] [CrossRef]
  32. Xiao, S.; Jones, R.M.; Zhao, P.; Li, Y. The dynamic fomite transmission of Methicillin-resistant Staphylococcus aureus in hospitals and the possible improved intervention methods. Build. Environ. 2019, 161, 106246. [Google Scholar] [CrossRef]
  33. Sutherland, J.W.; Kulur, V.N.; King, N.C.; von Turkovich, B.F. An experimental investigation of air quality in wet and dry turning. CIRP Ann.-Manuf. Technol. 2000, 49, 61–64. [Google Scholar] [CrossRef]
  34. Liu, G.; Gao, J.; Zeng, L.; Hou, Y.; Cao, C.; Tong, L.; Wang, Y. On-demand ventilation and energy conservation of industrial exhaust systems based on stochastic modelling. Energy Build. 2020, 223, 110158. [Google Scholar] [CrossRef]
  35. Zeng, L.; Liu, G.; Gao, J.; Du, B.; Lv, L.; Cao, C.; Ye, W.; Tong, L.; Wang, Y. A circulating ventilation system to concentrate pollutants and reduce exhaust volumes: Case studies with experiments and numerical simulation for the rubber refining process. J. Build. Eng. 2020, 35, 101984. [Google Scholar] [CrossRef]
Figure 1. Distribution of oil contamination on workbench surfaces in the SDS workshop.
Applsci 12 04765 g001
Figure 2. Internal layout of the SDS A3 workshop.
Applsci 12 04765 g002
Figure 3. Schematic diagram of measuring points.
Applsci 12 04765 g003
Figure 4. Prediction of oil contamination concentrations of each surface.
Applsci 12 04765 g004
Figure 5. Changes in oil concentrations of the workbenches.
Applsci 12 04765 g005
Figure 6. Changes in oil concentration on assembly tables in the three assembly areas.
Applsci 12 04765 g006
Figure 7. Influence of initial oil contamination concentration on the change in oil contamination concentration. (a) workbenches in the production area; (b) assembly tables in the assembly area.
Applsci 12 04765 g007
Figure 8. Influence of workpiece production rate on oil pollution concentration on the worktable in the production area and assembly table in the assembly area. (a) production unit 1 in the production area; (b) production unit 1 in the assembly area; (c) production unit 2 in the production area; (d) production unit 2 in the assembly area.
Applsci 12 04765 g008
Figure 9. Relationship between oil contamination reduction rate on all surfaces and different cleaning rates under different cleaning frequencies: (a) cleaning the worker’s gloves and (b) cleaning the workbench in the production area.
Applsci 12 04765 g009
Figure 10. Relationship between oil contamination reduction rate on different surfaces and different cleaning rates under different cleaning frequencies: (a) workbenches in the production area and (b) assembly tables in the assembly area.
Applsci 12 04765 g010
Table 1. On-site measurement results of the three experiments.
Measuring PointMass of the Filter Paper/gMass of Oil Contamination Carried by the Workpiece/gMass of Oil Deposited on the Surface/mg/m2
16.7500/6.7681/6.72906.7514/6.7693/6.730214.00/12.00/12.00
26.7030/6.6930/6.70706.7042/6.6931/6.708312.00/12.00/13.00
36.8495/6.8335/6.73116.8510/6.8346/6.732615.00/11.00/15.00
46.6901/6.8192/6.75646.6908/6.8215/6.75757.00/23.00/11.00
56.7000/6.8235/6.84776.7014/6.8255/6.849314.00/20.00/16.00
66.8063/6.8187/6.72606.8076/6.8201/6.727513.00/14.00/15.00
76.7410/6.6866/6.77516.7416/6.6873/6.77626.00/7.00/11.00
Table 2. Comparison of predicted and measured values.
Surface NumberPredicted Value/
(mg/m2)
Measured Value/
(mg/m2)
Relative Deviation/(%)Average Relative Deviation/(%)
120.5112.6738.2323.57
215.7612.3321.76
317.5113.6721.93
49.8213.6739.21
518.7516.6711.09
617.1214.0018.22
79.368.0014.53
Table 3. a, b, and R 2 under different cleaning frequencies.
Cleaning Frequency/(Times/h)ab R 2
60.45220.31910.9462
30.26450.51320.9686
20.17980.63250.984
10.07120.85920.9965
0.50.0151.14450.9961
Publisher’s Note: MDPI stays neutral with regard to jurisdictional claims in published maps and institutional affiliations.

