
Evaluation of City–Industry Integration Development and Regional Differences under the New Urbanization: A Case Study of Sichuan


Abstract
:1. Introduction
2. Background
2.1. Literature Review
2.1.1. Indicators of City–Industry Integration Evaluation
2.1.2. Methods of City–Industry Integration Evaluation
2.1.3. Regional Differences of Urbanization
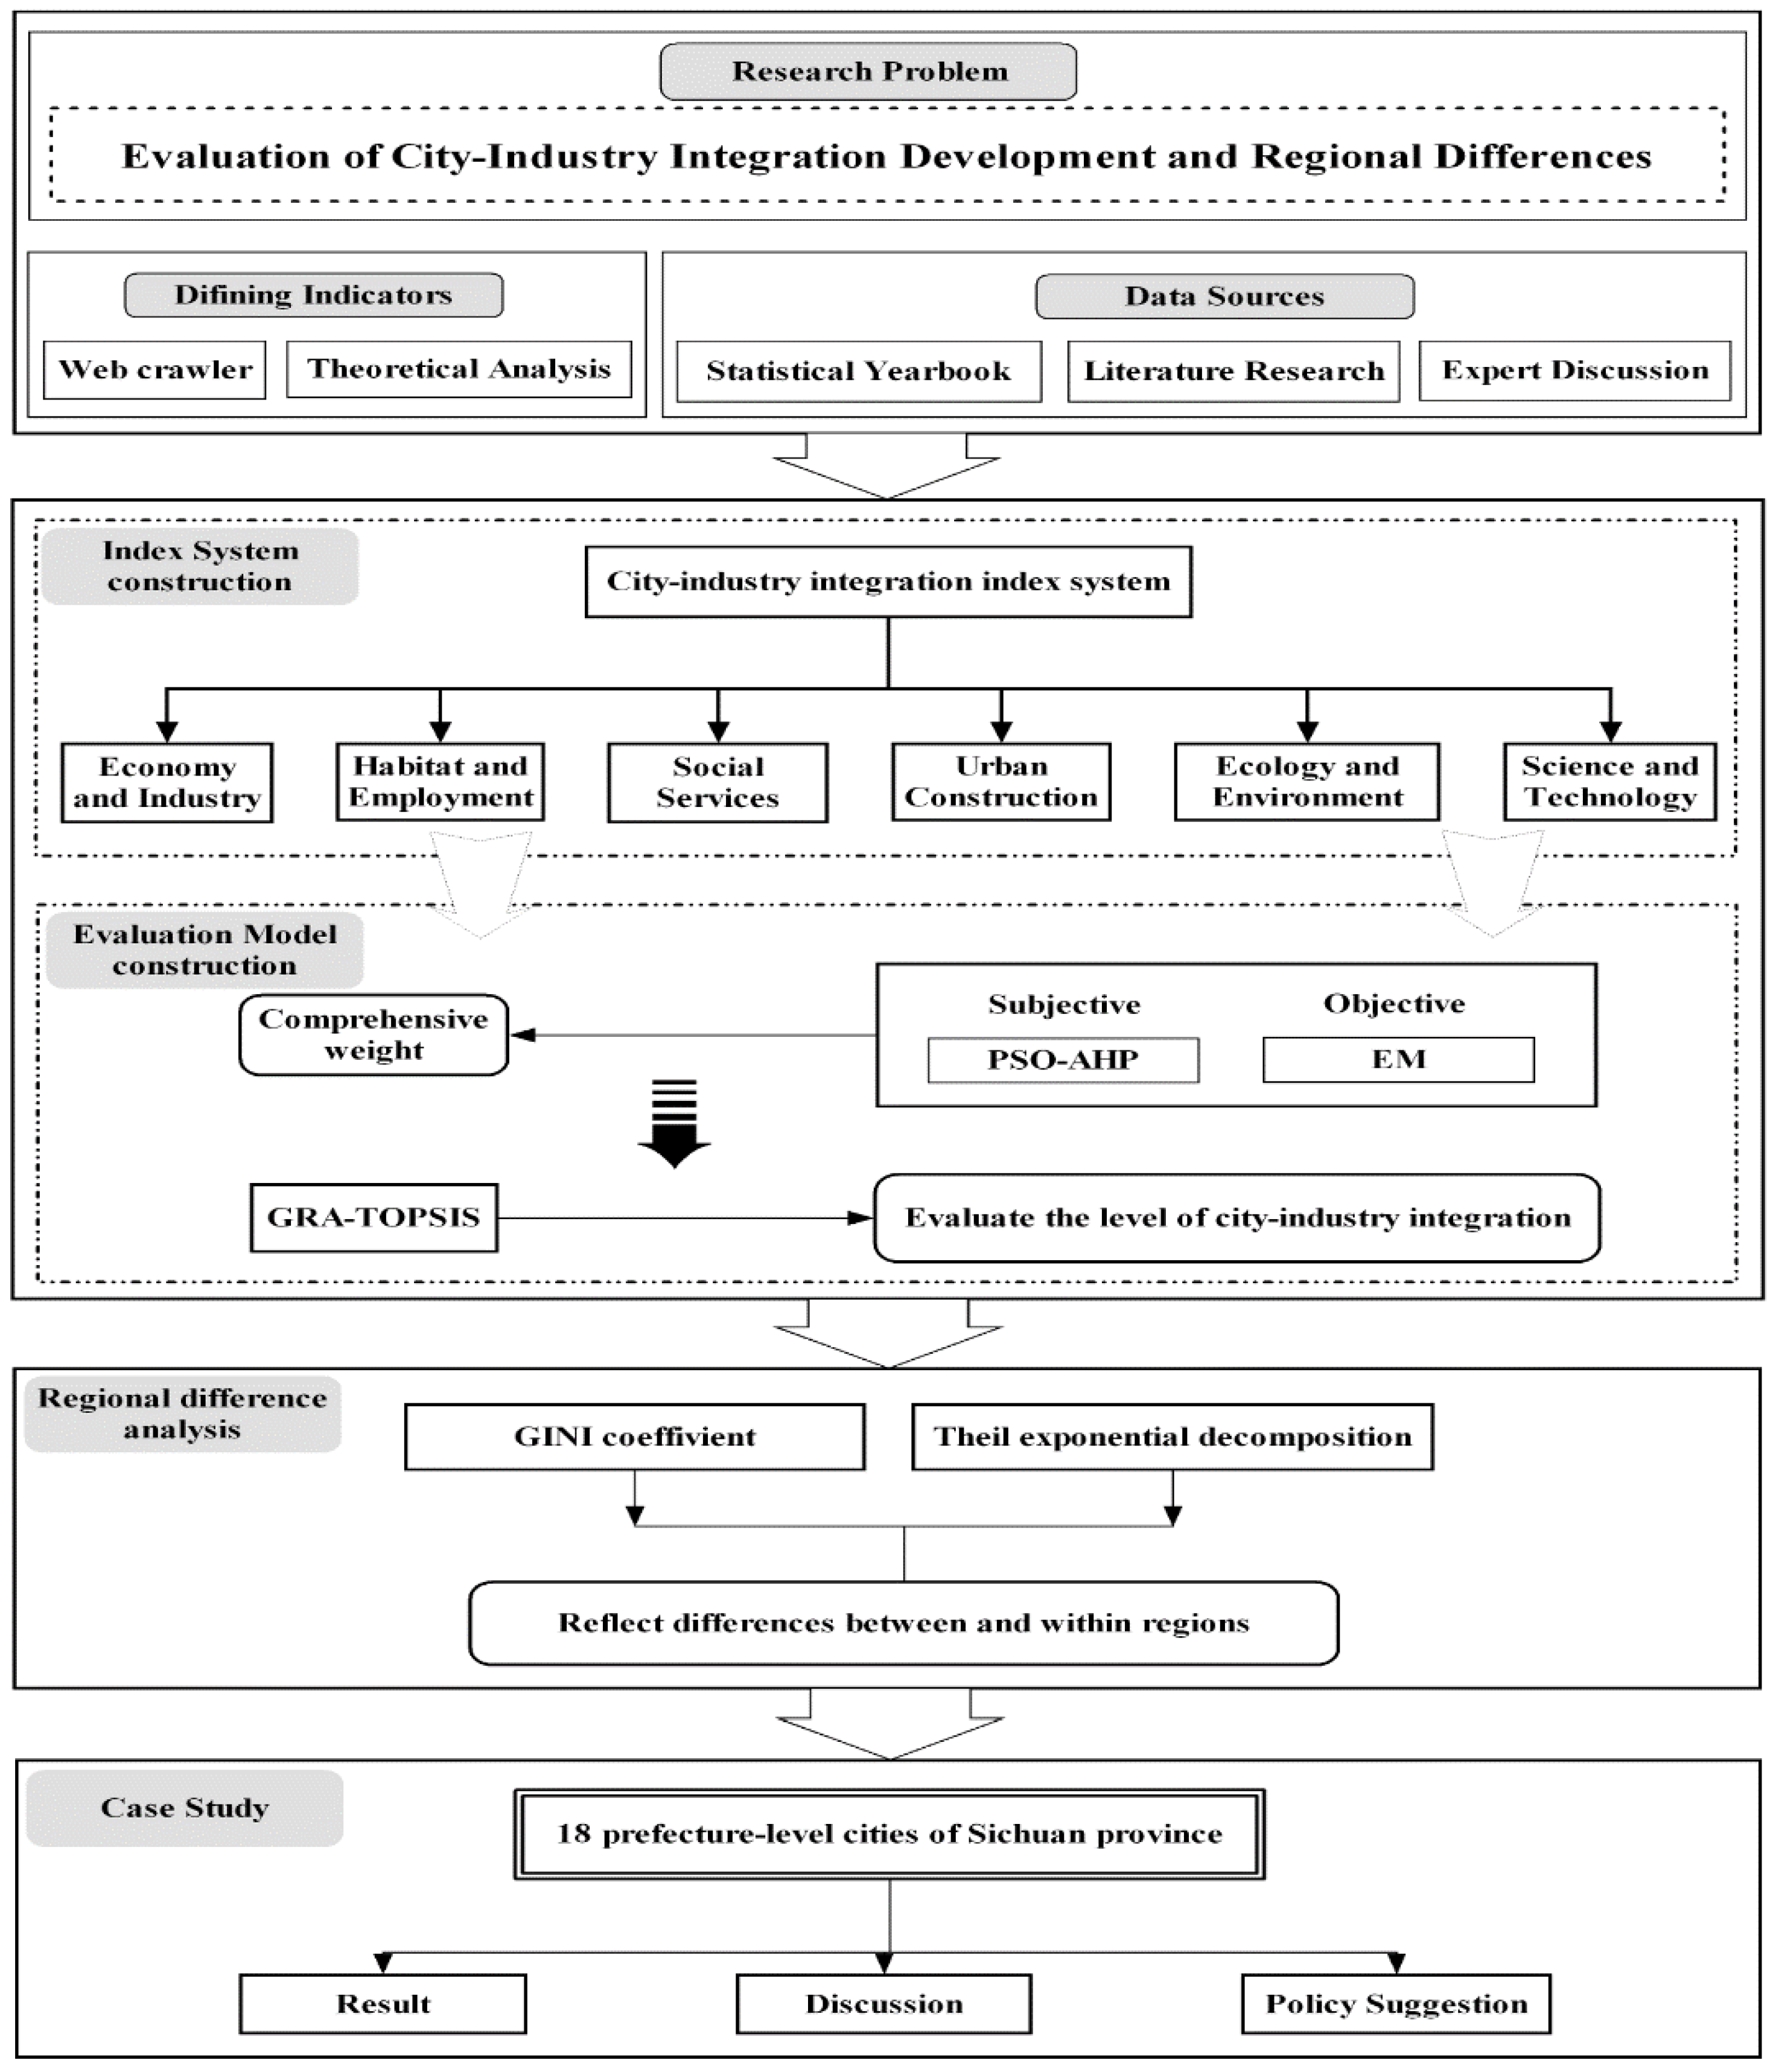
2.2. Research Framework
3. Materials and Methods
3.1. Evaluation Index System
3.1.1. Web Crawler

| Target Layer | Criteria Layer | Indicators | Indicator Sources |
|---|---|---|---|
| City integration production | Economy and industry | Per capita GDP (+) | 1. Literature research: Jia et al. [20]; Tang [28]; Zhou et al. [51] 2. Web crawler |
| The proportion of the secondary industry output value to the GDP (+) | |||
| The proportion of the tertiary industry output value to the GDP (+) | |||
| The gross industrial output value of enterprises above scale (+) | |||
| Habitat and employment | Household deposit balance (+) | 1. Literature research: Zhang and Shen [26]; Gan et al. [14]; Yan [52] 2. Web crawler | |
| The proportion of employed persons in the secondary industry (+) | |||
| Number of registered unemployed rate in urban areas (+) | |||
| Per capita housing area in urban areas (+) | |||
| Social services | Number of hospital beds per 10,000 people (+) | 1. Literature research: Li and Zhang [16]; Li and Zhang [18]; Zhou et al. [51] 2. Web crawler | |
| Number of autobuses per 10,000 people (+) | |||
| Culture sports and the media expenditure (+) | |||
| Number of schools per 10,000 people (+) | |||
| Urban construction | Investment in fixed assets in the construction of municipal public facilities (+) | 1. Literature research: He and Xia [21]; Yang and Fang [27]; Cong et al. [10] 2. Web crawler | |
| The proportion of industrial land (−) | |||
| The proportion of land used for public facilities (+) | |||
| Per capita urban road area (+) | |||
| Ecology and environment | Expenditure on energy saving (+) | 1. Literature research: Yang and Fang [27]; Yan [52] 2. Web crawler | |
| The comprehensive utilization rate of industrial solid waste (+) | |||
| Wastewater discharge (−) | |||
| The reduction rate of energy consumption per unit of GDP (+) | |||
| Science and technology | The number of people with a college degree or above per 10,000 people (+) | 1. Literature research: Zhen and Zhu [25]; Yan [52] 2. Web crawler | |
| Science and technology expenditure accounts for the proportion of fiscal expenditures (+) | |||
| R&D input intensity (+) | |||
| Applications granted (+) | |||
| The full-time equivalent of R&D personnel (+) |
3.1.2. Theoretical Analysis
3.2. Normalization
3.3. Combination Empowerment
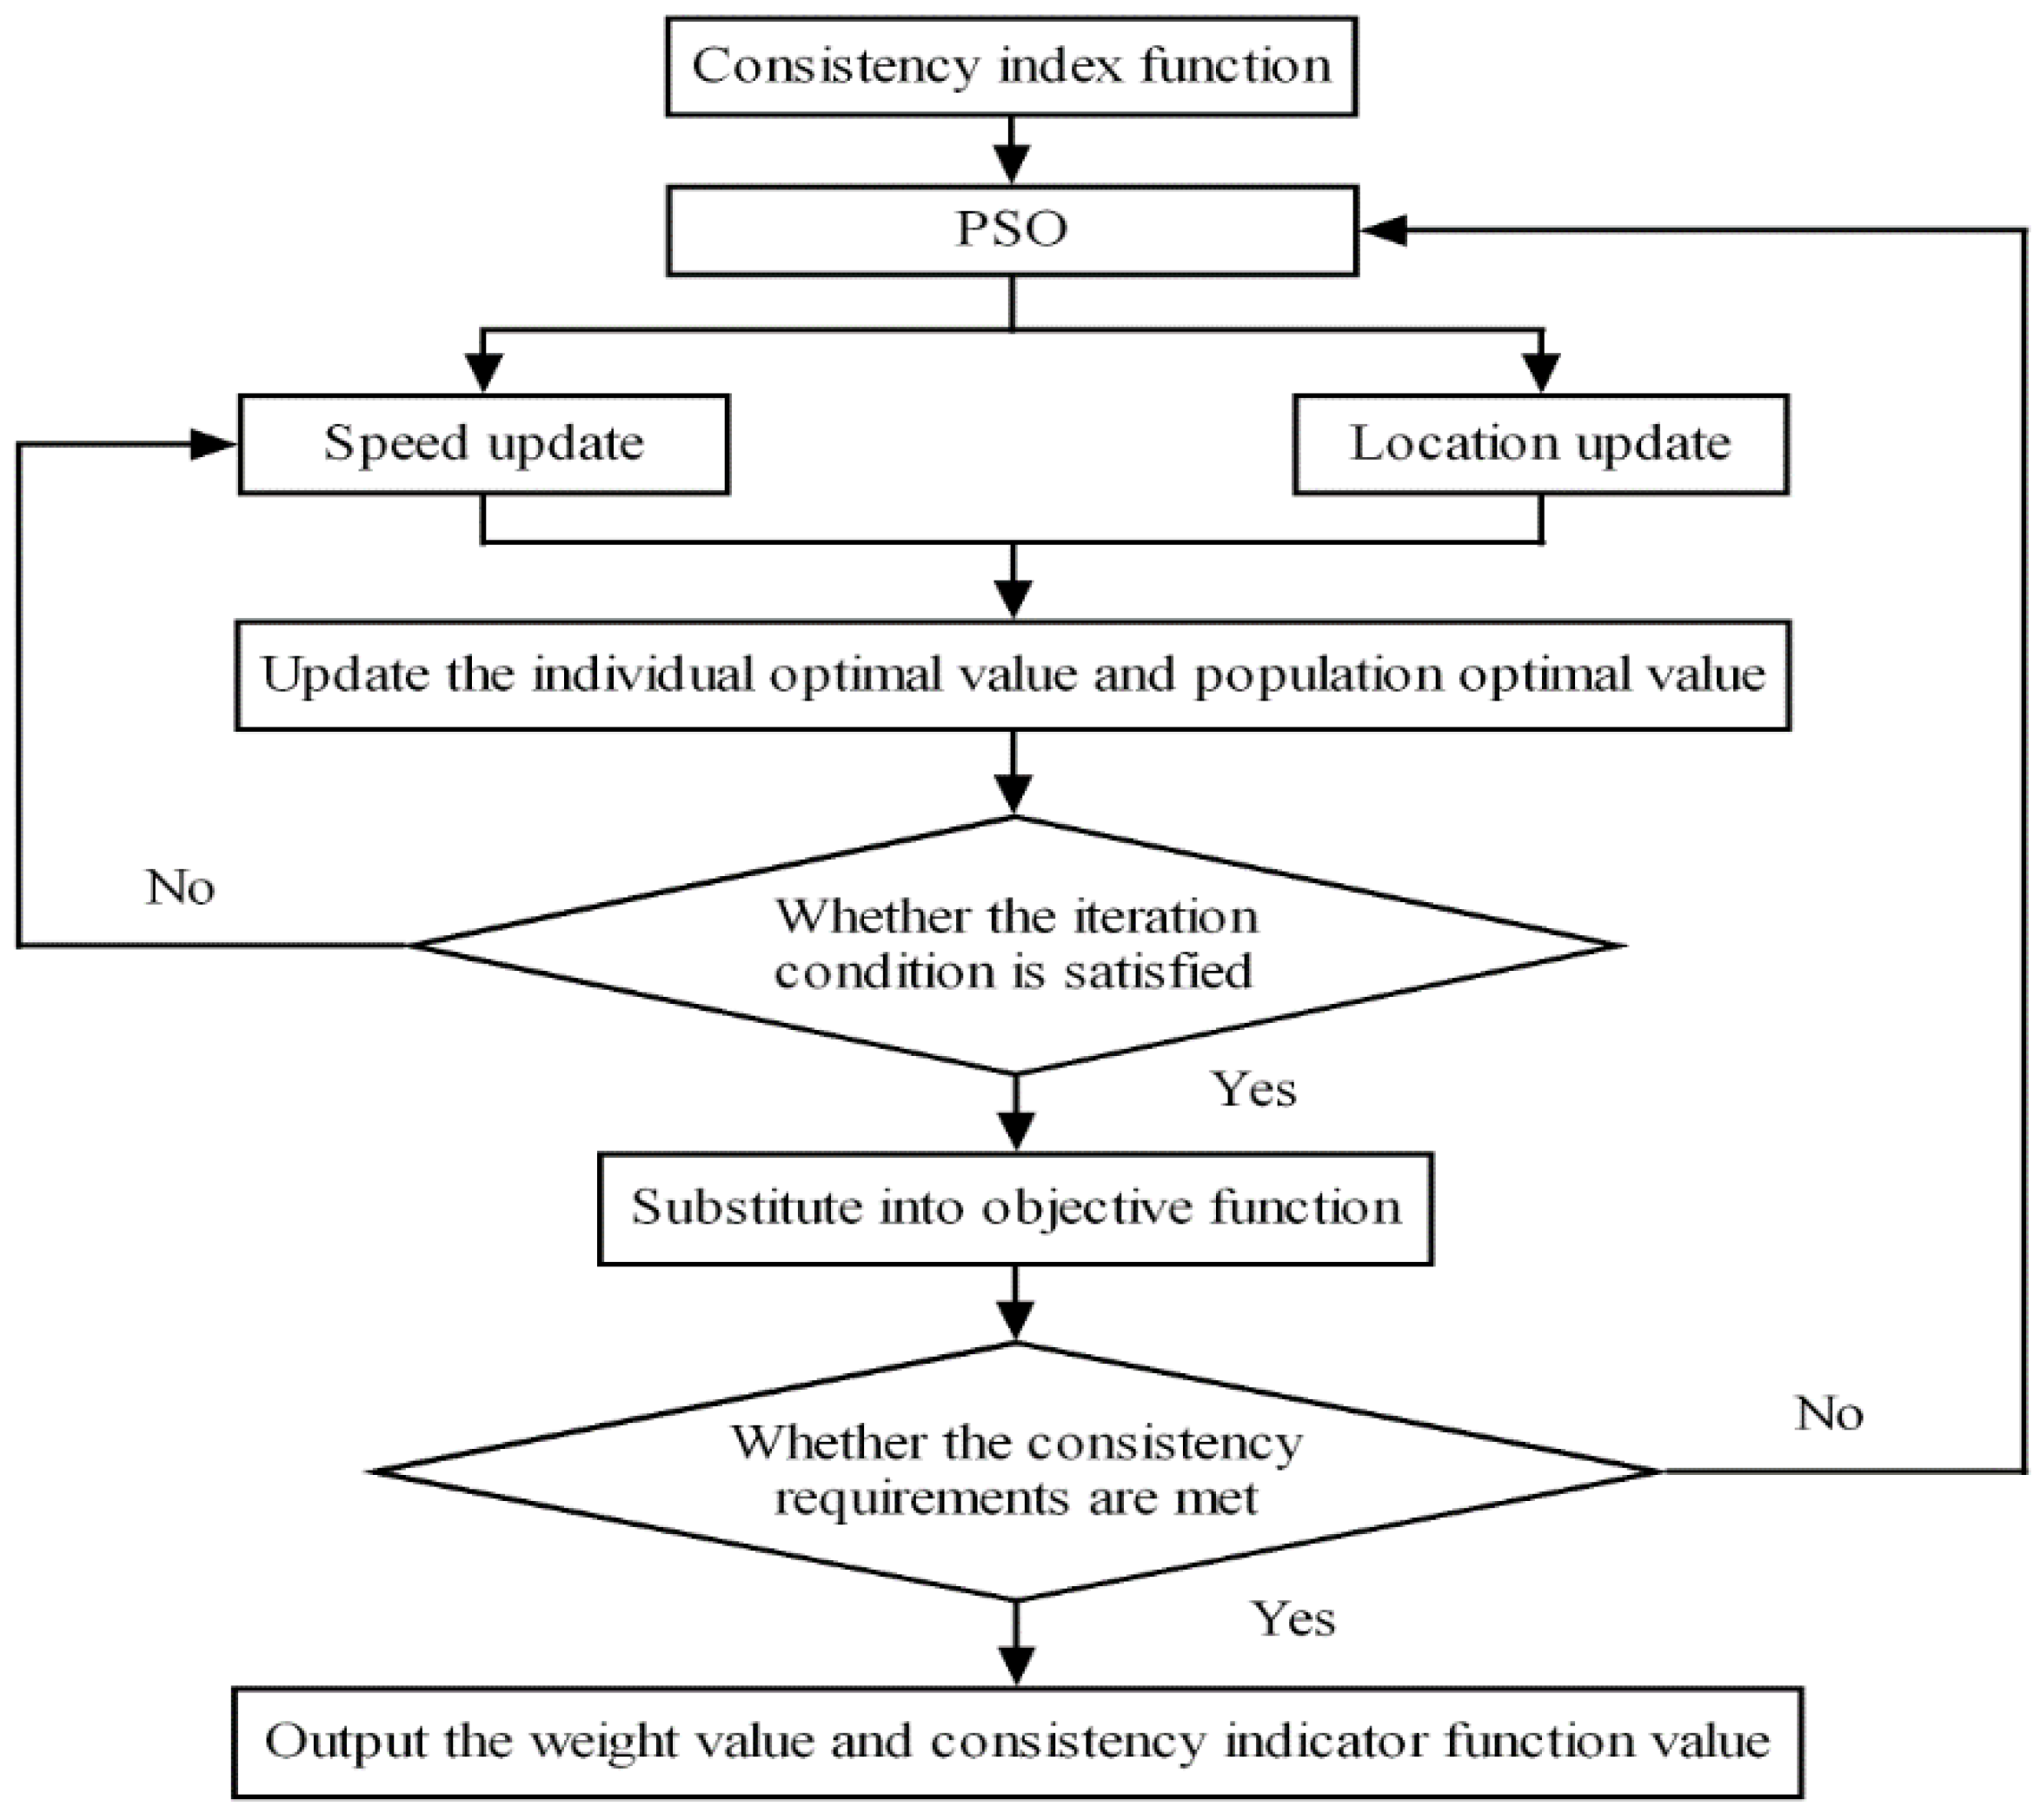
3.3.1. Subjective Weight Definition (PSO-AHP)
- Establish a hierarchical model: target layer; criterion layer; indicator layer.
- Construct a comparison matrix Ak. Using the nine-scale method for scaling, the values of the matrix elements are compared to reflect the relative importance of several factors. Get the comparison matrix.
- Determination of objective function.
- For the judgment matrix Ak, let the single ordering weight of each element be , . If the judgment matrix Ak satisfies , then Ak has complete consistency, that is, the consistency index is equal to 0.
- Obviously, the smaller the value at the left end of Equation (4), the higher the degree of the consistency of Ak. When Equation (5) is established, Ak has complete consistency. Therefore, the weight calculation and optimization of each element can be transformed into the following optimization problem:
- In Equation (6), is the consistency index function, and when the minimum value is obtained, the corresponding weight value is the optimal weight corresponding to matrix Ak.where is the medium weight of the lower element to the target layer, and is the weight of the element at the lower level relative to the element at the upper level. is the consistency indicator calculated by the final weight, and when its value is less than 0.1, it can be considered that the total sort result has satisfactory consistency.
- Determination of objective function. The algorithm flow is shown in Figure 3.
- Determine the parameters of the PSO algorithm, namely, the number of populations n, the maximum number of iterations N, and the learning factors c1 and c2; the variation range of vm is the inertia coefficient . In this article, n = 100, N = 500, c1 = c2 = 2, −vmax = −0.001, and vmax = 0.001.
- Normalize the weights to generate the initial solution of the particles. The feasible solution is substituted into Equation (5) to calculate the fitness of the initial particles, and the global optimal particles are selected from them. Update iterates over particles with Equations (10) and (11).
- After updating the fitness of the particles, compare and select the optimal position of the particles and the global. If the iteration termination condition is met, the iteration terminates, outputs the optimal solution obtained by the model, and moves on to the next step. If the iteration termination condition is not met, jump back to the first step until the iteration termination condition is met.
- Substitute the obtained optimal value into the objective function and calculate the consistency ratio value corresponding to the judgment matrix. If the consistency requirement is met, the next step is conducted; otherwise, adjust the judgment matrix and re-execute the loop. Finally, the global optimal position and corresponding weight value, and consistency indicator function value MinFCI are output.
3.3.2. Objective Weight Definition (EM)
- Calculate the characteristic weight.
- Calculate the information entropy ej and difference coefficient gj of the jth evaluation index.
- Calculate the weight of the jth index.
3.3.3. Blends Weighs
- Represent weights as a linear combination of subjective weights and objective weights .where is the proportion of subjective weights to the combined weights, and is the proportion of objective weights to the combined weights.
- The goal is to minimize the square sum of the deviation between the combined weight and the subjective weight, and the square sum of the deviation between the combined weight and the objective weight. Moreover, substitute the objective function into Equation (16).
- Take the derivative of Equation (18) with respect to and let the first derivative be zero, then obtain , and substitute it into Equation (16).
3.4. Evaluation Method (GRA-TOPSIS)
- Determine the positive ideal solution Z+ and negative ideal solution Z− of the weighted normalized matrix.where .
- Calculate the Euclid distance to the positive ideal solution di+ and negative ideal solution di− for each scheme.
- Calculate the gray correlation coefficient matrix between each scheme and the positive R+ and negative ideal solution R−.where is the resolution coefficient (). We take the value of 0.5 [64].
- Calculate the gray correlation degree of each scheme with the positive ideal solution r+ and the negative ideal solution r−.
- Dimensionless processing is performed on Euclid distance and correlation degree.
- Combine dimensionless distance and dimensionless correlation. The larger the values of Di− and Ri+, the closer the scheme is to the positive ideal solution, and so the combined formula can be determined as Equation (30).where . Sorting the cases according to the size of the relative closeness, the closer the degree is to one, the better the scheme is.
3.5. GINI
- Suppose X represents a non-negative random variable with a probability distribution function of , then there is a corresponding quantile function . If the form of the quantile function is determined as , the functional form of the Gini coefficient is obtained.where , and .
- Equation (31) is the continuous function form of the Gini coefficient, but the city–industry integration degree of each city from 2010 to 2019 calculated in this paper is discrete. Therefore, Fan’s calculation formula is adopted [65]:where . k represents the number of regions; yi represents the composite score of the ith region; and ei represents the overall score of the ith region as a share of the population, in order from lowest to highest.
3.6. Theil Exponential Decomposition
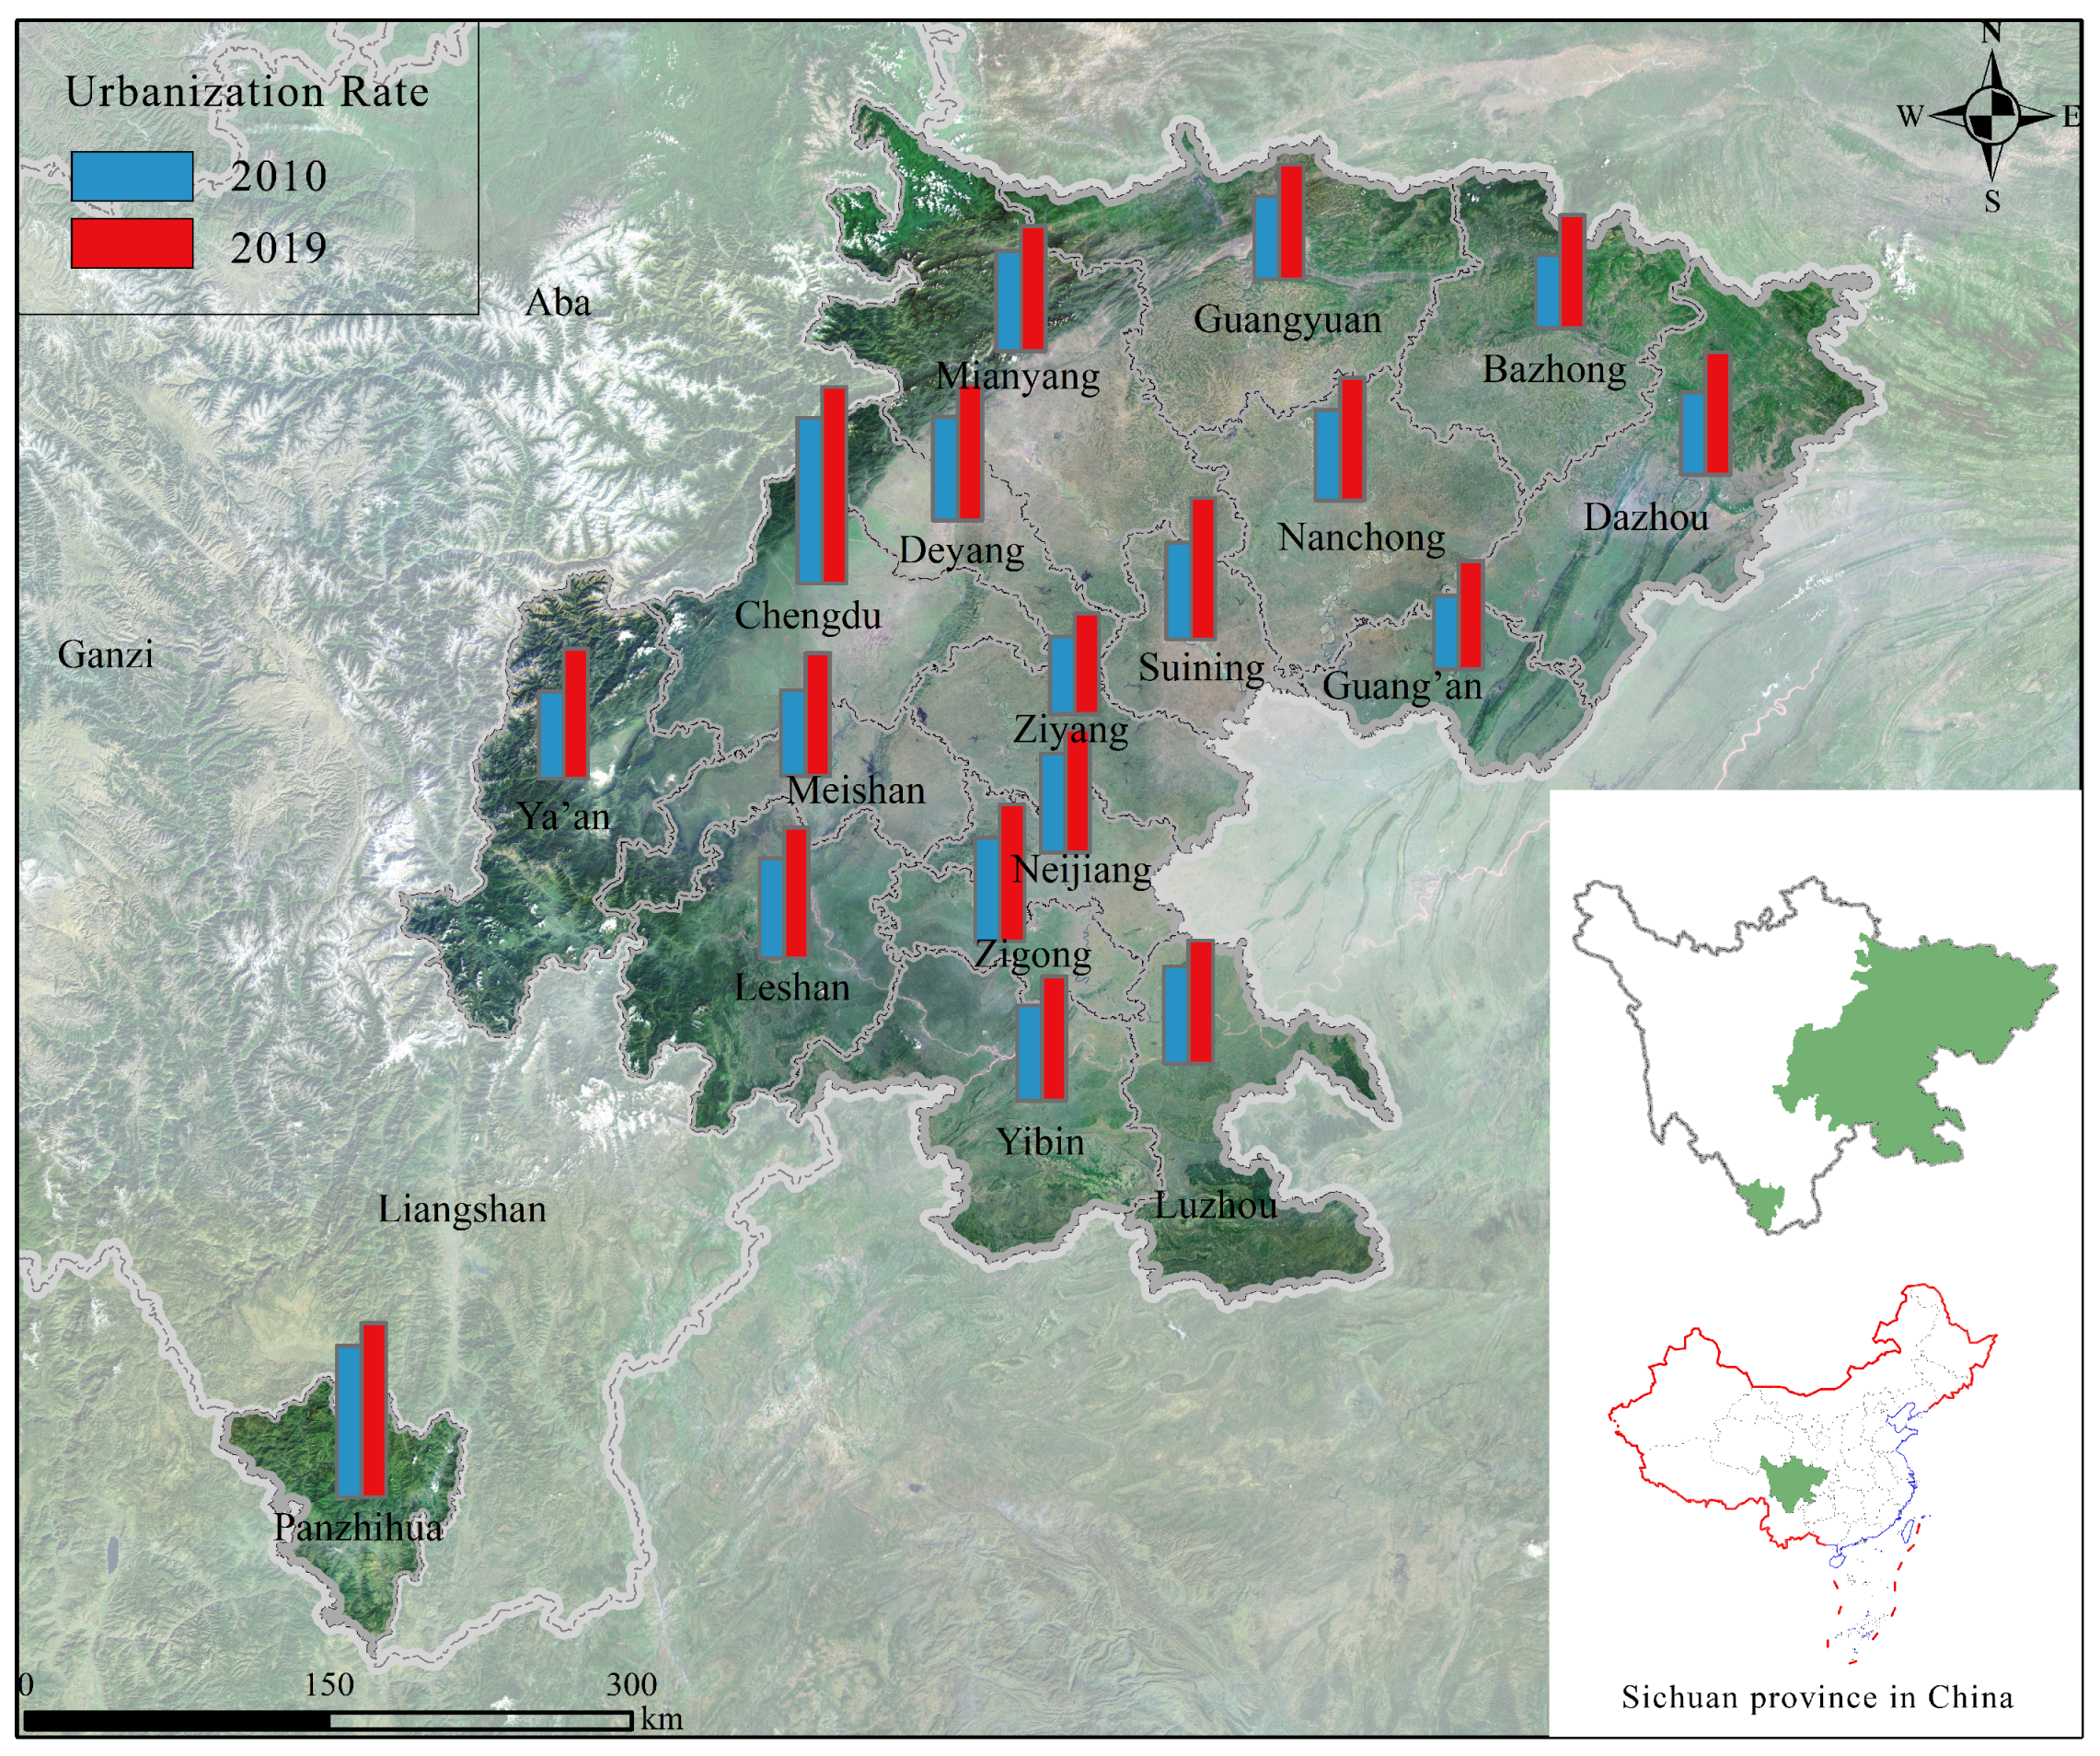
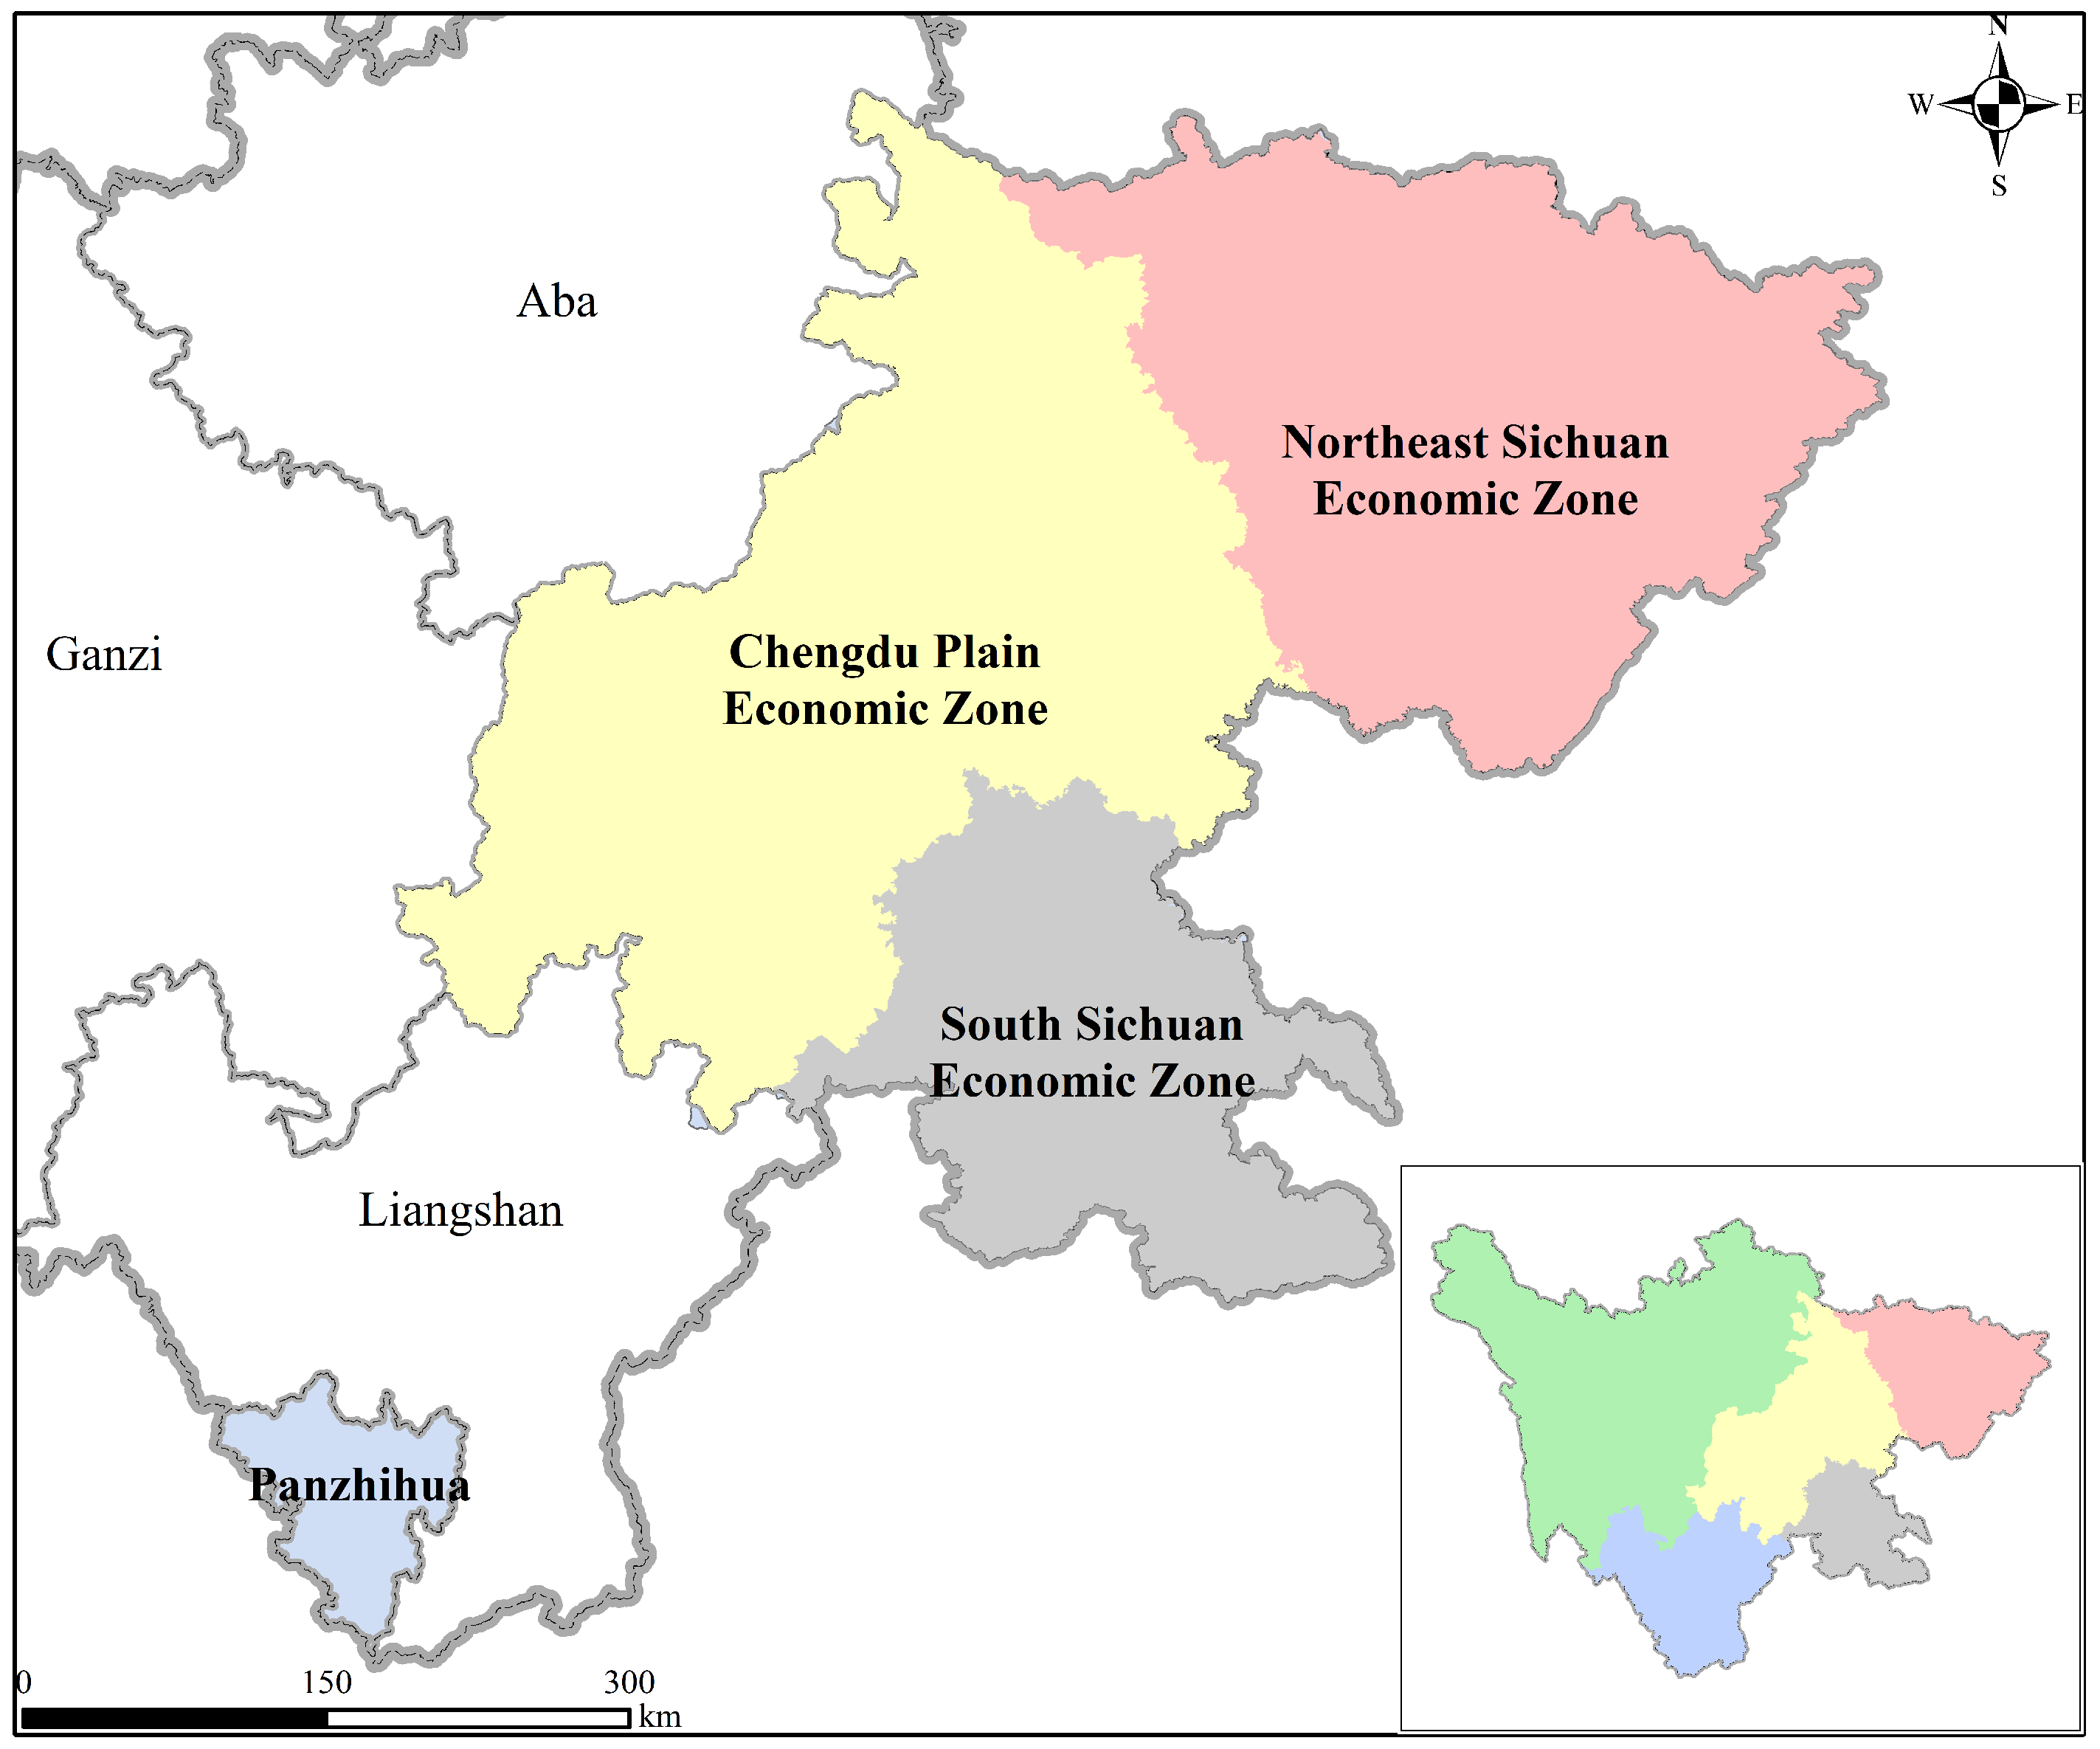
4. Case Study
4.1. Research Case Area
4.2. Data Acquisition and Result
4.2.1. Result of Indicator Data Processing
4.2.2. Result of the Development of City–Industry Integration
- Overall results and discussion of city–industry integration.
- 2.
- Evaluation results and discussion of each subsystem.
4.2.3. Differences in the Development Level of City–Industry Integration
4.3. Policy Suggestions
- (1)
- The development level of city–industry integration is not only affected by a single factor. In the development of urbanization, we should pay attention to the comprehensive coordination of industry, city, residents, environment, and science. People are an intermediate bridge connecting industries and cities, and the development level of people’s lives is an important measure of the quality of city–industry integration. Therefore, urbanization development should pay attention to increasing population welfare expenditure and improving the medical and health environment. At the same time, urbanization development should abandon the extensive industrial development mode with high pollution and high energy consumption and instead pay attention to the construction and protection of the urban ecological environment. The development concept of innovation, coordination, green, openness, and sharing is the fundamental idea for promoting the high-quality development of new urbanization in an all-around way.
- (2)
- Given the imbalance of regional development, it is necessary for the government to fundamentally play a role in resource allocation and provide a fair development environment for different cities, strengthening regional cooperation, cultivating urban agglomeration and support, and coordinating cross-regional development in order to weaken the regional differences of city–industry integration development. We took intraregional cooperation as a breakthrough in the reduction of the imbalance within the Chengdu Plain Economic Zone. The South Sichuan Economic Zone will further build a multi-center urban agglomeration integrated innovation and development pilot zone to improve its strategic position. Moreover, the Northeast Sichuan Economic Zone will provide full play to its eco-tourism strengths for industrial transformation, improving the scientific and technological innovation ability of south Sichuan and northeast Sichuan economic zones, establishing a cross-regional coordinated development mechanism, and realizing sustainable development.
5. Conclusions and Prospects
5.1. Conclusions
5.2. Shortcomings and Prospects
5.2.1. Study Limitations
- (1)
- Since the indicator data are characteristic of Sichuan Province, and the development of city–industry integration in each area has its unique characteristics, if the indicator system is applied to other regions or extended to the whole country, the evaluation indicators and corresponding data may need to be adjusted according to the conditions of the study area.
- (2)
- Although the evaluation system constructed in this paper is comprehensive, the evaluation indicators only select typical indicators, which simplify the complexity of the problem. At the same time, given the accessibility and validity of the data, this paper temporarily does not consider the data of the three autonomous prefectures in Sichuan Province, which has a certain impact on completely reflecting the overall level of Sichuan.
5.2.2. Future Research
- (1)
- With the updating and supplementation of statistical data, as well as the enrichment and refinement of statistical indicators, the index system of city–industry integration in Sichuan Province can be further improved. On the basis of refining the evaluation indexes, it will be of more reference value to measure the city–industry integration in areas with the same stage and type of urbanization development.
- (2)
- At present, there are few studies on regional differences for new urbanization, and less on city–industry integration. Therefore, in the future, more methods for regional differences can be introduced into the study of city–industry integration. This paper adopted mathematical statistics methods and spatial measurement methods such as the Moran index that can be introduced in the future, providing further development of the combined use of these two types of methods for spatial imbalance analysis.
Author Contributions
Funding
Institutional Review Board Statement
Informed Consent Statement
Data Availability Statement
Conflicts of Interest
Appendix A
| Data-Bind | Metric Classification | The Number of Indicators |
|---|---|---|
| Urban development | People | 14 |
| National accounts | 12 | |
| Labor employment | 50 | |
| Investment in fixed assets | 20 | |
| Industry | 35 | |
| Finance | 16 | |
| Foreign economic relations and trade | 6 | |
| Total retail sales of consumer goods | 14 | |
| Tourism | 4 | |
| Scientific and technological innovation | 4 | |
| Resource environment | 24 | |
| Public service | 50 | |
| Infrastructure | 45 |
References
- Li, C.; Zhang, Y.; Chai, Y. Do spatial factors outweigh institutional factors? Changes in influencing factors of home-work separation from 2007 to 2017 in Beijing. J. Transp. Geogr. 2021, 96, 103201. [Google Scholar] [CrossRef]
- Pei, Y.; Cai, X.; Li, J.; Song, K.; Liu, R. Method for Identifying the Traffic Congestion Situation of the Main Road in Cold-Climate Cities Based on the Clustering Analysis Algorithm. Sustainability 2021, 13, 9741. [Google Scholar] [CrossRef]
- Yang, C.; Zeng, W.; Yang, X. Coupling coordination evaluation and sustainable development pattern of geo-ecological environment and urbanization in Chongqing municipality, China. Sustain. Cities Soc. 2020, 61, 102271. [Google Scholar] [CrossRef]
- Woodworth, M.D.; Wallace, J.L. Seeing ghosts: Parsing China’s “ghost city” controversy. Urban Geogr. 2017, 38, 1270–1281. [Google Scholar] [CrossRef]
- Luo, S. Analysis of Realistic Background and Problems in Integration of Industries and Cities in China. J. SJTU (Philos. Soc. Sci.) 2014, 22, 17–21. [Google Scholar] [CrossRef]
- Hong, M.; Zhang, W. Industrial structure upgrading, urbanization and urban-rural income disparity: Evidence from China. Appl. Econ. Lett. 2021, 28, 1321–1326. [Google Scholar] [CrossRef]
- Zhang, D. The New Concept of “City-industry Integration”. Decis. Mak. 2011, 1, 1. [Google Scholar] [CrossRef]
- Liu, X. City-Industry Integration: Literature Review. J. Xi’an Univ. Financ. Econ. 2015, 28, 48–52. [Google Scholar] [CrossRef]
- Wu, H. Review on Development of City Integration from the Perspective of New Urbanization. J. Ind. Technol. Econ. 2019, 38, 77–81. [Google Scholar]
- Cong, H.; Zou, D.; Liu, C. Analysis of Spatial-Temporal Pattern of City-Industry Integration against the Perspective of a New Kind of Urbanization. Econ. Geogr. 2017, 37, 46–55. [Google Scholar] [CrossRef]
- Lan, F. Analysis on the Development of City-industry Integration in Sichuan. Mark. Mod. 2012, 26, 142. [Google Scholar] [CrossRef]
- Jiang, H. Discussion on the Integration Development of Industry-City and the Mutual Integration of Urban Construction: A Case Study of Tianfu New Area of Sichuan Province. Reform Econ. Syst. 2012, 6, 43–47. [Google Scholar]
- Cai, W.; Yang, D. Study on development route and planning strategy of industry-city integration led by modern agriculural demonstration area in a county—Taking Cangxi County of Sichuan Province as an example. Jiangsu Agric. Sci. 2018, 46, 328–331+339. [Google Scholar] [CrossRef]
- Gan, L.; Shi, H.; Hu, Y.; Lev, B.; Lan, H. Coupling coordination degree for urbanization city-industry integration level: Sichuan case. Sustain. Cities Soc. 2020, 58, 102136. [Google Scholar] [CrossRef]
- Chen, Y.; Huang, X. Integration and Symbiosis of Industry and City in Pan County Economy: Evolutionary Logic, Theoretical Deconstruction and Industrial Path. Macroeconomics 2016, 4, 135–142. [Google Scholar] [CrossRef]
- Li, Y.; Zhang, Z. Evaluation and Threshold Effect of City-industry Integration in Western China. Stat. Decis. 2021, 37, 86–90. [Google Scholar] [CrossRef]
- Zou, D.; Cong, H. Spatio-Temporal Diversity Pattern of City-Industry Integration and Its Influencing Factors in China. Ecnonmic Geogr. 2019, 39, 66–74. [Google Scholar] [CrossRef]
- Li, Y.; Zhang, W. Research on the Development Level of Industry-city Integration from the Perspective of New Urbanization: A Case Study of the Five Provinces in Northwest China. J. Commer. Econ. 2018, 1, 147–149. [Google Scholar]
- Su, L.; Jia, J.J. Empirical research about the degree of city-industry integration: A contrast of the typical cities in China. J. Interdiscip. Math. 2017, 20, 87–100. [Google Scholar] [CrossRef]
- Jia, J.; Bai, S.; Wang, X.; Li, S. Evaluation of Industry-city Integration Measure about National Hi-tech Zones of Henan Province. Areal Res. Dev. 2019, 38, 30–34. [Google Scholar]
- He, Y.; Xia, Y. Evaluation and Countermeasures of Industry-city Integration in Jiangsu Province. Mod. Econ. Res. 2017, 2, 72–76. [Google Scholar] [CrossRef]
- Tang, X. A Study for City-Industry Integration Evaluation Model of Development Zone Based on Grey Correlation Analysis. Shanghai J. Econ. 2014, 6, 85–92+102. [Google Scholar] [CrossRef]
- Shi, B.; Deng, Y. Research on the Dynamic Coupling and Coordinated Development of the Integration of the Industries and the City in the Process of Resource-Based Cities. Ecol. Econ. 2017, 33, 122–125. [Google Scholar]
- Shao, Z. Industry and City Integration; Springer: Berlin/Heidelberg, Germany, 2015. [Google Scholar]
- Zheng, B.; Zhu, J. Evaluation of Industry-city Integration Degree of National Independent Innovation Demonstration Zone. Stat. Decis. 2016, 18, 65–68. [Google Scholar] [CrossRef]
- Zhang, J.; Shen, Z. Evaluation of City-Industry Integration in the Middle Reaches of the Yangtze River. Shanghai J. Econ. 2017, 3, 109–114. [Google Scholar] [CrossRef]
- Yang, H.; Fang, B. Research of the City - Industry Integration of the Yangzhong City on the Principal Component. Chin. J. Agric. Resour. Reg. Plan. 2016, 37, 99–105+125. [Google Scholar]
- Tang, S. Measurement and Path Optimization of City-industry Integration Development—A Case Study of Guangxi. J. Commer. Econ. 2020, 8, 158–161. [Google Scholar]
- An, J.; Wang, R. The Coupling and Coordination Evaluation of City–industry Integration in State-level New Area—Taking Zhoushan Islands New Area and Qingdao West Coast New Area as Examples. Resour. Dev. Mark. 2021, 37, 287–293. [Google Scholar]
- Wang, X.; Su, L.; Guo, B.; Li, X. Evaluation of Industry-city Integration of High-Tech District Based on Factor Analysis and Cluster Analysis. Sci. Technol. Prog. Policy 2013, 30, 26–29. [Google Scholar]
- Su, L.; Guo, B.; Li, X. Fuzzy AHP Evaluation on Production-city Integration of Shanghai Zhangjiang High-tech Zone. J. Ind. Technol. Econ. 2013, 32, 12–16. [Google Scholar]
- Wang, X.; Wang, Y.; Su, L.; Guo, B.; Wang, S. Index Evaluation System on Degree of Production-City Integration in High-Tech Zones in China: Based on Factor Analysis and Entropy-Based Weight. Sci. Sci. Manag. S. T. 2014, 35, 79–88. [Google Scholar]
- Zhang, W.; He, S.; Jiang, L.; Huang, J.; Tang, C.; Xu, K. Calculation and Evaluation of Spatial Layout of Circum-Bohai Sea City Innovation Industrial Parks Based on City-Industry Integration. J. Coast. Res. 2019, 732–737. [Google Scholar] [CrossRef]
- Gan, X.; Mao, X. Research on the Measurement and Evaluation of the Integration Degree of Industrial Undertaking Industrial Park Based on AHP and Gray Correlation—A Case Study of 14 National Industrial Parks in Jiangxi. J. Nanchang Univ. 2016, 47, 88–95. [Google Scholar] [CrossRef]
- Gan, L.; Wang, Y.; Li, Z.; Lev, B. A loss-recovery evaluation tool for debris flow. Int. J. Disaster Risk Reduct. 2019, 37, 101165. [Google Scholar] [CrossRef]
- Fang, C.; Liu, X. Temporal and spatial differences and imbalance of China’s urbanization development during 1950–2006. J. Geogr. Sci. 2009, 19, 719–732. [Google Scholar] [CrossRef]
- Xiang, Y.; Shao, W.; Wang, S.; Zhang, Y.; Zhang, Y. Study on Regional Differences and Convergence of Green Development Efficiency of the Chemical Industry in the Yangtze River Economic Belt Based on Grey Water Footprint. Int. J. Environ. Res. Public Health 2022, 19, 1703. [Google Scholar] [CrossRef] [PubMed]
- Lu, S.; Jiang, H.; Liu, Y.; Huang, S. Regional disparities and influencing factors of Average CO2 Emissions from transportation industry in Yangtze River Economic Belt. Transp. Res. Part D-Transp. Environ. 2017, 57, 112–123. [Google Scholar] [CrossRef]
- Blazek, J.; Netrdova, P. Regional unemployment impacts of the global financial crisis in the new member states of the EU in Central and Eastern Europe. Eur. Urban Reg. Stud. 2012, 19, 42–61. [Google Scholar] [CrossRef]
- Li, J.; Yang, Y.; Fan, J.; Jin, F.; Zhang, W.; Liu, S.; Fu, B. Comparative research on regional differences in urbanization and spatial evolution of urban systems between China and India. J. Geogr. Sci. 2018, 28, 1860–1876. [Google Scholar] [CrossRef]
- Liu, C.; Wang, T.; Guo, Q. Factors Aggregating Ability and the Regional Differences among China’s Urban Agglomerations. Sustainability 2018, 10, 4179. [Google Scholar] [CrossRef] [Green Version]
- Wang, Q.; Jin, C. Quantitative Measurement of Economic Development Imbalance among Urban Agglomerations in China. J. Quant. Tech. Econ. 2018, 35, 77–94. [Google Scholar] [CrossRef]
- Guo, Y.; Li, L. Influencing factors of regional economic inequality in inland provinces of western China: A case study of Chongqing. Geogr. Res. 2017, 36, 926–944. [Google Scholar]
- Yan, J.; Sun, Q. Temporal and Spatial Evolution of County Economic Difference since the Establishment of Chongqing Municipality. J. Southwest Univ. (Nat. Sci.) 2020, 42, 106–116. [Google Scholar] [CrossRef]
- Pang, J.; Li, H.; Lu, C.; Lu, C.; Chen, X. Regional Differences and Dynamic Evolution of Carbon Emission Intensity of Agriculture Production in China. Int. J. Environ. Res. Public Health 2020, 17, 7541. [Google Scholar] [CrossRef] [PubMed]
- Han, X.; Yu, J.; Xia, Y.; Wang, J. Spatiotemporal characteristics of carbon emissions in energy-enriched areas and the evolution of regional types. Energy Rep. 2021, 7, 7224–7237. [Google Scholar] [CrossRef]
- Zhao, Y.; Cheng, J.; Zhu, Y.; Zhao, Y. Spatiotemporal Evolution and Regional Differences in the Production-Living-Ecological Space of the Urban Agglomeration in the Middle Reaches of the Yangtze River. Int. J. Environ. Res. Public Health 2021, 18, 2497. [Google Scholar] [CrossRef]
- Zhang, Y.; Deng, X. Knowledge Mapping Visualization Analysis of Industry-City Integration. J. Sichuan Univ. Sci. Eng. (Soc. Sci. Ed.) 2018, 33, 54–73. [Google Scholar]
- Gan, L.; Wang, Y.; Wang, Y.; Lev, B.; Shen, W.; Jiang, W. Coupling coordination analysis with data-driven technology for disaster-economy-ecology system: An empirical study in China. Nat. Hazards 2021, 107, 2123–2153. [Google Scholar] [CrossRef]
- Garcia, B.; Gallego, M.; Gortazar, F.; Munoz-Organero, M. A Survey of the Selenium Ecosystem. Electronics 2020, 9, 1067. [Google Scholar] [CrossRef]
- Zhou, Z.; Zhou, G.; Wang, Y.; Xiao, J. Evaluation on Industry-City Integration of City Group Around Chang-Zhu-Tan City. J. Nat. Sci. Hunan Norm. Univ. 2016, 39, 8–13. [Google Scholar]
- Yan, B. Practical Consideration and Path Improvement of Industry-city Integration Development—A Case Study of Industry-city Integration Development in Shandong Province. Shandong Soc. Sci. 2017, 5, 184–188. [Google Scholar] [CrossRef]
- Chang, Y.J.; Wu, X.F.; Chen, G.M.; Ye, J.H.; Chen, B.; Xu, L.B.; Zhou, J.L.; Yin, Z.M.; Ren, K.R. Comprehensive risk assessment of deepwater drilling riser using fuzzy Petri net model. Process Saf. Environ. Protect. 2018, 117, 483–497. [Google Scholar] [CrossRef]
- Yu, X.; Wu, X.; Huo, T. Combine MCDM Methods and PSO to Evaluate Economic Benefits of High-Tech Zones in China. Sustainability 2020, 12, 7833. [Google Scholar] [CrossRef]
- Shi, Z.; Zheng, B. Construction and Application of PSO-AHP Model in Comprehensive Evaluation. Stat. Decis. 2012, 1, 30–33. [Google Scholar] [CrossRef]
- Huang, P.C.; Tong, L.I.; Chang, W.W.; Yeh, W.C. A two-phase algorithm for product part change utilizing AHP and PSO. Expert Syst. Appl. 2011, 38, 8458–8465. [Google Scholar] [CrossRef]
- Di, H.; Liu, X.; Zhang, J.; Tong, Z.; Ji, M. The Spatial Distributions and Variations of Water Environmental Risk in Yinma River Basin, China. Int. J. Environ. Res. Public Health 2018, 15, 521. [Google Scholar] [CrossRef] [PubMed] [Green Version]
- Liu, X.; Zhang, W.; Qu, Z.; Guo, T.; Sun, Y.; Rabiei, M.; Cao, Q. Feasibility evaluation of hydraulic fracturing in hydrate-bearing sediments based on analytic hierarchy process-entropy method (AHP-EM). J. Nat. Gas Sci. Eng. 2020, 81, 103434. [Google Scholar] [CrossRef]
- Shang, H. The evaluation of stakeholders’satisfiction with the eco-industrial parks based on combined weights. Sci. Res. Manag. 2011, 32, 131–138+147. [Google Scholar] [CrossRef]
- Kirubakaran, B.; Ilangkumaran, M. Selection of optimum maintenance strategy based on FAHP integrated with GRA-TOPSIS. Ann. Oper. Res. 2016, 245, 285–313. [Google Scholar] [CrossRef]
- Wei, G.; Lu, J.; Wei, C.; Wu, J. Probabilistic linguistic GRA method for multiple attribute group decision making. J. Intell. Fuzzy Syst. 2020, 38, 4721–4732. [Google Scholar] [CrossRef]
- Rani, P.; Mishra, A.R.; Mardani, A.; Cavallaro, F.; Alrasheedi, M.; Alrashidi, A. A novel approach to extended fuzzy TOPSIS based on new divergence measures for renewable energy sources selection. J. Clean. Prod. 2020, 257, 120352. [Google Scholar] [CrossRef]
- You, W.; Wang, J.; Liu, F.; Zhang, S.; Peng, L. Risk Sharing of Urban Rail Transit PPP Project Based on GRA-TOPSIS. J. Civ. Eng. Manag. 2018, 35, 15–21+27. [Google Scholar] [CrossRef]
- Wang, Y.; Zhou, L.H.; Yang, G.J.; Guo, R.; Xia, C.Z.; Liu, Y. Performance and Obstacle Tracking to Natural Forest Resource Protection Project: A Rangers’ Case of Qilian Mountain, China. Int. J. Environ. Res. Public Health 2020, 17, 5672. [Google Scholar] [CrossRef] [PubMed]
- Fan, J.; Zhu, G. The Evolution of Regional Disparities in China and Its Structural Decomposition. J. Manag. World 2002, 7, 37–44. [Google Scholar] [CrossRef]
- Yang, L.; Wang, H.; Xue, L. What about the health workforce distribution in rural China? An assessment based on eight-year data. Rural Remote Health 2019, 19, 4978. [Google Scholar] [CrossRef] [PubMed] [Green Version]
- Theil, H.; Uribe, P. The Information Approach to the Aggregation of Input-Output Tables. Rev. Econ. Stat. 1967, 49, 451. [Google Scholar] [CrossRef]


| Authors | Main Method |
|---|---|
| Zhang and Shen, etc. [26] | AHP |
| Su et al., etc. [31] | Fuzzy comprehensive analysis |
| Wang et al., etc. [32] | Factor analysis |
| Yang and Fang, etc. [27] | Principal component analysis |
| Zhang et al., etc. [33] | EM |
| Tang, etc. [22] | GRA |
| Gan and Mao, etc. [34] | TOPSIS |
| Model | Judgment Matrix | W1 | W2 | W3 | W4 | W5 | W6 | Consistency Indicator Function Value |
|---|---|---|---|---|---|---|---|---|
| PSO-AHP | B | 0.2661 | 0.1944 | 0.1681 | 0.1650 | 0.1328 | 0.0736 | 0.0455 |
| C1 | 0.3623 | 0.1453 | 0.2974 | 0.1950 | 0.0242 | |||
| C2 | 0.2326 | 0.1534 | 0.3478 | 0.2662 | 0.0367 | |||
| C3 | 0.2495 | 0.1236 | 0.3990 | 0.2279 | 0.0322 | |||
| C4 | 0.3623 | 0.1092 | 0.1966 | 0.3319 | 0.0288 | |||
| C5 | 0.4113 | 0.1526 | 0.1076 | 0.3285 | 0.0228 | |||
| C6 | 0.0978 | 0.3761 | 0.1972 | 0.1666 | 0.1623 | 0.0225 | ||
| AHP | B | 0.2490 | 0.1917 | 0.1645 | 0.1604 | 0.1221 | 0.1123 | 0.0625 |
| C1 | 0.3539 | 0.1642 | 0.2918 | 0.1902 | 0.0552 | |||
| C2 | 0.2263 | 0.1825 | 0.3322 | 0.2589 | 0.0777 | |||
| C3 | 0.2427 | 0.1517 | 0.3910 | 0.2147 | 0.0804 | |||
| C4 | 0.3507 | 0.1345 | 0.1935 | 0.3214 | 0.0800 | |||
| C5 | 0.4012 | 0.1498 | 0.1274 | 0.3216 | 0.0682 | |||
| C6 | 0.1169 | 0.3690 | 0.1936 | 0.1642 | 0.0450 |
| Criteria Layer | Indicators * | PSO-AHP | EM | Comprehensive Weight |
|---|---|---|---|---|
| Economy and industry | PG | 0.0964 | 0.0231 | 0.0598 |
| PSOVG | 0.0387 | 0.0104 | 0.0245 | |
| PTOVG | 0.0791 | 0.0181 | 0.0486 | |
| GIOVEAS | 0.0519 | 0.0340 | 0.0430 | |
| Habitat and employment | HDB | 0.0452 | 0.0802 | 0.0627 |
| PES | 0.0298 | 0.0107 | 0.0202 | |
| PUTP | 0.0676 | 0.0221 | 0.0449 | |
| PCHA | 0.0517 | 0.0111 | 0.0314 | |
| Social services | NB | 0.0419 | 0.0285 | 0.0352 |
| NA | 0.0208 | 0.0391 | 0.0300 | |
| CSME | 0.0671 | 0.0680 | 0.0676 | |
| NS | 0.0383 | 0.0201 | 0.0292 | |
| Urban construction | IFAC | 0.0598 | 0.0947 | 0.0773 |
| PII | 0.0180 | 0.0134 | 0.0157 | |
| PBF | 0.0324 | 0.0552 | 0.0438 | |
| PURA | 0.0548 | 0.0095 | 0.0322 | |
| Ecology and environment | EEA | 0.0546 | 0.0271 | 0.0408 |
| CURISW | 0.0203 | 0.0054 | 0.0128 | |
| WD | 0.0143 | 0.0139 | 0.0141 | |
| RRECPG | 0.0436 | 0.0196 | 0.0316 | |
| Science and technology | NP | 0.0072 | 0.0382 | 0.0227 |
| SEAPUFE | 0.0277 | 0.0270 | 0.0283 | |
| RDII | 0.0145 | 0.0614 | 0.0379 | |
| AG | 0.0123 | 0.1718 | 0.0921 | |
| FERDP | 0.0119 | 0.0975 | 0.0547 |
| Region | 2010 | 2011 | 2015 | 2018 | 2019 | |||||
|---|---|---|---|---|---|---|---|---|---|---|
| Score | Ranking | Score | Ranking | Score | Ranking | Score | Ranking | Score | Ranking | |
| Chengdu | 0.6282 | 1 | 0.5970 | 1 | 0.6228 | 1 | 0.6390 | 1 | 0.6300 | 1 |
| Zigong | 0.3835 | 4 | 0.3745 | 7 | 0.3790 | 6 | 0.3682 | 13 | 0.3718 | 9 |
| Panzhihua | 0.3975 | 3 | 0.3963 | 4 | 0.3910 | 4 | 0.4062 | 2 | 0.3917 | 3 |
| Luzhou | 0.3529 | 16 | 0.3395 | 17 | 0.3570 | 13 | 0.3657 | 14 | 0.3639 | 14 |
| Deyang | 0.3827 | 6 | 0.3755 | 6 | 0.3793 | 5 | 0.3851 | 5 | 0.3976 | 2 |
| Mianyang | 0.4186 | 2 | 0.4077 | 3 | 0.4164 | 3 | 0.3891 | 3 | 0.3786 | 7 |
| Guangyuan | 0.3634 | 12 | 0.3494 | 13 | 0.3498 | 15 | 0.3864 | 4 | 0.3912 | 4 |
| Suining | 0.3548 | 14 | 0.3523 | 11 | 0.3707 | 8 | 0.3719 | 10 | 0.3547 | 18 |
| Neijiang | 0.3559 | 13 | 0.3468 | 15 | 0.3539 | 14 | 0.3352 | 18 | 0.3612 | 16 |
| Leshan | 0.3832 | 5 | 0.3770 | 5 | 0.3764 | 7 | 0.3698 | 11 | 0.3714 | 10 |
| Nanchong | 0.3784 | 7 | 0.3749 | 9 | 0.3671 | 11 | 0.3724 | 8 | 0.3711 | 11 |
| Meishan | 0.3644 | 11 | 0.3677 | 2 | 0.4251 | 2 | 0.3730 | 7 | 0.3759 | 8 |
| Yibin | 0.712 | 8 | 0.3558 | 10 | 0.3680 | 10 | 0.3739 | 6 | 0.3797 | 6 |
| Guang’an | 0.3665 | 10 | 0.3749 | 16 | 0.3432 | 16 | 0.3624 | 16 | 0.3669 | 12 |
| Dazhou | 0.3446 | 17 | 0.3677 | 14 | 0.3366 | 18 | 0.3697 | 12 | 0.3609 | 17 |
| Ya’an | 0.3708 | 9 | 0.3558 | 8 | 0.3689 | 9 | 0.3720 | 9 | 0.3908 | 5 |
| Bazhong | 0.3414 | 18 | 0.3735 | 18 | 0.3378 | 17 | 0.3646 | 15 | 0.3643 | 13 |
| Ziyang | 0.3540 | 15 | 0.3735 | 12 | 0.3597 | 12 | 0.3482 | 17 | 0.3616 | 15 |
| Region | Chengdu Plain Economic Zone | South Sichuan Economic Zone | Northeast Sichuan Economic Zone | Panzhihua | |
|---|---|---|---|---|---|
| Economic industry | 2010 | 2.8091 | 1.2005 | 1.3908 | 0.4190 |
| 2019 | 2.9977 | 1.2744 | 1.4264 | 0.4108 | |
| Change | 0.1886 | 0.0739 | 0.0356 | −0.0082 | |
| Habitat and employment | 2010 | 3.5818 | 1.5358 | 2.0731 | 0.3790 |
| 2019 | 3.6058 | 1.6039 | 2.2388 | 0.4060 | |
| Change | 0.0240 | 0.0681 | 0.1657 | 0.0270 | |
| Social services | 2010 | 3.0621 | 1.3298 | 1.6086 | 0.3882 |
| 2019 | 2.9938 | 1.3373 | 1.6316 | 0.6313 | |
| Change | −0.0683 | 0.0075 | 0.0230 | 0.2431 | |
| Urban construction | 2010 | 3.1851 | 1.3388 | 1.7931 | 0.3819 |
| 2019 | 3.2248 | 1.3354 | 1.8320 | 0.3837 | |
| Change | 0.0397 | −0.0034 | 0.0389 | 0.0018 | |
| Ecology and environment | 2010 | 3.1164 | 1.6486 | 2.0382 | 0.3973 |
| 2019 | 2.9344 | 1.8503 | 1.9834 | 0.3614 | |
| Change | −0.1820 | 0.2017 | −0.0548 | −0.0359 | |
| Science and technology | 2010 | 2.6773 | 1.0293 | 1.0989 | 0.2893 |
| 2019 | 2.7376 | 1.0297 | 1.0845 | 0.2644 | |
| Change | 0.0603 | 0.0004 | −0.0144 | −0.0249 | |
| Year | Overall Difference | Inter-Regional Differences | Intra-Regional Differences | Chengdu Plain Economic Zone | South Sichuan Economic Zone | Northeast Sichuan Economic Zone |
|---|---|---|---|---|---|---|
| 2010 | 0.0047 | 0.0005 (10.73%) | 0.0042 (89.27%) | 0.0041 (87.80%) | 0.0000 (0.40%) | 0.0001 (1.07%) |
| 2011 | 0.0052 | 0.0006 (11.32%) | 0.0046 (88.68%) | 0.0045 (86.45%) | 0.0001 (1.62%) | 0.0000 (0.61%) |
| 2012 | 0.0067 | 0.0014 (20.69%) | 0.0053 (79.31%) | 0.0052 (77.55%) | 0.0000 (0.66%) | 0.0001 (1.10%) |
| 2013 | 0.0065 | 0.0013 (20.51%) | 0.0051 (79.49%) | 0.0051 (78.69%) | 0.0000 (0.38%) | 0.0000 (0.42%) |
| 2014 | 0.0053 | 0.0014 (26.23%) | 0.0039 (73.77%) | 0.0038 (71.99%) | 0.0000 (0.67%) | 0.0001 (1.11%) |
| 2015 | 0.0061 | 0.0010 (16.91%) | 0.0050 (83.09%) | 0.0049 (80.63%) | 0.0001 (1.49%) | 0.0001 (0.97%) |
| 2016 | 0.0074 | 0.0015 (19.67%) | 0.0060 (80.33%) | 0.0058 (78.37%) | 0.0001 (1.24%) | 0.0001 (0.72%) |
| 2017 | 0.0072 | 0.0015 (20.24%) | 0.0057 (79.76%) | 0.0056 (78.23%) | 0.0001 (1.26%) | 0.0001 (0.27%) |
| 2018 | 0.0052 | 0.0014 (26.76%) | 0.0038 (73.24%) | 0.0037 (71.17%) | 0.0001 (1.32%) | 0.0000 (0.74%) |
| 2019 | 0.0052 | 0.0009 (14.65%) | 0.0044 (83.35%) | 0.0043 (82.55%) | 0.0001 (1.07%) | 0.0001 (1.74%) |
Publisher’s Note: MDPI stays neutral with regard to jurisdictional claims in published maps and institutional affiliations. |
© 2022 by the authors. Licensee MDPI, Basel, Switzerland. This article is an open access article distributed under the terms and conditions of the Creative Commons Attribution (CC BY) license (https://creativecommons.org/licenses/by/4.0/).
Share and Cite
Gan, L.; Wei, L.; Huang, S.; Lev, B.; Jiang, W. Evaluation of City–Industry Integration Development and Regional Differences under the New Urbanization: A Case Study of Sichuan. Appl. Sci. 2022, 12, 4698. https://doi.org/10.3390/app12094698
Gan L, Wei L, Huang S, Lev B, Jiang W. Evaluation of City–Industry Integration Development and Regional Differences under the New Urbanization: A Case Study of Sichuan. Applied Sciences. 2022; 12(9):4698. https://doi.org/10.3390/app12094698
Chicago/Turabian StyleGan, Lu, Lihong Wei, Shan Huang, Benjamin Lev, and Wen Jiang. 2022. "Evaluation of City–Industry Integration Development and Regional Differences under the New Urbanization: A Case Study of Sichuan" Applied Sciences 12, no. 9: 4698. https://doi.org/10.3390/app12094698
APA StyleGan, L., Wei, L., Huang, S., Lev, B., & Jiang, W. (2022). Evaluation of City–Industry Integration Development and Regional Differences under the New Urbanization: A Case Study of Sichuan. Applied Sciences, 12(9), 4698. https://doi.org/10.3390/app12094698