
Spatiotemporal Model to Quantify Stocks of Metal Cladding Products for a Prospective Circular Economy

 ,
, 
 and
and
Abstract
:1. Introduction
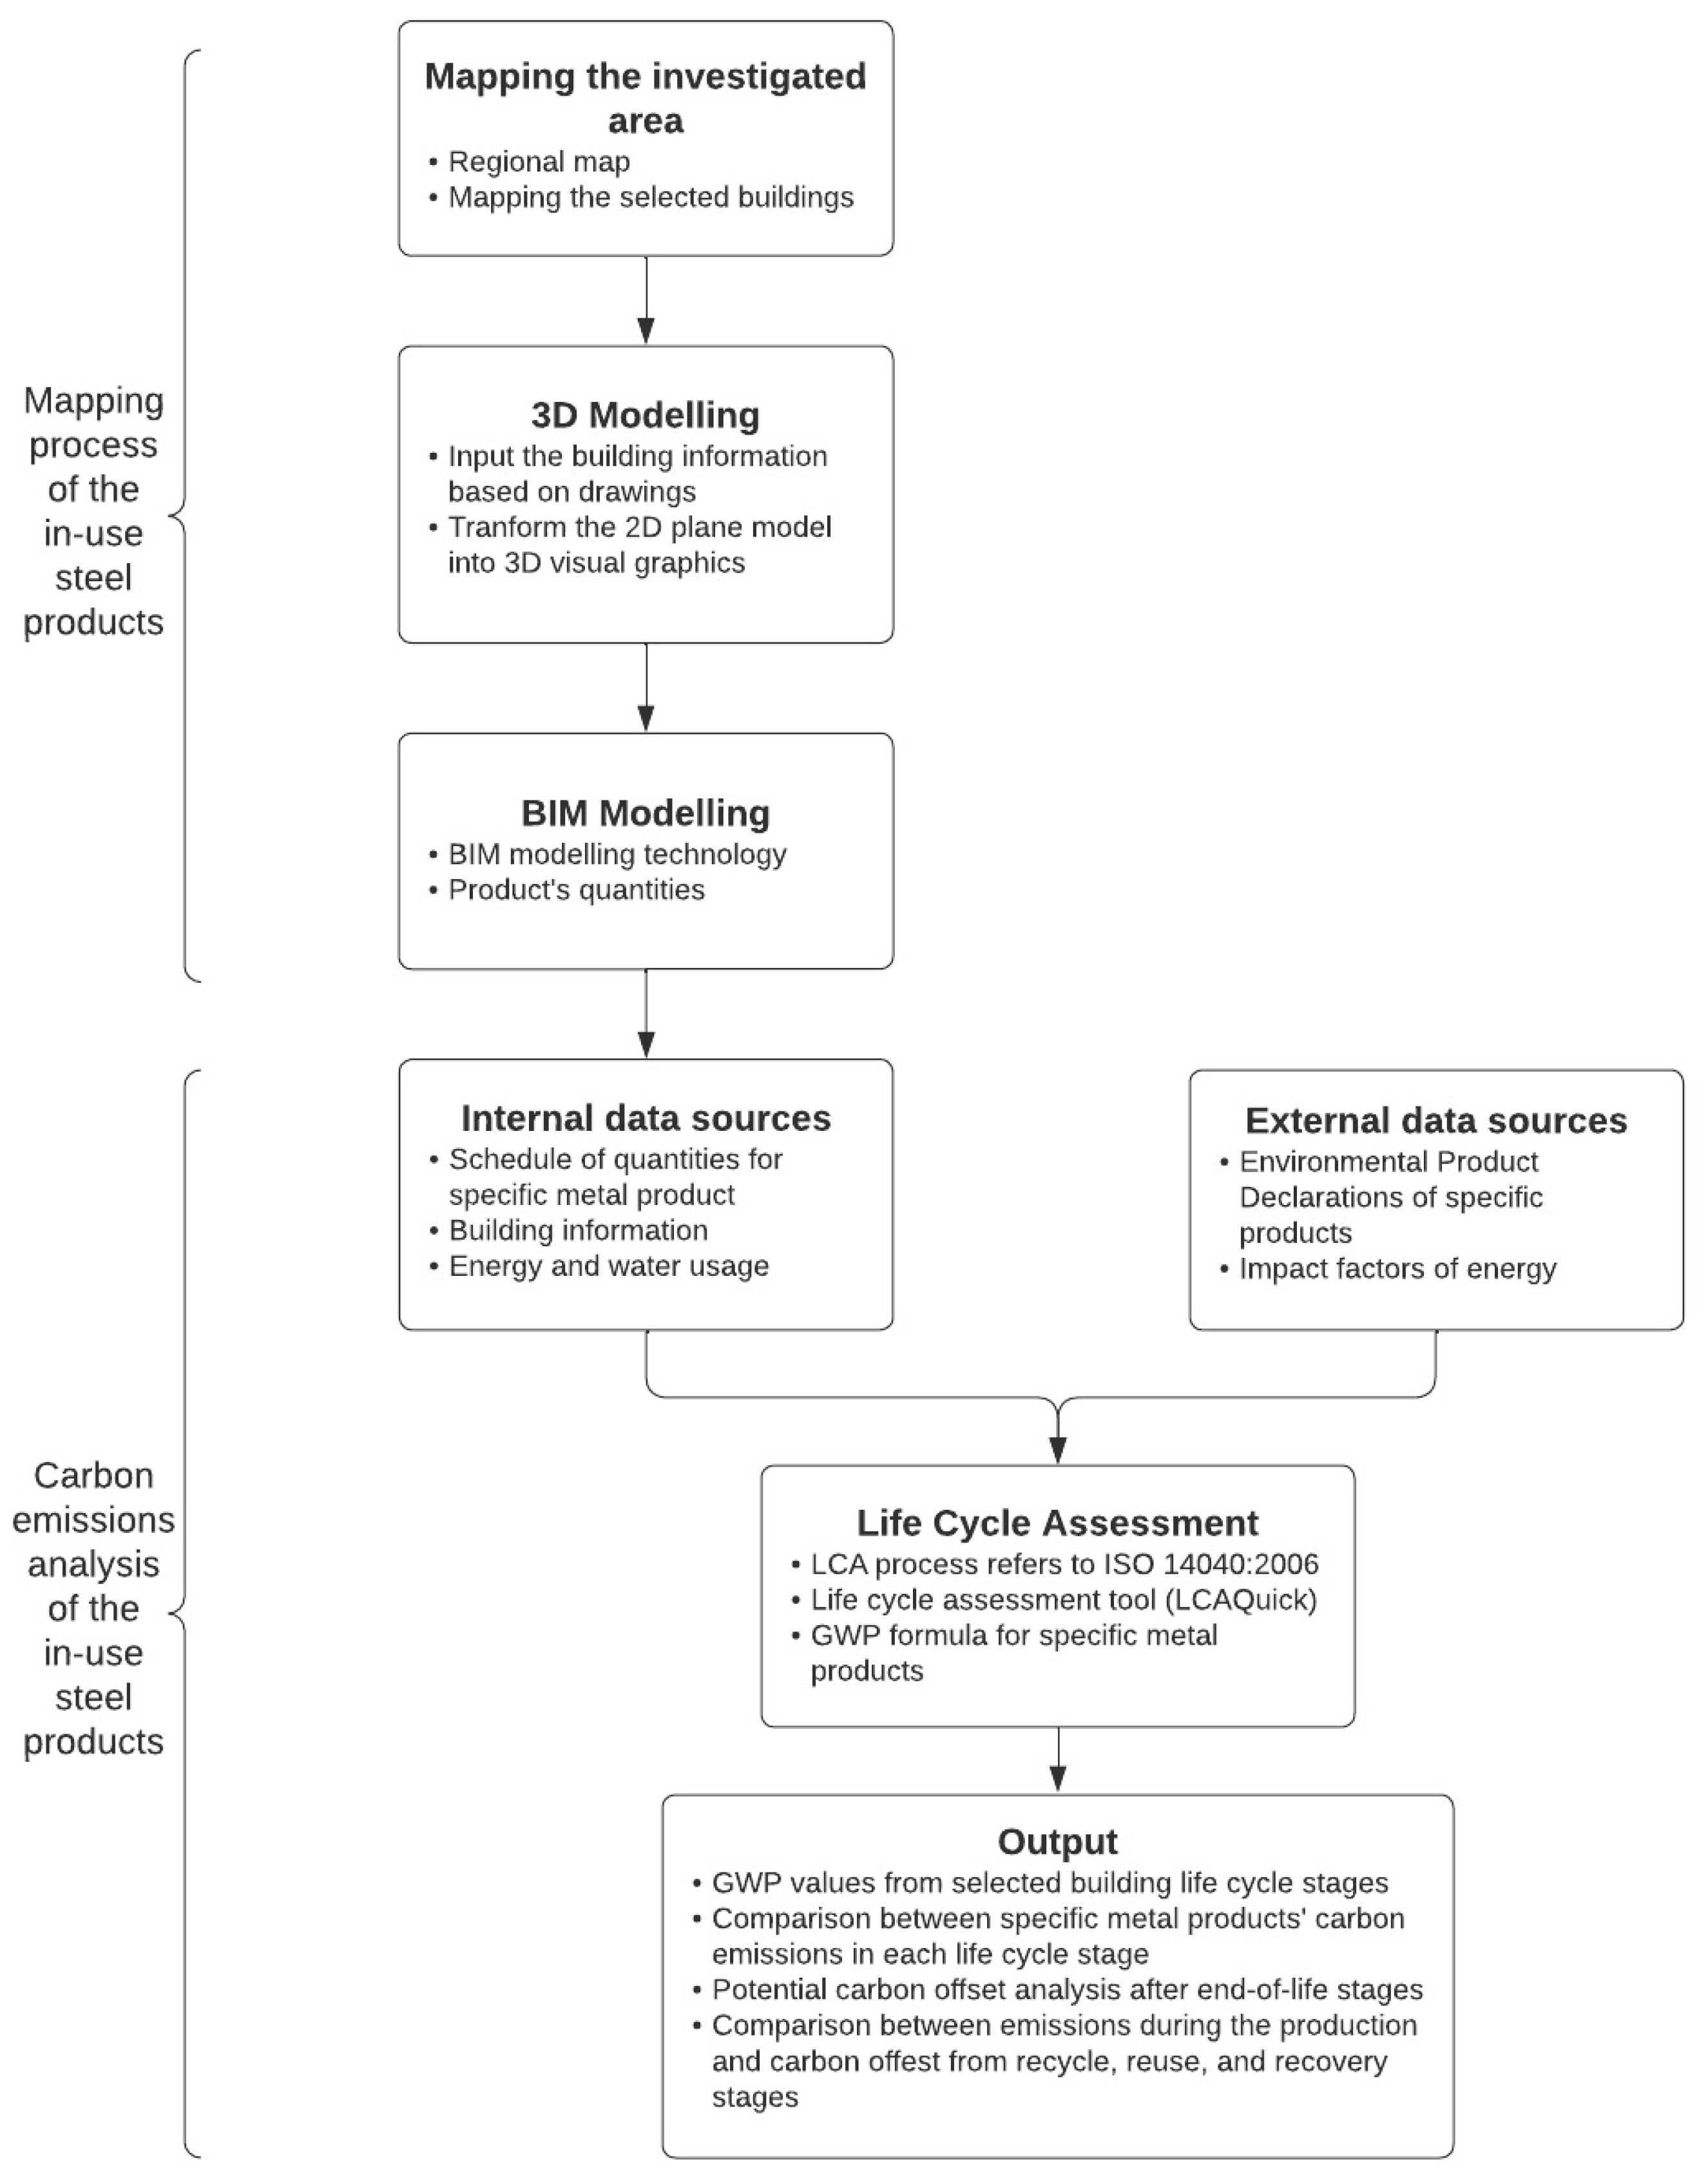
2. Methods
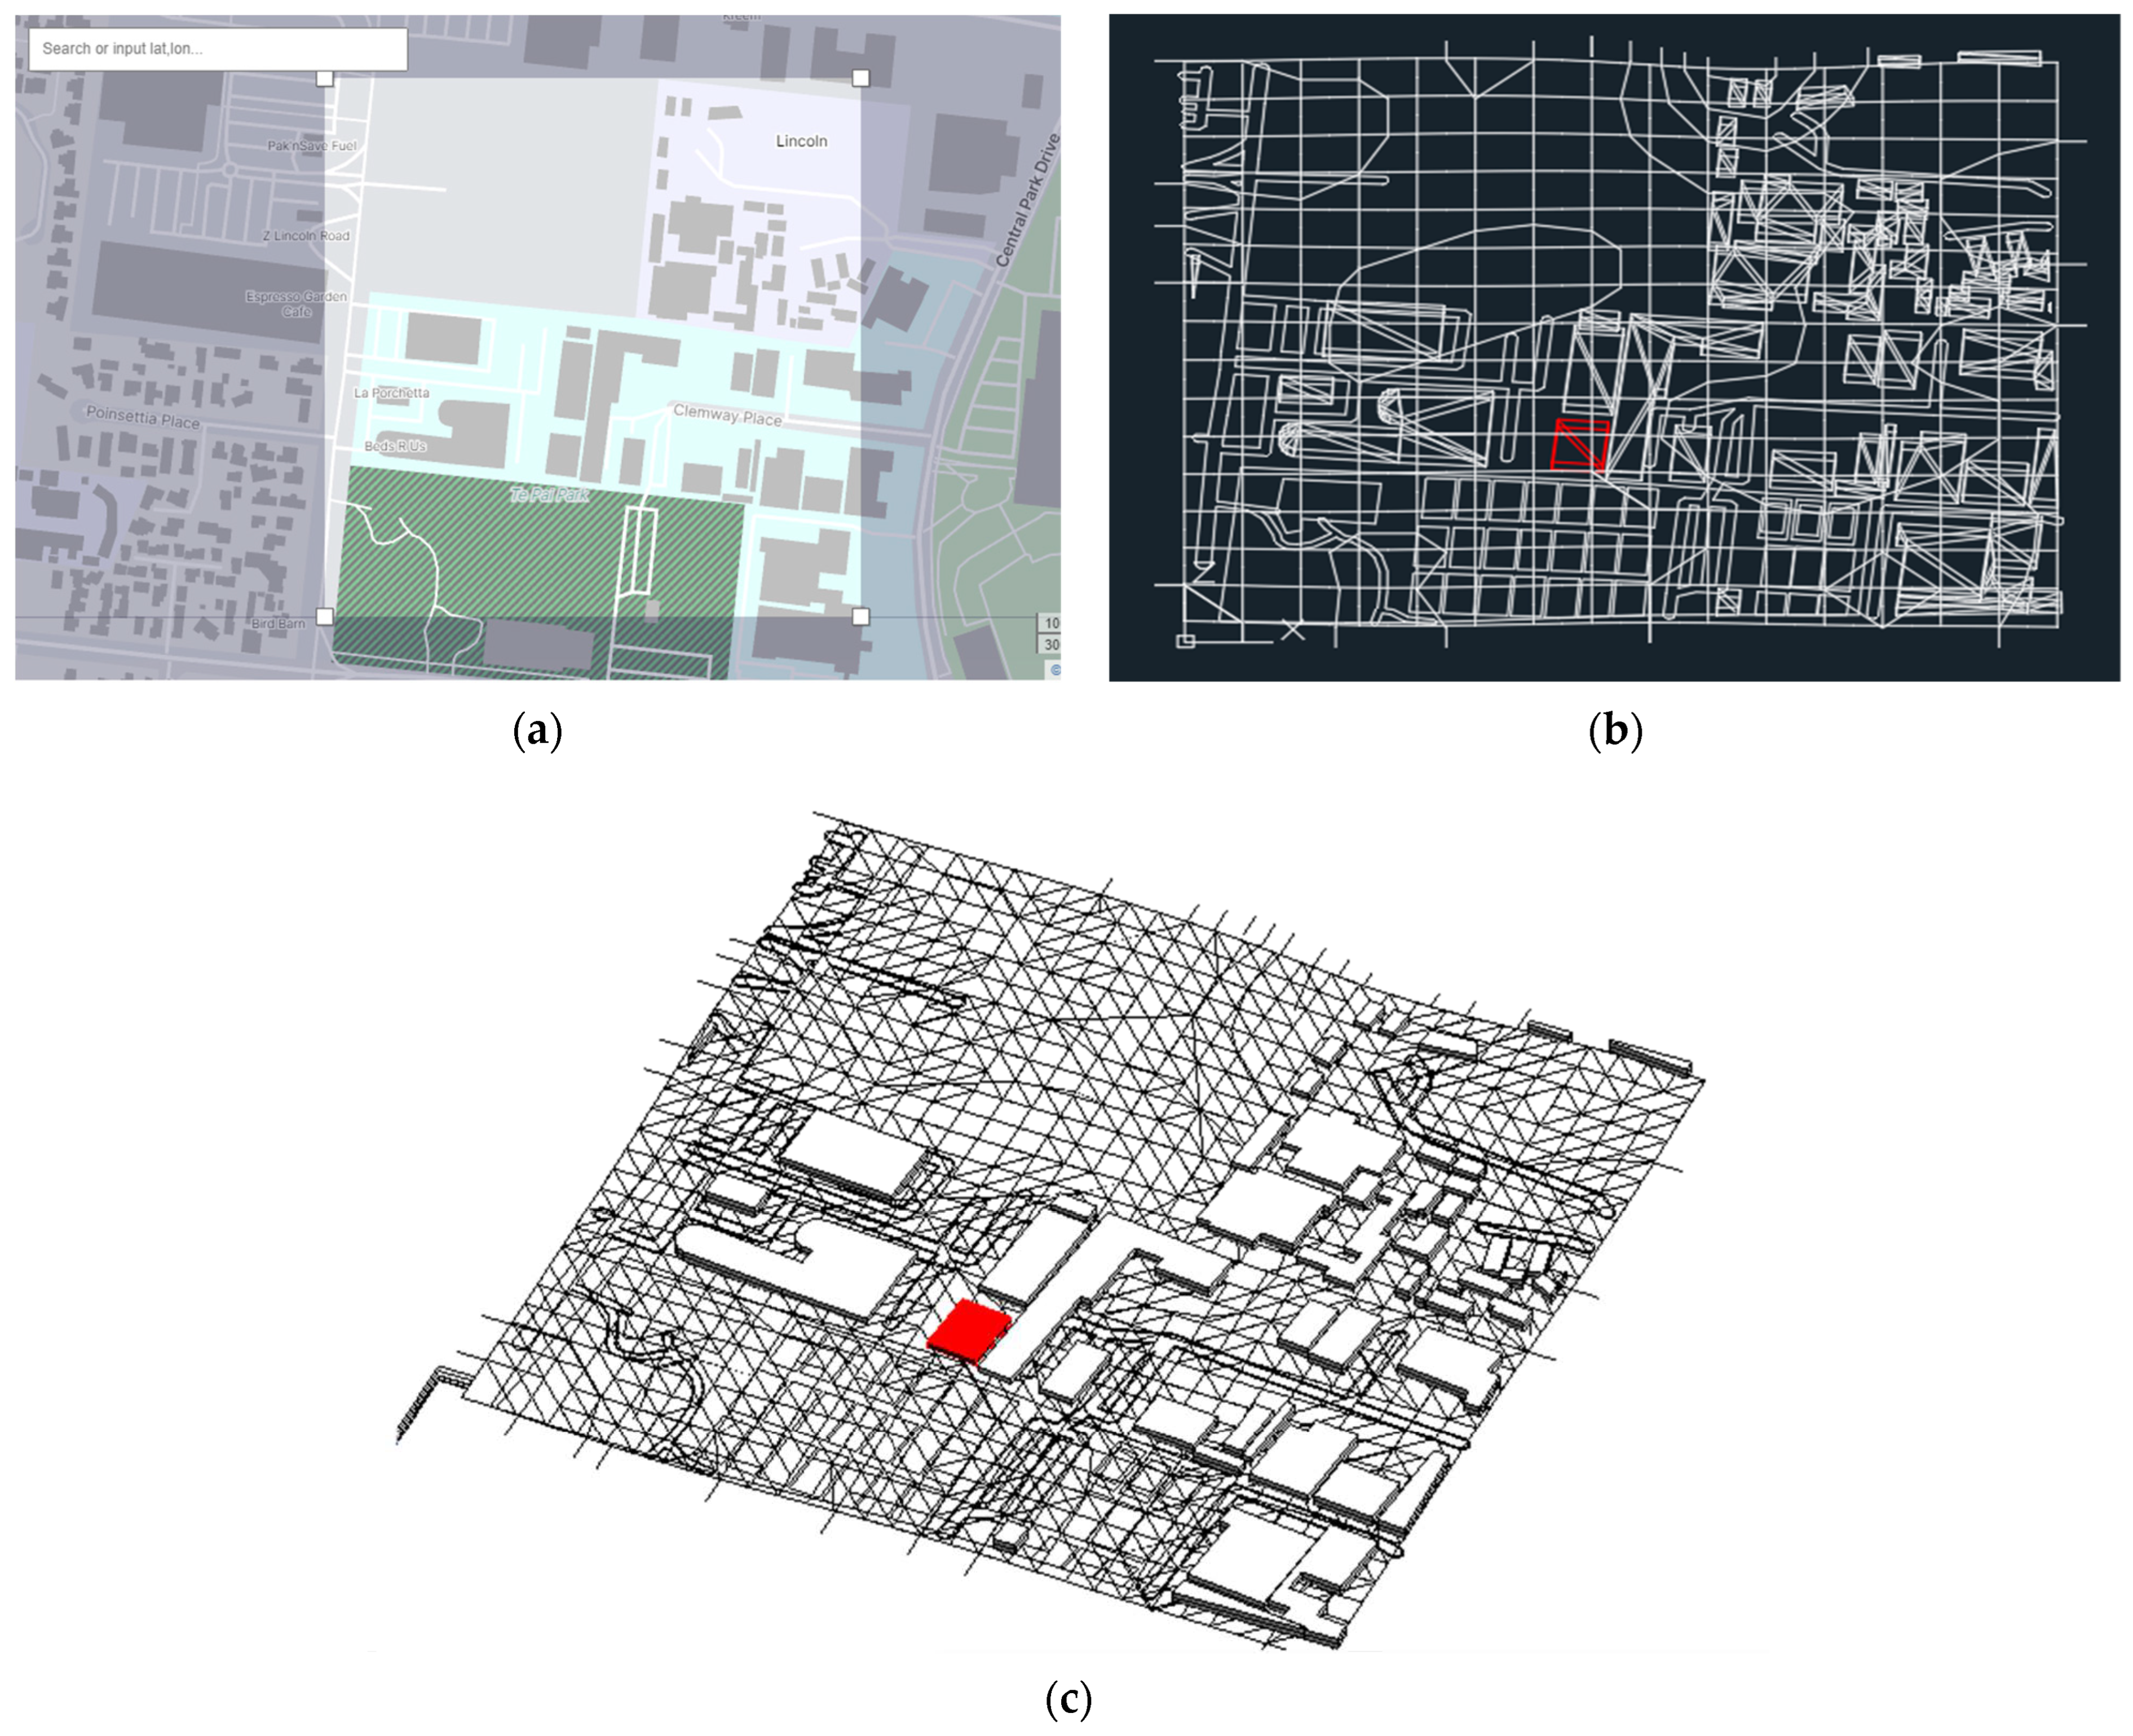
2.1. Mapping the In-Use Steel Products
- Step 1: Dividing a 0.2 km × 0.2 km area using GeoMaps to include the selected buildings in the investigated area, such as Auckland (Figure 2a).
- Step 2: Importing the regional map into the AutoCAD software (Figure 2b) for data input based on the drawings, such as the building height and the area of the residential or commercial buildings, and transforming the 2D plane models into 3D visual graphics.
- Step 3: Utilising BIM technology (Figure 2c) to determine the quantity of the in-use metal roofing and cladding products in case buildings from the 3D visual graphics in collaboration with the cost estimation function.
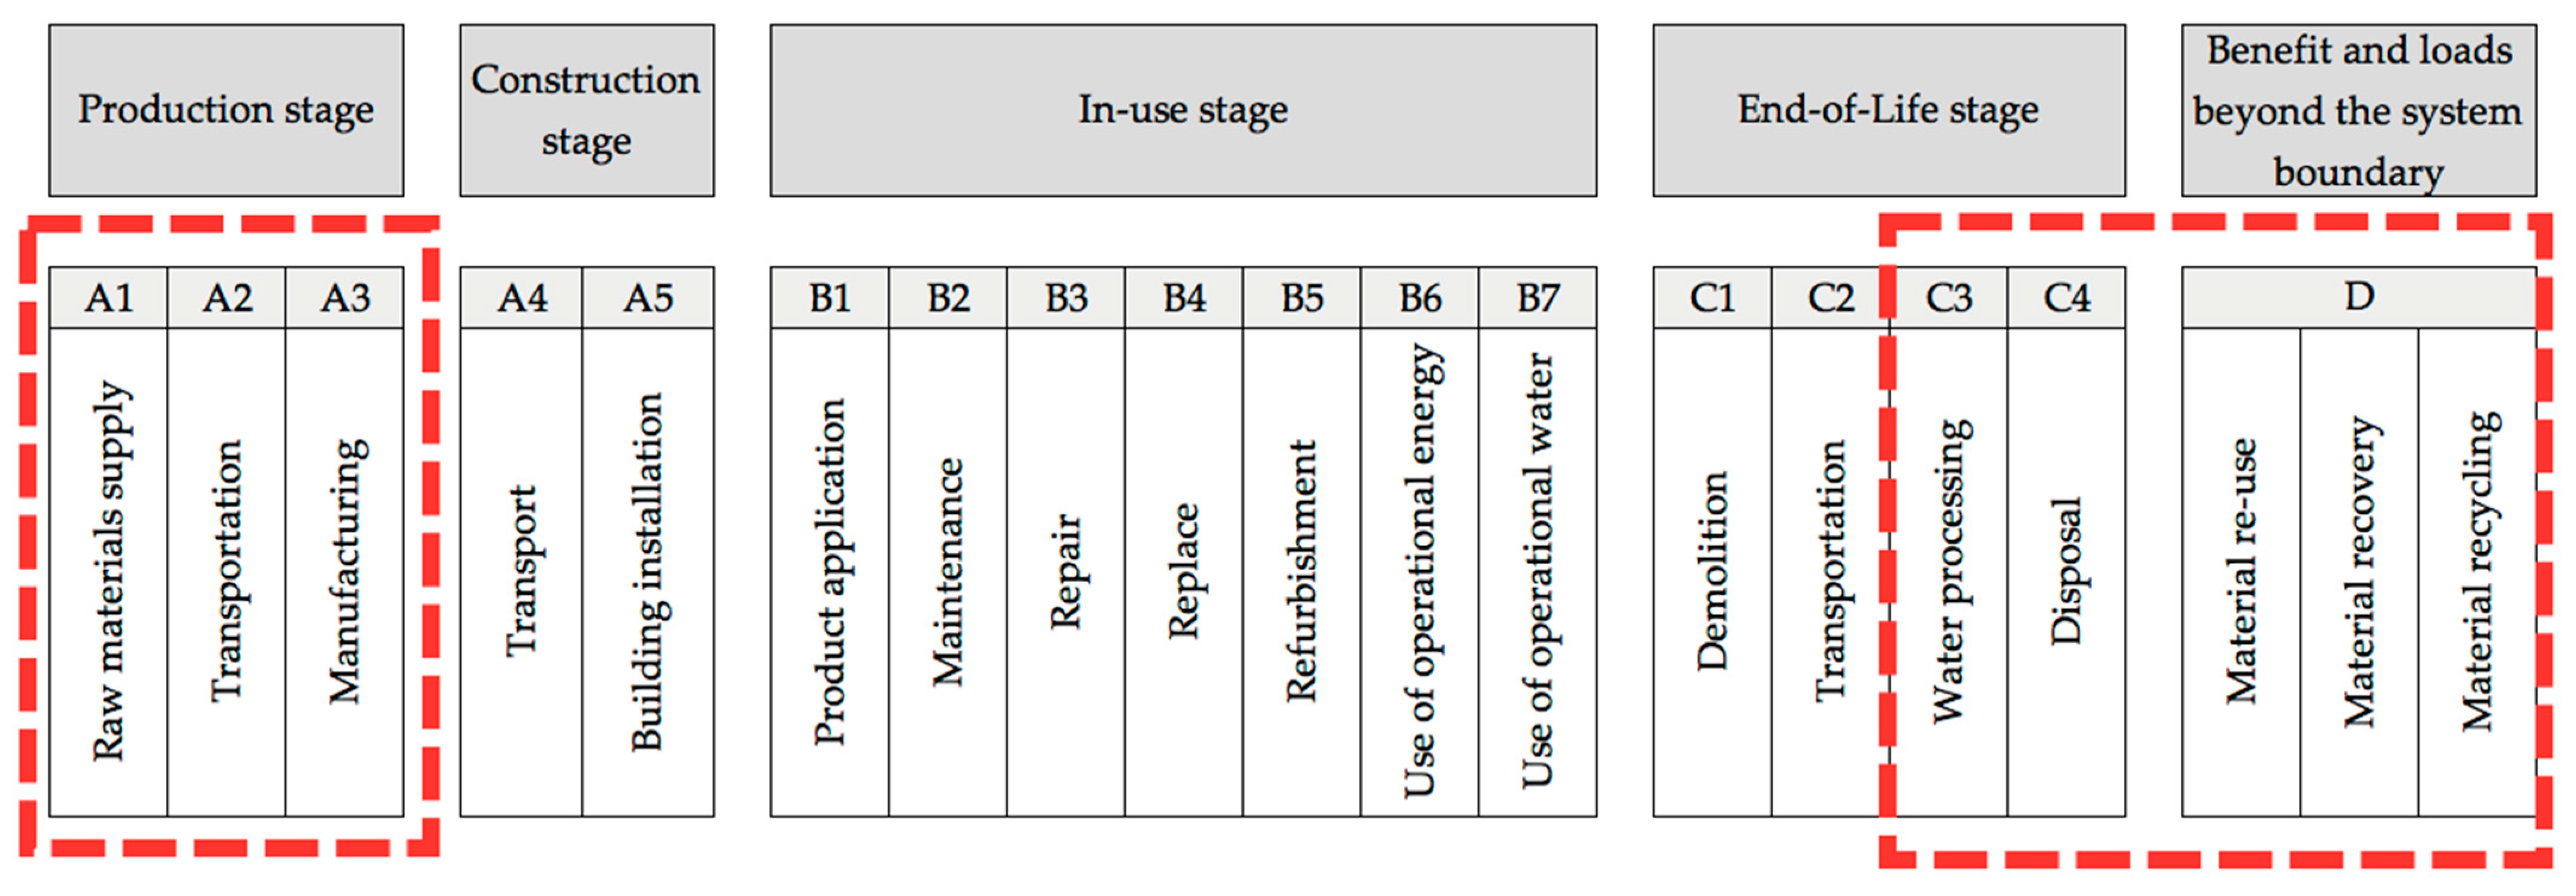
2.2. GWP Values Analysis of Investigated Steel Products
3. Results of the Case Study
3.1. In-Use Steel Products’ Material Quantities
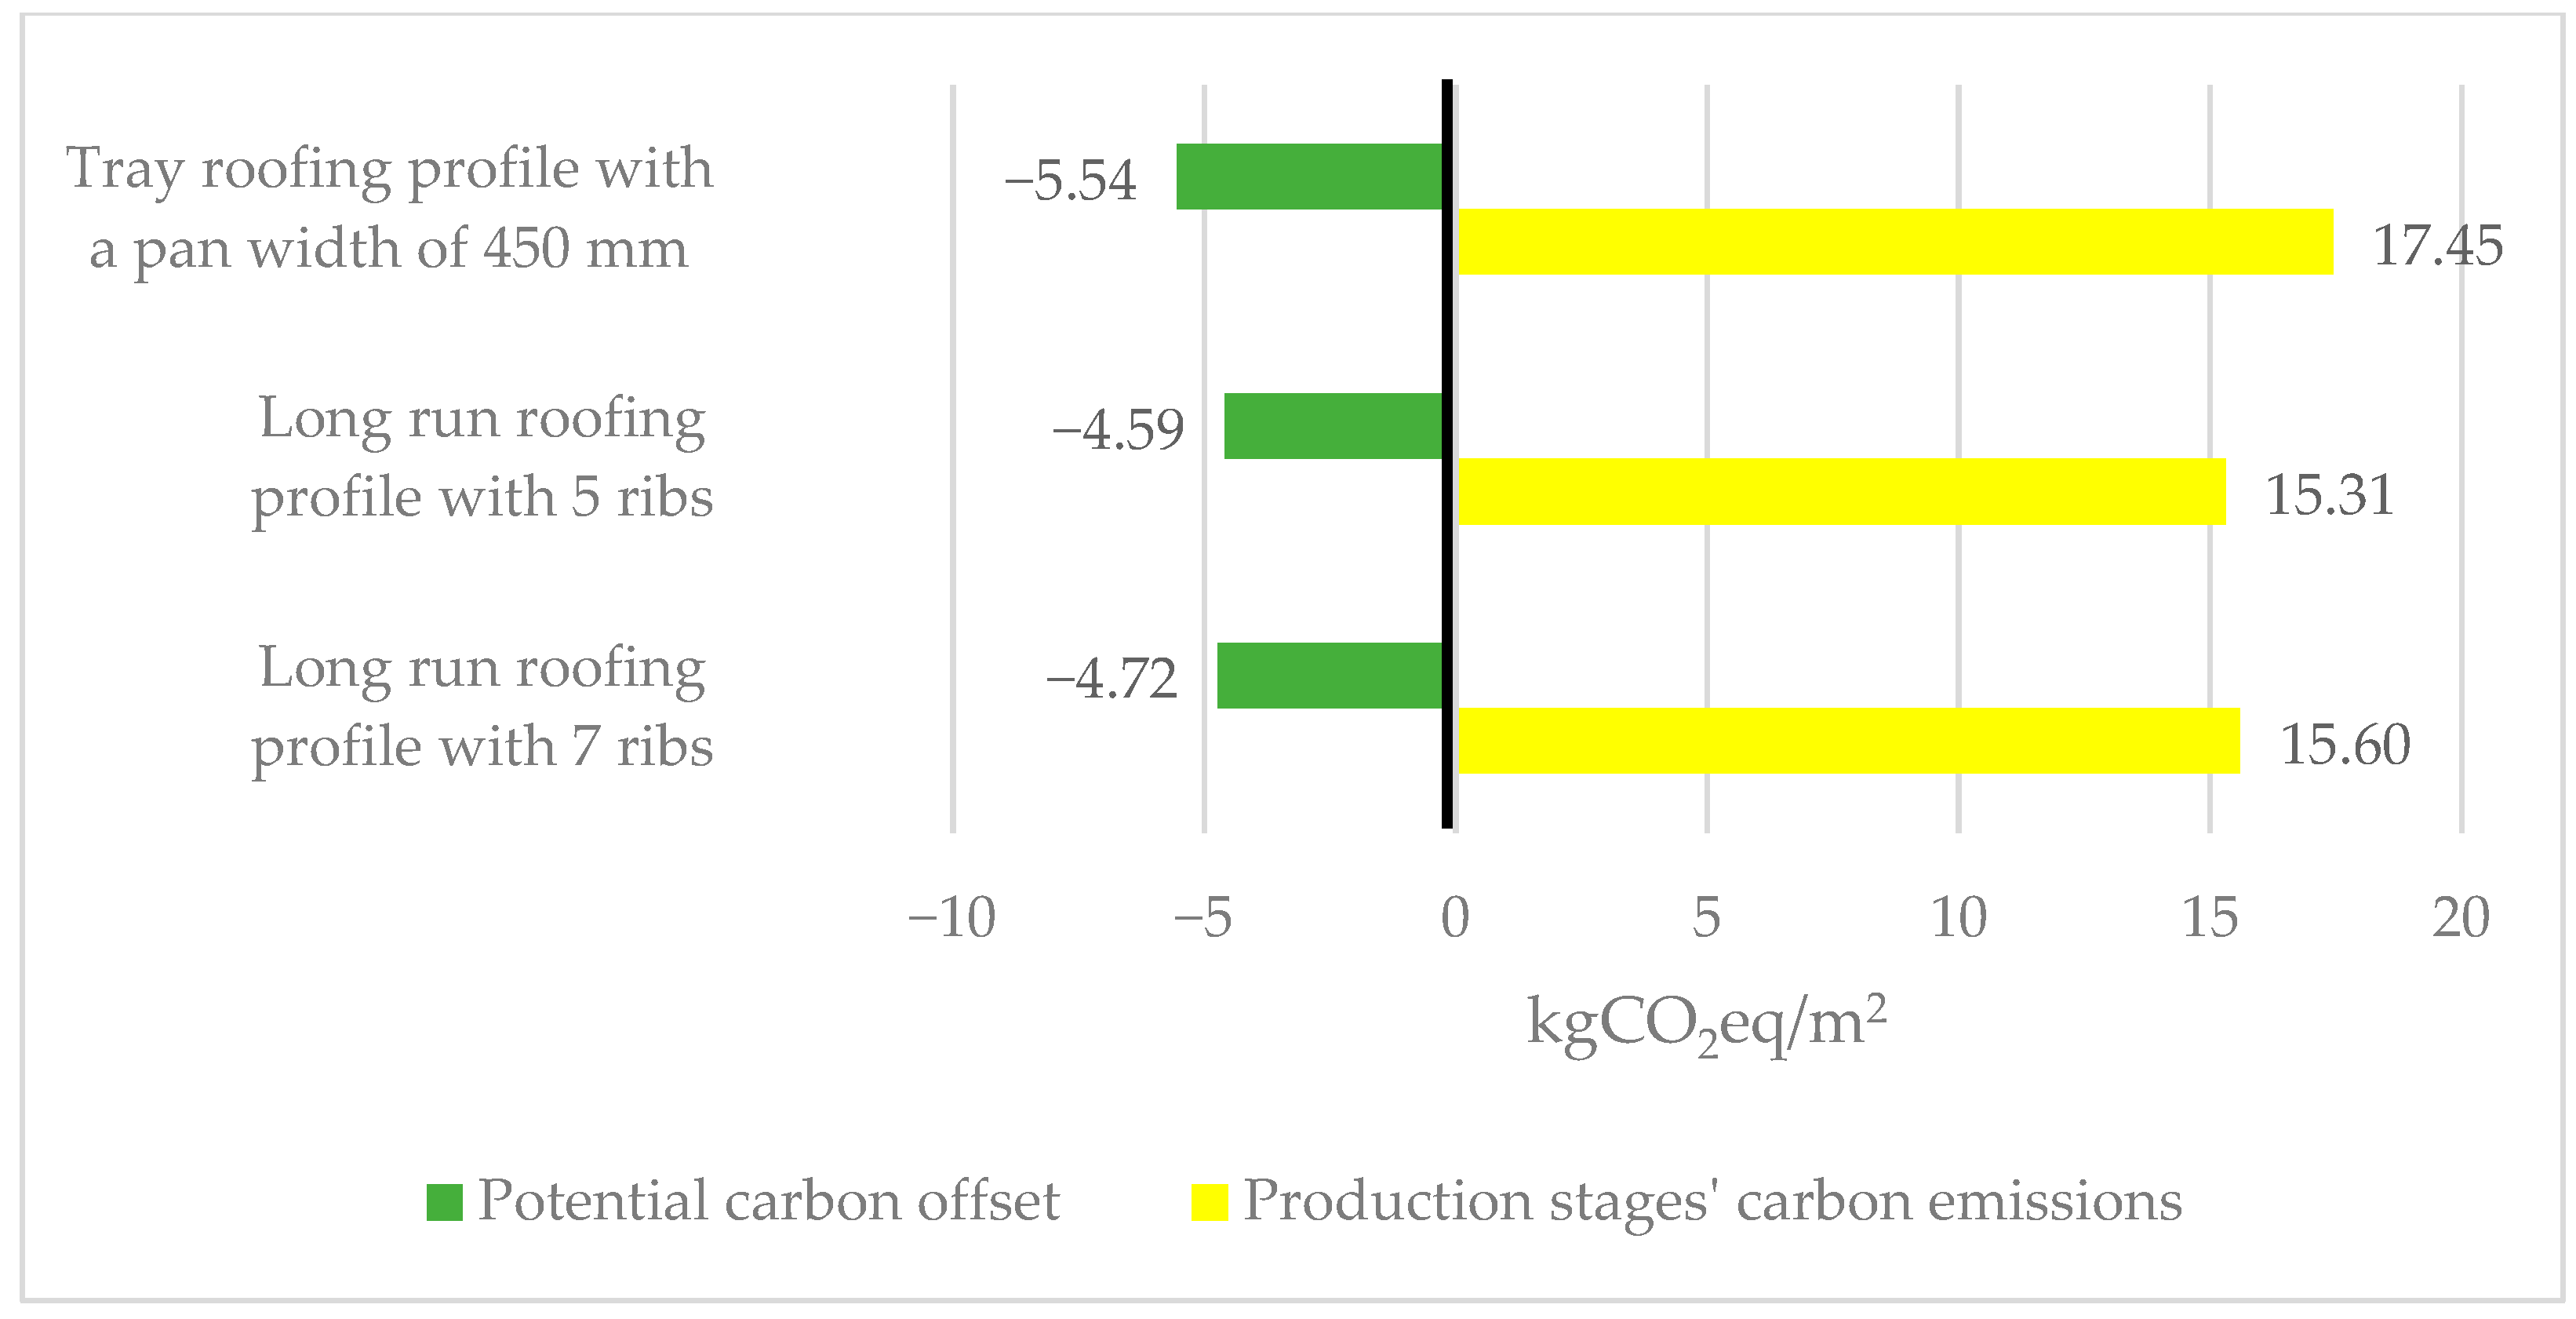
3.2. GWP Values from Investigated Steel Products
4. Discussion
5. Conclusions
Author Contributions
Funding
Institutional Review Board Statement
Informed Consent Statement
Data Availability Statement
Acknowledgments
Conflicts of Interest
References
- Alaloul, W.; Musarat, M.; Rabbani, M.; Iqbal, Q.; Maqsoom, A.; Farooq, W. Construction Sector Contribution to Economic Stability: Malaysian GDP Distribution. Sustainability 2021, 13, 5012. [Google Scholar] [CrossRef]
- Barbosa, F.; Woetzel, J.; Mischke, J.; Ribeirinho, M.J.; Sridhar, M.; Parsons, M.; Bertram, N.; Brown, S. Reinventing Construction: A Route to Higher Productivity; McKinsey Global Institute: New York, NY, USA, 2017; p. 168. Available online: https://www.mckinsey.com/business-functions/operations/our-insights/reinventing-construction-through-a-productivity-revolution (accessed on 29 January 2022).
- MBIE. Building and Construction Sector Trends—Annual Report 2021; Ministry of Business, Innovation & Employment: Wellington, New Zealand, 2021; p. 42. Available online: https://www.mbie.govt.nz/dmsdocument/16973-building-and-construction-sector-trends-annual-report-2021-pdf (accessed on 29 January 2022).
- Australian Government. Construction and Demolition Waste Guide—Recycling and Reuse across the Supply Chain; Department of Sustainability, Environment, Water, Population and Communities: Canberra, Australia, 2012; p. 52. Available online: https://www.awe.gov.au/sites/default/files/documents/case-studies.pdf (accessed on 30 January 2022).
- Tam, V.W.-Y.; Lu, W. Construction Waste Management Profiles, Practices, and Performance: A Cross-Jurisdictional Analysis in Four Countries. Sustainability 2016, 8, 190. [Google Scholar] [CrossRef] [Green Version]
- Pacheco-Torgal, F.; Tam, V.W.Y.; Labrincha, J.A.; Ding, Y.; de Brito, J. Handbook of Recycled Concrete and Demolition Waste; Woodhead Publishing: Sawston, UK, 2013; Available online: https://www.sciencedirect.com/book/9780857096821/handbook-of-recycled-concrete-and-demolition-waste (accessed on 30 January 2022).
- Huang, B.; Wang, X.; Kua, H.; Geng, Y.; Bleischwitz, R.; Ren, J. Construction and demolition waste management in China through the 3R principle. Resour. Conserv. Recycl. 2018, 129, 36–44. [Google Scholar] [CrossRef]
- BRANZ. Reducing Building Material Waste. Available online: https://www.branz.co.nz/sustainable-building/reducing-building-waste/ (accessed on 30 January 2022).
- Ministry of Business, Innovation & Employment. Building for Climate Change: Transforming the Building and Construction Sector to Reduce Emissions and Improve Climate Resilience; MBIE: Wellington, New Zealand, 2020; p. 10. Available online: https://www.mbie.govt.nz/dmsdocument/11522-building-for-climate-change (accessed on 5 February 2022).
- Ministry of Business, Innovation & Employment. Whole-of-Life Embodied Carbon Emissions Reduction Framework; MBIE: Wellington, New Zealand, 2020; p. 24. Available online: https://www.mbie.govt.nz/dmsdocument/11794-whole-of-life-embodied-carbon-emissions-reduction-framework (accessed on 5 February 2022).
- UNEP. Buildings and Climate Change: Summary for Decision Makers; United Nations Environment Programme: Paris, France, 2009. [Google Scholar]
- Cui, D.; Deng, Z.; Liu, Z. China’s non-fossil fuel CO2 emissions from industrial processes. Appl. Energy 2019, 254, 113537. [Google Scholar] [CrossRef]
- Lu, N.; Feng, S.; Liu, Z.; Wang, W.; Lu, H.; Wang, M. The Determinants of Carbon Emissions in the Chinese Construction Industry: A Spatial Analysis. Sustainability 2020, 12, 1428. [Google Scholar] [CrossRef] [Green Version]
- Climate Change Committee. The Sixth Carbon Budget Buildings; Climate Change Committee: London, UK, 2020; p. 79. Available online: https://www.theccc.org.uk/wp-content/uploads/2020/12/Sector-summary-Buildings.pdf (accessed on 5 February 2022).
- NZGBC. Climate Change and Building Pollution. 2020. Available online: https://www.nzgbc.org.nz/climate-change-and-building-pollution (accessed on 11 February 2022).
- Ministry for the Environment. New Zealand’s Greenhouse Gas Inventory 1990–2019; Ministry for the Environment: Wellington, New Zealand, 2021. Available online: https://environment.govt.nz/assets/Publications/New-Zealands-Greenhouse-Gas-Inventory-1990-2019-Volume-1-Chapters-1-15.pdf (accessed on 11 February 2022).
- Parliamentary Counsel Office. Climate Change Response (Zero Carbon) Amendment Act 2019 No 61, Public Act Contents—New Zealand Legislation; New Zealand Legislation: Wellington, New Zealand, 3 November 2019. Available online: https://www.legislation.govt.nz/act/public/2019/0061/latest/LMS183736.html (accessed on 11 February 2022).
- Korhonen, J.; Nuur, C.; Feldmann, A.; Birkie, S.E. Circular economy as an essentially contested concept. J. Clean. Prod. 2018, 175, 544–552. [Google Scholar] [CrossRef]
- PwC. Closing the Loop—The Circular Economy, What It Means and What It Can Do for You; PricewaterhouseCoopers: London, UK, 2018; p. 48. Available online: https://www.pwc.com/hu/en/kiadvanyok/assets/pdf/Closing-the-loop-the-circular-economy.pdf (accessed on 11 February 2022).
- Grdic, Z.S.; Nizic, M.K.; Rudan, E. Circular Economy Concept in the Context of Economic Development in EU Countries. Sustainability 2020, 12, 3060. [Google Scholar] [CrossRef] [Green Version]
- Garcés-Ayerbe, C.; Rivera-Torres, P.; Suárez-Perales, I.; Leyva-De La Hiz, D.I. Is It Possible to Change from a Linear to a Circular Economy? An Overview of Opportunities and Barriers for European Small and Medium-Sized Enterprise Companies. Int. J. Environ. Res. Public Health 2019, 16, 851. [Google Scholar] [CrossRef] [Green Version]
- Benachio, G.L.F.; Freitas, M.D.C.D.; Tavares, S.F. Circular economy in the construction industry: A systematic literature review. J. Clean. Prod. 2020, 260, 121046. [Google Scholar] [CrossRef]
- Stephan, A.; Athanassiadis, A. Towards a more circular construction sector: Estimating and spatialising current and future non-structural material replacement flows to maintain urban building stocks. Resour. Conserv. Recycl. 2018, 129, 248–262. [Google Scholar] [CrossRef]
- Ajayabi, A.; Chen, H.-M.; Zhou, K.; Hopkinson, P.; Wang, Y.; Lam, D. REBUILD: Regenerative Buildings and Construction systems for a Circular Economy. IOP Conf. Series Earth Environ. Sci. 2019, 225, 012015. [Google Scholar] [CrossRef]
- Torgautov, B.; Zhanabayev, A.; Tleuken, A.; Turkyilmaz, A.; Mustafa, M.; Karaca, F. Circular Economy: Challenges and Opportunities in the Construction Sector of Kazakhstan. Buildings 2021, 11, 501. [Google Scholar] [CrossRef]
- Esen, H.; Inalli, M.; Esen, M. Technoeconomic appraisal of a ground source heat pump system for a heating season in eastern Turkey. Energy Convers. Manag. 2006, 47, 1281–1297. [Google Scholar] [CrossRef]
- Esen, H.; Inalli, M.; Esen, M. A techno-economic comparison of ground-coupled and air-coupled heat pump system for space cooling. Build. Environ. 2007, 42, 1955–1965. [Google Scholar] [CrossRef]
- Esen, M.; Yuksel, T. Experimental evaluation of using various renewable energy sources for heating a greenhouse. Energy Build. 2013, 65, 340–351. [Google Scholar] [CrossRef]
- Wiedenhofer, D.; Steinberger, J.; Eisenmenger, N.; Haas, W. Maintenance and Expansion: Modeling Material Stocks and Flows for Residential Buildings and Transportation Networks in the EU25. J. Ind. Ecol. 2015, 19, 538–551. [Google Scholar] [CrossRef] [Green Version]
- Koutamanis, A.; van Reijn, B.; van Bueren, E. Urban mining and buildings: A review of possibilities and limitations. Resour. Conserv. Recycl. 2018, 138, 32–39. [Google Scholar] [CrossRef]
- Wang, Y.; Zhang, Z.; Guo, J.; Shang, J.; Sun, X.; Yang, Z.; Gong, C.; Cai, Y. Research on the key technology and product application of light environment-friendly enclosure system of steel structure buildings. Prog. Steel Build. Struct. 2021, 23, 75–92. (In Chinese) [Google Scholar]
- Roy, K.; Mohammadjani, C.; Lim, J.B. Experimental and numerical investigation into the behaviour of face-to-face built-up cold-formed steel channel sections under compression. Thin-Walled Struct. 2019, 134, 291–309. [Google Scholar] [CrossRef]
- Jing, J.; Clifton, G.C.; Roy, K.; Lim, J.B. Three-storey modular steel building with a novel slider device: Shake table tests on a scaled down model and numerical investigation. Thin-Walled Struct. 2020, 155, 106932. [Google Scholar] [CrossRef]
- Roy, K.; Lau, H.H.; Ting, T.C.H.; Masood, R.; Kumar, A.; Lim, J.B. Experiments and finite element modelling of screw pattern of self-drilling screw connections for high strength cold-formed steel. Thin-Walled Struct. 2019, 145, 106393. [Google Scholar] [CrossRef]
- Roy, K.; Chen, B.; Fang, Z.; Uzzaman, A.; Chen, X.; Lim, J.B.P. Local and distortional buckling behavior of back-to-back built-up aluminium alloy channel section columns. Thin-Walled Struct. 2021, 163, 107713. [Google Scholar] [CrossRef]
- Roy, K.; Chen, B.; Fang, Z.; Uzzaman, A.; Lim, J.B.P. Axial Capacity of Back-to-Back Built-Up Aluminum Alloy Channel Section Columns. J. Struct. Eng. 2022, 148, 04021265. [Google Scholar] [CrossRef]
- Fang, Z.; Roy, K.; Chen, B.; Xie, Z.; Ingham, J.; Lim, J.B. Effect of the web hole size on the axial capacity of back-to-back aluminium alloy channel section columns. Eng. Struct. 2022, 260, 114238. [Google Scholar] [CrossRef]
- Chen, B.; Roy, K.; Uzzaman, A.; Lim, J.B. Moment capacity of cold-formed channel beams with edge-stiffened web holes, un-stiffened web holes and plain webs. Thin-Walled Struct. 2020, 157, 107070. [Google Scholar] [CrossRef]
- Fang, Z.; Roy, K.; Ma, Q.; Uzzaman, A.; Lim, J.B. Application of deep learning method in web crippling strength prediction of cold-formed stainless steel channel sections under end-two-flange loading. Structures 2021, 33, 2903–2942. [Google Scholar] [CrossRef]
- Fang, Z.; Roy, K.; Chen, B.; Xie, Z.; Lim, J.B. Local and distortional buckling behaviour of aluminium alloy back-to-back channels with web holes under axial compression. J. Build. Eng. 2021, 47, 103837. [Google Scholar] [CrossRef]
- Fang, Z.; Roy, K.; Mares, J.; Sham, C.-W.; Chen, B.; Lim, J.B. Deep learning-based axial capacity prediction for cold-formed steel channel sections using Deep Belief Network. Structures 2021, 33, 2792–2802. [Google Scholar] [CrossRef]
- Roy, K.; Lau, H.H.; Ting, T.C.H.; Chen, B.; Lim, J.B. Flexural capacity of gapped built-up cold-formed steel channel sections including web stiffeners. J. Constr. Steel Res. 2020, 172, 106154. [Google Scholar] [CrossRef]
- Roy, K.; Ting, T.C.H.; Lau, H.H.; Lim, J.B. Experimental and numerical investigations on the axial capacity of cold-formed steel built-up box sections. J. Constr. Steel Res. 2019, 160, 411–427. [Google Scholar] [CrossRef]
- Ting, T.C.H.; Roy, K.; Lau, H.H.; Lim, J. Effect of screw spacing on behavior of axially loaded back-to-back cold-formed steel built-up channel sections. Adv. Struct. Eng. 2017, 21, 474–487. [Google Scholar] [CrossRef]
- Chi, Y.; Roy, K.; Chen, B.; Fang, Z.; Uzzaman, A.; Ananthi, G.B.G.; Lim, J.B.P. Effect of web hole spacing on axial capacity of back-to-back cold-formed steel channels with edge-stiffened holes. Steel Compos. Struct. 2021, 40, 287–305. [Google Scholar]
- Chen, B.; Roy, K.; Fang, Z.; Uzzaman, A.; Pham, C.H.; Raftery, G.M.; Lim, J.B.P. Shear Capacity of Cold-Formed Steel Channels with Edge-Stiffened Web Holes, Unstiffened Web Holes, and Plain Webs. J. Struct. Eng. 2022, 148, 04021268. [Google Scholar] [CrossRef]
- Roy, K.; Lau, H.H.; Fang, Z.; Masood, R.; Ting, T.C.H.; Lim, J.B.; Lee, V.C.C. Effects of corrosion on the strength of self-drilling screw connections in cold-formed steel structures-experiments and finite element modeling. Structures 2022, 36, 1080–1096. [Google Scholar] [CrossRef]
- Fang, Z.; Roy, K.; Chi, Y.; Chen, B.; Lim, J.B. Finite element analysis and proposed design rules for cold-formed stainless steel channels with web holes under end-one-flange loading. Structures 2021, 34, 2876–2899. [Google Scholar] [CrossRef]
- Fang, Z.; Roy, K.; Uzzaman, A.; Lim, J.B. Numerical simulation and proposed design rules of cold-formed stainless steel channels with web holes under interior-one-flange loading. Eng. Struct. 2021, 252, 113566. [Google Scholar] [CrossRef]
- Uzzaman, A.; Lim, J.B.; Nash, D.; Roy, K. Cold-formed steel channel sections under end-two-flange loading condition: Design for edge-stiffened holes, unstiffened holes and plain webs. Thin-Walled Struct. 2020, 147, 106532. [Google Scholar] [CrossRef]
- Fang, Z.; Roy, K.; Chen, B.; Sham, C.-W.; Hajirasouliha, I.; Lim, J.B. Deep learning-based procedure for structural design of cold-formed steel channel sections with edge-stiffened and un-stiffened holes under axial compression. Thin-Walled Struct. 2021, 166, 108076. [Google Scholar] [CrossRef]
- Fang, Z.; Roy, K.; Liang, H.; Poologanathan, K.; Ghosh, K.; Mohamed, A.M.; Lim, J.B.P. Numerical Simulation and Design Recommendations for Web Crippling Strength of Cold-Formed Steel Channels with Web Holes under Interior-One-Flange Loading at Elevated Temperatures. Buildings 2021, 11, 666. [Google Scholar] [CrossRef]
- Dani, A.A.; Roy, K.; Masood, R.; Fang, Z.; Lim, J.B.P. A Comparative Study on the Life Cycle Assessment of New Zealand Residential Buildings. Buildings 2022, 12, 50. [Google Scholar] [CrossRef]
- Wu, H.; Liang, H.; Roy, K.; Harrison, E.; Fang, Z.; De Silva, K.; Collins, N.; Lim, J.B.P. Analyzing the Climate Change Potential of Residential Steel Buildings in New Zealand and Their Alignment in Meeting the 2050 Paris Agreement Targets. Buildings 2022, 12, 290. [Google Scholar] [CrossRef]
- Liang, H.; Roy, K.; Fang, Z.; Lim, J.B.P. A Critical Review on Optimization of Cold-Formed Steel Members for Better Structural and Thermal Performances. Buildings 2022, 12, 34. [Google Scholar] [CrossRef]
- Bowyer, J.; Bratkovich, S.; Fernholz, K.; Frank, M.; Groot, H.; Howe, J.; Pepke, E. Understanding Steel Recovery and Recycling Rates and Limitations to Recycling; Dovetail Partners Inc.: Minneapolis, MN, USA, 2015; p. 12. Available online: https://www.dovetailinc.org/report_pdfs/2015/dovetailsteelrecycling0315.pdf (accessed on 13 February 2022).
- BRANZ. Data. Available online: https://www.branz.co.nz/environment-zero-carbon-research/framework/data/ (accessed on 13 February 2022).
- MRM. Recycling, Recyclability and Greenstar. Available online: https://www.metalroofing.org.nz/recycling-recyclability-and-greenstar (accessed on 13 February 2022).
- Ortiz-Rodríguez, O.; Castells, F.; Sonnemann, G. Life cycle assessment of two dwellings: One in Spain, a developed country, and one in Colombia, a country under development. Sci. Total Environ. 2010, 408, 2435–2443. [Google Scholar] [CrossRef] [PubMed]
- Rebitzer, G.; Ekvall, T.; Frischknecht, R.; Hunkeler, D.; Norris, G.; Rydberg, T.; Schmidt, W.-P.; Suh, S.; Weidema, B.P.; Pennington, D.W. Life cycle assessment: Part 1: Framework, goal and scope definition, inventory analysis, and applications. Environ. Int. 2004, 30, 701–720. [Google Scholar] [CrossRef]
- Olsen, S.I.; Christensen, F.M.; Hauschild, H.; Pedersen, F.; Larsen, H.F.; Torslov, J. Life cycle impact assessment and risk assessment of chemicals in a methodological comparison. Environ. Impact Assess. Rev. 2001, 21, 385–404. [Google Scholar] [CrossRef]
- Vilches, A.; Martinez, A.; Montanes, B. Life cycle assessment (LCA) of building refurbishment: A literature review. Energy Build. 2017, 135, 286–301. [Google Scholar] [CrossRef]
- Napieralski, J.; Barr, I.; Kamp, U.; Kervyn, M. 3.8 Remote Sensing and GIScience in Geomorphological Mapping. In Treatise on Geomorphology; Shroder, J.F., Ed.; Academic Press: Cambridge, MA, USA, 2013; pp. 187–227. [Google Scholar] [CrossRef]
- Ajayebi, A.; Hopkinson, P.; Zhou, K.; Lam, D.; Chen, H.-M.; Wang, Y. Spatiotemporal model to quantify stocks of building structural products for a prospective circular economy. Resour. Conserv. Recycl. 2020, 162, 105026. [Google Scholar] [CrossRef]
- Wallsten, B.; Magnusson, D.; Andersson, S.; Krook, J. The economic conditions for urban infrastructure mining: Using GIS to prospect hibernating copper stocks. Resour. Conserv. Recycl. 2015, 103, 85–97. [Google Scholar] [CrossRef] [Green Version]
- Stephan, A.; Athanassiadis, A. Quantifying and mapping embodied environmental requirements of urban building stocks. Build. Environ. 2017, 114, 187–202. [Google Scholar] [CrossRef]
- Marcellus-Zamora, K.A.; Gallagher, P.M.; Spatari, S.; Tanikawa, H. Estimating Materials Stocked by Land-Use Type in Historic Urban Buildings Using Spatio-Temporal Analytical Tools. J. Ind. Ecol. 2016, 20, 1025–1037. [Google Scholar] [CrossRef]
- Mastrucci, A.; Marvuglia, A.; Benetto, E.; Leopold, U. A spatio-temporal life cycle assessment framework for building renovation scenarios at the urban scale. Renew. Sustain. Energy Rev. 2020, 126, 109834. [Google Scholar] [CrossRef] [Green Version]
- Augiseau, V.; Barles, S. Studying construction materials flows and stock: A review. Resour. Conserv. Recycl. 2017, 123, 153–164. [Google Scholar] [CrossRef]
- ISO Standard No. 14040:2006; Environmental Management—Life Cycle Assessment—Principles and Framework. ISO: Geneva, Switzerland, 2006. Available online: https://www.iso.org/standard/37456.html (accessed on 15 February 2022).
- BRANZ. LCAQuick, Version 3.4.3; Computer Software; BRANZ: Judgeford, New Zealand; London, UK, 1970; Available online: https://www.branz.co.nz/environment-zero-carbon-research/framework/lcaquick/ (accessed on 15 February 2022).
- Auckland Council. GeoMaps; Computer Software; Auckland Council: Auckland, New Zealand, 2016. Available online: https://geomapspublic.aucklandcouncil.govt.nz/viewer/index.html (accessed on 15 February 2022).
- AutoDesk. AutoCAD 2021; Computer Software; AutoDesk: San Rafael, CA, USA, 2020; Available online: https://www.autodesk.co.nz/products/autocad/overview (accessed on 15 February 2022).
- AutoDesk. Revit 2021; Computer Software; AutoDesk: San Rafael, CA, USA, 2020; Available online: https://www.autodesk.co.nz/products/revit/overview (accessed on 15 February 2022).
- BS EN 15978:2011; Sustainability of Construction Works. Assessment of Performance of Buildings. Calculation Method. European Standards: Pilsen, Czech Republic, 2011. Available online: https://www.en-standard.eu/bs-en-15978-2011-sustainability-of-construction-works-assessment-of-environmental-performance-of-buildings-calculation-method/ (accessed on 15 February 2022).
- AS/NZS 2728:2013; Prefinished/Prepainted Sheet Metal Products for Interior/Exterior Building Applications—Performance Requirements. Standards New Zealand: Wellington, New Zealand, 2013. Available online: https://www.standards.govt.nz/shop/asnzs-27282013/ (accessed on 20 April 2022).
- Love, S. Steel Product Carbon Offset Programme; Thinkstep ANZ: Wellington, New Zealand, 2020; p. 47. Available online: https://www.hera.org.nz/wp-content/uploads/Steel-Sector-Carbon-Offset-Programme-Instructions-v4-28-10-2020.pdf (accessed on 18 April 2022).
- Meil, J.K. A Life Cycle Analysis of Solid Wood and Steel Cladding; Athena Sustainable Materials Institute; Ottawa, Canada. 1998, p. 26. Available online: https://calculatelca.com/wp-content/themes/athenasmisoftware/images/LCA%20Reports/Solid_Wood_And_Steel_Cladding.pdf (accessed on 18 April 2022).
- Kaethner, S.C.; Yang, F. Environmental impacts of structural materials—Finding a rational approach to default values for software. Struct. Eng. 2011, 89, 7. [Google Scholar]


| References | Aim | Scope | Data Sources | Method | Time Span | Embodied Energy/LCA |
|---|---|---|---|---|---|---|
| [64] | Quantify and map the in-use structural bricks | Three cities | GIS map, building types, footprint perimeters, relevant height, historical landscape characterization, ordnance survey | Bottom-up approach | Yearly | Yes |
| [65] | Assess GIS-based MFA as a prospecting approach of secondary resources to promote urban mining | One city | GIS map, Material Flow Analysis | Bottom-up approach | Yearly | No |
| [66] | Quantify and map embodied energy and urban material stocks | One city | GIS map, footprint perimeters, relevant height | Bottom-up approach | Yearly | Yes |
| [67] | Quantity and map urban material stocks | One city | GIS map, Google Earth, U.S. Environmental Protection Agency, building models, design codes, manufacturer’s product data, US DOE | Bottom-up approach | Every two years | No |
| [68] | Map the energy consumption of building materials in the urban area | One city | GIS data, statistical data, regulations, footprint, PostgreSQL | Bottom-up approach | Yearly | Yes |
| Area | Site Address | Building Type | Metal Product Type | Width of the Metal Sheet (mm) | Linear Meter of Roof (m) | Linear Meter of Wall Cladding (m) |
|---|---|---|---|---|---|---|
| Auckland | 201 Lincoln Drive, Henderson | Residential | Long Run 7 Ribs | 934 | 303 | 289 |
| 59 Arabella Lane, Snells Beach | Commercial | Tray Roofing Profile | 630 | 504 | 326 | |
| 77 Rotu Drive, Massey | Commercial | Long Run 5 Ribs | 765 | 920 | 956 | |
| 380 Cowes Road, Waiheke Island | Residential | Tray Roofing Profile | 630 | 142 | 169 | |
| Manawa View, Kerikeri | Residential | Long Run 5 Ribs | 765 | 376 | 242 | |
| Christchurch | 53 Glenmark Drive | Residential | Tray Roofing Profile | 630 | 524 | 906 |
| Hamilton | NZ Honey Office-Warehouse | Commercial | Long Run 5 Ribs | 765 | 2328 | 1695 |
| Palmerston North | 14 Poplar Grove, Feilding | Residential | Long Run 5 Ribs | 765 | 310 | 79 |
| Tauranga | 44 Marshall Rd, Katikati | Commercial | Long Run 5 Ribs | 765 | 509 | 263 |
| Wellington | 3 Ara Hekere Waikanae | Residential | Tray Roofing Profile | 630 | 623 | 308 |
| Area | Site Address | Product Type | Base Metal Thickness (BMT) | Global Warming Potential (GWP) (kgCO2eq)/m2 | |||
|---|---|---|---|---|---|---|---|
| A1–A3 | C3 | C4 | D | ||||
| Auckland | 201 Lincoln Drive, Henderson | Long Run 7 Ribs | 0.40 mm and 0.55 mm | 15.60 | 0.03 | 0.02 | −4.72 |
| 59 Arabella Lane, Snells Beach | Tray Roofing Profile | 0.55 mm | 14.21 | 0.03 | 0.02 | −4.42 | |
| 77 Rotu Drive, Massey | Long Run 5 Ribs | 0.40 mm | 8.65 | 0.02 | 0.01 | −2.52 | |
| 380 Cowes Road, Waiheke Island | Tray Roofing Profile | 0.55 mm | 17.60 | 0.04 | 0.03 | −5.91 | |
| Manawa View, Kerikeri | Long Run 5 Ribs | 0.40 mm and 0.55 mm | 15.61 | 0.03 | 0.02 | −4.81 | |
| Christchurch | 53 Glenmark Drive | Tray Roofing Profile | 0.55 mm | 17.60 | 0.04 | 0.02 | −5.48 |
| Hamilton | NZ Honey Office-Warehouse | Long Run 5 Ribs | 0.40 mm and 0.55 mm | 17.91 | 0.04 | 0.02 | −5.39 |
| Palmerston North | 14 Poplar Grove, Feilding | Long Run 5 Ribs | 0.40 mm and 0.55 mm | 16.86 | 0.04 | 0.02 | −4.99 |
| Tauranga | 44 Marshall Rd, Katikati | Long Run 5 Ribs | 0.40 mm and 0.55 mm | 17.53 | 0.04 | 0.02 | −5.24 |
| Wellington | 3 Ara Hekere Waikanae | Tray Roofing Profile | 0.55 mm | 20.53 | 0.04 | 0.03 | −6.35 |
Publisher’s Note: MDPI stays neutral with regard to jurisdictional claims in published maps and institutional affiliations. |
© 2022 by the authors. Licensee MDPI, Basel, Switzerland. This article is an open access article distributed under the terms and conditions of the Creative Commons Attribution (CC BY) license (https://creativecommons.org/licenses/by/4.0/).
Share and Cite
Roy, K.; Su, R.; Dani, A.A.; Fang, Z.; Liang, H.; Lim, J.B.P. Spatiotemporal Model to Quantify Stocks of Metal Cladding Products for a Prospective Circular Economy. Appl. Sci. 2022, 12, 4597. https://doi.org/10.3390/app12094597
Roy K, Su R, Dani AA, Fang Z, Liang H, Lim JBP. Spatiotemporal Model to Quantify Stocks of Metal Cladding Products for a Prospective Circular Economy. Applied Sciences. 2022; 12(9):4597. https://doi.org/10.3390/app12094597
Chicago/Turabian StyleRoy, Krishanu, Ran Su, Aflah Alamsah Dani, Zhiyuan Fang, Hao Liang, and James B. P. Lim. 2022. "Spatiotemporal Model to Quantify Stocks of Metal Cladding Products for a Prospective Circular Economy" Applied Sciences 12, no. 9: 4597. https://doi.org/10.3390/app12094597
APA StyleRoy, K., Su, R., Dani, A. A., Fang, Z., Liang, H., & Lim, J. B. P. (2022). Spatiotemporal Model to Quantify Stocks of Metal Cladding Products for a Prospective Circular Economy. Applied Sciences, 12(9), 4597. https://doi.org/10.3390/app12094597