Article

Automobile Technological Transition Scenarios Based on Environmental Drivers

by
Julieth Stefany García
1,
José D. Morcillo
2,*,
Johan Manuel Redondo
3 and
Mauricio Becerra-Fernandez
4
1
Facultad de Minas, Universidad Nacional de Colombia, Medellín 050034, Colombia
2
Facultad de Ingeniería y Tecnologías, Universidad de Monterrey, Monterrey 66238, Mexico
3
Facultad de Ciencias Económicas y Administrativas, Universidad Católica de Colombia, Bogotá 110231, Colombia
4
Facultad de Ingeniería, Universidad Católica de Colombia, Bogotá 110231, Colombia
*
Author to whom correspondence should be addressed.
Appl. Sci. 2022, 12(9), 4593; https://doi.org/10.3390/app12094593
Submission received: 25 February 2022 / Revised: 9 April 2022 / Accepted: 29 April 2022 / Published: 1 May 2022
(This article belongs to the Special Issue Future Transportation)

Abstract

:
Different industrial sectors are assuming measures to mitigate their greenhouse gas emissions, facing the imminent materialization of climate change effects. In the transport sector, one of the measures involves the change in energy source of vehicles, leading to a transition from vehicles powered by fossil fuels (conventional) to electric. Nevertheless, electric vehicles have different drivers that promote their purchases. This work only considers the informed buyers’ interest in making their decisions using environmental criteria. However, these technologies have a series of impacts, including the generation of hazardous waste such as used batteries, which leads consumers to question the environmental impacts generated by conventional and electric vehicles; consequently, it is uncertain which prospective scenarios will dominate in various nations and what will promote them. Therefore, the proposed model is studied as a dynamical system, with bifurcations of codimension 2, which means that it is possible to represent all possible prospective scenarios of this configuration through a bifurcation diagram. In this way, the analysis allows us to find that four families of technological transitions (trajectories that qualitatively can be identified as being of the same behavior class) emerge from the relationships established in the system, showing similarities to the different transition situations recognized on the planet. This model is an attractive tool to classify automobiles’ technological transitions, despite having no other criteria. In fact, although decarbonization is an urgent quest in the transport sector, there are still too many challenges to guarantee environmentally friendly technologies.

1. Introduction

In 2015, during the Paris Conference, governments agreed to limit global warming to levels below preindustrial levels [1,2,3]. To achieve this goal it will be necessary to keep emissions between 420 and 1200 GT of CO 2 by 2100 [4,5], which led to 190 countries making commitments that define voluntary climate actions until 2030, such as Nationally Determined Contributions (NDCs) and action plans to achieve targets of the Sustainable Development Goals [6].
The energy sector is one of the largest contributors to emissions worldwide. For 2021, this sector emitted approximately 33 GT of CO 2 , which shows a growth of 4.8 % compared to 2020 [7].
For its part, the transportation sector is responsible for 24 % of direct emissions of CO 2 from the use of fuels [8,9]. Likewise, road automobiles account for almost three-quarters of the CO 2 emissions from transport and are also the fragment with the greatest opportunity for decarbonization [10]. For this reason, to fulfill the agreed commitments, the need to achieve an energy transition towards zero and low emission technologies have been identified to counteract the effects of climate change [11].
Rapid urbanization, the dynamism in the populated centers, and the dependence on transportation to improve the quality of life have increased the demand for automobiles, of which a large proportion run on fossil fuels that are strongly related to the emissions of greenhouse gases (GHG), leading to increased air pollution, increased respiratory illnesses, and impaired quality of life [12,13].
Among the alternatives established by nations to mitigate the emissions of CO 2 from the transport sector are automobiles with alternative technologies that use zero and low emission fuels, such as hybrid vehicles (HEV), plug-in hybrid vehicles (PHEVs), and battery electric vehicles (BEVs). These alternatives are valuable for consumers who make their decisions based on the environmental impact generated by these technologies [14,15,16,17,18].
As a consequence, the growth in vehicle sales of these technologies has intensified. According to the International Energy Agency, 2.2 million electric cars were sold in 2019, representing 2.5 % of global car sales. During 2020, the automobile market was contracted due to the effects of the pandemic, but sales of electric cars increased to 3 million, representing 4.1 % of total automobile sales. During the year 2021, sales of electric vehicles doubled and reached a total of 6.6 million, which represents about 9 % of the global car market [19]. According to the data, a total of 16 million electric vehicles travel on roads worldwide [19], with 90 % of global sales of these technologies concentrated in China, Europe, and the USA [10].
A Tank to Wheel analysis conducted in [20] found that battery-powered electric cars reduce CO 2 emissions by 32 % compared to their conventional counterparts. Likewise, the transition towards these technologies reduces G H G emissions and contributes to the fulfillment of the commitments agreed by countries [9,13,21,22,23,24]. However, to achieve decarbonization in the transport sector, it is necessary to encourage generation with nonconventional sources of renewable energy, given that those nations in which fuels and coal have a high share may not perceive the benefits of the electrification of the sector [25,26,27,28,29]. For this reason, countries with high emissions of CO 2 must diversify their energy generation matrix, take advantage of their electric vehicle capacity, and reduce CO 2 emissions [30,31].
Electric vehicles have different drivers that promote their purchase; one of the main drivers is the interest of informed buyers who make their decisions using environmental criteria, such as reducing noise pollution and greenhouse gas emissions and improving energy efficiency, as well as improving the ecological image that the individuals and/or organizations have [32].
However, the zero and low emission vehicles sector still faces significant challenges in the transition towards electric technologies, such as increasing the charging infrastructure, increasing the energy efficiency, increasing the penetration of renewable energies in the energy matrix, and reducing the costs of batteries and charging stations, as well as improving the profitability of the cars [33]. Furthermore, it is necessary to establish incentives or policies that governments can promote to ensure the rapid and efficient adoption of environmentally friendly cars [34].
The transition to electric automobiles also has a series of negative significant environmental impacts related to mineral exploitation and final disposal of the electric and electronic parts used [35]. Examples of this are lithium, cadmium, and nickel, which show a balance between supply and demand in the short and medium-term but a scarcity in the long term due to the expected increase in demand for hybrid and electric vehicles (BEV, PHEV, and HEV) [36] and current recycling rates below 1 % [36].
Regarding waste, the components of electric batteries are hazardous waste, causing significant health and environmental problems without proper management [37]. In this sense, it is necessary to establish recycling systems and carry out socialization actions to recover the lithium, nickel, and cadmium and be able to reintegrate them into the value chain, both for vehicle batteries and for other uses [37]. Furthermore, the battery’s performance must be improved to reduce the intensity of exploitation of these minerals in the sector, while increasing other efforts to develop alternative options [36].
This work discusses the transition scenarios of automobile technologies towards zero and low emission alternatives, considering that current technologies generate other impacts related to the disposal of hazardous solid waste. The assumption is that the technological change decision has as its only determinants emissions and hazardous waste reduction; so, the buyers base their decision on environmental responsibility. As a result, the buyers fall into the paradox of choosing between the impact alternatives due to the benefits derived from automobile use.
Different authors have investigated issues in the transition towards zero and low emission technologies [32], and their approaches and methodologies are varied. Some methods to analyze transition are life cycle analysis [15], modeling with different techniques [31,35,38,39,40,41,42,43], system dynamics [35,44,45], cost analysis [23,29,46], literature reviews [47,48], linear regressions [49], LEAP software models [24], surveys and interviews [50,51,52], ANSWER MARKAL software models [53], and Well to Wheel analyses [26]. These authors have focused their studies on evaluating and analyzing how technological transitions occur in national transport sectors. However, they only address the current conditions and the incentives implemented in each country.
Conversely, the approach presented in this work aims to be systemic, by identifying the trend behavior derived from consumers whose only criterion for automobile choice is environmental responsibility. In this sense, we present a first approximation that allows identifying different categories of national transition, called prospective transition scenarios, which emerge from an analysis based on bifurcation theory. This approach is novel in the literature, only a first approximation for analyzing capacity scenarios in electric markets was proposed in [54,55].
In this way, this work recognizes and describes the technological transition scenarios involving conventional and electric automobiles based on the environmental drivers of emissions and disposal of hazardous waste.
In summary, the emissions generated by the transport sector are decisive when consumers take action. Among the alternatives to decarbonize the transport sector is the transition from conventional to less polluting technologies. In particular, electric vehicles are an alternative that has gained strength, which has led them to increase their market share. This technology has become more popular among shoppers who make environmentally responsible purchasing decisions. However, EVs generate hazardous waste from their batteries. This causes the consumers to question whether to prioritize the environmental impacts generated by fuel vehicles or EVs. This will impact the growth or reduction in the fleet of both of these technologies. As a consequence, it is uncertain which prospective scenarios will have significant participation and what will promote them. In this research work, only the informed decision of consumers with an environmental commitment was considered a driver.
The document is organized as follows. This introductory section has shown the problem and purpose of this work, along with the state of the art. Section 2 presents the mathematical modeling carried out from system dynamics to obtain the dynamical system from which the results come. This section explains a dynamical system, a bifurcation analysis, how the system equilibrium points were calculated, and how their stabilities were established. Section 3 presents the phase portraits, time series, and the bifurcation diagram obtained for the dynamical system under study. In Section 4, the implications of the results are presented and future work is proposed. Finally, Section 5 presents the conclusions of this research.

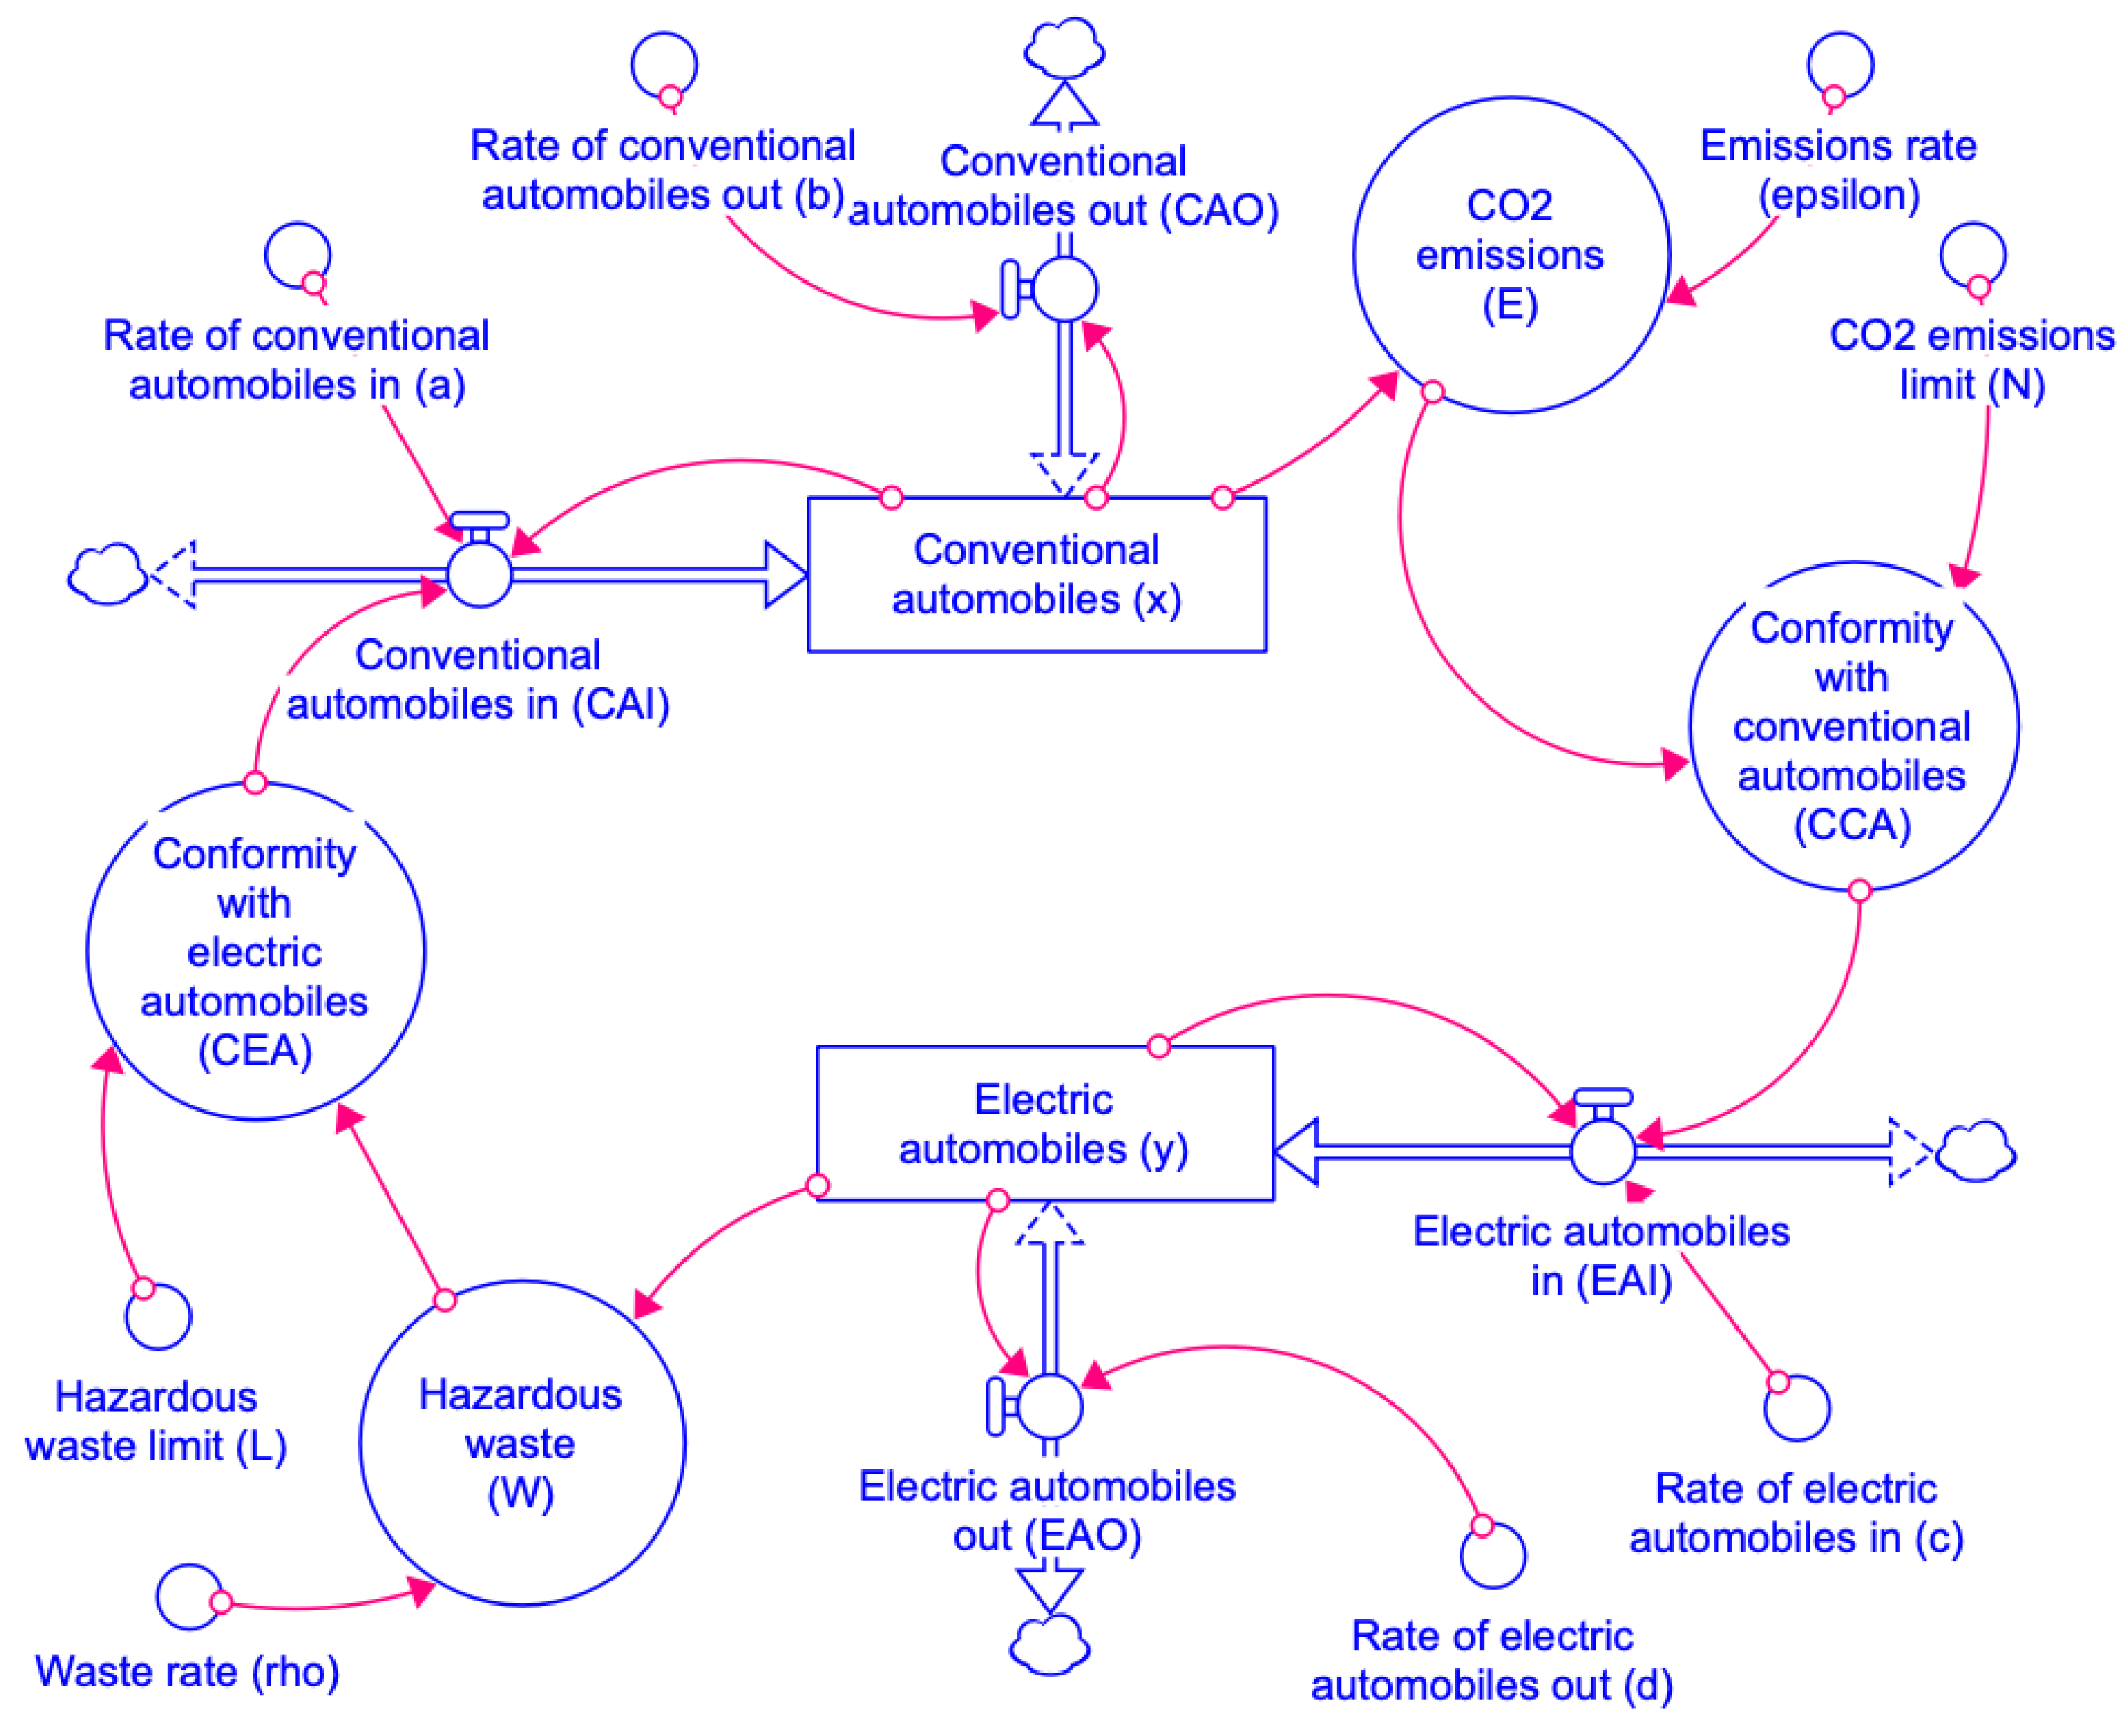
2. Materials and Methods

The starting point of the analysis presented in this document is the mathematical model of Equation (4). This system of first-order ordinary differential equations has been obtained from system dynamics methodology (see for example [56]).
The rules of causality are simple: (1) conventional automobiles generate emissions of CO 2 [22,23,57], (2) electric automobiles produce hazardous waste [36,58], (3) emissions and hazardous waste generate nonconformity in vehicle consumers taking the option to change technology to reduce its environmental impact [32], (4) the enthusiasm to acquire one or another technology leads to the entry of automobiles into the system. The hazardous waste of conventional vehicles is out of the scope of this research work, since it is not as important a selection criterion for buyers as the hazardous waste of electric automobiles.
From these causality rules, we built the Forrester diagram shown in Figure 1. Conventional and electric automobiles are the level variables of the system. The equations presented below are an interpretation of the Forrester diagram. The rules used were [56]: (1) the change over time in level variables, represented in boxes, is the difference between the inflow and outflow variables, symbolized as valves; (2) the flow variables are the products between the variables connected with arrows, and (3) the auxiliary variables (represented as circles), which are functions of the variables connected through arrows, are defined according to the relationship between them.
The conventional automobiles x change over time (represented by a point on the variable), given in [ a u t o m o b i l e s ] , is the difference between automobiles entering the market C A I and those leaving C A O , both given in [ a u t o m o b i l e s / y e a r ] . The electric automobiles y change over time, given in [ a u t o m o b i l e s ] , is the difference between the automobiles that enter the market E A I and those leaving E A O , both given in [ a u t o m o b i l e s / y e a r ] . So, the level equations are defined as follows:
x ˙ = C A I C A O y ˙ = E A I E A O
The change ratio equations presented in Equation (1) show that the increase in the quantities of each automobile category depends on the disagreement that users have with the other category, and the decrease depends on an average depreciation, as follows:
C A I = a · x · ( 1 C E A ) C A O = b · x E A I = c · y · ( 1 C C A ) E A O = d · y
where a, b, c, and d are exchange rates in the range [ 0 , 1 ] , given in [ y e a r 1 ] , and the conformities with each category depend on the closeness of the emissions E, given in [ T o n C O 2 / y e a r ] , or hazardous waste disposal W, given in [ T o n / y e a r ] , with an allowable limit value (emissions limit N, given in [ T o n C O 2 / y e a r ] , and hazardous waste limit W, given in [ T o n / y e a r ] ) that could be agreed through national or international environmental commitments. The equations for emissions and hazardous waste are defined as follows:
C E A = W / L C C A = E / N E = ϵ · x W = ρ · y
where ϵ 0 and ρ 0 are exchange rates given in [ T o n C O 2 / ( a u t o m o b i l e · y e a r ) ] and [ T o n / ( a u t o m o b i l e · y e a r ) ] , respectively.
Finally, by replacing the equations, and considering α = a b , β = c d , δ = a ρ / L , and λ = c ϵ / N , we obtain the following mathematical model:
x ˙ = x ( α δ y ) y ˙ = y ( β λ x )
Note that if the system of Equation (4) is studied under the variation of α and β , different scenarios of exchange rates will be considered.
The model validation was performed using the tests reported in [59]. In particular, we conducted the empirical structure confirmation test and empirical parameters confirmation test. The theoretical structure confirmation test was performed through the literature review mentioned above to explain the causal rules construction. The theoretical parameters confirmation was carried out during the construction of the model by defining the application ranges, as shown above. The dimensional consistency test appears together with the equations explanation, verifying the units proposed. We also carried out extreme value tests allowing us to recognize the limits and scope of the model. When possible, the bifurcation analysis is better than the system sensitivity tests because the bifurcation analysis can identify all the probable system behaviors, while the sensitivity analysis only allows visualizing the transitory state under the parameter variation in a limited range, using the Monte Carlo method. For this reason, our bifurcation analysis shown below supports the validity of our proposed model. Finally, we carried out phase relationship tests to compare the behavior between the state variables and verify the behavior consistency through phase portraits, as shown in Section 3. We did not conduct behavior validation with real time series, because it is still too early to have enough national data that could be comparable with the behaviors shown by our prospective mathematical model.
The mathematical model of Equation (4) is a continuous dynamical system. For this reason, we analyzed the equilibrium points and their stability and determined that the system has bifurcations in codimension two.
A dynamical system (see [60,61]) is a triple ( X , T , φ ) , where X is the state space, T is an ordered set representing time, and
φ : T × X X ( t , x ) φ t ( x )
is a parameterized family of evolution operators that satisfies the following:
  • The system state does not change spontaneously
    φ 0 ( x ) = x for   all   x X
  • The evolution law of the system does not change in time
    φ t + s ( x ) = ( φ t φ s ) ( x ) = φ t ( φ s ( x ) ) for   all   x X ,   and   all   t , s > 0 .
In the model of Equation (4), the state space is defined by the state variables of conventional automobiles x and electric automobiles y; that is, X = { ( x , y ) R } . The set of time is a subset of the real numbers, so the dynamical system will be said to be continuous; that is, T = { t R : t 0 } . Finally, the evolution law is given by the solution of the differential system of Equation (4).
The mathematical perspective from dynamical systems is relevant in a trend behavior analysis because it allows characterizing the qualitative structure of the system’s behavior beyond just understanding the behavior for a specific time, which could be misleading. Roughly speaking, the dynamical systems identify invariant sets and characterize their stability. Invariant sets are states that do not change as the system evolves, i.e., state sets that remain in time. Examples include equilibrium points, periodic orbits, and strange attractors. The stability can characterize the system trajectories as attracting, repelling, fixing (centers), or combining these three options.
Since the equilibrium points occur when the system does not change, it must be satisfied that x ˙ and y ˙ are zero [60,61], making the differential problem an algebraic issue, as follows:
x ˙ = 0 x ( α δ y ) = 0 y ˙ = 0 y ( β λ x ) = 0
The stability of the equilibrium points is calculated with the eigenvalues of the evolution matrix of the differential system around the equilibrium points [60,61], i.e., consider Equation (4) around the equilibrium points in the form X ˙ = J X , where X = ( x , y ) T is the state vector, and J is the Jacobian matrix defined as:
J ( x , y ) = x ˙ x x ˙ y y ˙ x y ˙ y = α δ y δ y λ y β λ x
By the Hartman-Grobman theorem [60,61], the nonlinear behavior so close to an equilibrium point is the linearized behavior given by the Jacobian matrix in the equilibrium point. So, the evolution matrix around an equilibrium point ( x ¯ , y ¯ ) is J ( x ¯ , y ¯ ) .
The eigenvalues χ are defined as the roots of the characteristic polynomial χ 2 t r ( J ) χ + d e t ( J ) , where t r ( J ) is the trace of the Jacobian matrix J obtained by summing the diagonal entries of J, and d e t ( J ) is the determinant of the Jacobian matrix.
A more robust analysis, called bifurcation analysis, also seeks to identify how the system parameters’ variation can give rise to the appearance/disappearance of invariant sets or change their stability. This bifurcation analysis consists in finding system perturbations that transform its phase portraits (system trajectory structure) [60,61]. These perturbations are represented by the variation of the system parameters in such a way that if the variation of n parameters qualitatively changes the phase portraits, it is said to be a bifurcation of codimension n [60,61].

3. Results

The results presented in this section are based on the dynamical system analysis of Equation (4). These ordinary differential equations were programmed and solved using the O D E 45 in the MATLAB® software. Then, and in order to keep the sense of the application, four transition families in the nonnegative space of the state variables were found. To clarify, from a qualitative perspective, a transitions family is a set of similar behavior curves (topologically equivalent trajectories in the states space). For example, two orbits that converge to the same equilibrium point showing a sigmoidal behavior are said to be topologically equivalent, although the route of their trajectories is different (quantitatively different). Usually, these behaviors are easily visualized in the phase portrait, which is a representation of all possible solutions or trajectories of a system of differential equations for any initial condition and a specific set of parameter values. As shown in Figure 2 and Figure 3, each of these transition families is displayed as a different phase portrait.
By solving Equation (8), it is found that Equation (4) has the equilibrium E q 1 ( 0 , 0 ) and E q 2 ( β / λ , α / δ ) , each of which has a stability that depends on the values of the α and β parameters. For the equilibrium E q 1 , the eigenvalues are α and β ; while for the equilibrium E q 2 , the eigenvalues are ± α β . This leads to four cases called transition families; each one is presented in Figure 2 and Figure 3.
The first family transition corresponds to two unstable nodes (see the phase portrait in Figure 2a). The first is located at the origin (source type), while the second is in the nonnegative states space (saddle type). Because it is possible to have different trajectories in the phase portrait depending on the initial condition, this family transition has four distinct trend behaviors (which is why we call the transition scenarios families).
For the first case, see Figure 2a,b, a behavior is visualized in which the two technologies grow over time until they reach a particular point, in which electric automobiles tend to disappear, while the conventional vehicles become dominant. For the second case, see Figure 2c,d, the behavior is similar, but the disappearance now occurs for conventional automobiles, while electric vehicles become dominant. In the third case, see Figure 2e,f, there is a drop in the technologies used that, after a specific time, ends and causes electric automobiles to recover and become the dominant technology. Finally, in the fourth case, see Figure 2g,h, there is again an abandonment of the two technologies, but the conventional technology recovers in the long term.
The second family transition corresponds to an unstable node at the origin (saddle type), see the phase portrait in Figure 3a. Another equilibrium point is outside the nonnegative states space (center type), but its analysis is irrelevant for the application. This second family transition is the one that looks like the most expected transition: conventional automobiles diminish until they disappear, while electric automobiles gradually increase their dominance of the market, until they are the only type of vehicle (see Figure 3b).
The third family transition corresponds to an unstable node at the origin (saddle type), see the phase portrait in Figure 3c. Another equilibrium point is outside the nonnegative states space (center type), but its analysis is irrelevant for the application. This scenario appears as a theoretical possibility, and does not represent the interests of those who talk about the transition of vehicle technologies; it shows the strengthening of conventional automobiles, while electric automobiles disappear (see Figure 3b).
The last family transition corresponds to a stable node at the origin (sink type), see Figure 3e. Another equilibrium point is outside the nonnegative states space (saddle type), but its analysis is irrelevant for the application. In this scenario, the absence of interest of consumers in the two types of technologies leads to their disappearance as transport alternatives (see Figure 3f).

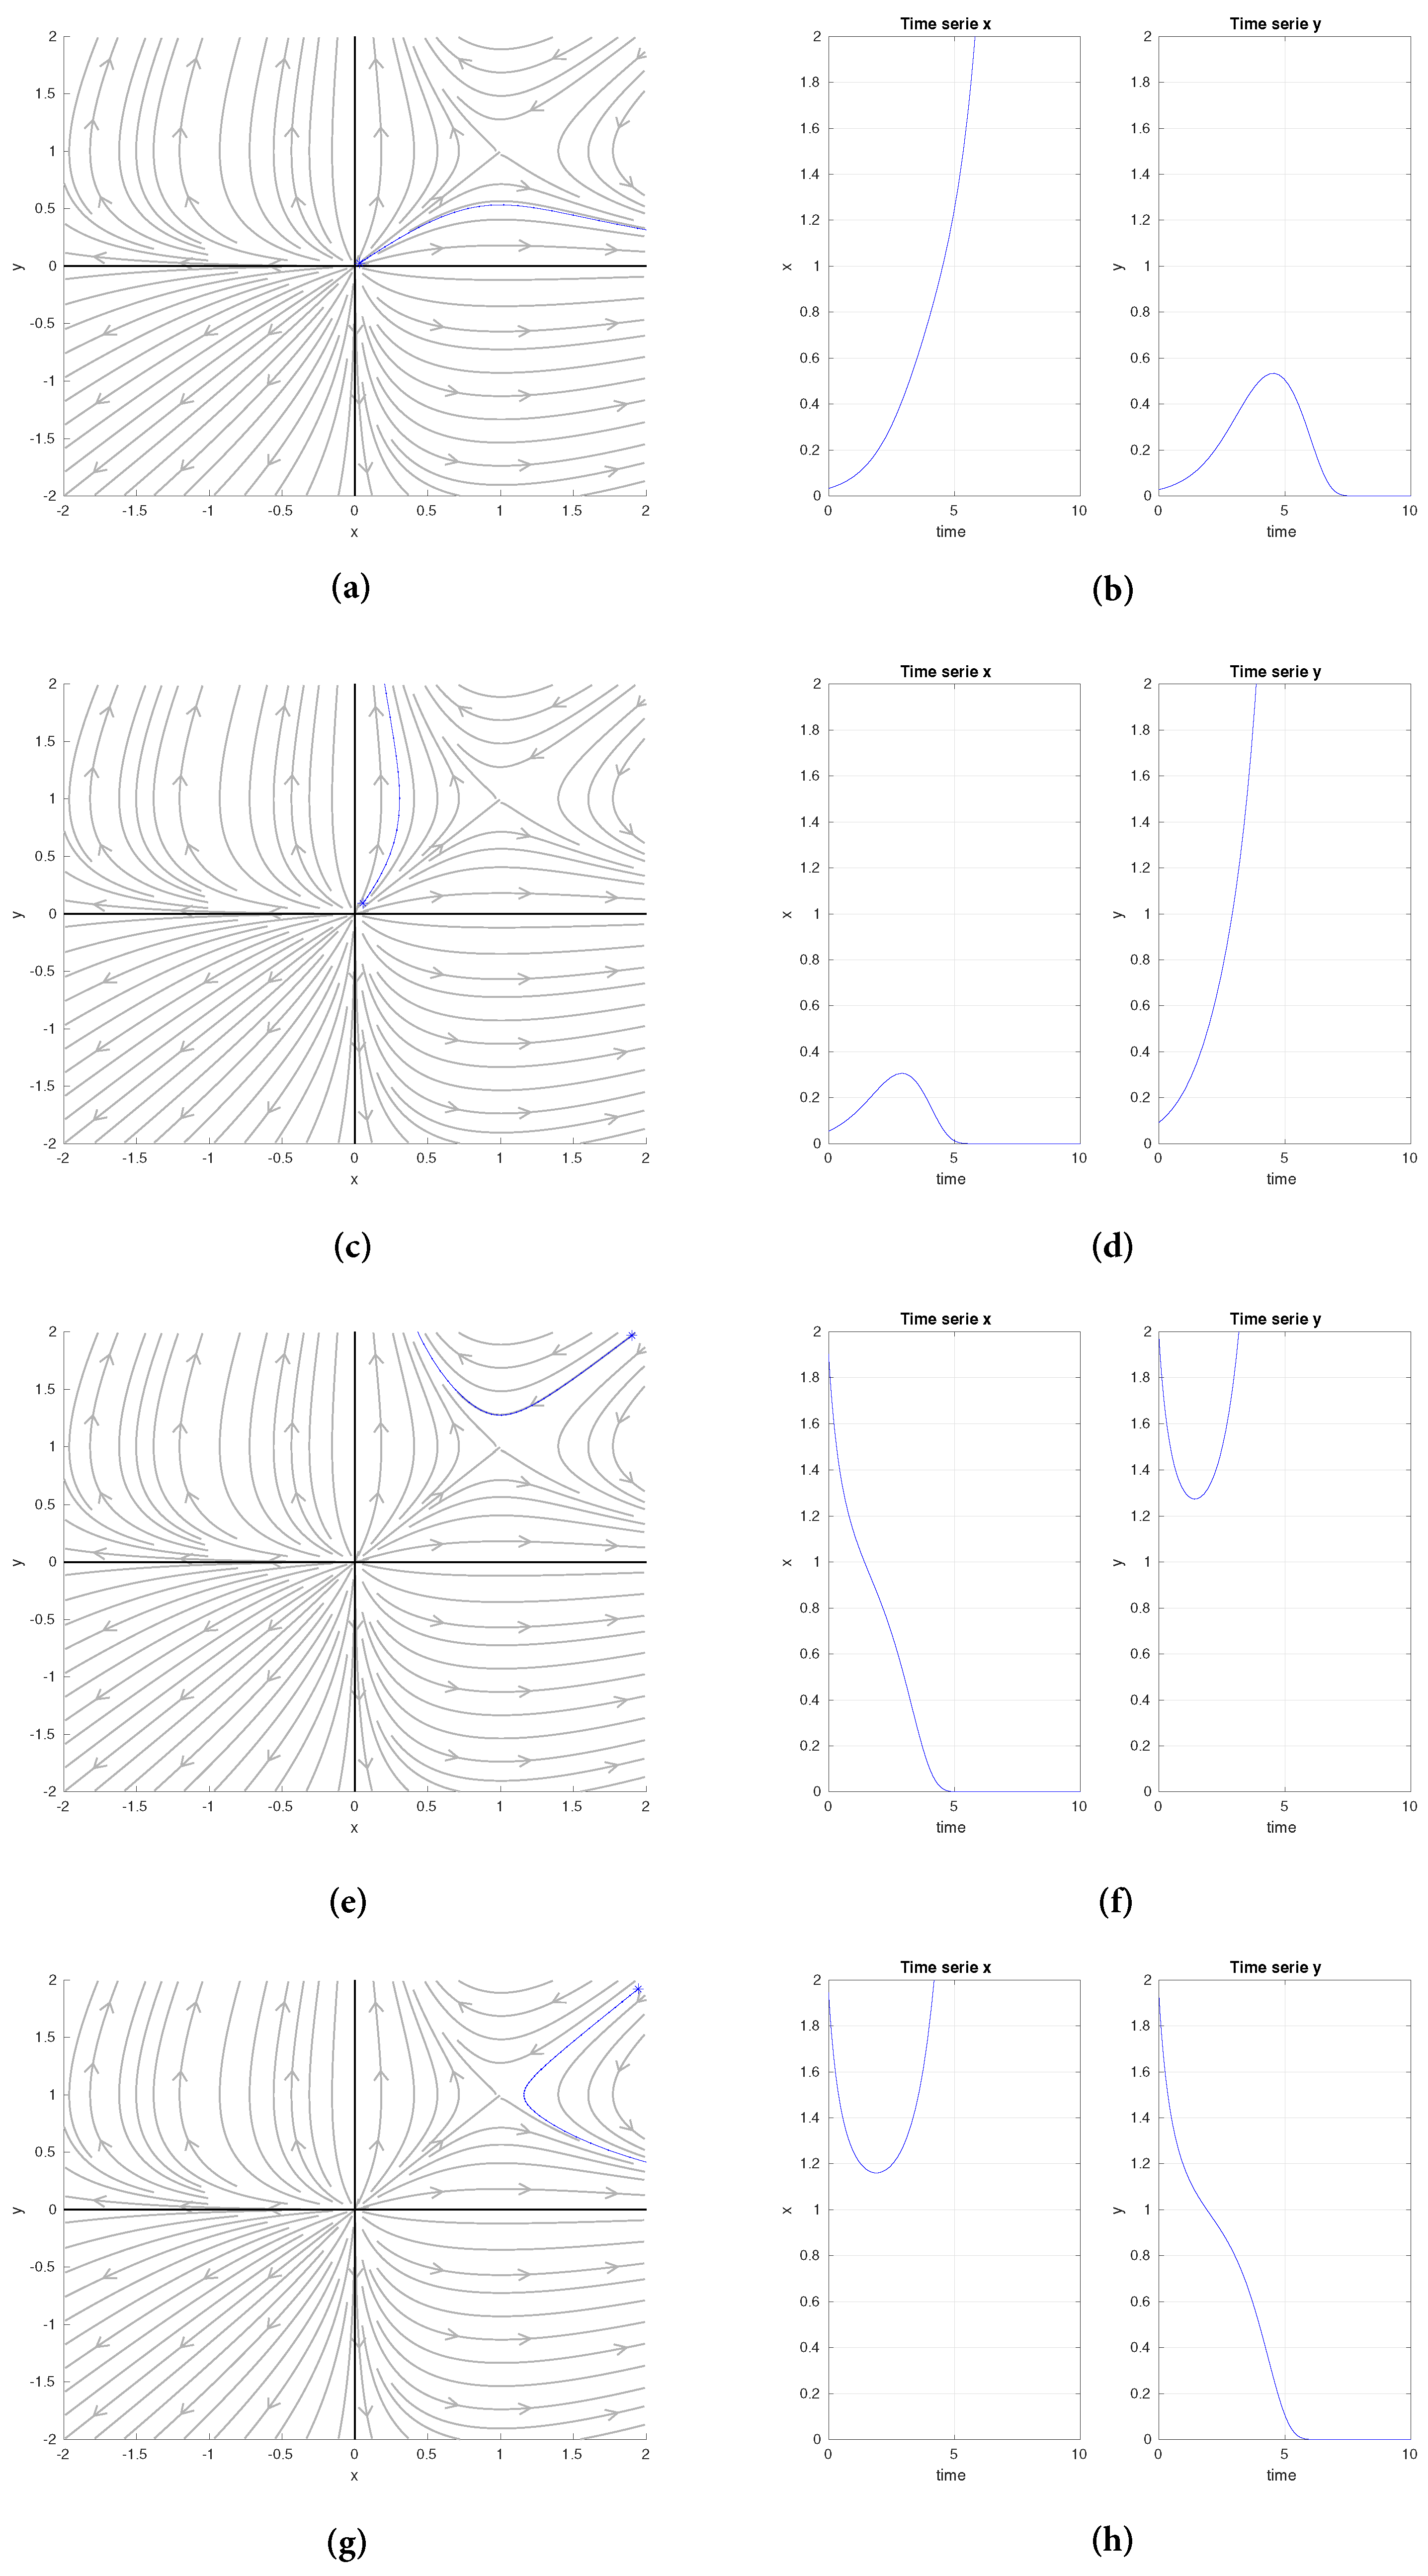
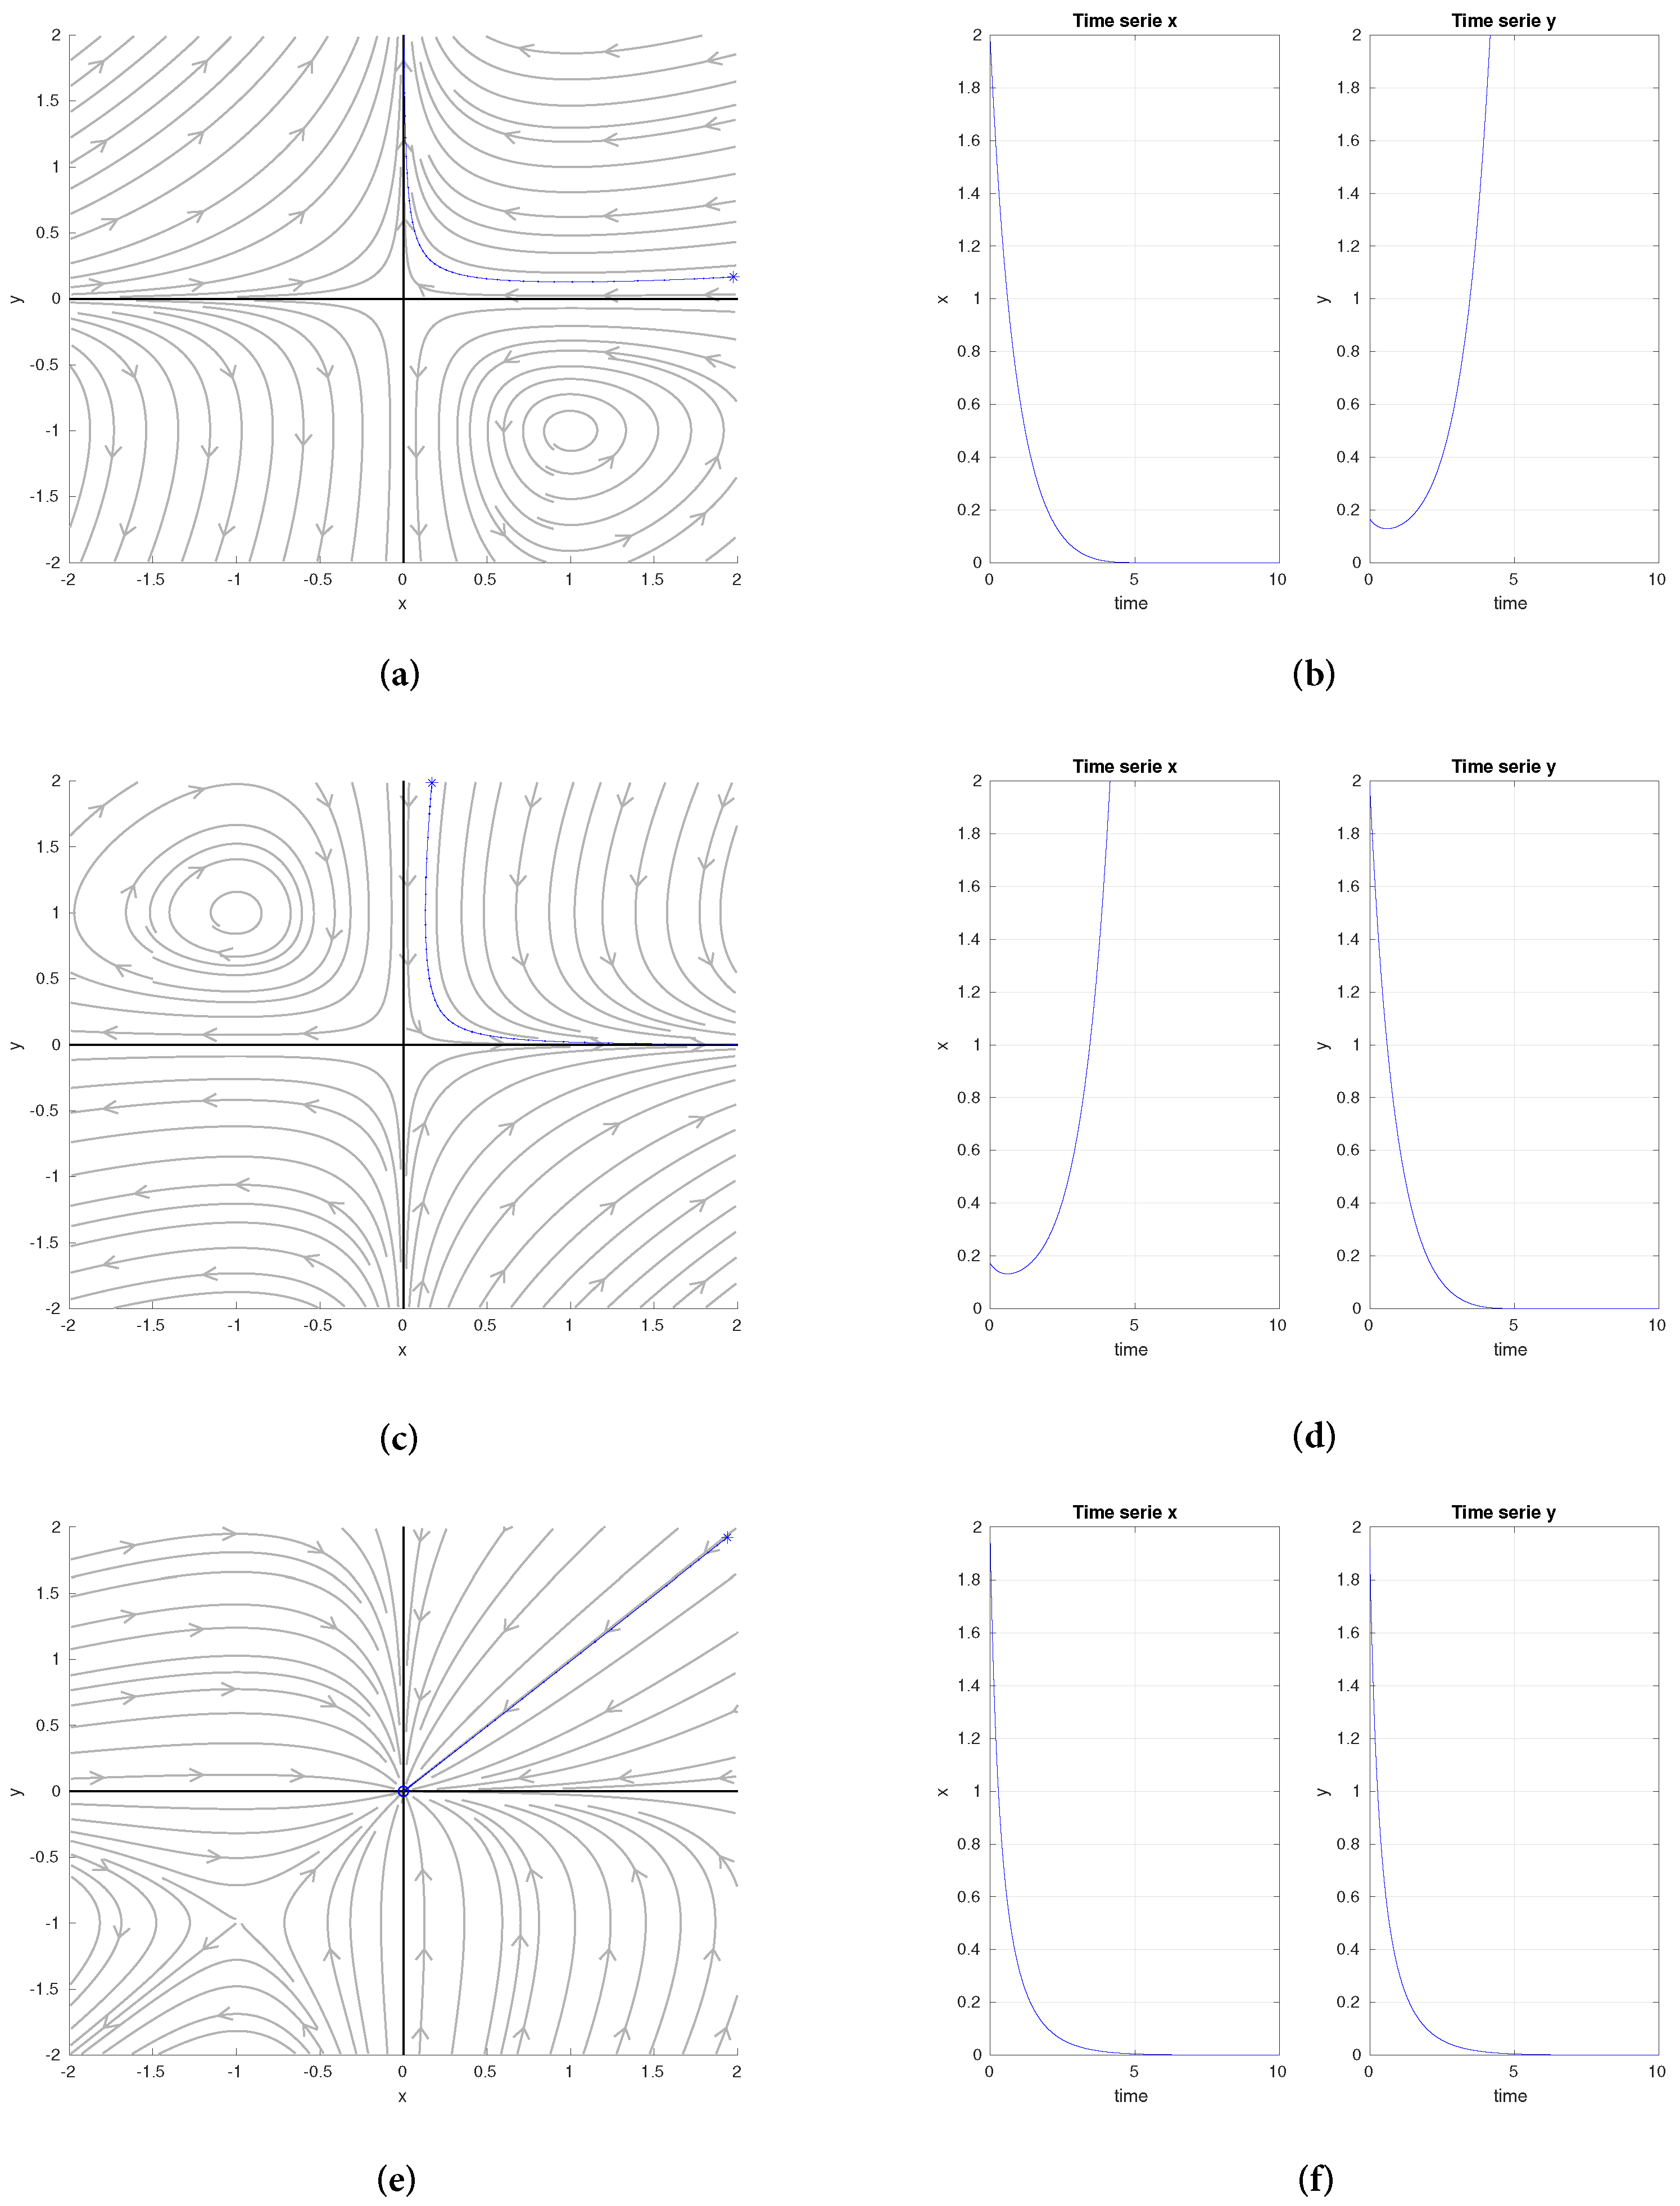
Two-Dimensional Bifurcation Analysis

In principle, one-dimensional bifurcation diagrams are computed when it is necessary to study the stability or behavior of a dynamical system under the variation of any of its parameters. On the other hand, when it is necessary to study the stability or behavior of a dynamical system under the simultaneous variation of two important parameters, then a two-dimensional bifurcation diagram is required [60]. In essence, two-dimensional bifurcation diagrams show different colors, each of which represents a precise combination of the two parameters leading to a specific system behavior.
To obtain these bifurcation diagrams, it is necessary to program a behavior detector, so that when a specific behavior is detected, the program stores the parameters leading to such dynamics, and an identification number will represent a color in the diagram.
Since the equilibrium points’ stability of the dynamical system in Equation (4) depends on the bifurcation parameters α and β , it is possible to obtain a two-dimensional bifurcation diagram, as depicted in Figure 4. This diagram summarizes the behaviors displayed by the system for the different values of the two bifurcation parameters. Notably, the parameter array with the lowest probability of occurrence is for the first family of transitions (in the figure, this family appears as case 1 for graphical simplicity). The parameter arrays to obtain transition families 2, 3, and 4 have been denoted as case 2, case 3, and case 4, respectively. The probability areas of these last cases are broader than case 1; so, in theory, their occurrence chances must be greater than case 1.

4. Discussion

Below is a discussion of the behaviors found in each transition family of vehicle technology from environmental drivers. Each of these transition families would allow the recognition of a different type of transition worldwide, allowing their classification, as will be shown next. Furthermore, we present the possible future work of this research.

4.1. Family Transition 1

From the application perspective, transition 1 is interesting, because the stable manifold and the unstable manifold of the saddle node define four key regions whose behaviors are different.
The trend behaviors presented in Figure 2b,d can be identified with the current behavior, in which the number of conventional and electric automobiles continues growing globally. The long-term outcome is the one that can change due to the final dominance of one of the two technologies. Many nations would be classified in this state today. However, in developed countries, the behavior could be similar to the one shown in Figure 2d, due to the greater investment capacity and awareness of climate change that its inhabitants have; while in underdeveloped countries, it is easier to interpret their trend behavior as that shown in Figure 2b, due to the survival situation of their inhabitants, in addition to the massive confluence of the population in urban centers, where restrictive transport measures and the inability to purchase an electric vehicle due to other criteria than environmental ones (such as the high price of these technologies) determine the purchase of a second conventional vehicle.
On the other hand, the trend behaviors presented in Figure 2f,h would correspond to the assumption that the number of conventional and electric automobiles is so high that there is a general rejection of these automobiles use because of their environmental impacts over climate change and land health (related with hazardous waste). This leads in the long term to the disappearance of one of the two technologies, while the other one becomes dominant. This behavior can be considered in nations in which vehicle use is abandoned in favor of migrating towards public transport and active mobility.
Despite the fact that the behavior shown in this transitional family appears to be the least probable in the bifurcation diagram of Figure 4, the values for which it is satisfied are not utopian. Nor it is utopian to think that the engine of this de-escalation of conventional and electric automobiles could occur due to the impacts they generate on the environment.

4.2. Family Transition 2

The trending behavior presented in Figure 3b can be pointed out as the most natural and expected within the transitions. The trajectories show a smooth transition from conventional to electric technologies, which is how a handover would occur.
It is the most desired transition, led by environmental awareness about climate change and its consequences on global socioecological systems. In this transition, the issue of hazardous waste is an issue on which we can still wait.

4.3. Family Transition 3

The trending behavior presented in Figure 3b shows that automobiles with electric technologies are not convincing due to their effects on the environment related to the management of their hazardous waste.
It should be remembered that the model does not consider the mining activities and their social and ecological implications in the nations where the raw materials are obtained. This should be included in future work for analyzing these transitions. It is intuited that its inclusion in the model could generate new transition behaviors, but it must be tested.
The question would be: how could this scenario be viable when fossil fuel reserves will be scarce so soon?

4.4. Family Transition 4

Finally, the trending behavior presented in Figure 3f shows the lack of interest in the two technologies, causing their disappearance. In this case, no negative environmental effects are prioritized, showing losing interest in the technologies based on conventional or electric mobility and migrating to alternatives such as active mobility or the use of public transport.

4.5. Future Research

The research group recognizes that the only transition drivers are not those related to a full awareness of the environmental implications of each of the vehicle technologies presented. We can also list those corresponding to the price of the vehicle ([50,62]), the charging infrastructure [47,63], the energy value [64], the incentives offered by the government [18,44,51], and the useful life of the technology [38,65].
In this way, the future work must include other criteria in the modeling, with the corresponding analysis of the trend behavior that each new criterion defines on the system behavior.
However, the related issue that makes this inclusion nontrivial lies in the bifurcation analysis, through which all possible prospective scenarios for the system configuration could be visualized [66].
We also expect to obtain management recommendations that at least guarantee adequate management of the related environmental issues to each family of transitions.

5. Conclusions

This work allows the classification of the different types of technological transitions that are taking place around the world, from conventional automobiles to electric automobiles, motivated by a single decision criterion for consumers based on environmental awareness.
The transition scenario definition has not been defined a priori but has emerged from systemic modeling and its corresponding bifurcation analysis.
Due to the bifurcation analysis, it can be assured that the trend behaviors for the configuration and assumptions made to the system are completely bounded to the four families of transitions listed in this work. In this way, specific recommendations for the four transition families can be generated rather than general ones that end up ignoring the complexities of each of the configurations.
Promoting environmental awareness and disseminating the environmental benefits of electric vehicles can contribute to the growth of the fleet, increasing its popularity among a segment of buyers whose decision criterion is protecting the environment. For this popularity not to diminish, it is necessary to establish actions and programs that allow the creation of a relevant value chain for the waste generated by the use of EVs, such as lithium or nickel. This will allow the reduction in mining exploitation. These are public policy actions that could promote the exit of the circulation of conventional technologies and contribute to the circular economy commitments of the countries.
On the other hand, if the two technologies are not of interest to users, it is relevant to strengthen public transport and active mobility in populated centers, guaranteeing road infrastructure, safety, quality, and equitable access. This will imply the development of public policies and government investments.
Finally, the energy transition of the transport sector is a priority step in the decarbonization of anthropogenic activities to tackle climate change. However, this work shows that there are still many challenges for reducing or eliminating the impacts that energy systems have on nature. This raises questions about energy sources, the materials used, processes’ efficiency, etc. In this way, this work reinforces the evidence that the present energy solutions are short-term and present a challenge to physicists and engineers to propose solutions that satisfy long-term multidimensional needs.

Author Contributions

Conceptualization, J.S.G., J.D.M., J.M.R. and M.B.-F.; methodology, J.M.R. and J.D.M.; investigation, J.S.G. and M.B.-F.; validation, J.M.R. and J.D.M.; formal analysis, J.M.R. and J.D.M.; writing—original draft preparation, J.S.G., J.D.M. and J.M.R.; writing—review and editing, J.S.G., J.D.M. and J.M.R.; visualization, J.D.M. and J.M.R.; project administration, J.S.G.; funding acquisition, J.D.M. All authors have read and agreed to the published version of the manuscript.

Funding

This research was funded by Universidad de Monterrey and Universidad Católica de Colombia under the project CON0000497 “Dynamic model for renewable energy supply in Colombia”.

Institutional Review Board Statement

Not applicable.

Informed Consent Statement

Not applicable.

Data Availability Statement

Not applicable.

Acknowledgments

The authors want to acknowledge Universidad de Monterrey and Universidad Católica de Colombia for their support of this research work.

Conflicts of Interest

The authors declare no conflict of interest.

References

  1. Rhodes, C.J. The 2015 Paris Climate Change Conference: COP21. Sci. Prog. 2016, 99, 97–104. [Google Scholar] [CrossRef]
  2. Guan, D.; Meng, J.; Reiner, D.M.; Zhang, N.; Shan, Y.; Mi, Z.; Shao, S.; Liu, Z.; Zhang, Q.; Davis, S.J. Structural decline in China’s CO2 emissions through transitions in industry and energy systems. Nat. Geosci. 2018, 11, 551–555. [Google Scholar] [CrossRef]
  3. Zeng, S.; Li, G.; Wu, S.; Dong, Z. The Impact of Green Technology Innovation on Carbon Emissions in the Context of Carbon Neutrality in China: Evidence from Spatial Spillover and Nonlinear Effect Analysis. Int. J. Environ. Res. Public Health 2022, 19, 730. [Google Scholar] [CrossRef]
  4. Goodwin, P.; Katavouta, A.; Roussenov, V.M.; Foster, G.L.; Rohling, E.J.; Williams, R.G. Pathways to 1.5 C and 2 C warming based on observational and geological constraints. Nat. Geosci. 2018, 11, 102–107. [Google Scholar] [CrossRef]
  5. The Intergovernmental Panel on Climate Change. Mitigation of climate change. In Contribution of Working Group III to the Fifth Assessment Report of the Intergovernmental Panel on Climate Change; Cambridge University Press: Cambridge, UK, 2014; Volume 1454, p. 147. [Google Scholar]
  6. Winkler, H.; Boyd, A.; Torres Gunfaus, M.; Raubenheimer, S. Reconsidering development by reflecting on climate change. Int. Environ. Agreem. Politics Law Econ. 2015, 15, 369–385. [Google Scholar] [CrossRef]
  7. Agency, I.E. Global Energy Review 2021; International Energy Agency: Paris, France, 2021. [Google Scholar]
  8. Agency, I.E. World Energy Outlook 2020; International Energy Agency: Paris, France, 2020. [Google Scholar]
  9. Gil-García, I.C.; García-Cascales, M.S.; Dagher, H.; Molina-García, A. Electric vehicle and renewable energy sources: Motor fusion in the energy transition from a multi-indicator perspective. Sustainability 2021, 13, 3430. [Google Scholar] [CrossRef]
  10. Agency, I.E. Global EV Outlook 2020; International Energy Agency: Paris, France, 2020. [Google Scholar]
  11. Masson-Delmotte, V.; Zhai, P.; Pirani, A.; Connors, S.; Péan, C.; Berger, S.; Caud, N.; Chen, Y.; Goldfarb, L.; Gomis, M.; et al. Climate Change 2021: The Physical Science Basis. In Contribution of Working Group I to the Sixth Assessment Report of the Intergovernmental Panel on Climate Change; Cambridge University Press: Cambridge, UK, 2021. [Google Scholar]
  12. Nimesh, V.; Kumari, R.; Soni, N.; Goswami, A.K.; Mahendra Reddy, V. Implication viability assessment of electric vehicles for different regions: An approach of life cycle assessment considering exergy analysis and battery degradation. Energy Convers. Manag. 2021, 237, 114104. [Google Scholar] [CrossRef]
  13. Zeng, D.; Dong, Y.; Cao, H.; Li, Y.; Wang, J.; Li, Z.; Hauschild, M.Z. Are the electric vehicles more sustainable than the conventional ones? Influences of the assumptions and modeling approaches in the case of typical cars in China. Resour. Conserv. Recycl. 2021, 167, 105210. [Google Scholar] [CrossRef]
  14. Sengupta, S.; Cohan, D.S. Fuel cycle emissions and life cycle costs of alternative fuel vehicle policy options for the City of Houston municipal fleet. Transp. Res. Part Transp. Environ. 2017, 54, 160–171. [Google Scholar] [CrossRef] [Green Version]
  15. Bauer, G. The impact of battery electric vehicles on vehicle purchase and driving behavior in Norway. Transp. Res. Part Transp. Environ. 2018, 58, 239–258. [Google Scholar] [CrossRef]
  16. Bakker, S.; Dematera Contreras, K.; Kappiantari, M.; Tuan, N.A.; Guillen, M.D.; Gunthawong, G.; Zuidgeest, M.; Liefferink, D.; Van Maarseveen, M. Low-carbon transport policy in four ASEAN countries: Developments in Indonesia, the Philippines, Thailand and Vietnam. Sustainability 2017, 9, 1217. [Google Scholar] [CrossRef] [Green Version]
  17. Bergman, N.; Schwanen, T.; Sovacool, B.K. Imagined people, behaviour and future mobility: Insights from visions of electric vehicles and car clubs in the United Kingdom. Transp. Policy 2017, 59, 165–173. [Google Scholar] [CrossRef]
  18. Sovacool, B.K.; Kester, J.; Noel, L.; de Rubens, G.Z. Are electric vehicles masculinized? Gender, identity, and environmental values in Nordic transport practices and vehicle-to-grid (V2G) preferences. Transp. Res. Part Transp. Environ. 2019, 72, 187–202. [Google Scholar] [CrossRef]
  19. Agency, I.E. Electric Cars Fend off Supply Challenges to more than Double Global Sales; International Energy Agency: Paris, France, 2022. [Google Scholar]
  20. Ke, W.; Zhang, S.; He, X.; Wu, Y.; Hao, J. Well-to-wheels energy consumption and emissions of electric vehicles: Mid-term implications from real-world features and air pollution control progress. Appl. Energy 2017, 188, 367–377. [Google Scholar] [CrossRef]
  21. Gopal, A.R.; Park, W.Y.; Witt, M.; Phadke, A. Hybrid- and battery-electric vehicles offer low-cost climate benefits in China. Transp. Res. Part Transp. Environ. 2018, 62, 362–371. [Google Scholar] [CrossRef]
  22. Duan, H.; Hu, M.; Zuo, J.; Zhu, J.; Mao, R.; Huang, Q. Assessing the carbon footprint of the transport sector in mega cities via streamlined life cycle assessment: A case study of Shenzhen, South China. Int. J. Life Cycle Assess. 2017, 22, 683–693. [Google Scholar] [CrossRef]
  23. Liao, F.; Molin, E.; van Wee, B. Consumer preferences for electric vehicles: A literature review. Transp. Rev. 2017, 37, 252–275. [Google Scholar] [CrossRef] [Green Version]
  24. Simsek, Y.; Sahin, H.; Lorca, Á.; Santika, W.G.; Urmee, T.; Escobar, R. Comparison of energy scenario alternatives for Chile: Towards low-carbon energy transition by 2030. Energy 2020, 206, 118021. [Google Scholar] [CrossRef]
  25. Bauer, C.; Hofer, J.; Althaus, H.J.; Del Duce, A.; Simons, A. The environmental performance of current and future passenger vehicles: Life cycle assessment based on a novel scenario analysis framework. Appl. Energy 2015, 157, 871–883. [Google Scholar] [CrossRef]
  26. Onn, C.C.; Mohd, N.S.; Yuen, C.W.; Loo, S.C.; Koting, S.; Abd Rashid, A.F.; Karim, M.R.; Yusoff, S. Greenhouse gas emissions associated with electric vehicle charging: The impact of electricity generation mix in a developing country. Transp. Res. Part Transp. Environ. 2018, 64, 15–22. [Google Scholar] [CrossRef]
  27. Rahman, I.; Vasant, P.M.; Singh, B.S.M.; Abdullah-Al-Wadud, M.; Adnan, N. Review of recent trends in optimization techniques for plug-in hybrid, and electric vehicle charging infrastructures. Renew. Sustain. Energy Rev. 2016, 58, 1039–1047. [Google Scholar] [CrossRef]
  28. Singh, R.; Kumar, A.; Singh, A.R.; Naidoo, R.; Bansal, R.C.; Kumar, P. Environmental feasibility of incorporation of electric taxis in South Africa. J. Eng. 2019, 2019, 5078–5084. [Google Scholar] [CrossRef]
  29. Taljegard, M.; Göransson, L.; Odenberger, M.; Johnsson, F. Impacts of electric vehicles on the electricity generation portfolio–A Scandinavian-German case study. Appl. Energy 2019, 235, 1637–1650. [Google Scholar] [CrossRef]
  30. Doucette, R.T.; McCulloch, M.D. Modeling the prospects of plug-in hybrid electric vehicles to reduce CO2 emissions. Appl. Energy 2011, 88, 2315–2323. [Google Scholar] [CrossRef]
  31. Jochem, P.; Babrowski, S.; Fichtner, W. Assessing CO2 emissions of electric vehicles in Germany in 2030. Transp. Res. Part Policy Pract. 2015, 78, 68–83. [Google Scholar] [CrossRef] [Green Version]
  32. Asghari, M.; MirzapourAl-e hashem, S.M.J. New Advances in Vehicle Routing Problems: A Literature Review to Explore the Future. In Green Transportation and New Advances in Vehicle Routing Problems; Springer Nature: Berlin, Germany, 2020; pp. 1–42. [Google Scholar] [CrossRef]
  33. Hao, H.; Cheng, X.; Liu, Z.; Zhao, F. Electric vehicles for greenhouse gas reduction in China: A cost-effectiveness analysis. Transp. Res. Part Transp. Environ. 2017, 56, 68–84. [Google Scholar] [CrossRef]
  34. Liu, X.; Sun, X.; Zheng, H.; Huang, D. Do policy incentives drive electric vehicle adoption? Evidence from China. Transp. Res. Part Policy Pract. 2021, 150, 49–62. [Google Scholar] [CrossRef]
  35. Fishman, T.; Myers, R.J.; Rios, O.; Graedel, T. Implications of emerging vehicle technologies on rare earth supply and demand in the United States. Resources 2018, 7, 9. [Google Scholar] [CrossRef] [Green Version]
  36. Greim, P.; Solomon, A.; Breyer, C. Assessment of lithium criticality in the global energy transition and addressing policy gaps in transportation. Nat. Commun. 2020, 11, 4570. [Google Scholar] [CrossRef]
  37. Christensen, P.A.; Anderson, P.A.; Harper, G.D.; Lambert, S.M.; Mrozik, W.; Rajaeifar, M.A.; Wise, M.S.; Heidrich, O. Risk management over the life cycle of lithium-ion batteries in electric vehicles. Renew. Sustain. Energy Rev. 2021, 148, 111240. [Google Scholar] [CrossRef]
  38. Kieckhäfer, K.; Wachter, K.; Spengler, T.S. Analyzing manufacturers’ impact on green products’ market diffusion—The case of electric vehicles. J. Clean. Prod. 2017, 162, S11–S25. [Google Scholar] [CrossRef]
  39. Onat, N.C.; Kucukvar, M.; Tatari, O.; Egilmez, G. Integration of system dynamics approach toward deepening and broadening the life cycle sustainability assessment framework: A case for electric vehicles. Int. J. Life Cycle Assess. 2016, 21, 1009–1034. [Google Scholar] [CrossRef]
  40. Oshiro, K.; Masui, T. Diffusion of low emission vehicles and their impact on CO2 emission reduction in Japan. Energy Policy 2015, 81, 215–225. [Google Scholar] [CrossRef]
  41. Zhou, X.; Kuosmanen, T. What drives decarbonization of new passenger cars? Eur. J. Oper. Res. 2020, 284, 1043–1057. [Google Scholar] [CrossRef]
  42. Zeng, S.; Nan, X.; Liu, C.; Chen, J. The response of the Beijing carbon emissions allowance price (BJC) to macroeconomic and energy price indices. Energy Policy 2017, 106, 111–121. [Google Scholar] [CrossRef]
  43. Zeng, S.; Jia, J.; Su, B.; Jiang, C.; Zeng, G. The volatility spillover effect of the European Union (EU) carbon financial market. J. Clean. Prod. 2021, 282, 124394. [Google Scholar] [CrossRef]
  44. Shafiei, E.; Davidsdottir, B.; Leaver, J.; Stefansson, H.; Asgeirsson, E.I. Comparative analysis of hydrogen, biofuels and electricity transitional pathways to sustainable transport in a renewable-based energy system. Energy 2015, 83, 614–627. [Google Scholar] [CrossRef]
  45. Jochem, P.; Gómez Vilchez, J.J.; Ensslen, A.; Schäuble, J.; Fichtner, W. Methods for forecasting the market penetration of electric drivetrains in the passenger car market. Transp. Rev. 2018, 38, 322–348. [Google Scholar] [CrossRef] [Green Version]
  46. García-Olivares, A.; Solé, J.; Osychenko, O. Transportation in a 100% renewable energy system. Energy Convers. Manag. 2018, 158, 266–285. [Google Scholar]
  47. Coffman, M.; Bernstein, P.; Wee, S. Electric vehicles revisited: A review of factors that affect adoption. Transp. Rev. 2017, 37, 79–93. [Google Scholar] [CrossRef]
  48. Paiho, S.; Saastamoinen, H.; Hakkarainen, E.; Similä, L.; Pasonen, R.; Ikäheimo, J.; Rämä, M.; Tuovinen, M.; Horsmanheimo, S. Increasing flexibility of Finnish energy systems—A review of potential technologies and means. Sustain. Cities Soc. 2018, 43, 509–523. [Google Scholar] [CrossRef]
  49. Mersky, A.C.; Sprei, F.; Samaras, C.; Qian, Z.S. Effectiveness of incentives on electric vehicle adoption in Norway. Transp. Res. Part Transp. Environ. 2016, 46, 56–68. [Google Scholar] [CrossRef] [Green Version]
  50. Bjerkan, K.Y.; Nørbech, T.E.; Nordtømme, M.E. Incentives for promoting battery electric vehicle (BEV) adoption in Norway. Transp. Res. Part Transp. Environ. 2016, 43, 169–180. [Google Scholar] [CrossRef] [Green Version]
  51. Kester, J.; Noel, L.; de Rubens, G.Z.; Sovacool, B.K. Promoting Vehicle to Grid (V2G) in the Nordic region: Expert advice on policy mechanisms for accelerated diffusion. Energy Policy 2018, 116, 422–432. [Google Scholar] [CrossRef]
  52. Lin, X.; Sovacool, B.K. Inter-niche competition on ice? Socio-technical drivers, benefits and barriers of the electric vehicle transition in Iceland. Environ. Innov. Soc. Transit. 2020, 35, 1–20. [Google Scholar] [CrossRef]
  53. Dhar, S.; Pathak, M.; Shukla, P.R. Electric vehicles and India’s low carbon passenger transport: A long-term co-benefits assessment. J. Clean. Prod. 2017, 146, 139–148. [Google Scholar] [CrossRef] [Green Version]
  54. Morcillo, J.D.; Franco, C.J.; Angulo, F. Simulation of demand growth scenarios in the Colombian electricity market: An integration of system dynamics and dynamic systems. Appl. Energy 2018, 216, 504–520. [Google Scholar] [CrossRef]
  55. Morcillo, J.D.; Angulo, F.; Franco, C.J. Simulation and Analysis of Renewable and Nonrenewable Capacity Scenarios under Hybrid Modeling: A Case Study. Mathematics 2021, 9, 1560. [Google Scholar] [CrossRef]
  56. Sterman, J. Business Dynamics; McGraw-Hill, Inc.: New York, NY, USA, 2000. [Google Scholar]
  57. Bektaş, T.; Laporte, G. The pollution-routing problem. Transp. Res. Part Methodol. 2011, 45, 1232–1250. [Google Scholar] [CrossRef]
  58. Watari, T.; Nansai, K.; Nakajima, K.; McLellan, B.C.; Dominish, E.; Giurco, D. Integrating circular economy strategies with low-carbon scenarios: Lithium use in electric vehicles. Environ. Sci. Technol. 2019, 53, 11657–11665. [Google Scholar] [CrossRef]
  59. Barlas, Y. Formal aspects of model validity and validation in system dynamics. Syst. Dyn. Rev. J. Syst. Dyn. Soc. 1996, 12, 183–210. [Google Scholar] [CrossRef]
  60. Kuznetsov, Y.A. Elements of Applied Bifurcation Theory; Springer: Berlin/Heidelberg, Germany, 2013; Volume 112. [Google Scholar]
  61. Wiggins, S.; Wiggins, S.; Golubitsky, M. Introduction to Applied Nonlinear Dynamical Systems and Chaos; Springer: Berlin/Heidelberg, Germany, 2003; Volume 2. [Google Scholar]
  62. Dong, X.; Zhang, B.; Wang, B.; Wang, Z. Urban households’ purchase intentions for pure electric vehicles under subsidy contexts in China: Do cost factors matter? Transp. Res. Part Policy Pract. 2020, 135, 183–197. [Google Scholar] [CrossRef]
  63. Graabak, I.; Wu, Q.; Warland, L.; Liu, Z. Optimal planning of the Nordic transmission system with 100% electric vehicle penetration of passenger cars by 2050. Energy 2016, 107, 648–660. [Google Scholar] [CrossRef]
  64. Bhuvandas, D.; Gundimeda, H. Welfare impacts of transport fuel price changes on Indian households: An application of LA-AIDS model. Energy Policy 2020, 144, 111583. [Google Scholar] [CrossRef]
  65. Kanger, L.; Geels, F.W.; Sovacool, B.; Schot, J. Technological diffusion as a process of societal embedding: Lessons from historical automobile transitions for future electric mobility. Transp. Res. Part Transp. Environ. 2019, 71, 47–66. [Google Scholar] [CrossRef]
  66. Redondo, J.M.; Olivar, G.; Ibarra-Vega, D.; Dyner, I. Modeling for the regional integration of electricity markets. Energy Sustain. Dev. 2018, 43, 100–113. [Google Scholar] [CrossRef]
Figure 1. Stocks and Flows diagram of the automobile technology transition from environmental drivers.
Applsci 12 04593 g001
Figure 2. Case 1 simulations. This case occurs when vehicle entry rates are higher than exit rates in both categories. In (a,b), both technologies grow; however, finally, the conventional one dominates, while in (c,d), the opposite occurs. In (e,f), both technologies decrease, but the electric one manages to recover; while in (g,h), the opposite occurs.
Applsci 12 04593 g002
Figure 3. Simulations for cases 2, 3 and 4. This figure corresponds to another case of entrance rates growth being higher than exit rates in both automobile categories. In (a,b), the scrapping of conventional automobiles is greater than the entry into the fleet (sales), while in (c,d), sales of conventional automobiles are greater than their operating output (scrap), which increases the number of automobiles in the fleet. Finally, in (e,f), the lack of interest in the two technologies can be seen, causing their disappearance.
Applsci 12 04593 g003
Figure 4. Two-dimensional bifurcation diagram varying α and β . Every color represents the system behavior for each case previously analyzed.
Applsci 12 04593 g004
Publisher’s Note: MDPI stays neutral with regard to jurisdictional claims in published maps and institutional affiliations.

