
Identification of the Critical Enablers for Perishable Food Supply Chain Using Deterministic Assessment Models

 ,
,  ,
,  and
and 
Abstract
:1. Introduction
- Identifying the important enablers in the perishable food supply chain;
- Finding the interrelationships among enablers, hierarchies of each enabler, and most driving and dependency enablers in PFSC;
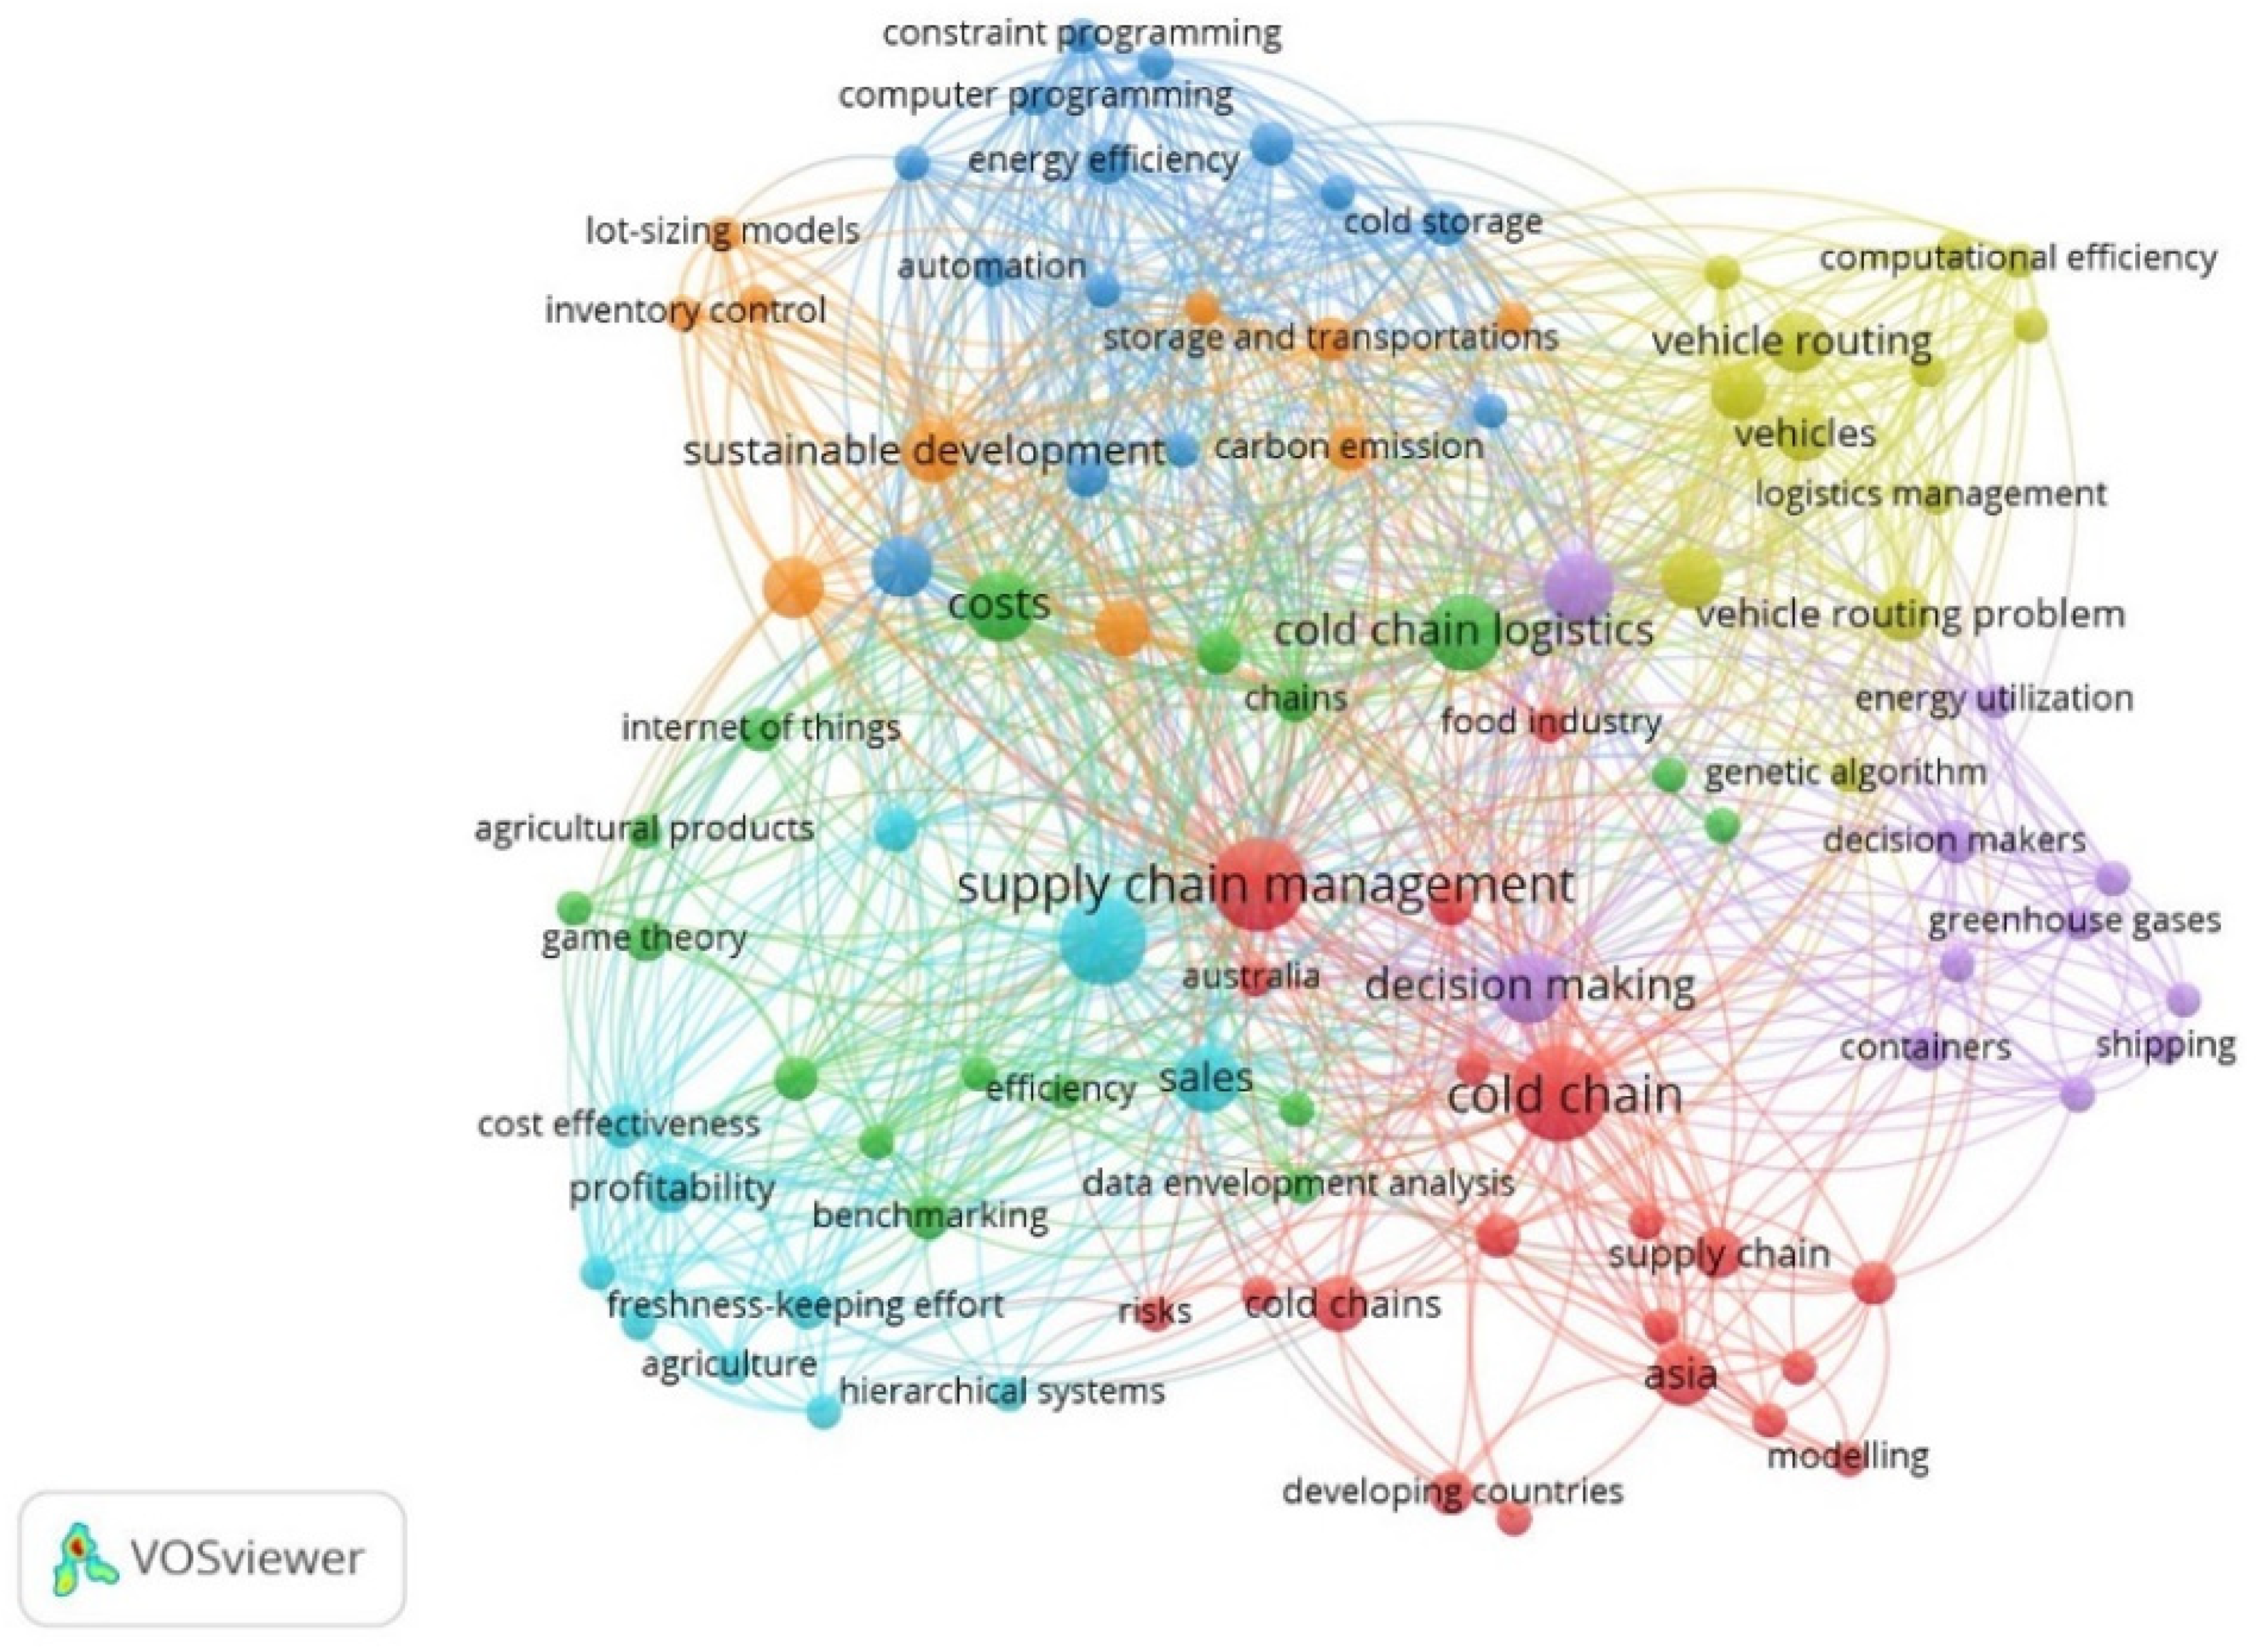
2. Literature Review
2.1. Identification of PFSC Enablers
2.1.1. Perishable Supply Chain Related to RFID and IoT Technologies (Digitalization)
2.1.2. Perishable Supply Chain Related to Shelf Life, Cold Storage, Inventory Control, and Decision Making (Inventory)
2.1.3. Perishable Supply Chain Related to Third Party Logistics (3PL), Vehicle Routing, Unit Capacity, Fuel Consumptions, Cost–Benefit Analysis, and Freshness Keeping (Transportation)
2.1.4. Perishable Food Supply Chain Related to Global Warming, Carbon Emissions, and Energy Utilization (Sustainability)
2.2. Literature Review for TISM–MICMAC Approach
2.3. Summary of the Literature
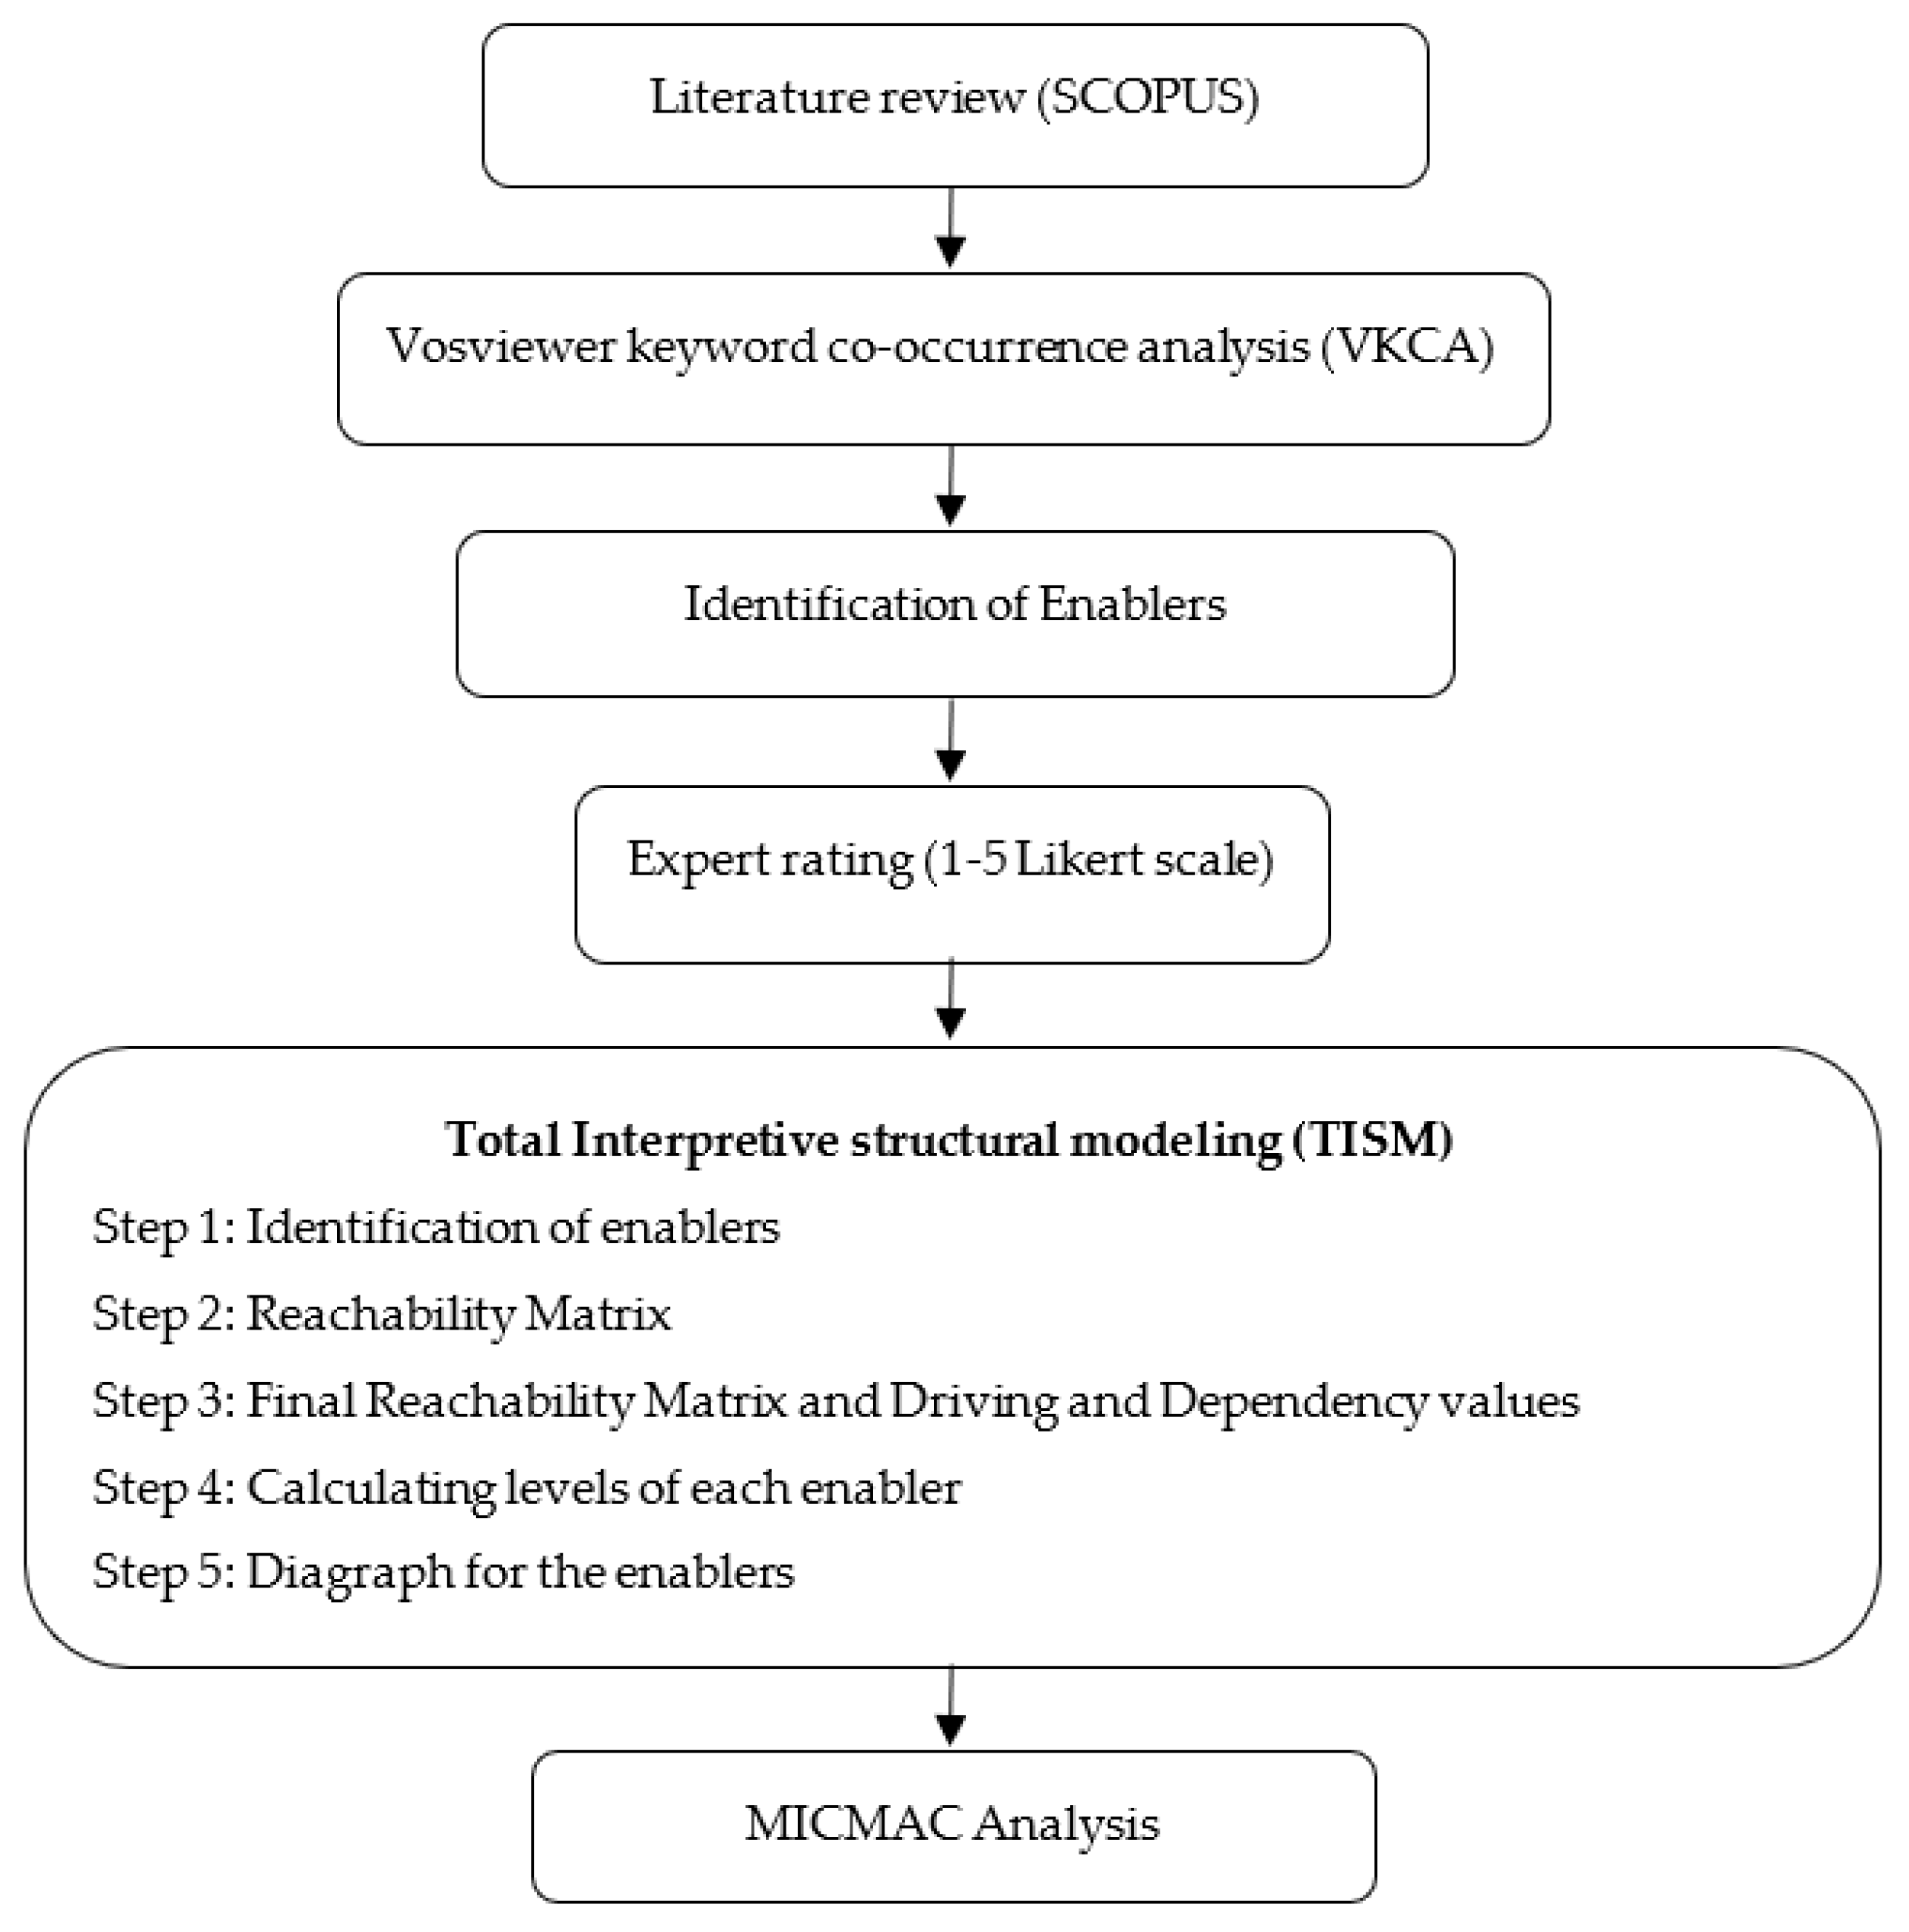
3. Methodology
3.1. Total Interpretative Structural Modeling (TISM)
3.1.1. Step 1: Identification of Enablers
3.1.2. Step 2: Initial Reachability Matrix (Representation of Enablers in Matrix Form)
3.1.3. Step 3: Final Reachability Matrix and Driving (DR) and Dependence (DC) Values
3.1.4. Step 4: Levels of Each Enabler (Hierarchy)
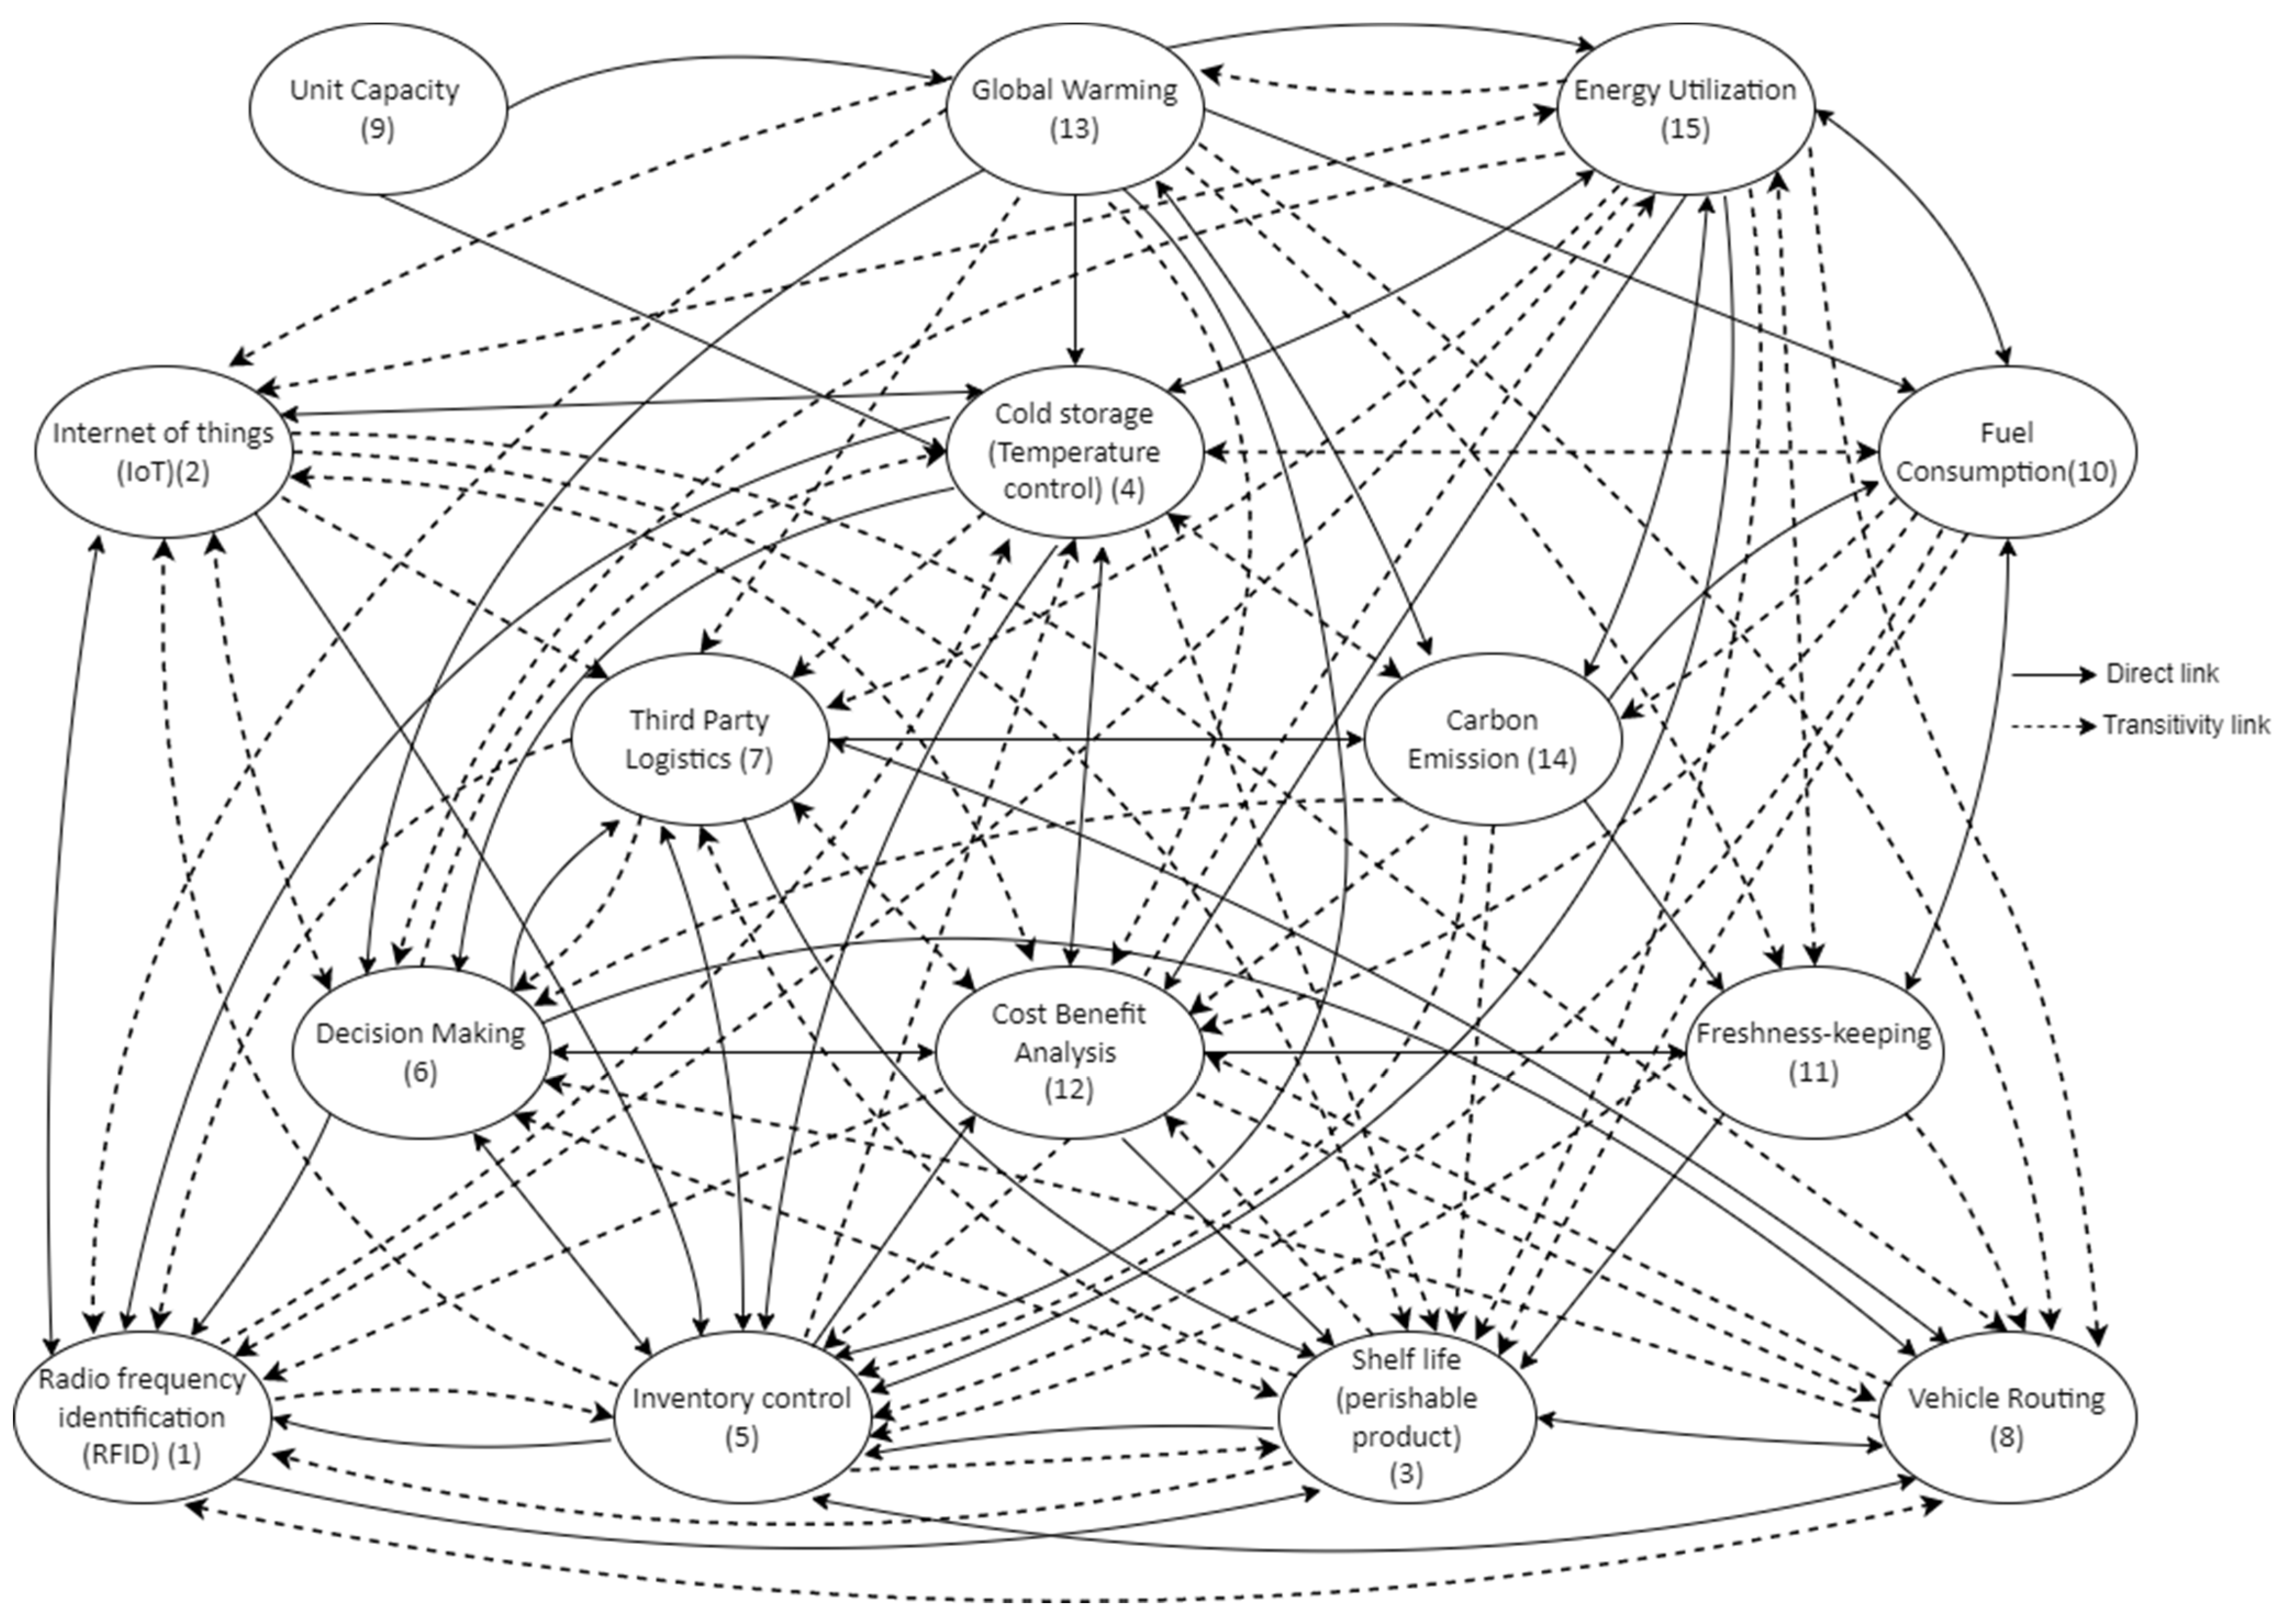
3.1.5. Step 5: Diagraph for the Enablers
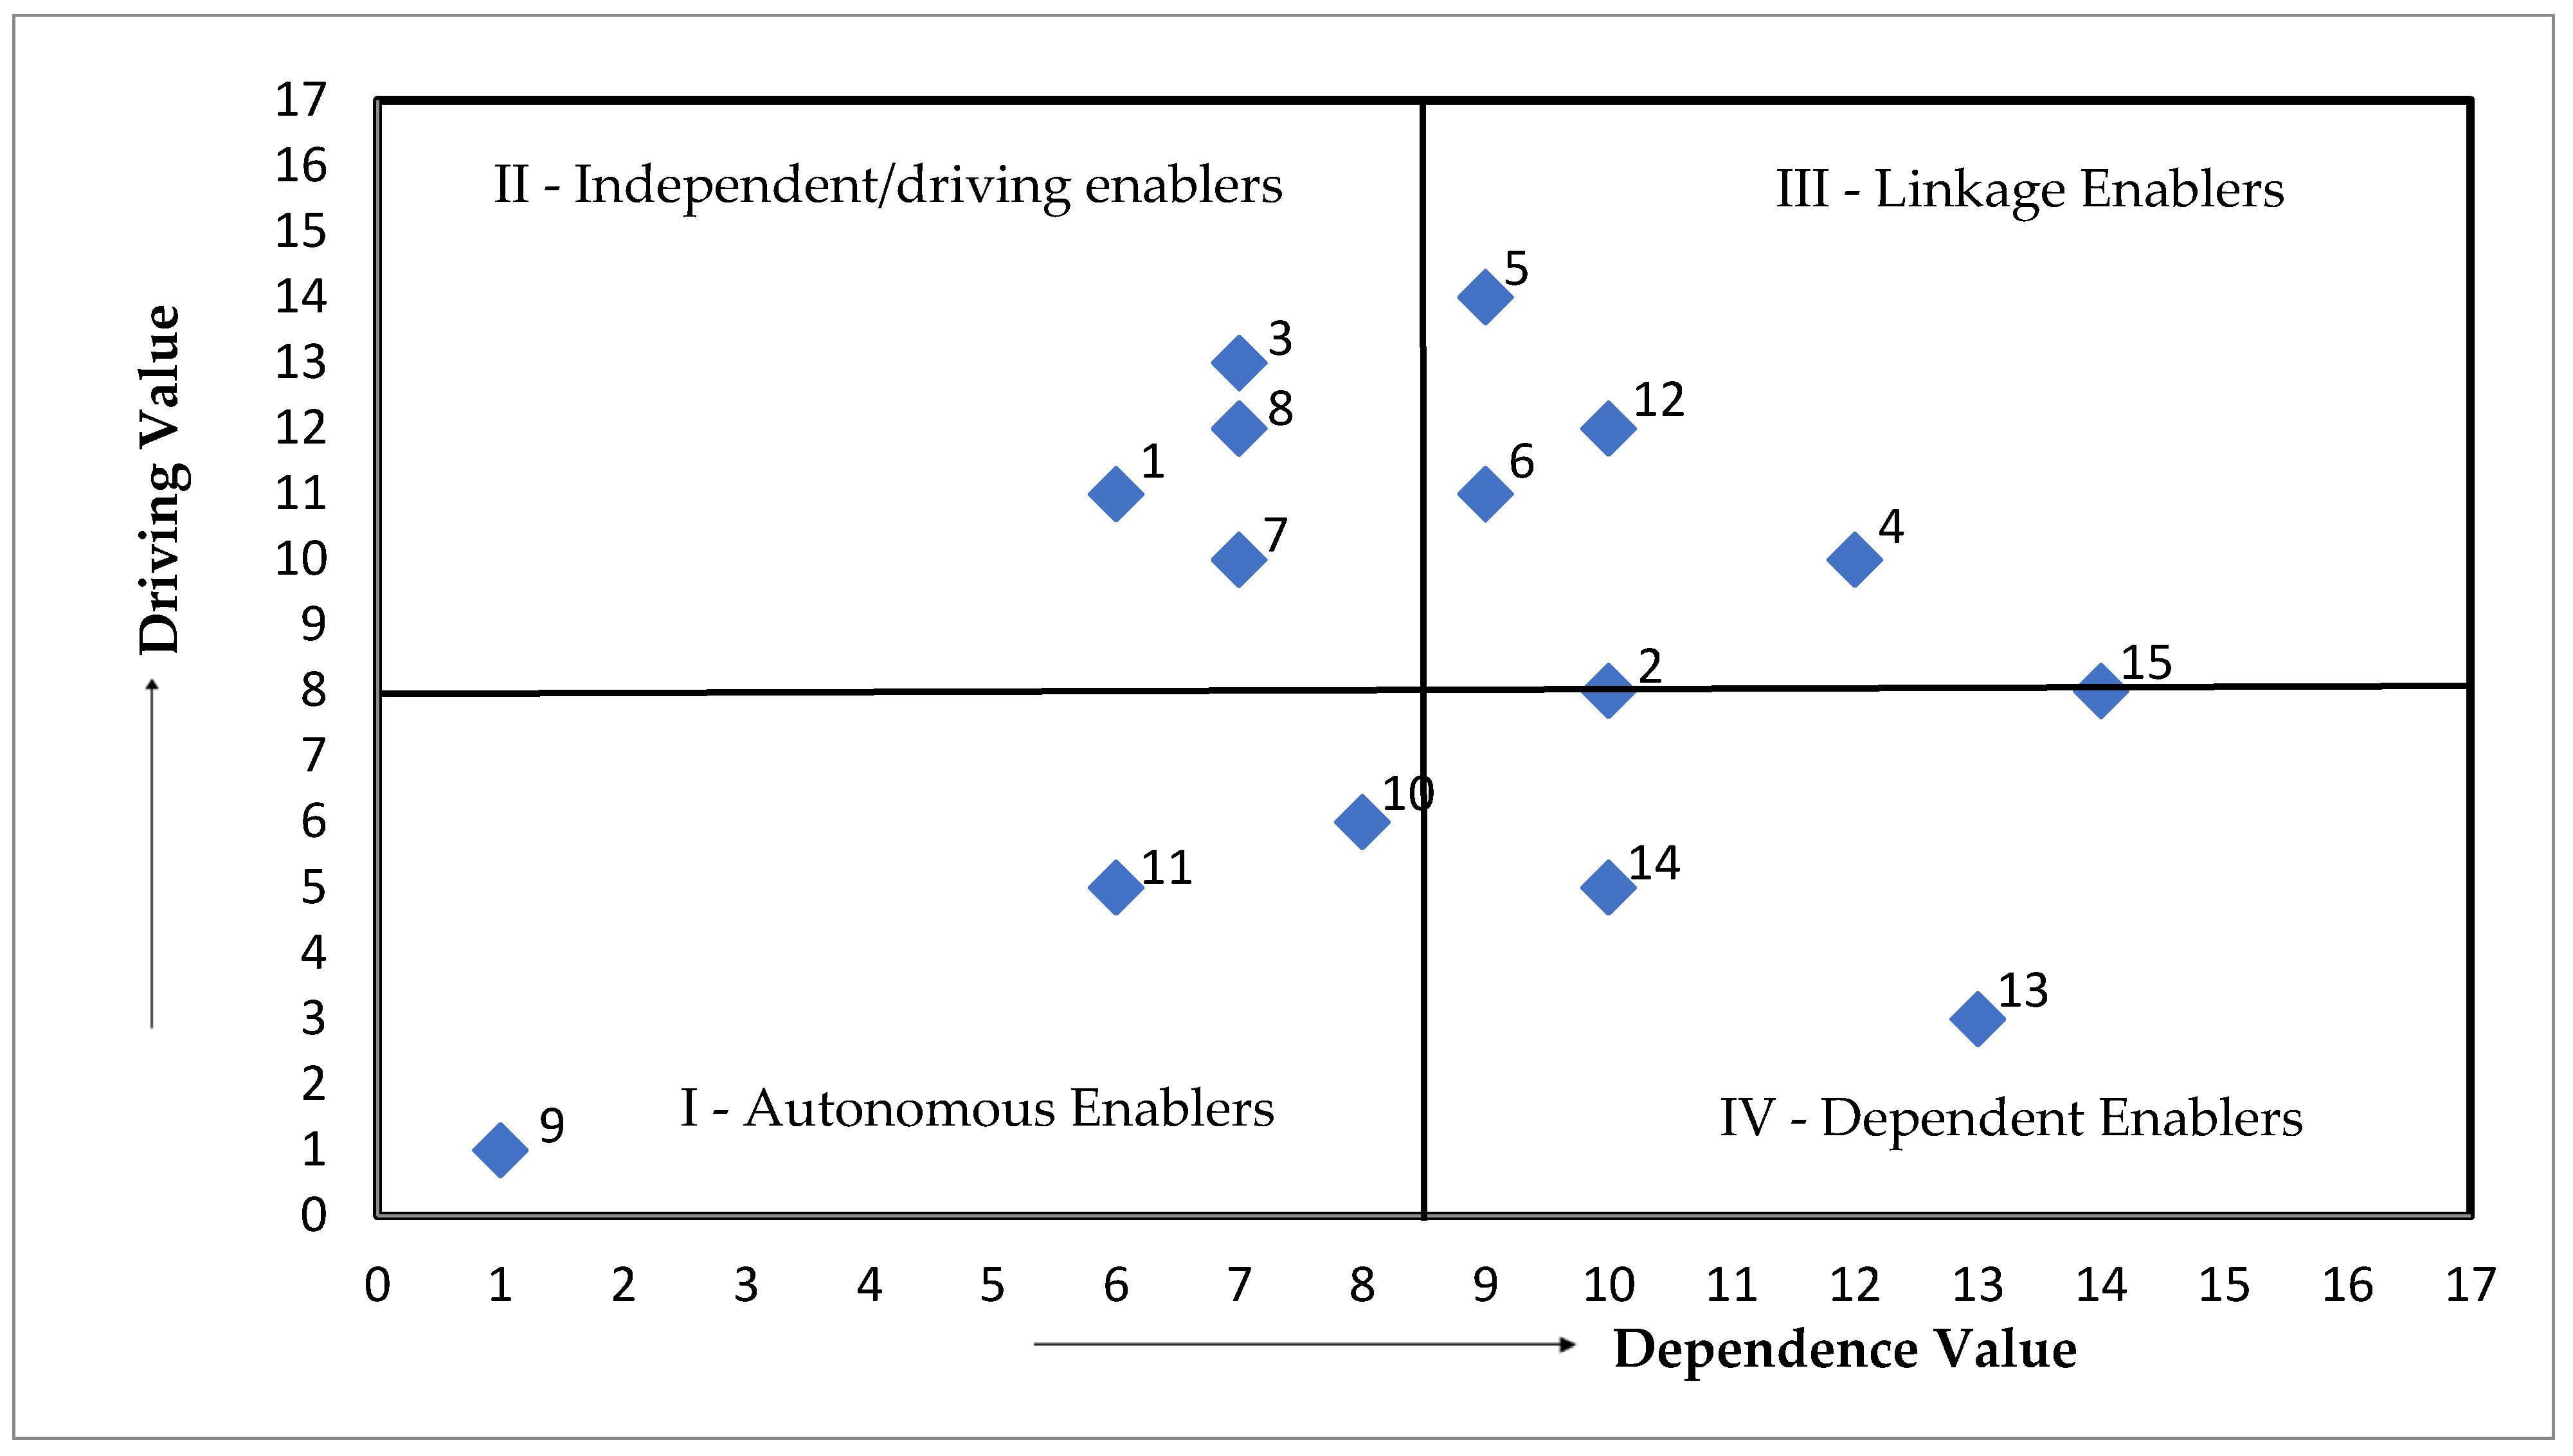
4. MICMAC Analysis for Enabler’s Classification
- Autonomous enablers: These enablers are represented in the first quadrant (bottom left corner). These enablers have low driving and dependence values since they do not have enough relationships with others.
- Driving enablers: These are also called independent enablers. Represented in the second quadrant (top left corner), they have a high driving value and low dependency values. Therefore, they are categorized as the most influential enablers of the PFSC.
- Linkage enablers: These enablers are represented in the third quadrant (top right corner) and have high driving and dependency values. Linkage enablers have a lot of command over the PFSC, but they also rely on other factors.
- Dependent enablers: These enablers are in the fourth quadrant (bottom right corner) and have high dependency and low driving values since other enablers affect them.
5. Findings and Discussion
- Radiofrequency identification (RFID): RFID is seen in level V of the TISM hierarchy. From MICMAC analysis, this enabler is considered one among the most driving ones and falls under the second quadrant due to its high driving and low dependency values. RFID was most significant for food quality, freshness-keeping, and maintaining the delivery times based on environmental conditions [2]. Perishable food products deteriorate due to temperature fluctuations during transportation. Hence, RFID is helpful to monitor temperature settings [10].
- Internet of things (IoT): An IoT enabler has been in level II of the TISM hierarchy, and from MICMAC analysis, it is a type 3 linkage enabler. These enablers are unique in that any action taken against them will influence other enablers. IoT is a smart device technology that has been helpful in finding the ambient conditions of PFSC, such as temperature and humidity [11].
- Shelf life: Shelf life lies in level V of the TISM hierarchy, and as shown by MICMAC analysis, this enabler is considered one of the most driving enablers. Due to its high driving and low dependency values, it falls in the second quadrant. The shelf life and quality of the perishable product are based on deterioration. Hence, perishable products must be delivered to the target before shelf life expiry [8,16,17].
- Cold storage: Cold storage is present in the fourth level of the TISM hierarchy and is a type three linkage enabler according to MICMAC analysis. Vehicles’ cold storage plays a significant role in maintaining the freshness and reducing the deterioration of perishable products [36]. Cold storage affects the product’s shelf life, which in turn affects other enablers of PFSC.
- Inventory control: Inventory control belongs to level I of the TISM hierarchy, and according to MICMAC analysis, it is classified as a linkage enabler due to its dependency and driving value. Inventory must be maintained based on the demand for the product. Since these products have a shorter shelf life, there are high chances of product spoilage and losses, leading to a situation where consumer demand may not be fulfilled [47].
- Decision making: The decision-making enabler is in level four of the TISM hierarchy, in the upper half of the graph. Various parameters must be considered for making decisions related to the PFSC. For example, the temperature of the trucks is significantly dependent on the route length and the number of stops. Hence, the arrival and waiting time of the vehicle need to be considered to decide the route [33].
- Third-party logistics: Third-party logistics are seen in level three of the TISM hierarchy; this enabler falls under the second quadrant because of its high driving value and low dependency value in MICMAC analysis. Third-party distribution firms deliver temperature-sensitive food products to different retailers within time-window constraints without affecting food quality. Thus, this problem was modeled with node and arc time window as a VRP and was solved using GA [1].
- Vehicle routing: In the TISM hierarchy, vehicle routing belongs to level V and is considered one of the most driving enablers, falling under the second quadrant. An artificial fish swarm algorithm was proposed to solve the VRP by considering constraints such as dispatching time, type of vehicle, energy consumption, and vehicle capacity [37]. Effective vehicle routing results in the minimization of cost and emissions.
- Fuel consumption: TISM hierarchy level II accommodates this enabler. According to MICMAC analysis, it is an autonomous type because it is in Quadrant I. The main objective of vehicle routing is to optimize the total logistic cost, which includes the fuel consumption cost. This objective can be achieved using a multi-objective evolutionary algorithm [28]. Being temperature-dependent, perishable products require extra fuel to maintain their quality. Hence, identifying the path that uses less fuel for refrigeration and traction should also be considered an objective [23,35].
- Cost–benefit analysis: This is classified as a linkage enabler because if its high dependency and driving value, and it lies in quadrant III of the MICMAC analysis and the second level of TISM hierarchy. During the inbound and outbound logistics of cross-docking, it is needed to minimize the operational and transportation cost for cost–benefit analysis [48]. All the enablers affect cost directly or indirectly.
- Freshness-keeping: Freshness-keeping lies in level four of the TISM hierarchy, which falls under quadrant I and is considered an autonomous type. Its significance in perishable products is due to shelf life deterioration during transportation. The freshness of the product must be maintained throughout the SC, which directly relates to the selling price of the product and the related wastage. [24,27].
- Global warming: Global warming is seen in level I of the TISM hierarchy. This enabler is one of the most dependent enablers and falls under the fourth quadrant due to its high dependency and low driving values. Perishable products require refrigeration in SC during transportation to reduce product waste. Greenhouse gas emissions occur throughout, due to refrigeration gas leakage and high energy consumption. Thus, a mixed-integer problem has been developed to reduce global warming and total costs [38].
- Carbon emission: Lying in level III of the TISM hierarchy, carbon emissions are one of the most dependent enablers, falling in the fourth quadrant. Apart from the total cost, optimizing the carbon emissions in SC is challenging. Such a problem was solved using a multi-objective evolutionary algorithm [28].
- Energy utilization: Energy utilization is in level I of the TISM hierarchy and falls under quadrant III. The enabler is considered a linkage enabler according to MICMAC analysis. Refrigeration in transportation causes high energy utilization in PFSC, resulting in high carbon emissions [33].
6. Implications
7. Conclusions
Author Contributions
Funding
Conflicts of Interest
References
- Zhang, Y.; Hua, G.; Cheng, T.C.E.; Zhang, J. Cold chain distribution: How to deal with node and arc time windows? Ann. Oper. Res. 2020, 291, 1127–1151. [Google Scholar] [CrossRef]
- Kim, K.; Kim, H.; Kim, S.-K.; Jung, J.-Y. i-RM: An intelligent risk management framework for context-aware ubiquitous cold chain logistics. Expert Syst. Appl. 2016, 46, 463–473. [Google Scholar] [CrossRef]
- Wang, G.; Ding, P.; Chen, H.; Mu, J. Green fresh product cost sharing contracts considering freshness-keeping effort. Soft Comput. 2020, 24, 2671–2691. [Google Scholar] [CrossRef]
- Poonia, A.; Sindhu, S.; Arya, V.; Panghal, A. Analysis of drivers for anti-food waste behavior—TISM and MICMAC approach. J. Indian Bus. Res. 2021, 1755–4195. [Google Scholar] [CrossRef]
- Dhir, S.; Dhir, S. Modeling of strategic thinking enablers: A modified total interpretive structural modeling (TISM) and MICMAC approach. Int. J. Syst. Assur. Eng. Manag. 2020, 11, 175–188. [Google Scholar] [CrossRef]
- Verdouw, C.N.; Wolfert, J.; Beulens, A.J.M.; Rialland, A. Virtualization of food supply chains with the internet of things. J. Food Eng. 2016, 176, 128–136. [Google Scholar] [CrossRef] [Green Version]
- Taoukis, P.S.; Gogou, E.; Tsironi, T.; Giannoglou, M.; Dermesonlouoglou, E.; Katsaros, G. Food cold chain management and optimization. In Emerging and Traditional Technologies for Safe, Healthy and Quality Food; Springer: Cham, Switzerland, 2016; pp. 285–309. [Google Scholar]
- Ali, I.; Gölgeci, I. Where is supply chain resilience research heading? A systematic and co-occurrence analysis. Int. J. Phys. Distrib. Logist. Manag. 2019, 49, 793–815. [Google Scholar] [CrossRef]
- Chen, M.-C.; Lu, C.-C.; Liu, Y.-C. Optimal consolidation of fresh agricultural products in a multi-temperature joint distribution system. Int. J. Logist. Manag. 2018, 29, 887–901. [Google Scholar] [CrossRef]
- Peña, J.D.; Bas, O.; Maldonado, N.R. Impact of Bullwhip Effect in Quality and Waste in Perishable Supply Chain. Processes 2021, 9, 1232. [Google Scholar] [CrossRef]
- Laniel, M.; Émond, J.-P.; Altunbas, A.E. Effects of antenna position on readability of RFID tags in a refrigerated sea container of frozen bread at 433 and 915MHz. Transp. Res. Part C Emerg. Technol. 2011, 19, 1071–1077. [Google Scholar] [CrossRef]
- Bogataj, D.; Bogataj, M.; Hudoklin, D. Reprint of “Mitigating risks of perishable products in the cyber-physical systems based on the extended MRP model”. Int. J. Prod. Econ. 2017, 194, 113–125. [Google Scholar] [CrossRef]
- Sun, L.; Zhao, Y.; Sun, W.; Liu, Z. Study on supply chain strategy based on cost income model and multi-access edge computing under the background of the Internet of Things. Neural Comput. Appl. 2020, 32, 15357–15368. [Google Scholar] [CrossRef]
- Sunny, J.; Undralla, N.; Pillai, V.M. Supply chain transparency through blockchain-based traceability: An overview with demonstration. Comput. Ind. Eng. 2020, 150, 106895. [Google Scholar] [CrossRef]
- Rasool, F.; Greco, M.; Grimaldi, M. Digital supply chain performance metrics: A literature review. Meas. Bus. Excel. 2021, 26, 23–38. [Google Scholar] [CrossRef]
- Yevu, S.K.; Yu, A.T.; Darko, A. Digitalization of construction supply chain and procurement in the built environment: Emerging technologies and opportunities for sustainable processes. J. Clean. Prod. 2021, 322, 129093. [Google Scholar] [CrossRef]
- Singh, A.K.; Subramanian, N.; Pawar, K.S.; Bai, R. Cold chain configuration design: Location-allocation decision-making using coordination, value deterioration, and big data approximation. Ann. Oper. Res. 2018, 270, 433–457. [Google Scholar] [CrossRef]
- Hsiao, Y.-H.; Chen, M.-C.; Lu, K.-Y.; Chin, C.-L. Last-mile distribution planning for fruit-and-vegetable cold chains. Int. J. Logist. Manag. 2018, 29, 862–886. [Google Scholar] [CrossRef]
- Joshi, R.; Banwet, D.; Shankar, R. A Delphi-AHP-TOPSIS based benchmarking framework for performance improvement of a cold chain. Expert Syst. Appl. 2011, 38, 10170–10182. [Google Scholar] [CrossRef]
- Aiello, G.; La Scalia, G.; Micale, R. Simulation analysis of cold chain performance based on time–temperature data. Prod. Plan. Control 2012, 23, 468–476. [Google Scholar] [CrossRef]
- Chaudhuri, A.; Dukovska-Popovska, I.; Subramanian, N.; Chan, H.K.; Bai, R. Decision-making in cold chain logistics using data analytics: A literature review. Int. J. Logist. Manag. 2018, 29, 839–861. [Google Scholar] [CrossRef] [Green Version]
- Singh, R.K.; Gunasekaran, A.; Kumar, P. Third party logistics (3PL) selection for cold chain management: A fuzzy AHP and fuzzy TOPSIS approach. Ann. Oper. Res. 2018, 267, 531–553. [Google Scholar] [CrossRef]
- Awad, M.; Ndiaye, M.; Osman, A. Vehicle routing in cold food supply chain logistics: A literature review. Int. J. Logist. Manag. 2020, 32, 592–617. [Google Scholar] [CrossRef]
- Meneghetti, A.; Ceschia, S. Energy-efficient frozen food transports: The Refrigerated Routing Problem. Int. J. Prod. Res. 2020, 58, 4164–4181. [Google Scholar] [CrossRef]
- Cai, X.; Chen, J.; Xiao, Y.; Xu, X. Optimization and coordination of fresh product supply chains with freshness-keeping effort. Prod. Oper. Manag. 2010, 19, 261–278. [Google Scholar] [CrossRef]
- Song, L.; Wu, Z. An integrated approach for optimizing location-inventory and location-inventory-routing problem for perishable products. Int. J. Transp. Sci. Technol. 2022; in press. [Google Scholar] [CrossRef]
- Ma, X.; Wang, J.; Bai, Q.; Wang, S. Optimization of a three-echelon cold chain considering freshness-keeping efforts under cap-and-trade regulation in Industry 4.0. Int. J. Prod. Econ. 2020, 220, 107457. [Google Scholar] [CrossRef]
- Leng, L.; Zhang, J.; Zhang, C.; Zhao, Y.; Wang, W.; Li, G. Decomposition-based hyperheuristic approaches for the bi-objective cold chain considering environmental effects. Comput. Oper. Res. 2020, 123, 105043. [Google Scholar] [CrossRef]
- Sepehri, A. Controllable carbon emissions in an inventory model for perishable items under trade credit policy for credit-risk customers. Carbon Capture Sci. Technol. 2021, 1, 100004. [Google Scholar] [CrossRef]
- Soysal, M.; Bloemhof-Ruwaard, J.M.; Haijema, R.; van der Vorst, J.G. Modeling a green inventory routing problem for perishable products with horizontal collaboration. Comput. Oper. Res. 2018, 89, 168–182. [Google Scholar] [CrossRef]
- Bortolini, M.; Faccio, M.; Ferrari, E.; Gamberi, M.; Pilati, F. Fresh food sustainable distribution: Cost, delivery time and carbon footprint three-objective optimization. J. Food Eng. 2016, 174, 56–67. [Google Scholar] [CrossRef]
- Solina, V.; Mirabelli, G. Integrated production-distribution scheduling with energy considerations for efficient food supply chains. Procedia Comput. Sci. 2021, 180, 797–806. [Google Scholar] [CrossRef]
- Chen, L.; Liu, Y.; Langevin, A. A multi-compartment vehicle routing problem in cold-chain distribution. Comput. Oper. Res. 2019, 111, 58–66. [Google Scholar] [CrossRef]
- Bozorgi, A.; Pazour, J.; Nazzal, D. A new inventory model for cold items that considers costs and emissions. Int. J. Prod. Econ. 2014, 155, 114–125. [Google Scholar] [CrossRef]
- Stellingwerf, H.M.; Kanellopoulos, A.; van der Vorst, J.G.; Bloemhof, J.M. Reducing CO2 emissions in temperature-controlled road transportation using the LDVRP model. Transp. Res. Part D Transp. Environ. 2018, 58, 80–93. [Google Scholar] [CrossRef]
- Saif, A.; Elhedhli, S. Cold supply chain design with environmental considerations: A simulation-optimization approach. Eur. J. Oper. Res. 2016, 251, 274–287. [Google Scholar] [CrossRef]
- Song, M.-X.; Li, J.-Q.; Han, Y.-Q.; Han, Y.-Y.; Liu, L.-L.; Sun, Q. Metaheuristics for solving the vehicle routing problem with the time windows and energy consumption in cold chain logistics. Appl. Soft Comput. 2020, 95, 106561. [Google Scholar] [CrossRef]
- Meneghetti, A.; Monti, L. Greening the food supply chain: An optimisation model for sustainable design of refrigerated automated warehouses. Int. J. Prod. Res. 2015, 53, 6567–6587. [Google Scholar] [CrossRef]
- Azadnia, A.H.; Onofrei, G.; Ghadimi, P. Electric vehicles lithium-ion batteries reverse logistics implementation barriers analysis: A TISM-MICMAC approach. Resour. Conserv. Recycl. 2021, 174, 105751. [Google Scholar] [CrossRef]
- Bathrinath, S.; Koshy, R.A.; Bhalaji, R.; Koppiahraj, K. Identification of the critical activity in heat treatment process using TISM. Mater. Today Proc. 2021, 39, 60–65. [Google Scholar] [CrossRef]
- Sindhwani, R.; Malhotra, V. A framework to enhance agile manufacturing system: A total interpretive structural modelling (TISM) approach. Benchmarking Int. J. 2017, 24, 1463–5771. [Google Scholar] [CrossRef]
- Meena, A.; Dhir, S. Sushil An analysis of growth-accelerating factors for the Indian automotive industry using modified TISM. Int. J. Prod. Perform. Manag. 2020, 70, 1361–1392. [Google Scholar] [CrossRef]
- Wei, C.; Gao, W.-W.; Hu, Z.-H.; Yin, Y.-Q.; Pan, S.-D. Assigning customer-dependent travel time limits to routes in a cold-chain inventory routing problem. Comput. Ind. Eng. 2019, 133, 275–291. [Google Scholar] [CrossRef]
- Malhotra, M.K.; Grover, V. An assessment of survey research in POM: From constructs to theory. J. Oper. Manag. 1998, 16, 407–425. [Google Scholar] [CrossRef]
- Gupta, V.; Kapur, P.K.; Kumar, D. Modelling and measuring code smells in enterprise applications using TISM and two-way assessment. Int. J. Syst. Assur. Eng. Manag. 2016, 7, 332–340. [Google Scholar] [CrossRef]
- Patil, M.; Suresh, M. Modelling the Enablers of Workforce Agility in IoT Projects: A TISM Approach. Glob. J. Flex. Syst. Manag. 2019, 20, 157–175. [Google Scholar] [CrossRef]
- Bozorgi, A. Multi-product inventory model for cold items with cost and emission consideration. Int. J. Prod. Econ. 2016, 176, 123–142. [Google Scholar] [CrossRef]
- Zheng, F.; Pang, Y.; Xu, Y.; Liu, M. Heuristic algorithms for truck scheduling of cross-docking operations in cold-chain logistics. Int. J. Prod. Res. 2021, 59, 6579–6600. [Google Scholar] [CrossRef]
- Zhu, Q.; Krikke, H. Managing a Sustainable and Resilient Perishable Food Supply Chain (PFSC) after an Outbreak. Sustainability 2020, 12, 5004. [Google Scholar] [CrossRef]

| Theme | Enablers Number | Name of the Enabler |
|---|---|---|
| Digitalization | 1 | Radiofrequency identification (RFID) |
| 2 | Internet of things (IoT) | |
| Inventory | 3 | Shelf life (SL) |
| 4 | Cold storage (CS) | |
| 5 | Inventory control (IC) | |
| 6 | Decision making (DM) | |
| Transportation | 7 | Third-party logistics (3PL) |
| 8 | Vehicle routing (VR) | |
| 9 | Unit capacity (UC) | |
| 10 | Fuel consumption (FC) | |
| 11 | Freshness keeping (FK) | |
| 12 | Cost–benefit analysis (CBA) | |
| Sustainability | 13 | Global warming (GW) |
| 14 | Carbon emission (CE) | |
| 15 | Energy utilization (EU) |
| RFID | IoT | SL | CS | IC | DM | 3PL | VR | UC | FC | FK | CBA | GW | CE | EU | |
|---|---|---|---|---|---|---|---|---|---|---|---|---|---|---|---|
| Authors/Enablers | 1 | 2 | 3 | 4 | 5 | 6 | 7 | 8 | 9 | 10 | 11 | 12 | 13 | 14 | 15 |
| Zhang et al. (2020) [1] | ✓ | ||||||||||||||
| Kim et al. (2016) [2] | ✓ | ||||||||||||||
| Wang et al. (2020) [6] | ✓ | ||||||||||||||
| Laniel et al. (2011) [11] | ✓ | ||||||||||||||
| Sun et al. (2020) [13] | ✓ | ||||||||||||||
| Sunny et al. (2020) [14] | ✓ | ||||||||||||||
| Singh et al. (2018) [17] | ✓ | ||||||||||||||
| Joshi et al. (2011) [19] | ✓ | ||||||||||||||
| Aiello et al. (2012) [20] | ✓ | ||||||||||||||
| Singh et al. (2018) [22] | ✓ | ||||||||||||||
| Ma et al. (2020) [27] | ✓ | ✓ | ✓ | ✓ | |||||||||||
| Leng et al. (2020) [28] | ✓ | ✓ | |||||||||||||
| Chen et al. (2019) [33] | ✓ | ✓ | ✓ | ||||||||||||
| Bozorgi et al. (2014) [34] | ✓ | ✓ | ✓ | ✓ | |||||||||||
| Stellingwerf et al. (2018) [35] | ✓ | ✓ | ✓ | ||||||||||||
| Wei et al. (2019) [36] | ✓ | ✓ | |||||||||||||
| Song et al. (2020) [37] | ✓ | ✓ | |||||||||||||
| Saif and Elhedhli (2016) [38] | ✓ | ✓ | |||||||||||||
| Current study | ✓ | ✓ | ✓ | ✓ | ✓ | ✓ | ✓ | ✓ | ✓ | ✓ | ✓ | ✓ | ✓ | ✓ | ✓ |
| Contributors | Problem | Method Used | Features |
|---|---|---|---|
| Amir et al. (2021) [39] | Identification of barriers to Lithium-ion batteries for electric vehicles in reverse logistics | TISM–MICMAC | Eight enablers were evaluated, and the most dominant barrier categories were found. |
| Bathrinath et al. (2021) [40] | Identifying the most important activity in the heat treatment process | TISM–MICMAC | Out of eighteen activities, three were identified as the most important activities: material handling, painting, and quenching. |
| Rahul Sindhwani et al. (2016) [41] | Identification of enablers for modeling of the agile manufacturing system | TISM–MICMAC | With TISM and MICMAC analysis, the current model analyzes the effect of enablers, mutual relationships, and the correlation between enablers. |
| Meena et al. (2020) [42] | Identification and evaluation of several growth-accelerating variables in the Indian automobile sector | TISM–MICMAC | Evaluated eight enablers for the growth of the automobile industry in India and highlighted the most important ones for the Indian automotive sector. |
| Current study | Identification of enablers and the levels of each enabler in PFSC | TISM–MICMAC | Fifteen enablers have been identified and classified in terms of the level of each enabler and type for PFSC |
| Category | Rating |
|---|---|
| Very strong | 5 |
| Strong | 4 |
| Medium | 3 |
| Weak | 2 |
| Very weak | 1 |
| Enabler Number | 1 | 2 | 3 | 4 | 5 | 6 | 7 | 8 | 9 | 10 | 11 | 12 | 13 | 14 | 15 |
|---|---|---|---|---|---|---|---|---|---|---|---|---|---|---|---|
| 1 | 1 | 1 | 0 | 1 | 1 | 1 | 0 | 0 | 0 | 0 | 0 | 0 | 0 | 0 | 0 |
| 2 | 1 | 1 | 0 | 1 | 0 | 0 | 0 | 0 | 0 | 0 | 0 | 0 | 0 | 0 | 0 |
| 3 | 1 | 0 | 1 | 0 | 0 | 0 | 1 | 1 | 0 | 0 | 1 | 1 | 0 | 0 | 0 |
| 4 | 0 | 1 | 0 | 1 | 0 | 0 | 0 | 0 | 0 | 0 | 0 | 1 | 1 | 0 | 1 |
| 5 | 0 | 1 | 1 | 1 | 1 | 1 | 1 | 1 | 0 | 0 | 0 | 0 | 1 | 0 | 1 |
| 6 | 0 | 0 | 0 | 1 | 1 | 1 | 0 | 0 | 0 | 0 | 0 | 1 | 1 | 0 | 0 |
| 7 | 0 | 0 | 0 | 0 | 1 | 1 | 1 | 1 | 0 | 0 | 0 | 0 | 0 | 0 | 0 |
| 8 | 0 | 0 | 1 | 0 | 1 | 1 | 1 | 1 | 0 | 0 | 0 | 0 | 0 | 0 | 0 |
| 9 | 0 | 0 | 0 | 0 | 0 | 0 | 0 | 0 | 1 | 0 | 0 | 0 | 0 | 0 | 0 |
| 10 | 0 | 0 | 0 | 0 | 0 | 0 | 0 | 0 | 0 | 1 | 1 | 0 | 1 | 1 | 1 |
| 11 | 0 | 0 | 0 | 0 | 0 | 0 | 0 | 0 | 0 | 1 | 1 | 0 | 0 | 1 | 0 |
| 12 | 0 | 0 | 0 | 1 | 1 | 1 | 0 | 0 | 0 | 0 | 0 | 1 | 0 | 0 | 1 |
| 13 | 0 | 0 | 0 | 0 | 0 | 0 | 0 | 0 | 0 | 0 | 0 | 0 | 1 | 1 | 0 |
| 14 | 0 | 0 | 0 | 0 | 0 | 0 | 0 | 0 | 0 | 0 | 0 | 0 | 1 | 1 | 1 |
| 15 | 0 | 0 | 0 | 1 | 0 | 0 | 0 | 0 | 0 | 1 | 0 | 0 | 1 | 1 | 1 |
| Enablers | 1 | 2 | 3 | 4 | 5 | 6 | 7 | 8 | 9 | 10 | 11 | 12 | 13 | 14 | 15 | DR |
|---|---|---|---|---|---|---|---|---|---|---|---|---|---|---|---|---|
| 1 | 1 | 1 | 1* | 1 | 1 | 1 | 1* | 1* | 0 | 0 | 0 | 1* | 1* | 0 | 1* | 11 |
| 2 | 1 | 1 | 0 | 1 | 1* | 1* | 0 | 0 | 0 | 0 | 0 | 1* | 1* | 0 | 1* | 8 |
| 3 | 1 | 1* | 1 | 1* | 1* | 1* | 1 | 1 | 0 | 1* | 1 | 1 | 0 | 1* | 1* | 13 |
| 4 | 1* | 1 | 0 | 1 | 1* | 1* | 0 | 0 | 0 | 1* | 0 | 1 | 1 | 1* | 1 | 10 |
| 5 | 1* | 1 | 1 | 1 | 1 | 1 | 1 | 1 | 0 | 1* | 1* | 1* | 1 | 1* | 1 | 14 |
| 6 | 0 | 1* | 1* | 1 | 1 | 1 | 1* | 1* | 0 | 0 | 0 | 1 | 1 | 1* | 1* | 11 |
| 7 | 0 | 1* | 1* | 1* | 1 | 1 | 1 | 1 | 0 | 0 | 0 | 1* | 1* | 0 | 1* | 10 |
| 8 | 1* | 1* | 1 | 1* | 1 | 1 | 1 | 1 | 0 | 0 | 1* | 1* | 1* | 0 | 1* | 12 |
| 9 | 0 | 0 | 0 | 0 | 0 | 0 | 0 | 0 | 1 | 0 | 0 | 0 | 0 | 0 | 0 | 1 |
| 10 | 0 | 0 | 0 | 1* | 0 | 0 | 0 | 0 | 0 | 1 | 1 | 0 | 1 | 1 | 1 | 6 |
| 11 | 0 | 0 | 0 | 0 | 0 | 0 | 0 | 0 | 0 | 1 | 1 | 0 | 1* | 1 | 1* | 5 |
| 12 | 0 | 1* | 1* | 1 | 1 | 1 | 1* | 1* | 0 | 1* | 0 | 1 | 1* | 1* | 1 | 12 |
| 13 | 0 | 0 | 0 | 0 | 0 | 0 | 0 | 0 | 0 | 0 | 0 | 0 | 1 | 1 | 1* | 3 |
| 14 | 0 | 0 | 0 | 1* | 0 | 0 | 0 | 0 | 0 | 1* | 0 | 0 | 1 | 1 | 1 | 5 |
| 15 | 0 | 1* | 0 | 1 | 0 | 0 | 0 | 0 | 0 | 1 | 1* | 1* | 1 | 1 | 1 | 8 |
| DC | 6 | 10 | 7 | 12 | 9 | 9 | 7 | 7 | 1 | 8 | 6 | 10 | 13 | 10 | 14 |
| Enabler | Reachability Set (RS) | Antecedent Set (AS) | Intersection Set | Level |
|---|---|---|---|---|
| Iteration 1—Level I | ||||
| 1 | 1,2,3,4,5,6,7,8,12,13,15 | 1,2,3,4,5,8 | 1,2,3,4,5,8 | |
| 2 | 1,2,4,5,6,12,13,15 | 1,2,3,4,5,6,7,8,12,15 | 1,2,4,5,6,12,15 | |
| 3 | 1,2,3,4,5,6,7,8,10,11,12,14,15 | 1,3,5,6,7,8,12 | 1,3,5,6,7,8,12 | |
| 4 | 1,2,4,5,6,10,12,13,14,15 | 1,2,3,4,5,6,7,8,10,12, 14,15 | 1,2,4,5,6,10,12, 14,15 | |
| 5 | 1,2,3,4,5,6,7,8,10,11,12,14 | 1,2,3,4,5,6,7,8,12 | 1,2,3,4,5,6,7,8,12 | |
| 6 | 2,3,4,5,6,7,8,12,14 | 1,2,3,4,5,6,7,8,12 | 2,3,4,5,6,7,8,12 | |
| 7 | 2,3,4,5,6,7,8,12 | 1,3,5,6,7,8,12 | 3,5,6,7,8,12 | |
| 8 | 1,2,3,4,5,6,7,8,11,12 | 1,3,5,6,7,8,12 | 1,3,5,6,7,8,12 | |
| 9 | 9 | 9 | 9 | I |
| 10 | 4,10,11,13,14,15 | 3,4,5,10,11,12,14 | 4,10,11,14,15 | |
| 11 | 10,11,13,14,15 | 3,5,8,10,11,15 | 10,11,15 | |
| 12 | 2,3,4,5,6,7,8,10,12,13,14,15 | 1,2,3,4,5,6,7,8,12,15 | 2,3,4,5,6,7,8,12,15 | |
| 13 | 13,14,15 | 1,2,4,5,6,7,8,10,11,12, 13,14,15 | 13,14,15 | I |
| 14 | 2,10,13,14,15 | 3,4,5,6,10,11,12,13,14,15 | 10,13,14,15 | |
| 15 | 2,4,10,11,12,13,14,15 | 1,2,3,4,5,6,7,8,10,11, 12,13,14,15 | 2,4,10,11,12,13, 14,15 | I |
| Iteration 2—Level II | ||||
| 1 | 1,2,3,4,5,6,7,8,12, | 1,2,3,4,5,8 | 1,2,3,4,5,8 | |
| 2 | 1,2,4,5,6,12 | 1,2,3,4,5,6,7,8,12 | 1,2,4,5,6,12 | II |
| 3 | 1,2,3,4,5,6,7,8,10,11,12,14 | 1,3,5,6,7,8,12 | 1,3,5,6,7,8,12 | |
| 4 | 1,2,4,5,6,10,12,14 | 1,2,3,4,5,6,7,8,10,12,14 | 1,2,4,5,6,10,12,14 | II |
| 5 | 1,2,3,4,5,6,7,8,10,11,12,14 | 1,2,3,4,5,6,7,8,12 | 1,2,3,4,5,6,7,8,12 | |
| 6 | 2,3,4,5,6,7,8,12,14 | 1,2,3,4,5,6,7,8,12 | 2,3,4,5,6,7,8,12 | |
| 7 | 2,3,4,5,6,7,8,12 | 1,3,5,6,7,8,12 | 3,5,6,7,8,12 | |
| 8 | 1,2,3,4,5,6,7,8,11,12 | 1,3,5,6,7,8,12 | 1,3,5,6,7,8,12 | |
| 10 | 4,10,11,14 | 3,4,5,10,11,12,14 | 4,10,11,14 | II |
| 11 | 10,11,14 | 3,5,8,10,11 | 10,11 | |
| 12 | 2,3,4,5,6,7,8,10,12,14 | 1,2,3,4,5,6,7,8,12 | 2,3,4,5,6,7,8,12 | |
| 14 | 2,10,14 | 3,4,5,6,10,11,12,14 | 10,14 | |
| Iteration 3—Level III | ||||
| 1 | 1,3,5,6,7,8,12 | 1,3,5,8 | 1,3,5,8 | |
| 3 | 1,3,5,6,7,8,11,12,14 | 1,3,5,6,7,8,12 | 1,3,5,6,7,8,12 | |
| 5 | 1,3,5,6,7,8,11,12,14 | 1,3,5,6,7,8,12 | 1,3,5,6,7,8,12 | |
| 6 | 3,5,6,7,8,12,14 | 1,3,5,6,7,8,12 | 3,5,6,7,8,12 | |
| 7 | 3,5,6,7,8,12 | 1,3,5,6,7,8,12 | 3,5,6,7,8,12 | III |
| 8 | 1,3,5,6,7,8,11,12 | 1,3,5,6,7,8,12 | 1,3,5,6,7,8,12 | |
| 11 | 11,14 | 3,5,8,11 | 11 | |
| 12 | 3,5,6,7,8,12,14 | 1,3,5,6,7,8,12 | 3,5,6,7,8,12 | |
| 14 | 14 | 3,5,6,11,12,14 | 14 | III |
| Iteration 4—Level IV | ||||
| 1 | 1,3,5,6,8,12 | 1,3,5,8 | 1,3,5,8 | |
| 3 | 1,3,5,6,8,11,12 | 1,3,5,6,8,12 | 1,3,5,6,8,12 | |
| 5 | 1,3,5,6,8,11,12 | 1,3,5,6,8,12 | 1,3,5,6,8,12 | |
| 6 | 3,5,6,8,12 | 1,3,5,6,8,12 | 3,5,6,8,12 | IV |
| 8 | 1,3,5,6,8,11,12 | 1,3,5,6,8,12 | 1,3,5,6,8,12 | |
| 11 | 11 | 3,5,8,11 | 11 | IV |
| 12 | 3,5,6,8,12 | 1,3,5,6,8,12 | 3,5,6,8,12 | IV |
| Iteration 5—Level V | ||||
| 1 | 1,3,5,8 | 1,3,5,8 | 1,3,5,8 | V |
| 3 | 1,3,5,8 | 1,3,5,8 | 1,3,5,8 | V |
| 5 | 1,3,5,8 | 1,3,5,8 | 1,3,5,8 | V |
| 8 | 1,3,5,8 | 1,3,5,8 | 1,3,5,8 | V |
Publisher’s Note: MDPI stays neutral with regard to jurisdictional claims in published maps and institutional affiliations. |
© 2022 by the authors. Licensee MDPI, Basel, Switzerland. This article is an open access article distributed under the terms and conditions of the Creative Commons Attribution (CC BY) license (https://creativecommons.org/licenses/by/4.0/).
Share and Cite
Karanam, M.; Krishnanand, L.; Manupati, V.K.; Antosz, K.; Machado, J. Identification of the Critical Enablers for Perishable Food Supply Chain Using Deterministic Assessment Models. Appl. Sci. 2022, 12, 4503. https://doi.org/10.3390/app12094503
Karanam M, Krishnanand L, Manupati VK, Antosz K, Machado J. Identification of the Critical Enablers for Perishable Food Supply Chain Using Deterministic Assessment Models. Applied Sciences. 2022; 12(9):4503. https://doi.org/10.3390/app12094503
Chicago/Turabian StyleKaranam, Malleswari, Lanka Krishnanand, Vijaya Kumar Manupati, Katarzyna Antosz, and Jose Machado. 2022. "Identification of the Critical Enablers for Perishable Food Supply Chain Using Deterministic Assessment Models" Applied Sciences 12, no. 9: 4503. https://doi.org/10.3390/app12094503
APA StyleKaranam, M., Krishnanand, L., Manupati, V. K., Antosz, K., & Machado, J. (2022). Identification of the Critical Enablers for Perishable Food Supply Chain Using Deterministic Assessment Models. Applied Sciences, 12(9), 4503. https://doi.org/10.3390/app12094503