Article

Fire Risk Analysis in Large Multi-Compartment Structures Using a Hybrid Multiscale Approach

1
University Institute of Industrial Thermal Systems (IUSTI), Aix Marseille University, National Centre for Scientific Research (CNRS), 13013 Marseille, France
2
Scientific Research and Numerical Simulation (RS2N), 83640 Saint-Zacharie, France
3
Innovation and Development (INNODEV), 13013 Marseille, France
4
Délégation Générale de l’Armement–Techniques Navales, 83050 Toulon, France
*
Author to whom correspondence should be addressed.
Appl. Sci. 2022, 12(9), 4123; https://doi.org/10.3390/app12094123
Submission received: 15 March 2022 / Revised: 12 April 2022 / Accepted: 16 April 2022 / Published: 19 April 2022

Abstract

:

Featured Application

The proposed approach could be used as a basis for a decision support tool to reduce the risk of fire in large multi-compartment structures.

Abstract

This paper proposes a hybrid multiscale approach to evaluate the fire performance of large multicompartment structures. A probabilistic network model is at the core of the proposed approach, whose inputs, namely the mean durations of the fire phases and fire transmission through the barriers between compartments (e.g., walls or ventilation ducts), are determined beforehand by a zone model, which is detailed in a companion paper and a one-dimensional computational fluid dynamics code. Next, a proof of concept is developed by applying the hybrid approach to different fire scenarios in a full-scale generic military corvette and a four-story office building. The simulation results highlight the strengths and limitations of the proposed approach. Regarding the latter, a field model is used to evaluate how the hybrid approach performs depending on the interaction between the entire building system and its ventilation and the fire. Finally, a statistical study is carried out to produce fire vulnerability and risk maps, ranking the fire compartments according to their vulnerability or propensity to generate serious fires.

1. Introduction

Fire safety of large multicompartment enclosures (e.g., high-rise buildings, commercial and military ships, or industrial warehouses) is a major issue with consequences for lives, properties, structures, activities, and the environment. The problem becomes more and more acute as the size and architectural complexity increases, along with the fuel load and the variety of materials that can be involved in a fire. There are also time constraints, which necessarily lead to compromise in engineering safety to save costs and time. All of this makes the task of fire safety engineers, designers, and modelers even more difficult. To address this issue, a hybrid multiscale approach can be used. In their review paper, Ralph and Carvel [1] defined such an approach as the “coupling of two or more sub-models, with different complexities and computational costs, into a single model”. Hybrid approaches differ according to the component models used. When applied to fire safety engineering, network, zone, and/or field models, in order of increasing complexity and computational cost, they can be coupled to simulate fire and smoke spread.
Zone models divide the fire enclosure into one or more layers where mass and energy conservation equations are solved. They assume that all quantities of interest (e.g., temperature or species concentrations) are uniform within each zone. The advantages of zone models are the low memory requirements, speed, and the little data they need, but these models are limited by the geometry of the enclosure. In the most used zone models, the enclosure is made up of two zones—the hot upper smoke layer and the cold lower layer—separated by a planar interface. Among the numerous zone models used by fire safety engineers [2,3,4], only a few have been developed for multicompartment enclosures, including the BRI [5], BRANZFIRE [6], and CFAST [7] models.
In the field or computational fluid dynamics (CFD) models (e.g., [8,9,10]), the solution domain is divided into many small control volumes where the time-dependent Navier–Stokes equations are solved. While field models provide very detailed solutions whatever the geometry of the enclosure, they require more detailed input information and computing resources than zone models.
In large buildings with up to several hundred or thousands of compartments, the use of traditional zone and field models quickly becomes impractical, which explains why network models have been developed (e.g., [11,12,13]). In network models, each compartment is represented as a node, which significantly reduces the size of the computational space required for the simulation. Fire and smoke can spread from one node to another through windows, doors, walls, and ventilation ducts.
In this paper, a hybrid approach, coupling a zone model, a CFD 1D model, and a probabilistic network model, is presented to simulate fire and smoke propagation in large multicompartment structures. The paper is organized as follows. First, we present the models upon which the hybrid multiscale approach is based, as well as the interaction between them. Note that the zone model is described in a companion paper [14] and is not detailed here. A proof of concept is developed by applying the hybrid approach to a full-scale generic military corvette and a four-story office building. Next, a statistical study is conducted to provide fire vulnerability and risk maps.

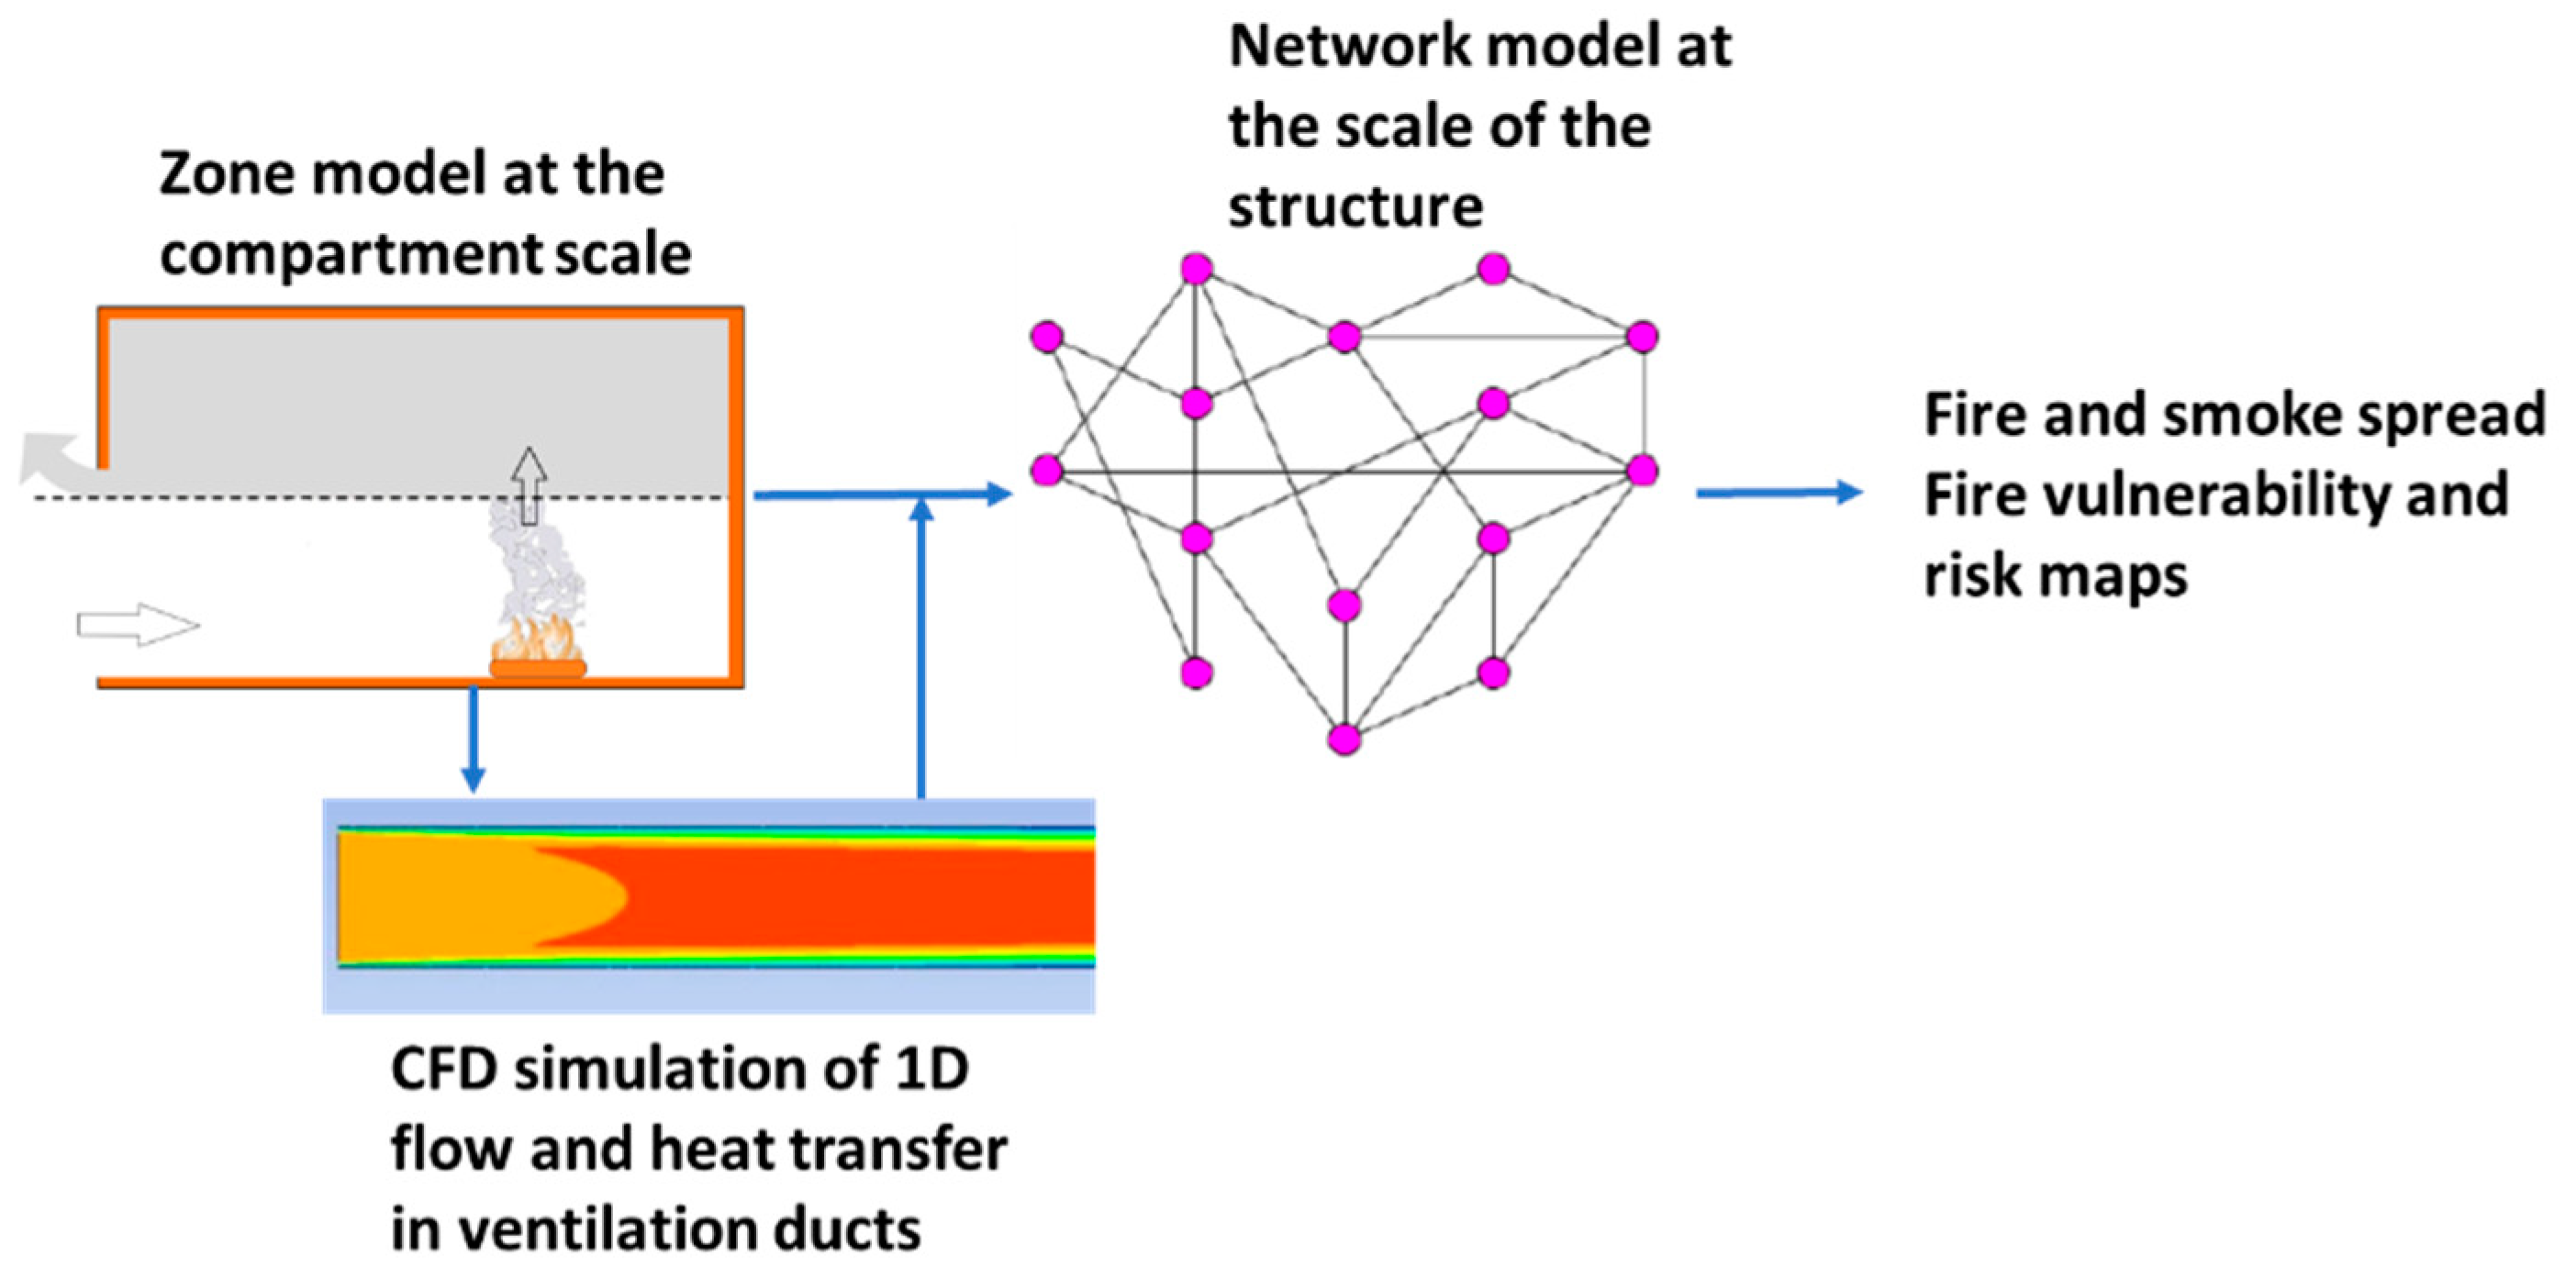
2. The Hybrid Multiscale Approach

As mentioned earlier, a probabilistic network model is used to simulate the propagation of fire and smoke in a large structure. It includes the short- and long-distance connections between compartments and allows for a realistic layout of compartments with more or less complex geometric shapes. The physical phenomena related to the development of fire in a compartment and its transmission to other compartments are simulated by time-dependent Gaussian probability density functions (pdfs). Used as inputs of the network model, the mean values of the pdfs associated with the fire phases and fire transmissions through the barriers between adjacent compartments are determined from a zone model, while a 1D CFD model is used to evaluate the mean pdf value associated with the failure of a ventilation duct connecting adjacent and remote compartments. In the following section, we detail the three models that comprise the hybrid approach, which is schematized in Figure 1.

2.1. The Compartment Fire Zone Model
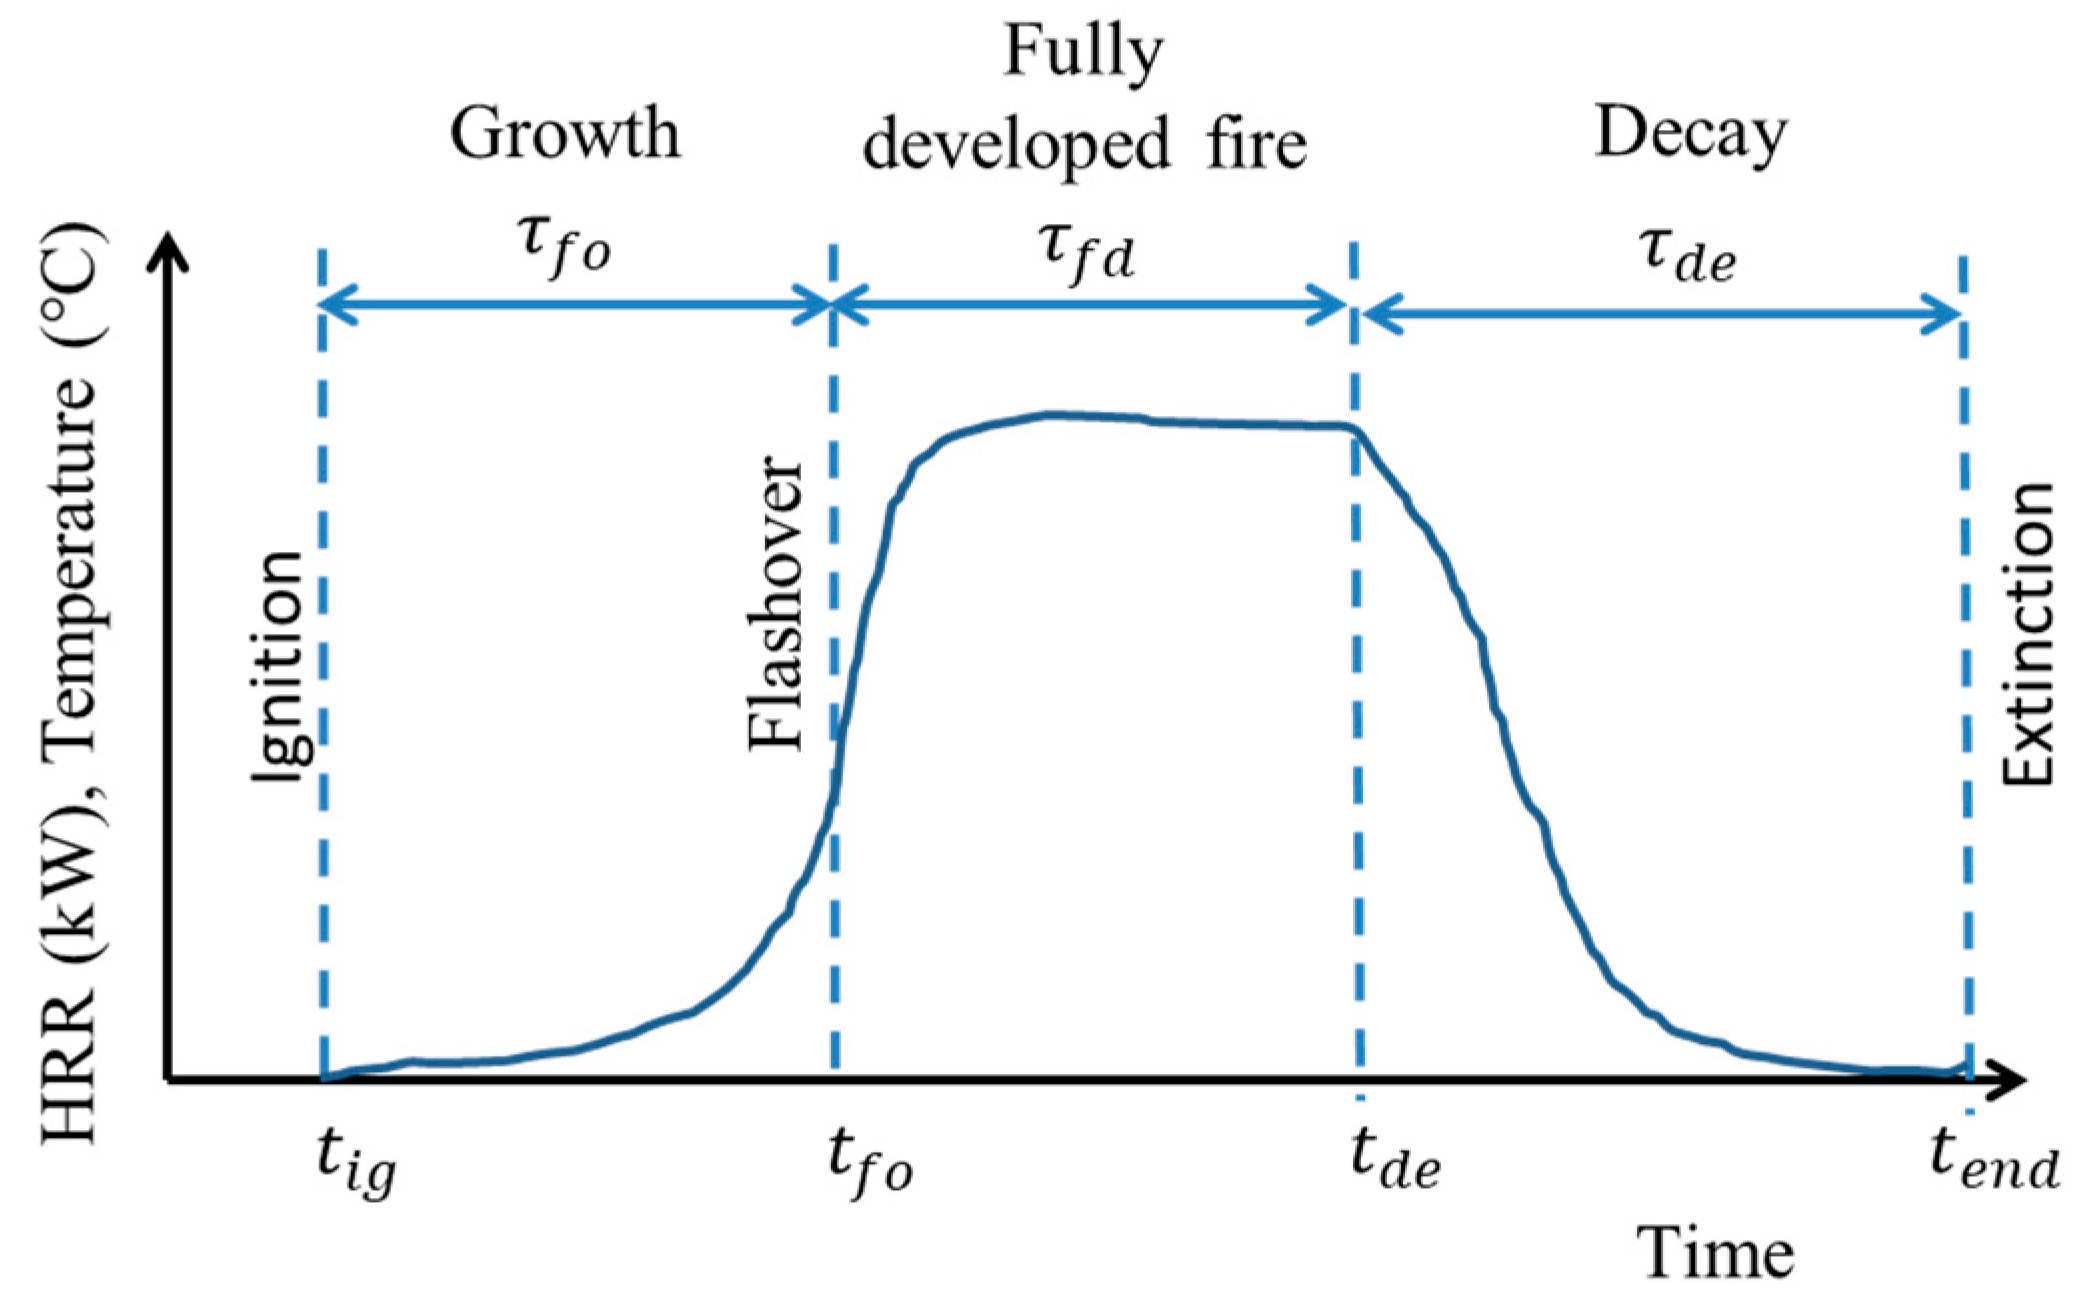
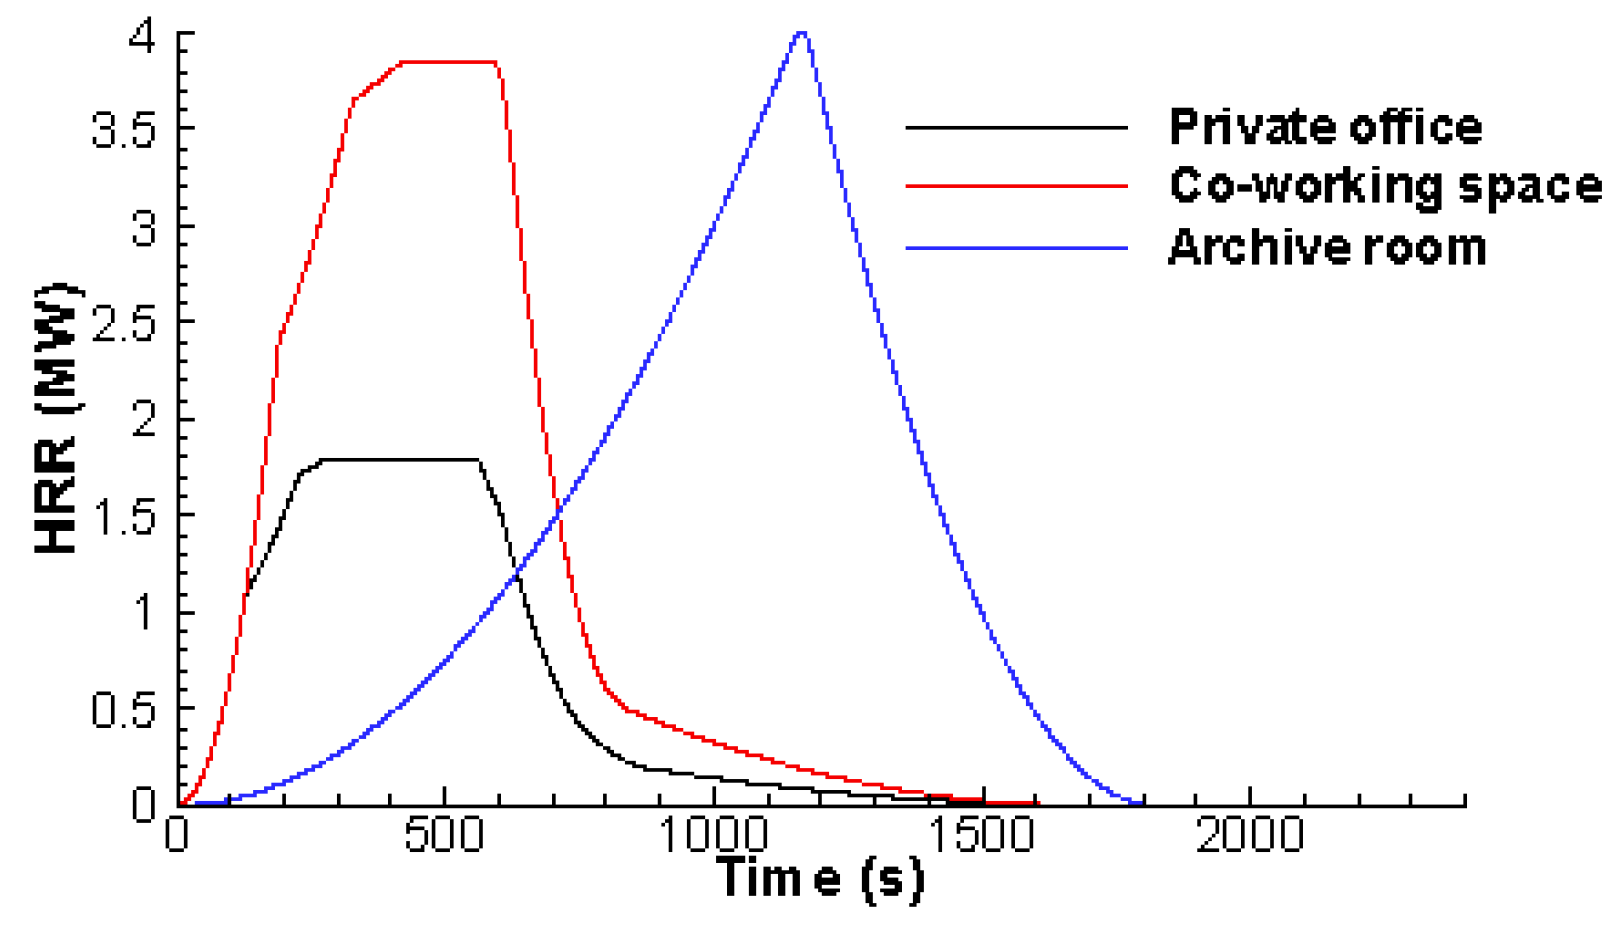
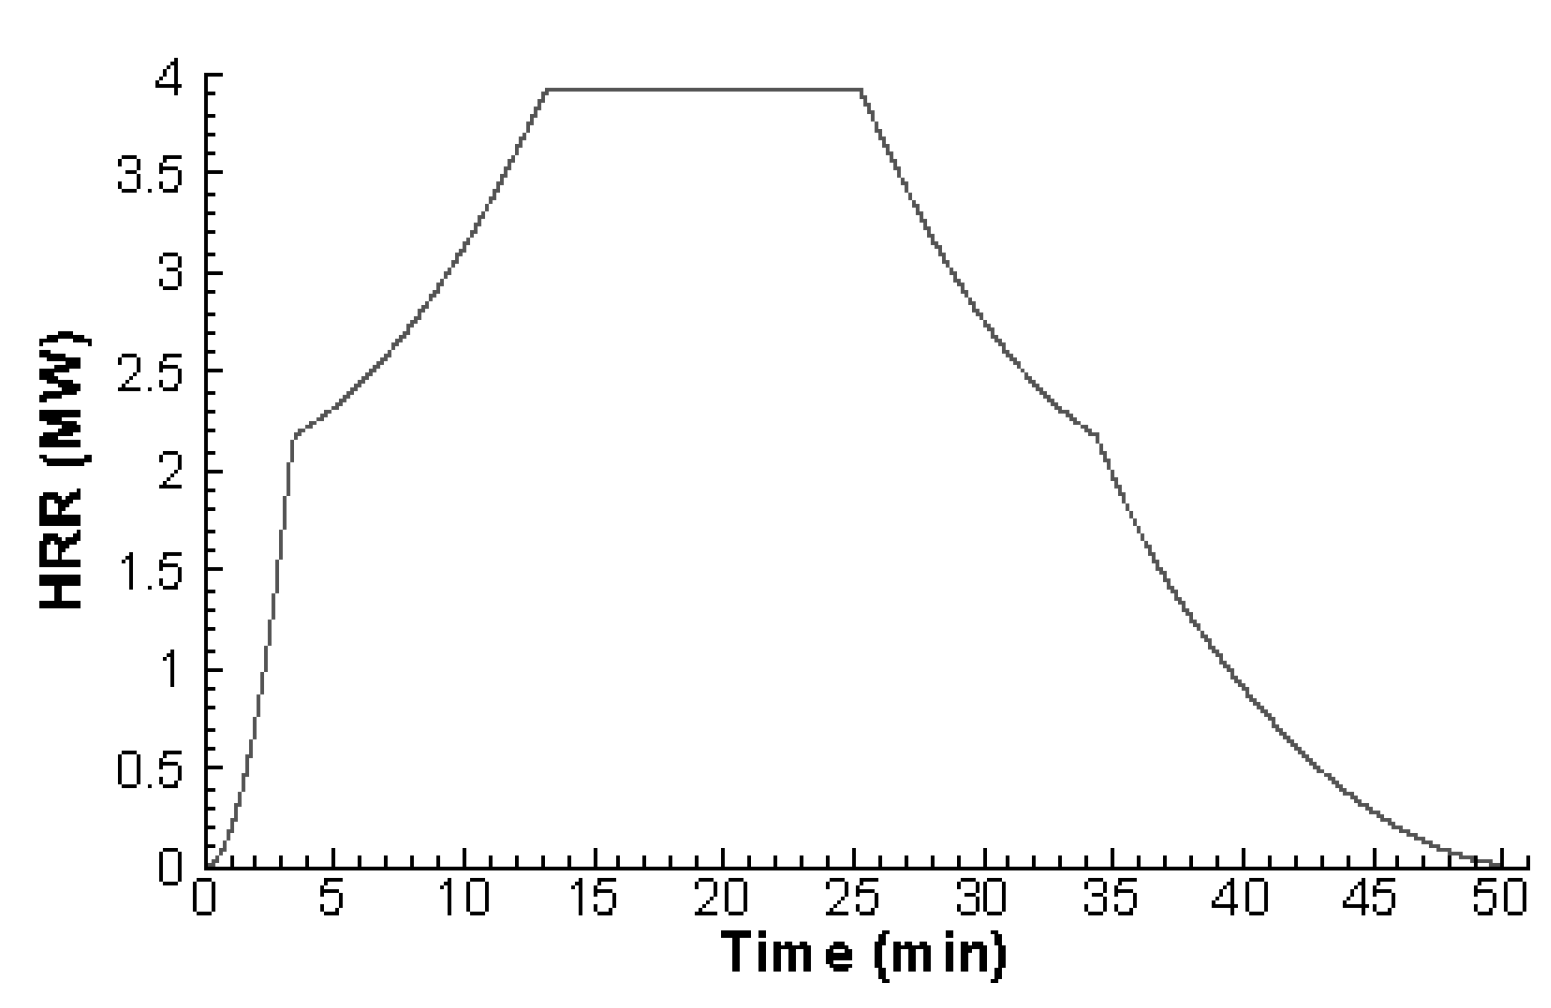
As illustrated in Figure 2, after ignition, a compartment fire may undergo the phases of growth, fully developed fire, and decay. Flashover is not a fire stage, but the transition from the growth stage to a fully developed fire, involving all the combustible materials within the compartment. Decay occurs when most of the fuel has been consumed and the heat release rate (HRR) begins to decrease. It is generally accepted that this occurs, at time t d e , when 70 to 80% of the fuel has been consumed [15,16,17]. However, the experiments carried out in [14] have shown that this can take place for values lower than 70% (e.g., 65% for pine wood) or higher than 80% (e.g., 95% for heptane). During the decay phase, the fire evolves from a ventilation-controlled regime to a fuel surface-controlled regime.

Design Fires

In a companion paper [14], the authors present a two-zone model that was developed to predict fire development in a compartment where single- or multi-fuel combustion occurs. This model was validated using data from full-scale experiments involving different combinations of solid and liquid fuels and varying the confinement level of the compartment. In this phase of validation, the pyrolysis or combustion rate, and therefore the HRR, was deduced from the fuel mass loss rate measured over time. Unfortunately, for the present study cases, the HRR time curve in each compartment is unknown. To overcome this issue, the time evolution of the HRR is assumed to follow three phases: a growth phase where it increases as the square of time [18,19], a steady phase, and a decay phase where it decreases as the square of time:
H R R = { α g r t 2 s i   t < t m a x H R R m a x s i   t m a x t t d e α d e ( t e x t ) 2 s i   t d e < t t e x 0 s i   t > t e x
where t is the time from established ignition (in s), α g r and α d e are the respective fire growth and decay rates (in W/s2), t m a x is the time at which the HRR is maximum ( H R R m a x in W), t d e is the time when decay starts, and t e x is the time when fire ends.
The calculation of HRR requires knowledge of the initial fuel mass m 0 , H R R m a x , α g r , the chemical heat of combustion of fuel, Δ h c h , and the fraction p of the initial fuel mass beyond which fire decay begins. The other parameters are deduced from the following relationships:
t m a x = ( H R R m a x / α g r ) 0.5
t d e = t m a x + p   m 0   Δ h c h 1 3 α g r t m a x 3 H R R m a x
α d e = H R R m a x 3 [ 3 m 0 ( 1 p ) Δ h c h ] 2
t e x = t d e + ( H R R m a x / α d e ) 0.5
Figure 3a shows the design fires for 50 cm diameter pool fires of heptane and JP5 (kerosene-based fuel used in military aircraft, NATO code: F44) using the following standard set of parameters: for the heptane pool fire, Δ h c h = 41.2 J/kg [20], α g r = 49 W/s2, and p = 0.95; and for the JP5 pool fire, Δ h c h = 40.0 J/kg [20], α g r = 30 W/s2, and p = 0.95. A good agreement is obtained with experiments carried out in the DIAMAN device [14].
For larger enclosure fires ( H R R m a x > 1.5   MW ) , experiments are difficult to conduct. To overcome this problem, a scaling procedure is developed. Although established for open fires, the correlation of Babrauskas [21] is used to account for the functional dependence of the mass loss rate on the pool diameter D :
m ˙ D = m ˙ ( 1 e κ β D )
The values of m ˙ , the mass loss rate of an infinite diameter pool, and k β , an extinction coefficient, were determined by Babrauskas for a large number of fuels [21]. For a given fuel, Equation (6) allows for calculating the maximum HRR, H R R m a x D , of a pool fire of diameter D from that of a pool fire of smaller diameter d for which H R R m a x d is known:
H R R m a x D H R R m a x d = m ˙ D Δ h c h m ˙ d Δ h c h ( D d ) 2 = 1 e x p k β D 1 e x p k β d ( D d ) 2
In the present study, the scaling procedure is used to determine the design fires for large fires from those validated on smaller fires [14]. When applied to 70 cm diameter heptane and JP5 pool fires, using the standard set of parameters given previously, it satisfactorily reproduces the experimental HRR curves, as shown in Figure 3b. Note that the effect due to the thermal feedback from the pan walls to the remaining fuel at the end of burning (lip effect), which is clearly visible in the evolution of the HRR, especially for heptane pool diameters of 50 and 70 cm, cannot be reproduced by Equation (1), which is not bad insofar as this experimental artifact does not exist under real fire conditions.

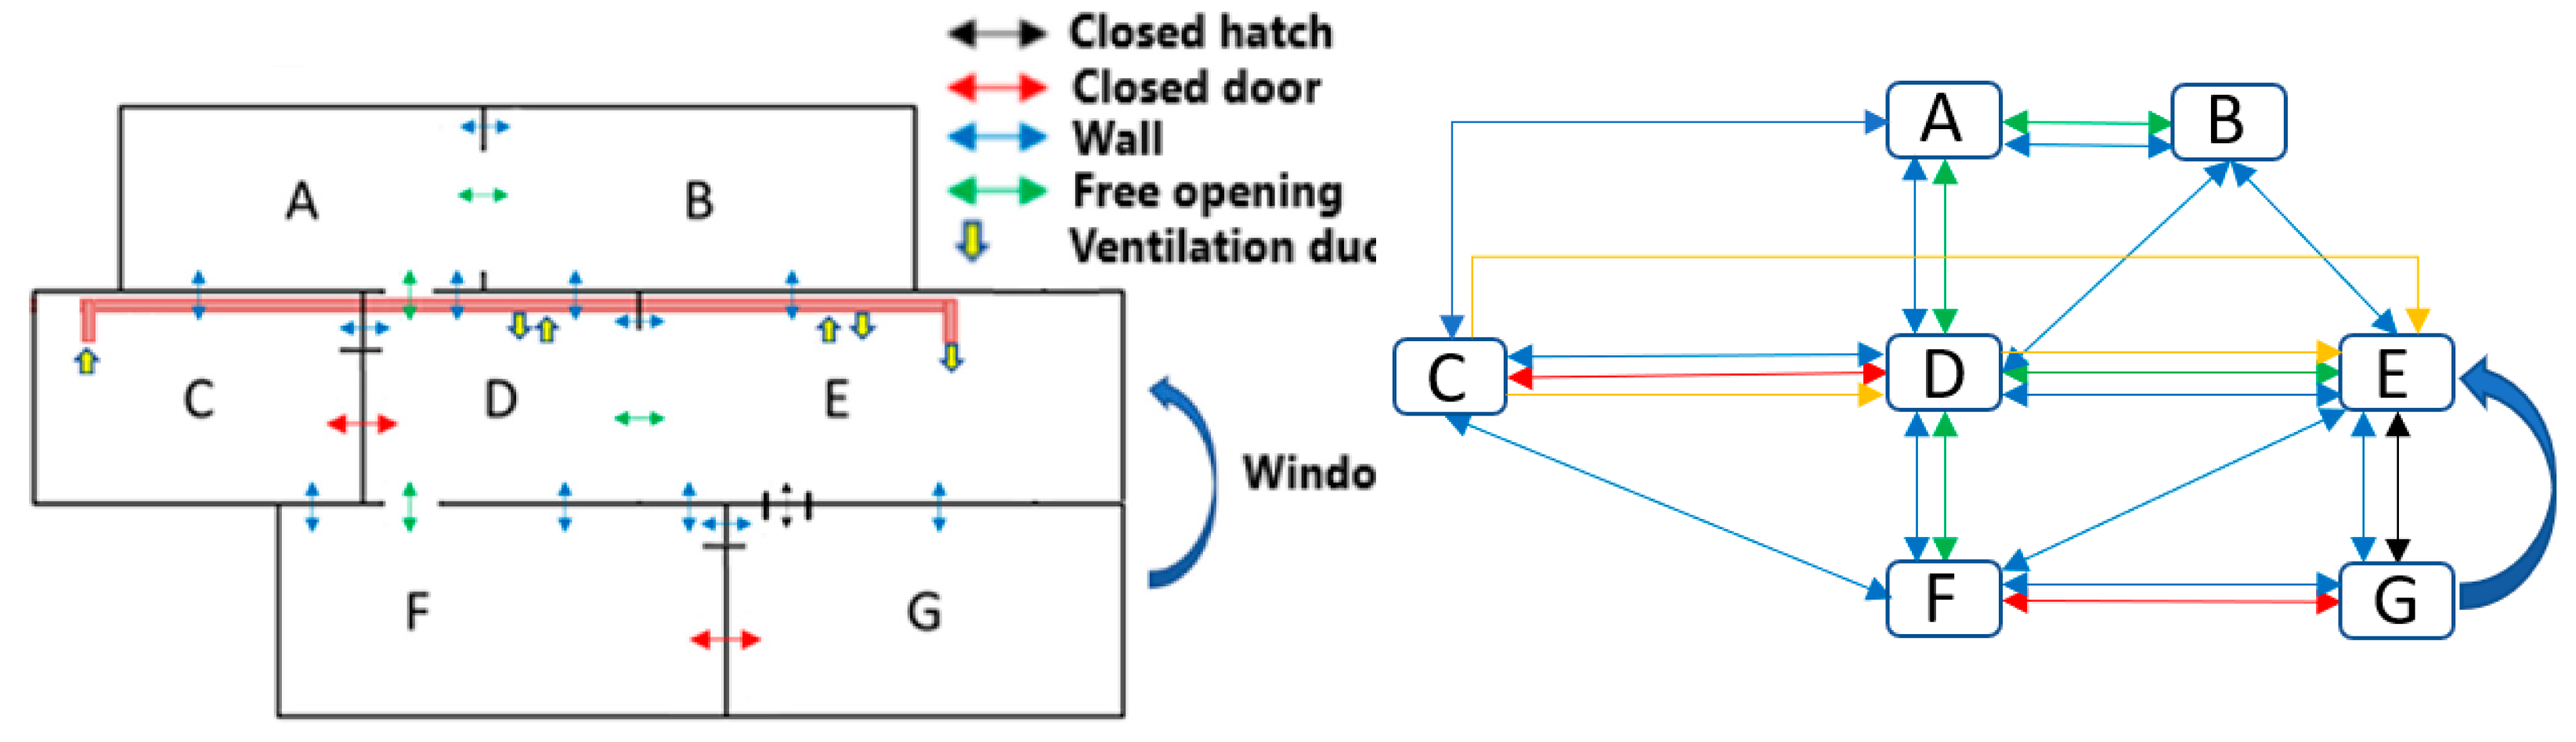
2.2. The Network Model

From the compartment connectivity information, it is possible to define a graph representing the possible paths of fire propagation from the fire compartment to the others compartments though openings and various barriers, including walls, closed doors, closed windows, closed hatches, and ventilation ducts. In such a graph, the nodes represent the compartments, and the links represent the connections between two compartments. An example of a network graph is shown in Figure 4, where all modes of fire transmission through barriers are represented.

2.2.1. Model Assumptions

The probabilistic model is inspired by the work of Cheng and Hadjisophocleous [12]. It is based on the following assumptions.
Assumption 1 (A1).
The probabilities of flashover and barrier failure are represented by time-dependent Gaussian probability density functions (pdf). Each pdf depends on two parameters, namely the mean and the standard deviation. The mean values for flashover and barrier failure, namely μ f o   and μ b f , correspond to the values obtained from both the zone and 1D CFD models, and each associated standard deviation is a fraction, here 0.15, of the mean value (e.g., σ f o = 0.15 μ f o ).
Assumption 2 (A2).
The probability of transmission through an opening is equal to 1. As suggested in [12], when two compartments are separated just by an open door, open window, open hatch, or there is no barrier between them, if flashover occurs in one of the compartments, the fire will immediately spread to the other compartment. For a large compartment, such as a hall or a corridor in a building, the compartment can be divided into several virtual compartments without boundary barriers between them.
Assumption 3 (A3).
The ignition of a target compartment C2 by a fire compartment C1 occurs only if the fire in C1 is fully developed and if the transmission from C1 to C2 already happened.
Assumption 4 (A4).
Fire transmission through the wall occurs when the temperature of the outer face of the wall exceeds a critical temperature. The minimum ignition temperature of combustible materials can be determined from standard tests [22,23,24,25] or from specific tests, such as those carried out specifically by DGA in an enclosure where a 1.25 MW fire was developing [26]. The latter showed that ignition of cellulosic or synthetic materials can occur when the temperature of the hot surface exceeds 340 °C.
Assumption 5 (A5).
Fire spread from C1 to C2 is effective only when the fire in C2 is fully developed.
Assumption 6 (A6).
The mean time until flashover is defined as the time interval between ignition and the time at which the temperature in the hot layer reaches 550 °C [3,27].
Assumption 7 (A7).
Fire transmission through a ventilation duct, filled with air or hot combustion products, occurs when the temperature of the outer face of the duct exceeds 340 °C. When the hot gases emerge into the target compartment, fire transmission occurs when the gas temperature exceeds 550 °C, by analogy with the flashover criterion.
Assumption 8 (A8).
The common glass of windows in a compartment is assumed to break and fall off once flashover occurs in the compartment [12].

2.2.2. Model Probabilities

Probability of barrier failure
The pdf of the barrier failure between a compartment C1, where the fire is fully developed, and another compartment C2 at time t can be written as
p b f ( C 1 C 2 ) = 1 σ b f 2 π e x p ( [ ( t t f o ) μ b f ] 2 2 σ b f 2 )
where μ b f   and σ b f are the mean and standard deviation of duration of barrier failure, respectively.
The corresponding cumulative probability at time t is thus given by
P b f ( C 1 C 2 ) = t f o t p b f ( C 1 C 2 ) d t   for   t f o t t f o + τ f d  
The above equation can be integrated analytically using the error function as follows:
P b f ( C 1 C 2 ) = 1 2 e r f ( t t f o μ b f σ b f 2 ) + 1 2 e r f ( μ b f σ b f 2 )   for   t f o + τ f d
Probability of a fully developed fire
If ignition occurred in compartment C1, the fire may grow to a fully developed fire. If the hot layer temperature is less than the critical value for flashover (i.e., 550 °C), flashover would not be expected to occur in the compartment, and the probability of fire growth to a fully developed fire is zero. Otherwise, flashover can occur in the compartment.
The pdf of fire growth to a fully developed fire at time t is
p f d ( C 1 ) = 1 σ f o 2 π e x p ( [ ( t t i g ) μ f o ] 2 2 σ f o 2 )
When flashover occurred in the compartment, the cumulative probability can be calculated as:
P f d ( C 1 ) = { t i g t p f d ( C 1 ) d t       f o r   t i g t t i g + τ f o + τ f d 0   o t h e r w i s e
where μ f o and σ f o are the mean and standard deviation of the flashover time in the compartment, respectively.
When flashover does not occur in the compartment, the cumulative probability is deduced from Equation (12). Then, a random number R between 0 and 1 is generated and compared to the computed cumulative probability. If R P f d   ( C 1 ) , flashover occur in C1 and the flashover time t f o is equal to the current time t . Otherwise, flashover does not occur at time t in C1.
Probability of ignition
Given the A3 assumption, the probability of ignition of C2 by C1 is expressed as
P i g ( C 1 C 2 ) = P b f ( C 1 C 2 ) × P f d ( C 1 )
The statistical approach consists in drawing a random number 0 < R < 1 and comparing R to the probability of ignition. If R P i g ( C 1 C 2 ) , then ignition occurs in C2 and the ignition time t i g is equal to the current time t . If a target compartment is connected to several fully developed fire compartments, the probability of ignition increases due to the heat transferred from all adjacent fire compartments. For example, if C2 has two adjacent fire compartments C1 and C3, the probability of C2 ignition becomes
P i g ( C 1 C 2   o r   C 3 C 2 ) = P i g ( C 1 C 2 ) + P i g ( C 3 C 2 ) P i g ( C 1 C 2 ) × P i g ( C 3 C 2 )
Fire spread probability
According to the assumption A5, the probability of fire spread from C1 to C2 is equal to
P s p r e a d ( C 1 C 2 ) = P i g ( C 1 C 2 ) × P f d ( C 2 )
where P i g ( C 1 C 2 ) is the probability of ignition of C2 by C1, and P f d ( C 2 ) is the probability of fully developed fire in C2.

2.2.3. Smoke Transport

The calculation of the smoke transport is integrated in the network model. It is based on a simple filling model (see, for example, [28]), which assumes that:
  • The smoke does not interact with a burning room, which is truer as the space that can be affected by the smoke is large and the characteristic propagation times of smoke is larger than that of fire;
  • Ventilation, natural or mechanical, of the structure has no significant impact on the flow of smoke;
  • The smoke flow from a burning room is evenly distributed to the rooms connected to it by a free opening, such as a door, a hatch, or a window.
The filling model uses as input data the time evolutions of the mass flow rate, density, and temperature of the smoke leaving the fire compartment calculated by the zone model. For a non-fire compartment, the height of the smoke layer interface is deduced from the mass conservation equation, written as:
z ˙ i = q s m q s m + ρ s m A r o o m
where q s m and q s m + are the mass flow rates of smoke leaving or entering the compartment through the openings, ρ s m is the smoke density, and A r o o m is the floor area of the compartment.
In order to take into account the cooling of smoke as it travels through the structure, many authors have established correlations whose general form is based on the solution of mass, momentum, and energy balance equations (e.g., [29,30]). In our study, the correlation of Bailey et al. [29], validated on corridor fires, is used to calculate the evolution of the smoke temperature T f ( x ) , and thus the smoke density, as a function of the distance x from the source:
log ( T f ( x ) T a m b T f 0 T a m b ) 0.003 0.018   x
where T f 0 is the temperature of smoke in the compartment of fire origin (i.e., at x = 0 ), and T a m b is the ambient temperature.

2.2.4. Fire Spread through the Exterior Windows
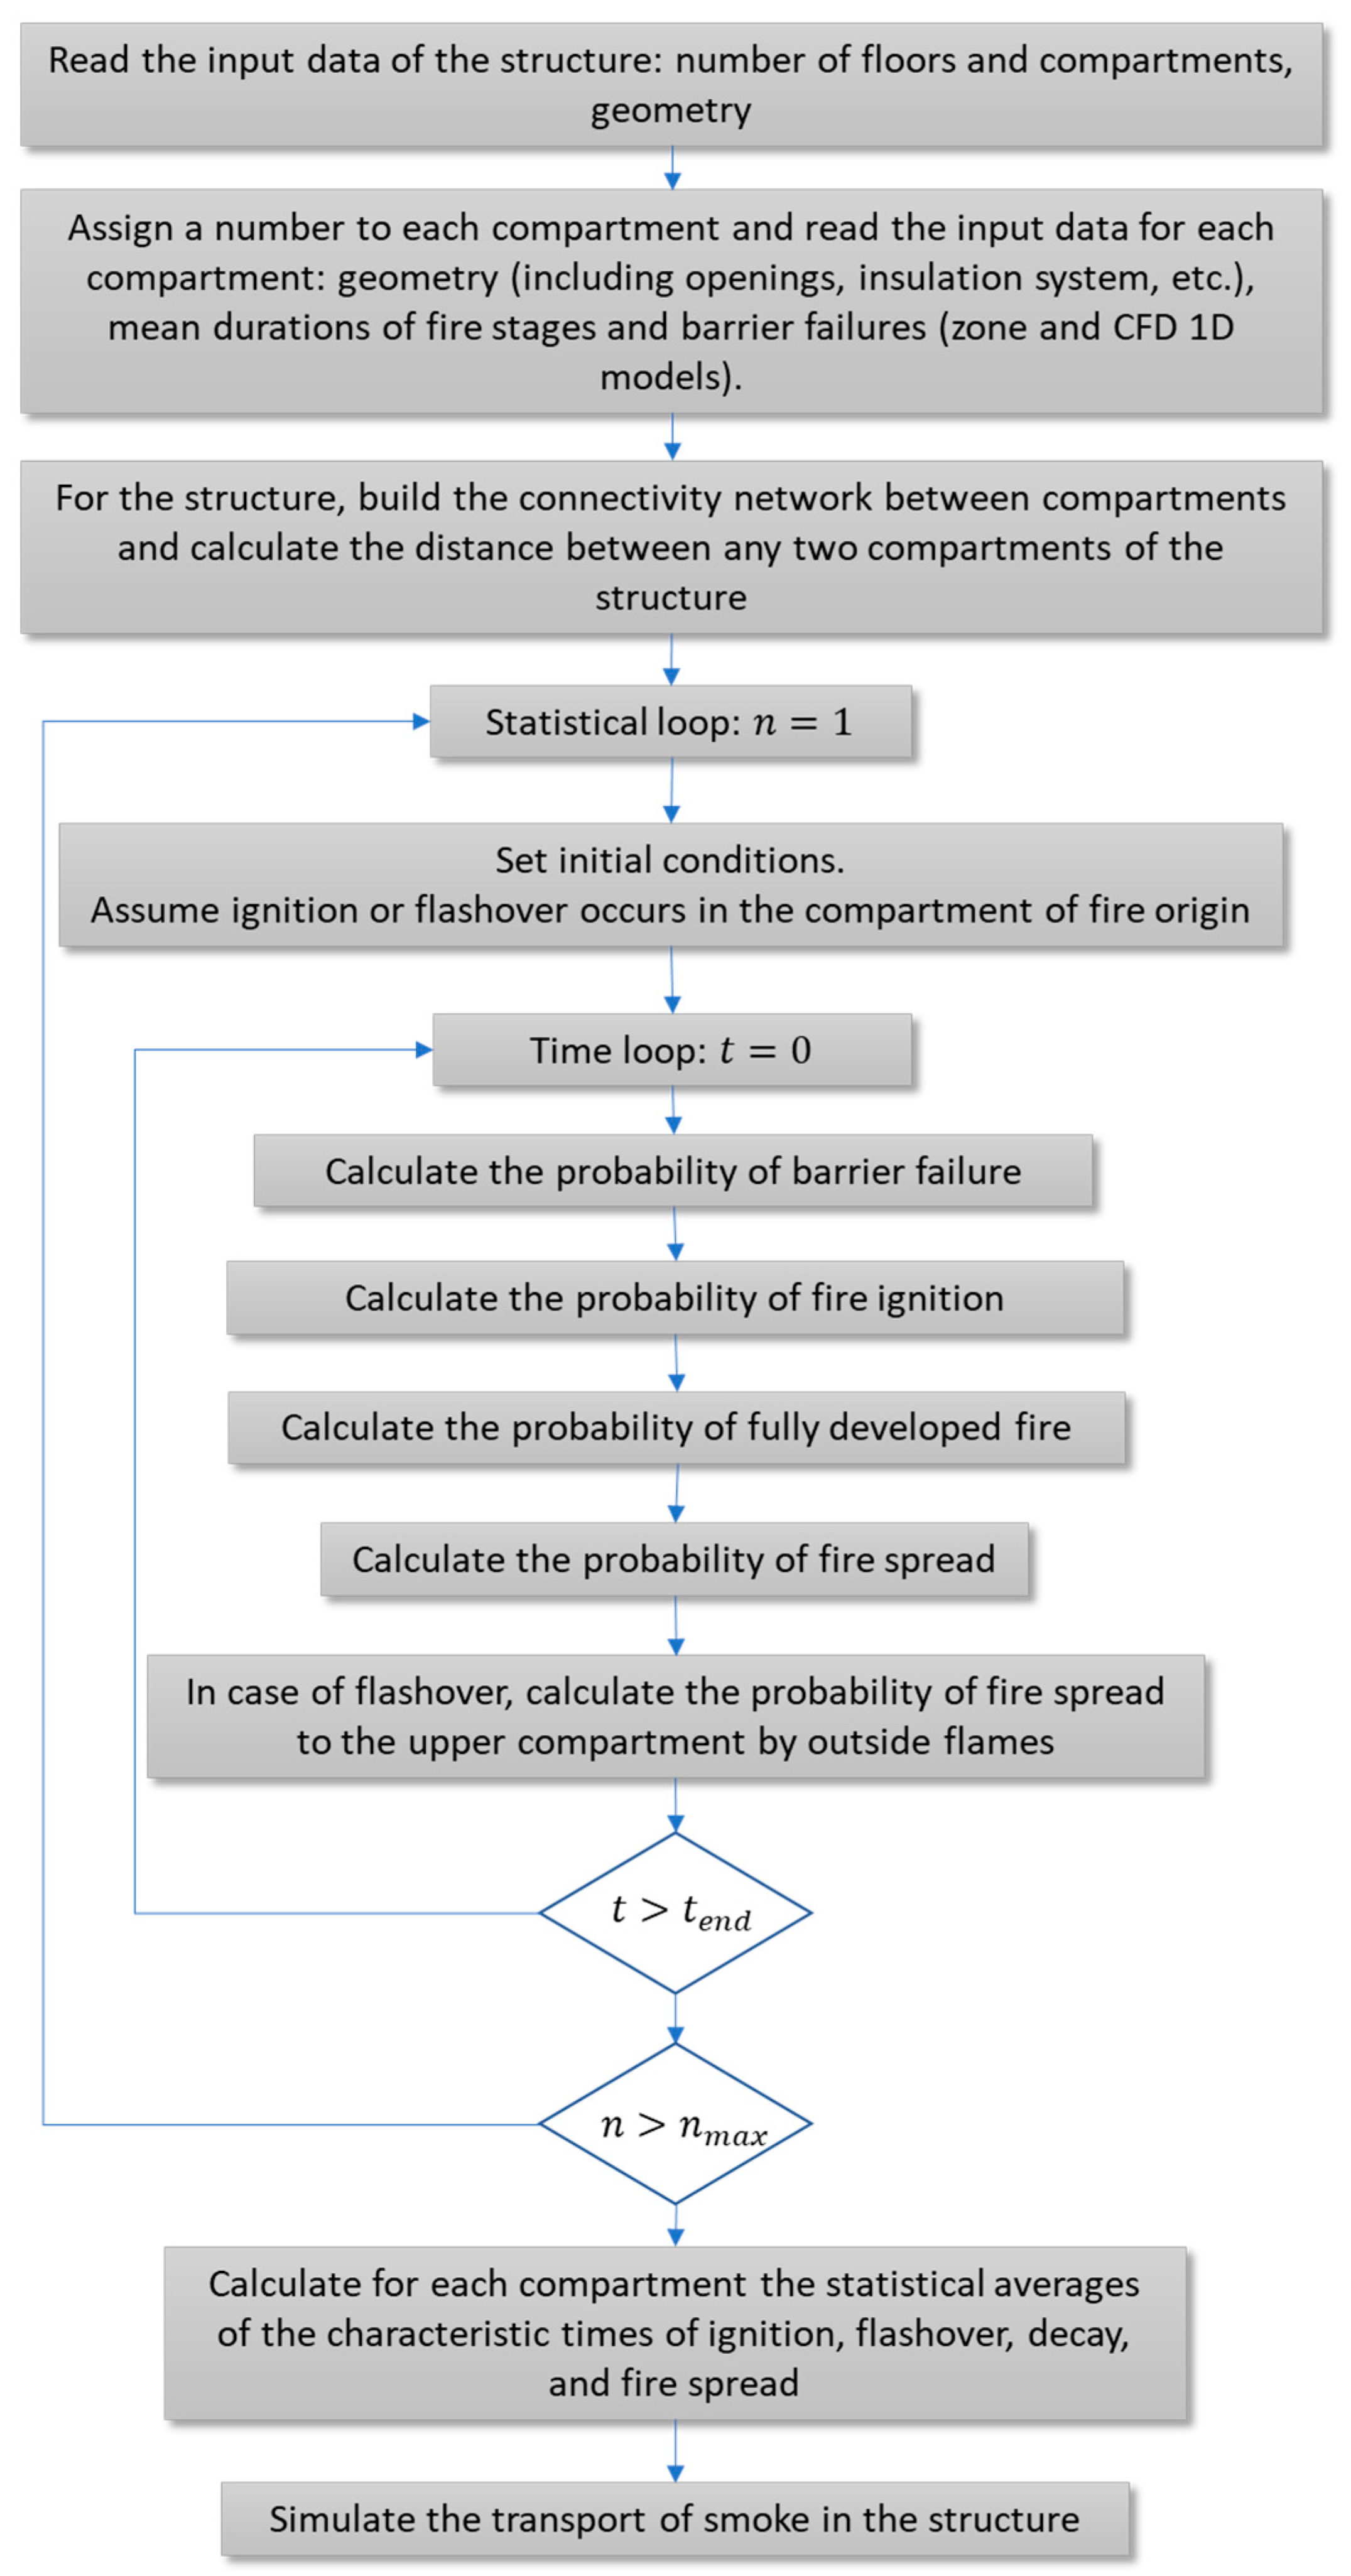
If a fire occurs in a compartment C1, the radiative and convective heat flux generated could cause the window glass to break. In some cases, the flames could then be projected outward from the structure, shattering the window of the upper floor compartment D1, entering D1, and igniting the combustible materials therein. This occurs when the fire in C1 is ventilation controlled. To determine whether the fire could spread through the exterior windows, the flame height z above the soffit of the C1 window is evaluated as follows [31]:
z = 12.8 ( m v ˙ W 0 ) 2 / 3 H 0
where m v ˙ is the fuel burning rate in C1, and H 0 and W 0 are the height and width of the C1 window, respectively. In summary, fire transmission by exterior windows occurs if the fire in C1 is fully developed and ventilation controlled, and if z d , where d is the distance between the C1 and D1 windows.

2.2.5. Procedure

The network model requires input data and model parameters that are listed below.
  • Total simulation time t e n d ;
  • Simulation time step;
  • Number of statistical samples n m a x ;
  • Structure: the number of floors, number of compartments per floor, distance between any two compartments, and distance between vertically aligned outward facing windows. A number is assigned to each compartment on each floor of the structure;
  • For each compartment: the dimensions of the compartment; location in the structure, dimensions, and initial status (open or closed) of doors and windows; wall properties (including insulation); mean durations of flashover, fully developed fire, decay, and barrier failure (here, the conservative value of 15% of the mean value is retained for the standard deviations); mass flow rate, temperature, and composition of smoke leaving the compartment over time;
  • Number of the first compartment on fire.
The flow chart describing the sequence of operations of the network model is shown in Figure 5. The first step consists in creating the connectivity network linking compartments, barriers, and openings. Given the probabilistic nature of the network model, it is necessary to perform a large number of runs in order to extract reliable statistical averages. Preliminary calculations show that 100 independent runs per test case are sufficient to obtain good statistical accuracy. At the end of the statistical loop, the network model gives the average times of ignition, flashover, fully developed fire, decay, and extinguishment for each compartment. In other words, it provides information on the chronology of the fire, giving the state of the compartments over time, classified as healthy compartments, and compartments where the fire started, was fully developed, and/or extinguished by lack of fuel or oxygen. The calculation of smoke transport in the structure is based on these average values. The output files provide the filling chronology of the compartments by the smoke.

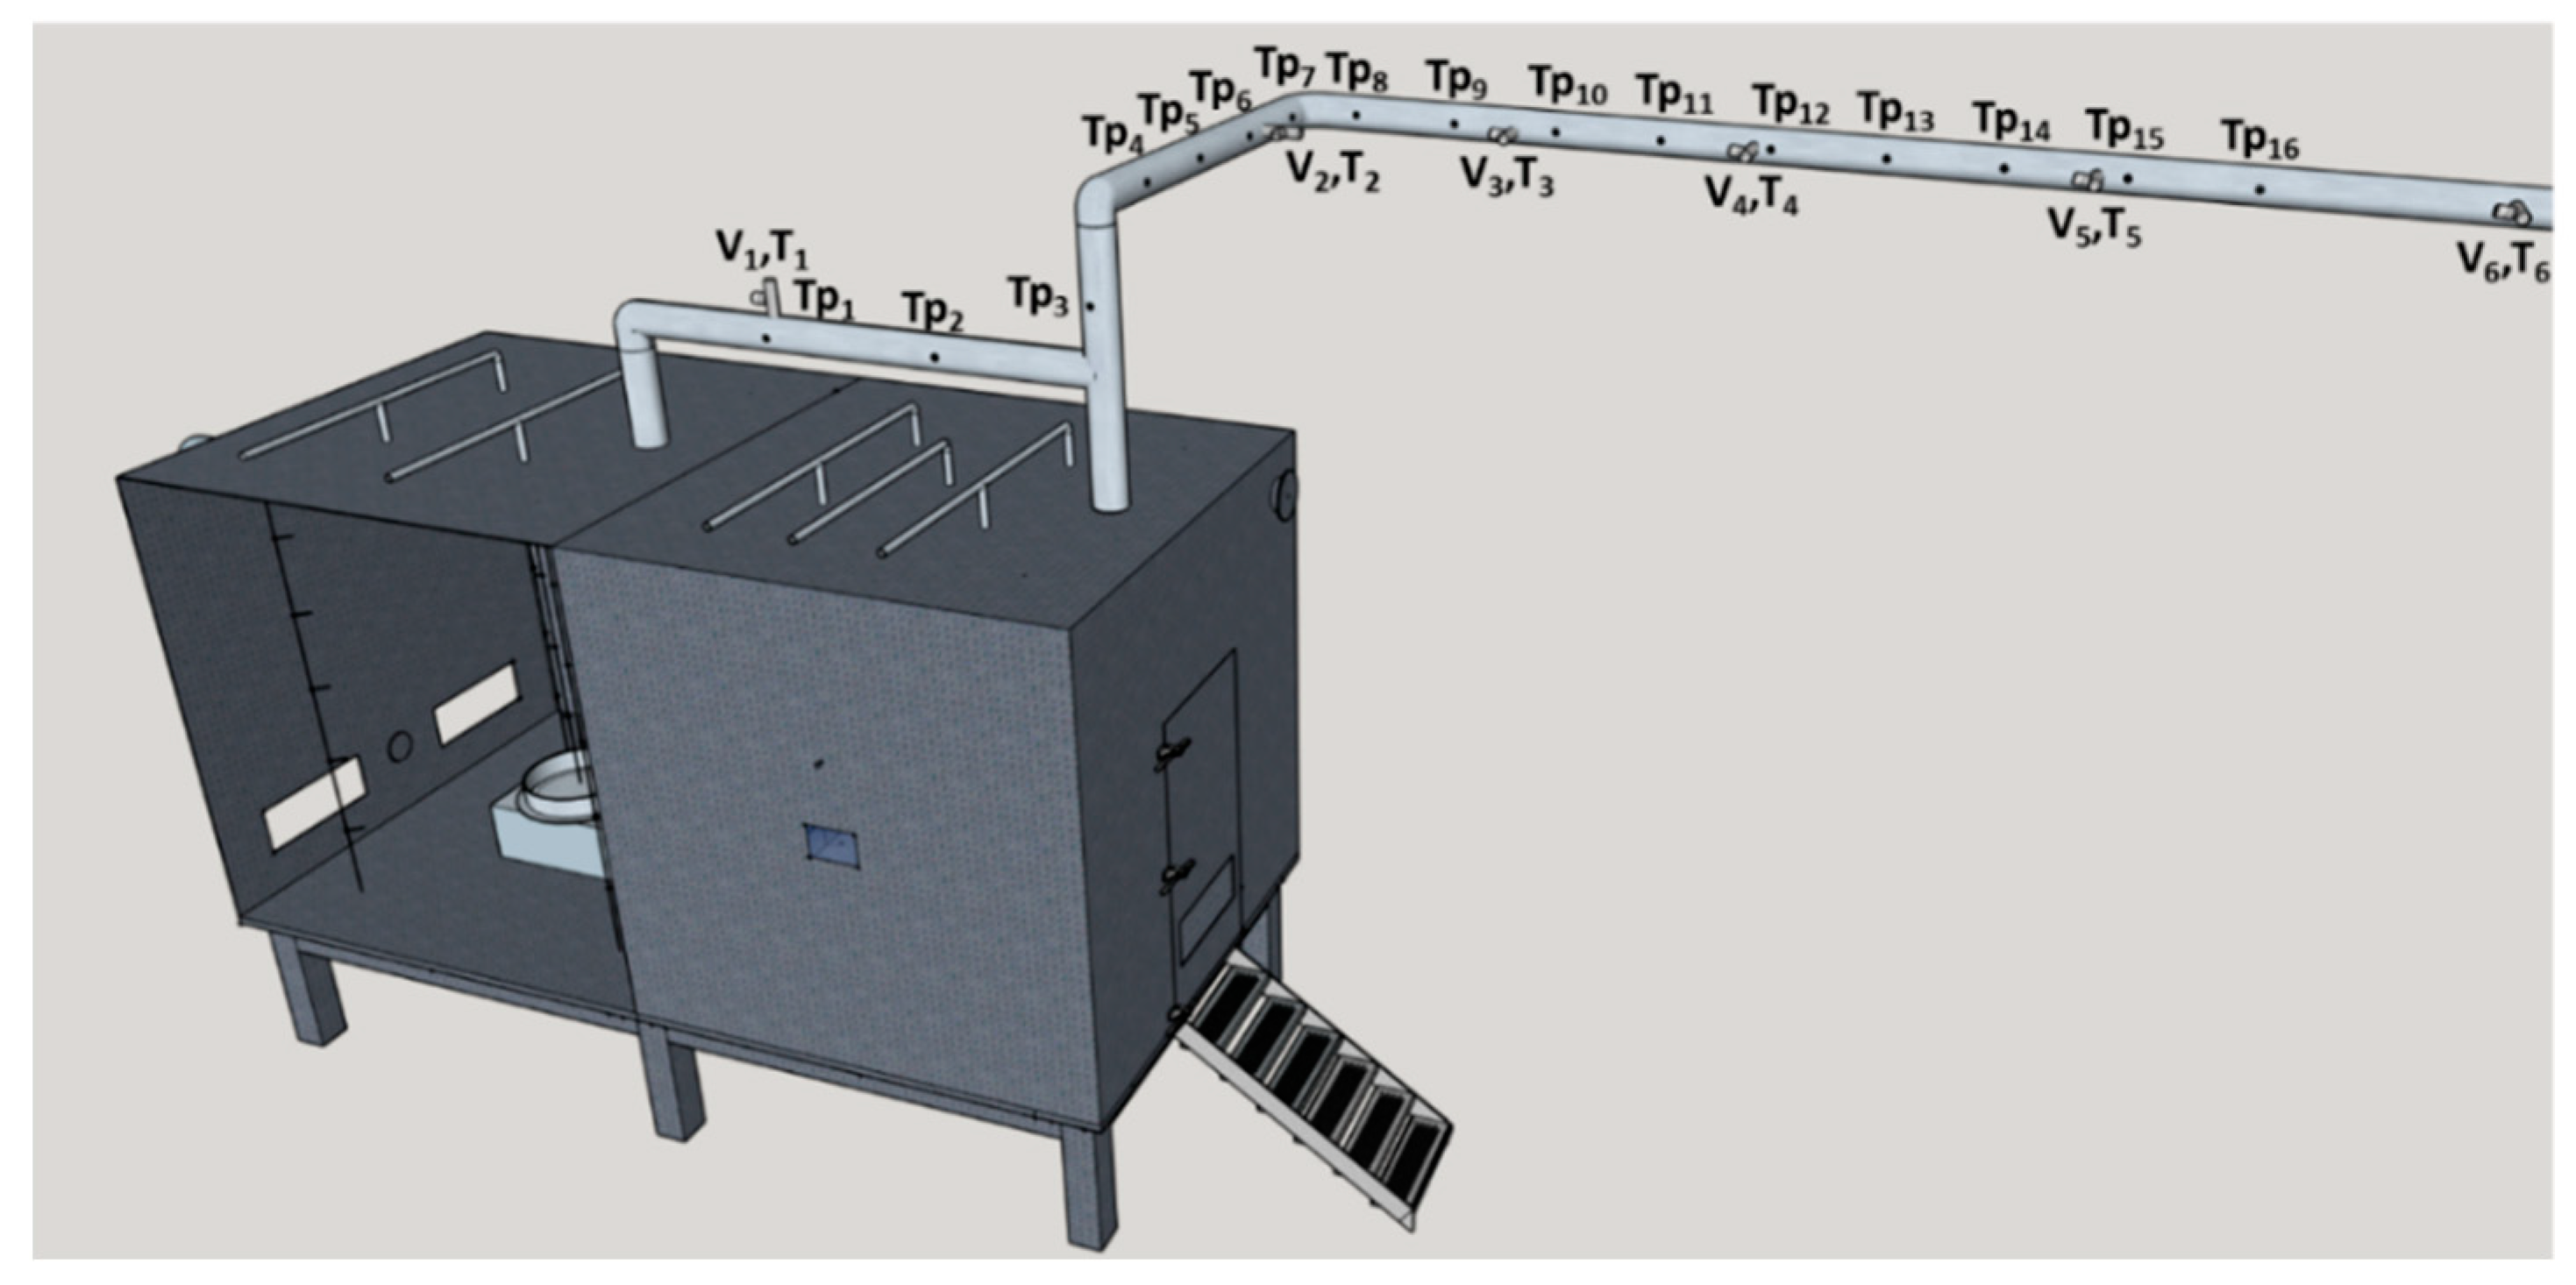
2.3. The CFD 1D Model

A one-dimensional version of the software SAFIR, a three-dimensional CFD fire compartment model developed jointly by DGA and the University of Aix-Marseille (for example [10]), is used to model the gas flow and heat transfer in a ventilation duct. It is based on the conservation laws for mass, momentum, and energy. Two different duct flow configurations are considered. In the first configuration, ventilation air is flowing through the duct, which is heated along its circumference in the fire compartment, while in the second, the hot combustion products produced in the fire compartment enter the duct and propagate heat. In the second configuration, 2D axisymmetric gas radiation (including the contribution of radiatively participating gaseous species and soot) is considered.
For model validation, eight experiments, plus replications, were conducted in the ventilation network of the DIAMAN device described in [14]. The stainless-steel duct connected to the fire compartment is 21 m long, 20 cm in diameter, and 1 mm thick. It was instrumented by placing 16 thermocouples on the outer surface of the duct, at about 1 m intervals for the measurement of the skin temperature, noted Tp1 to Tp16, and six Pitot tubes with integrated thermocouple for the measurement of the velocity and temperature of the gas in the duct, noted (V1,T1) to (V6,T6) (Figure 6).
Due to the limitations in heat release rate of the fires conducted (approximately 1.25 MW), the criteria for fire transmission through a ventilation duct, namely 340 and 550 °C, could not be met. Therefore, in the present study, we assumed that fire transmission in the compartments that are crossed by the duct occurs when the temperature of its outer face exceeds 180 °C or when the temperature of the combustion products flowing through exceeds 250 °C. A detailed description of the model and validation is given in [32].
The study case presented here corresponds to a 70 cm diameter heptane pool fire with a maximum heat release rate of approximately 1.2 MW (Figure 7a). The initial extraction rate was 36 m3/h. Experimental measurements at the inlet of the duct are used as boundary conditions (temperature, volume flow rate, and species concentrations). Figure 7b shows the predicted and measured time evolutions of the distances traveled by the 180 and 250 °C isotherms. A good agreement was obtained, as also observed for the other experiments (not shown). The model results can therefore be used to estimate the time of duct failure. For example, in the presented study case, fire transmission occurs in a target compartment located 15 m away from the fire compartment after 148 or 507 s depending on whether the ventilation duct passes through the target compartment or the hot gases flow into it (Figure 7b). The CFD 1D model is used here to determine the propensity of a fire compartment, modeled by the zone model, to transmit fire through the ventilation network.

3. Proof of Concept

A proof of concept is developed and evaluated in this section by applying the hybrid multiscale approach to fire scenarios in a four-story office building and a full-scale generic military corvette.

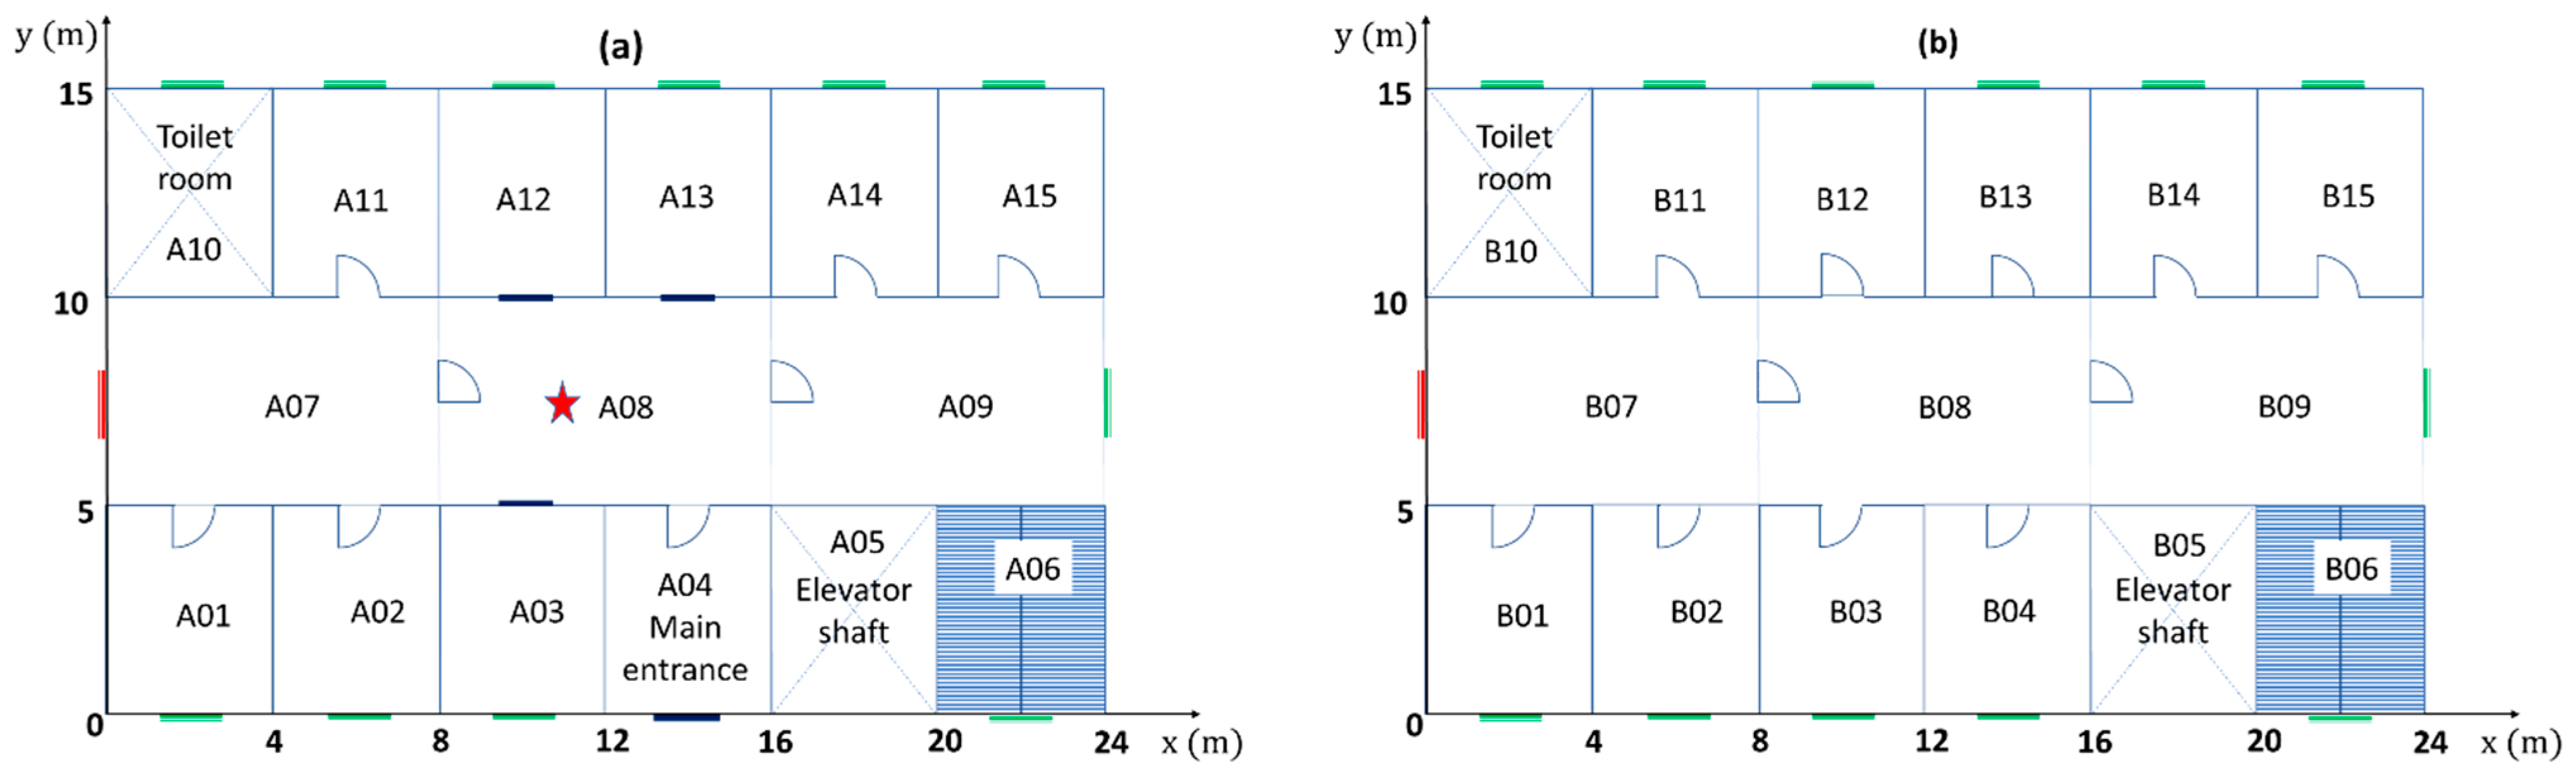
3.1. Application to a Multi-Story Office Building

The case study considered is an office building with four floors, labelled A through D, starting at the bottom. Figure 8 displays the plans of the first and second floors of the building, showing the distribution of the compartments, as well as the position and initial state (open or closed) of the doors and windows. The third and fourth floors are identical to the second floor. The building has four emergency exits that are in compartment 07 of each floor. The doors and emergency exits are 2 m × 1 m. They are fireproof and therefore do not transmit fire. Each floor has a ceiling height of 3 m and contains 15 compartments: 9 private offices of 5 m × 4 m (01 to 04 and 11 to 15), except for floor A, where compartment A04 corresponds to the main entrance; 3 co-working compartments of 5 m × 8 m (07 to 09), except for floor A, which has 2 co-working compartments (A07 and A09) and an archive and document storage room (A08, hereafter called archive room); and 3 compartments containing no combustible load, namely the stairwell (06), the elevator shaft (05), and the toilets (10). The 1 m × 2 m windows are initially closed, but the glazing can break if the fire in the compartment is fully developed. The exterior walls and floors are made of concrete and have a thickness of 15 and 10 cm, respectively. They are insulated by a lining combining a plasterboard BA13 that is 1.25 cm thick and a rock wool panel that is 6 cm thick. The inside partitions are made of a 10 cm thick BA13/rock wool/BA13 complex.
Two test cases are presented depending on whether the emergency exits are closed or open. For both cases, the fire starts in compartment A08. At this moment, it is assumed that the ventilation is cut off in the whole structure.
The building consists of empty (no fuel load) compartments and compartments where a wide variety of combustible materials can be found, such as wooden furniture, computer equipment (e.g., computers, printers), upholstered chairs or benches. To represent this diversity, the fuel in a room is assumed to be a mixture of up to three components: pine wood, a thermoplastic polymer—the poly (methyl methacrylate) or PMMA, and a polyurethane (PU) foam, the distribution and loading of which differ depending on the compartment type. Table 1 gives information on the fuel components present in the three types of compartments and the values of the parameters needed to construct the prescribed HRR time curve in each compartment type using the scaling procedure (see Section 2.2) and the strategy presented in [14] for compartments where multi-fuel combustion occurs. The parameter values are evaluated from tests performed in the DIAMAN device [14] and office building visits. The fire load values are lower than those recommended by EN 1991-2-2 [33]. They match better with localized fires, where only a limited area of the fire load in the compartment is involved in fire. The design fires of the three types of compartments are shown in Figure 9.

3.1.1. Zone Model Results

As mentioned earlier, the zone model was beforehand used to simulate the development of a fire in each compartment [14]. Table 2 gives the thermal properties of the materials making up the walls and partitions of the building. Given the geometry, fuel load, and ventilation conditions, eight separate compartment fire scenarios were investigated (Table 3). Table 3 presents the results obtained with the zone model, in terms of times of flashover, decay, and extinguishment. For all simulations, the time step was 50 µs. A run for the simulation of 1 h of fire takes less than 2 CPU minutes on a PC with Intel® Core i7-4770 (3.40 GHz) and 16 GB RAM.
The first two fire scenarios correspond to a private office with a window that can be initially closed or opened (due to glass breakage by external flames) when the fire starts in the compartment. As expected, ventilation conditions influence the onset of flashover. When the window is initially open (FS2), the burning compartment does not reach the flashover, due to energy losses through this opening. In the opposite case (FS1), flashover occurs after 7′49″ of fire. The same result is found when comparing the simulation results for fire scenarios in co-working spaces. When the compartment has no window (FS3) or when it is initially closed (FS4), the fire is fully developed after 9′20”. When the window is initially open (FS5) or when the compartment has six doors open (FS7), flashover does not occur. Again, smoke evacuation through the openings generates heat losses that limit the temperature rise of the gas in the hot gas layer. Although the co-working spaces are twice as large as the private offices, the flashover, decay, and extinguishment times in these compartments are quite similar (9′20″ vs. 7′49″, 10′00″ vs. 9′20″, and 28′11″ vs. 29′00″, respectively). FS7 corresponds to the archive room. Despite the large area of openings, the high fuel load accounts for the onset of flashover, but later than for the other room types, after 18′46″ of fire.
For each of the cases studied, the zone model provides information on the time evolution of the smoke leaving a fire compartment. As an example, the results obtained for the archive room are presented in Figure 10. After approximately 20′ of fire, the smoke mass flow rate is maximal, at 3.5 kg/s, and then it decreases progressively in the decay phase of the fire (Figure 10a). The time evolution of the smoke temperature, which corresponds to the gas temperature in the hot layer, is given in Figure 10b. The temperature of 550 °C, at which flashover occurs, is reached 18′46” after the fire starts. The smoke temperature then continues to increase up to 578 °C, after 20′, before decreasing. The smoke density versus time curve (Figure 10b) nearly follows the gas temperature curve. At the time of maximum gas temperature, the smoke density reaches a minimum of about 0.4 kg/m3. It then increases in the decay phase of the fire due to the supply of fresh air through the openings and the decrease in gas temperature.

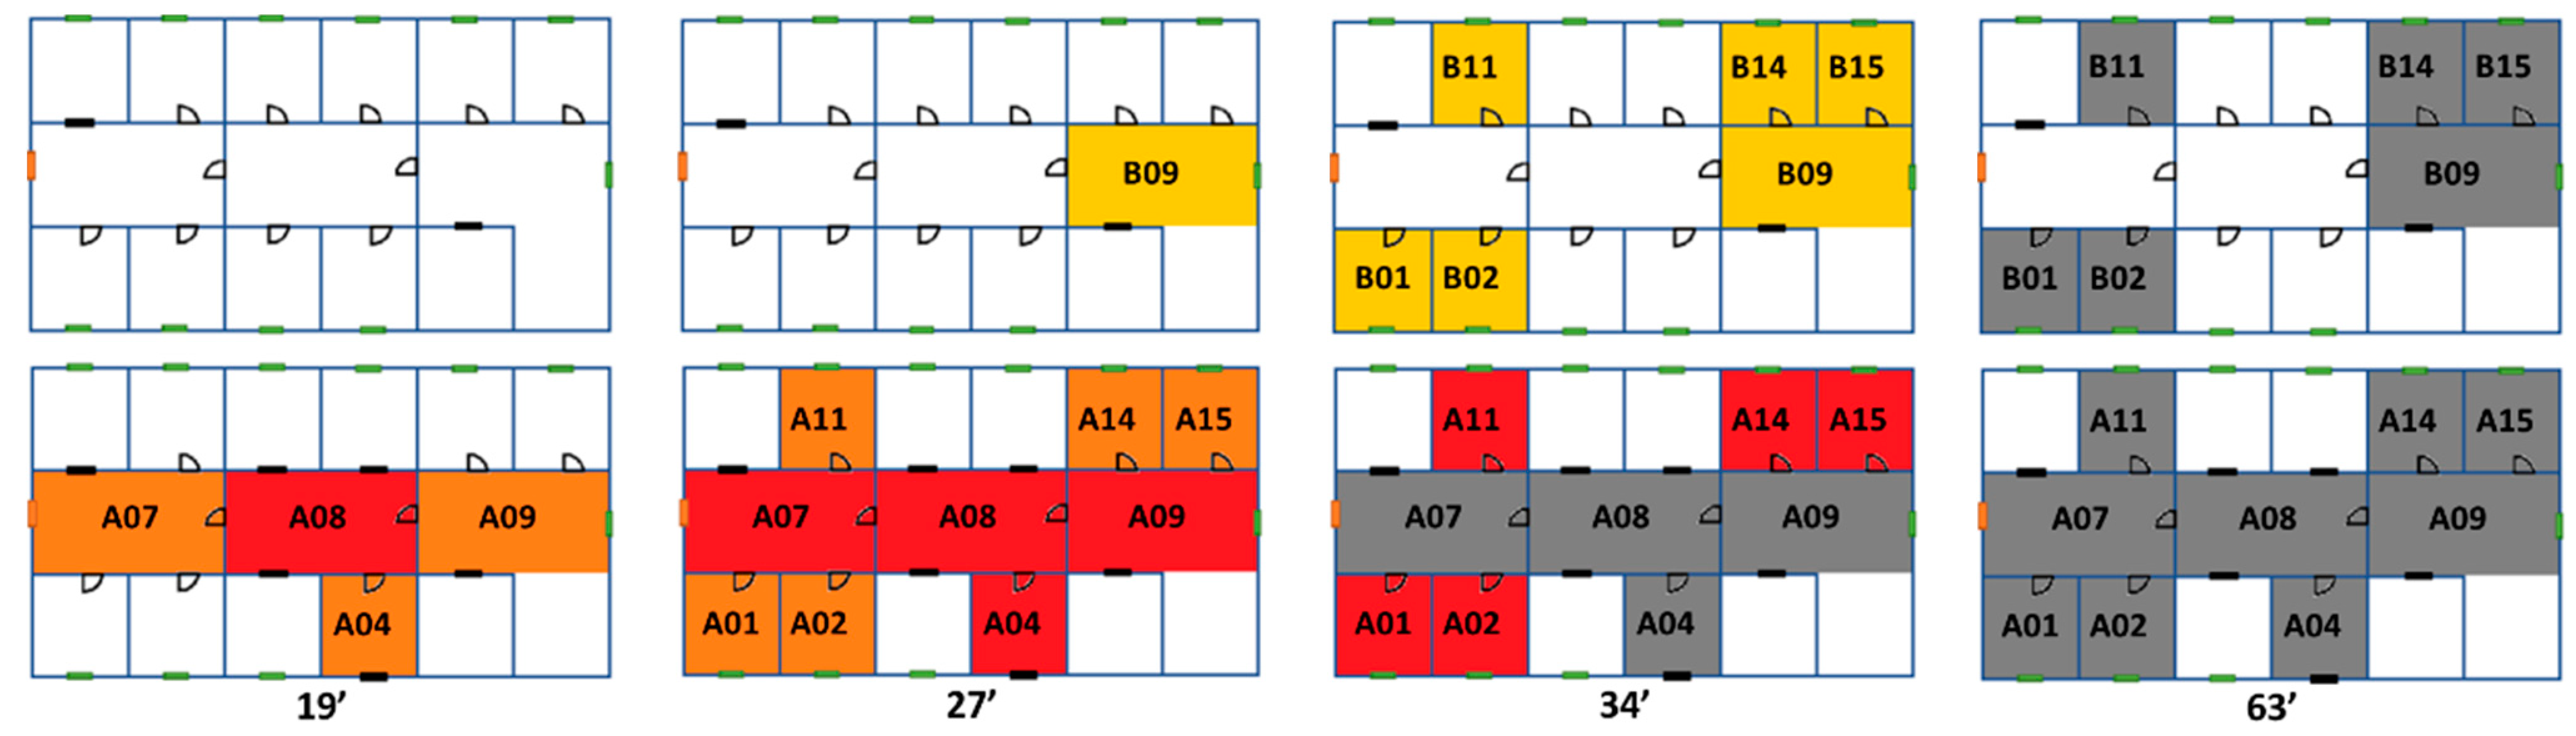
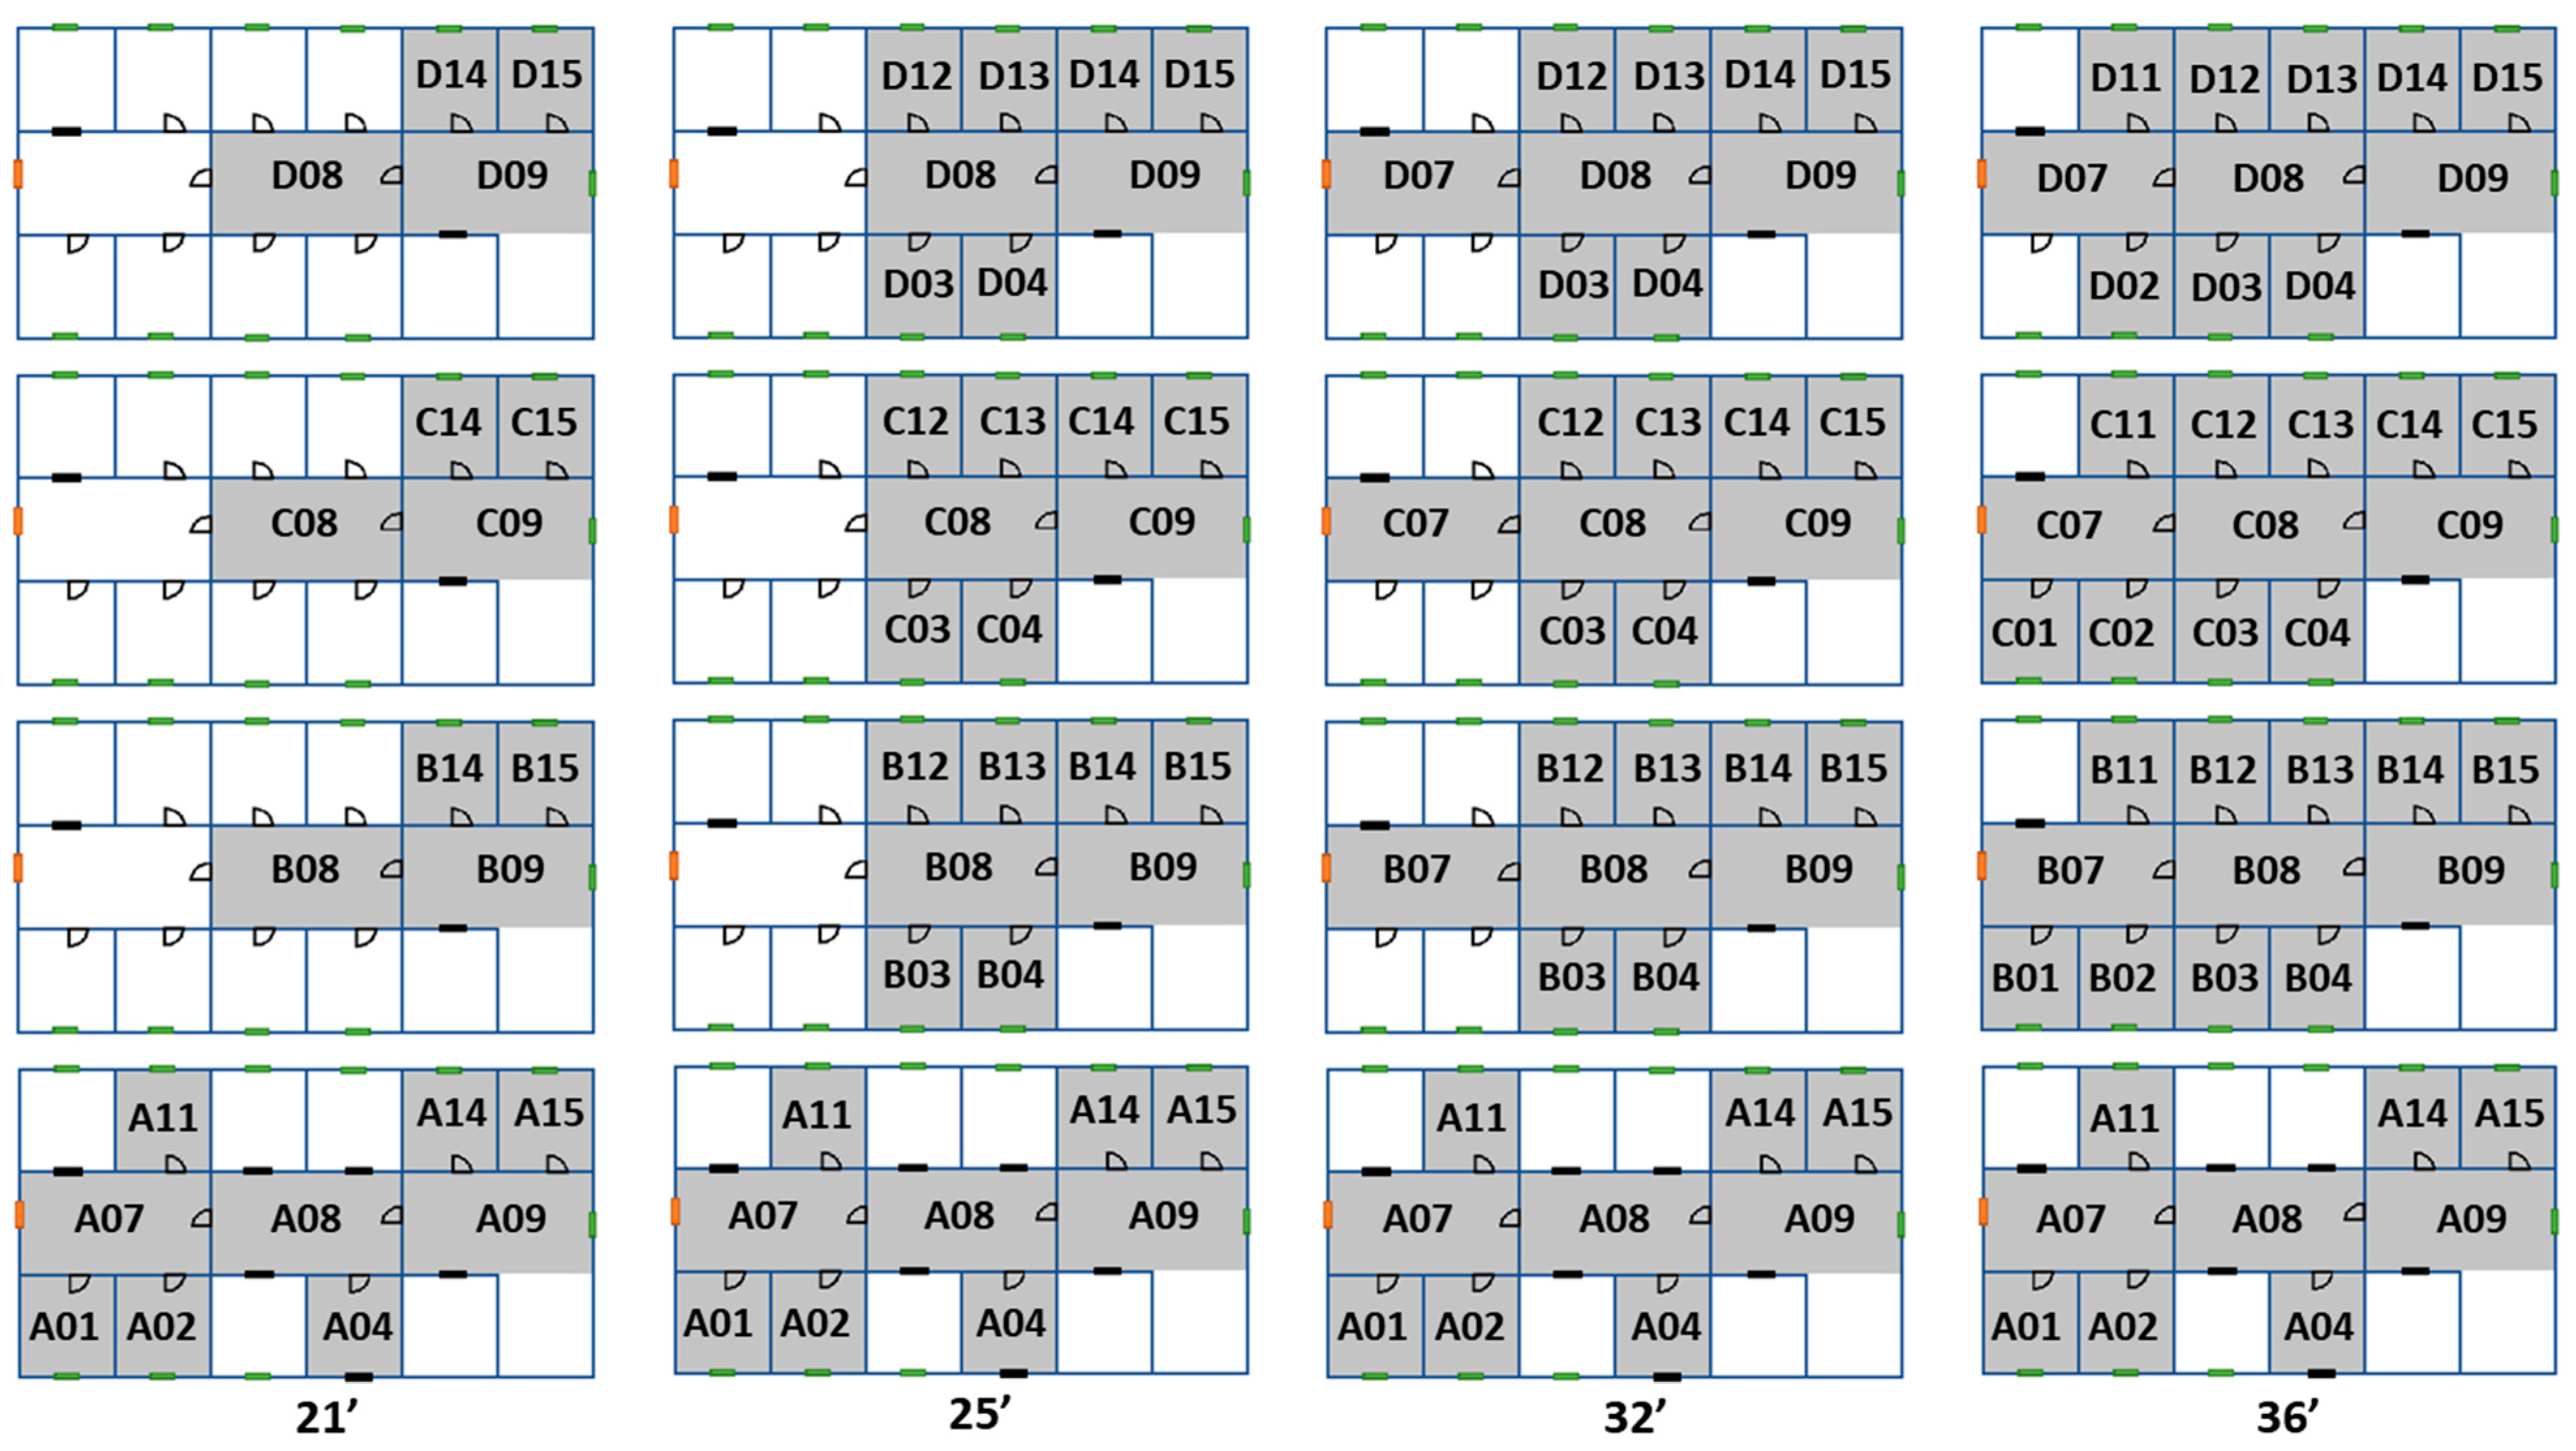
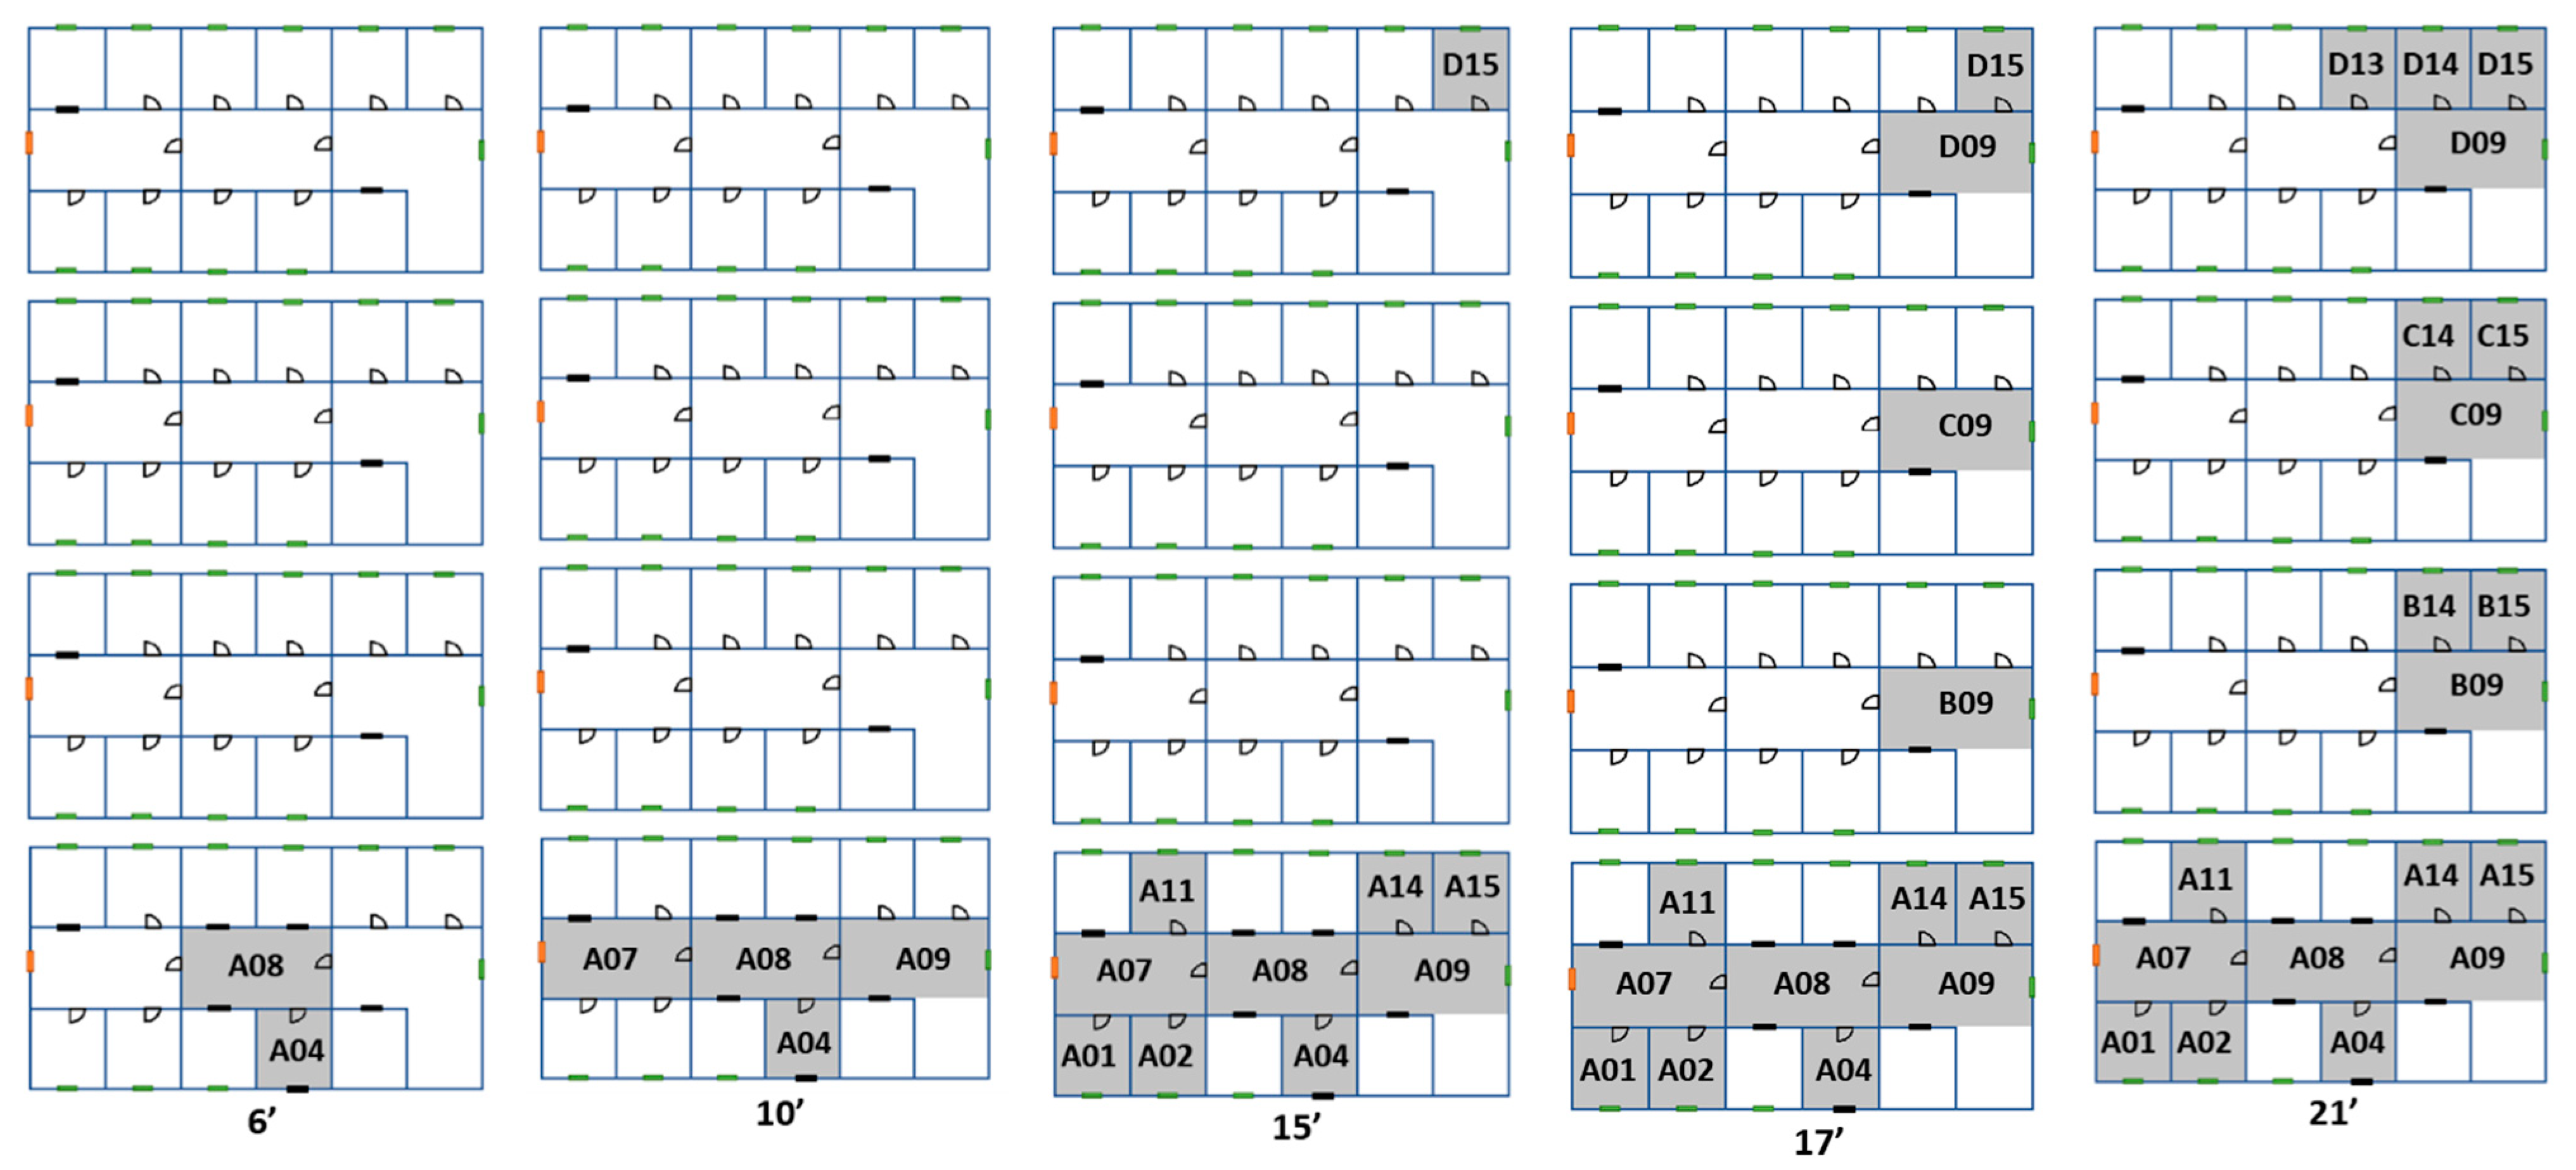
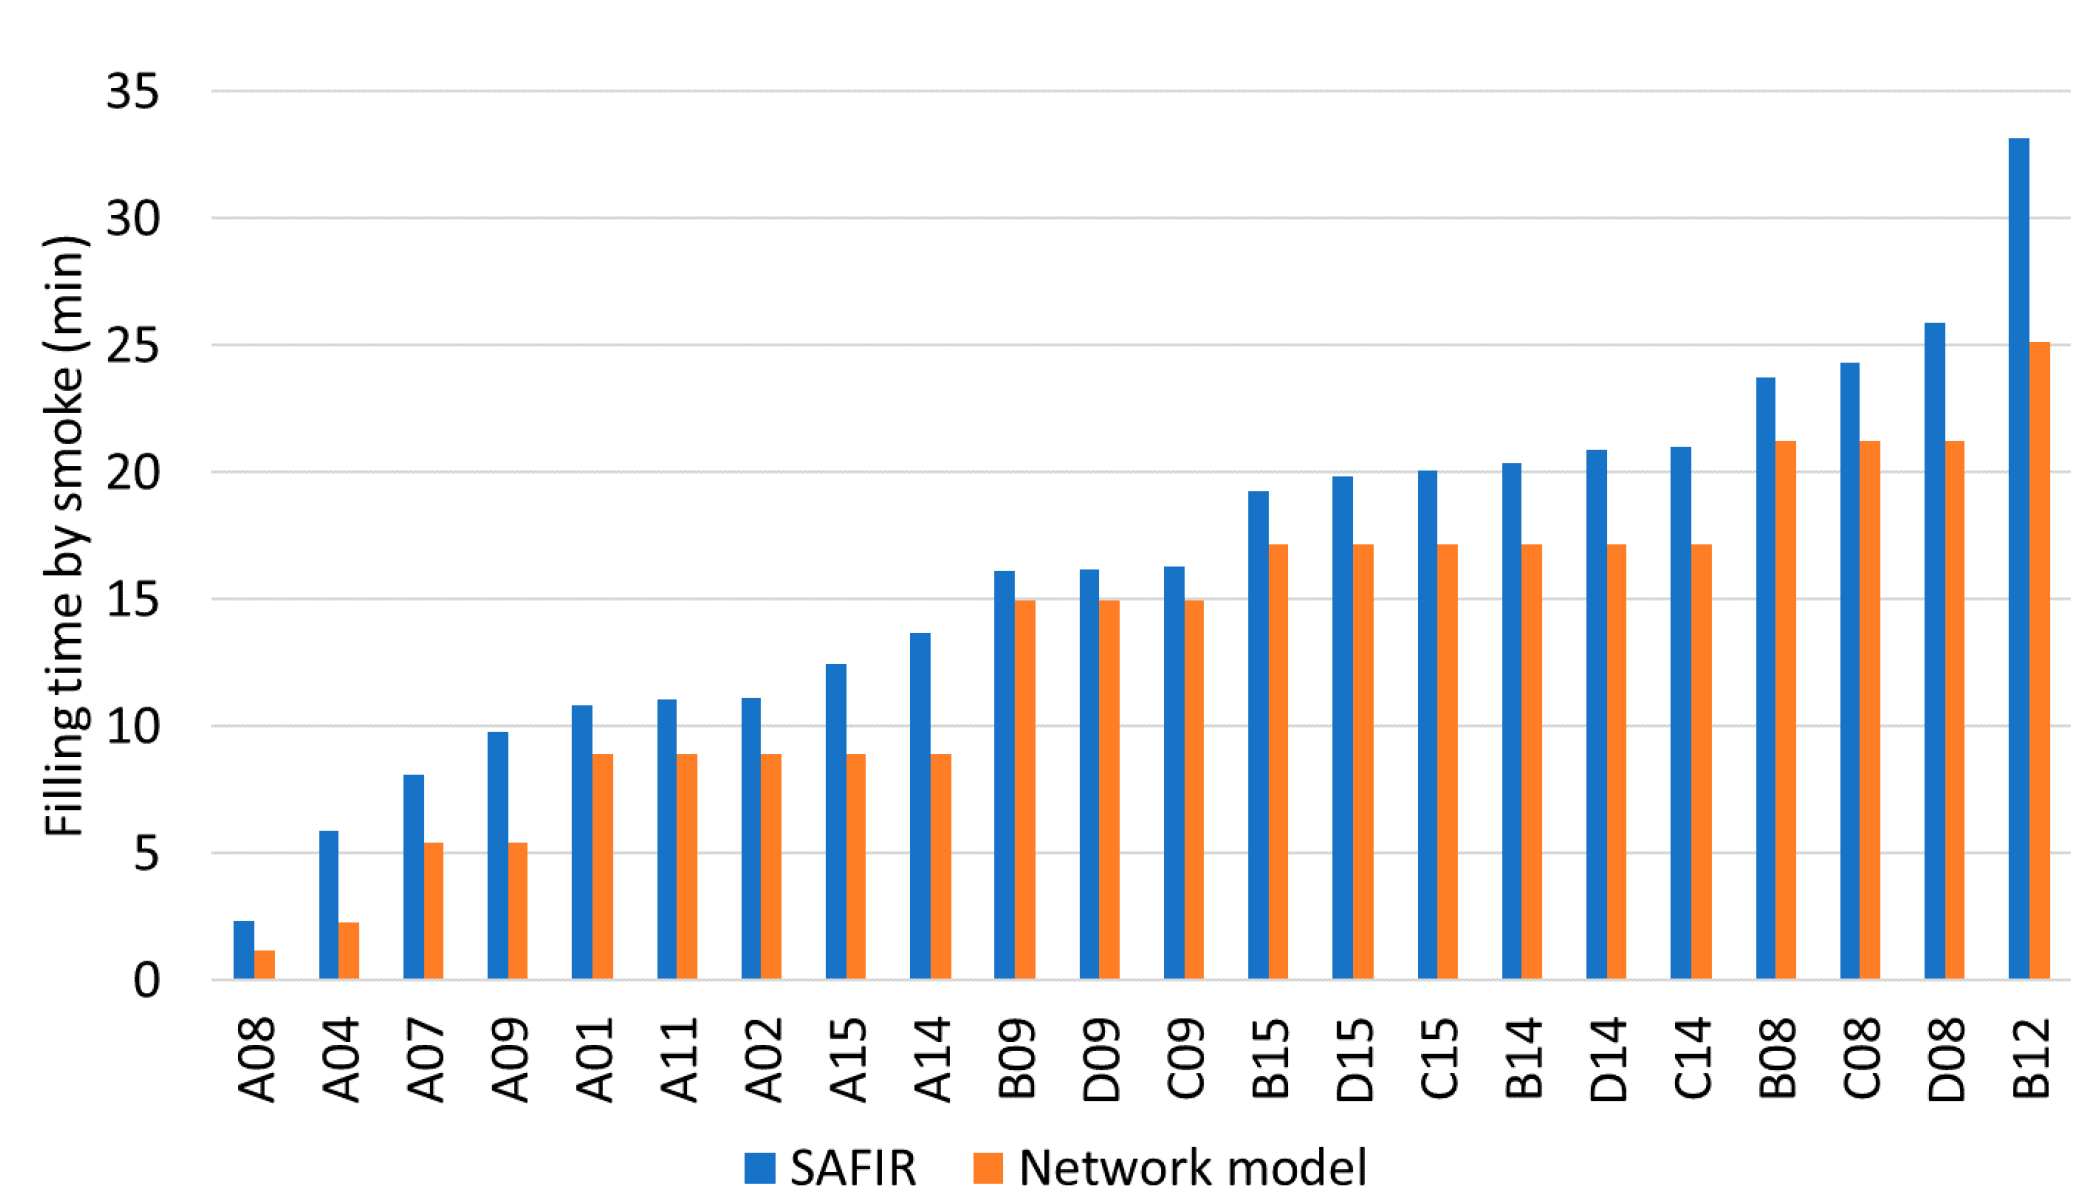
3.1.2. Network Model Results

The network model was applied to two different fire scenarios. In average, a run takes a few CPU seconds on a 3.40 GHz/16 GB RAM PC.
First fire scenario
For this fire scenario, the emergency exits are closed. Table 4 and Figure 11 show the chronology of the fire, where the origin of the time corresponds to the ignition of compartment A08. First, the fire spreads both through both openings (e.g., from A08 to A04) and exterior windows (e.g., from A01 to B01). The compartment of fire origin A08 reaches the flashover after 18′ of fire. Compartments A04, A07, and A09, which are connected to it by an open door, also ignite within one minute. After reaching the flashover, these compartments spread the fire to the remaining compartments on the second floor (A01, A02, A11, A14, and A15). After 27′ of fire, all the sensitive compartments on floor A with at least one open door ignite. They experience a fully developed fire 6′ later. As soon as the flashover occurs in A09 (at 27′), all conditions are met for the fire to spread from the outside of the building to compartment B09 on the second floor. Seven minutes later (at 34′), the same phenomenon allows for the fire transmission to compartments B01, B02, B11, B14, and B15. Out of the six affected compartments on floor B, none of them reaches flashover. In 34′, the fire spread to 15 rooms on the first two floors of the building. Of these 15 rooms, 9 reach the flashover. After 63′, the fire is extinguished.
Figure 12 shows how smoke fills the building over time. The smoke first spreads horizontally through floor A, filling the compartments adjacent to the fire source compartment (A07, A09, and A04), and then the neighboring compartments (A01, A02, A14, and A15), after 6′ and 10′ of fire, respectively. The smoke then reaches the upper floors through the stairwell and simultaneously fills compartments 09 of floors B to D in 15′, then compartments 13 and 14 in 17′. From 21′ onwards, compartments A04, A07, and A08 ignite and the smoke they generate is added to that of compartment A08. Compartments 03, 04, 11, and 12 are filled with smoke after 25′, co-working spaces 08 after 32′, and finally private offices 01, 02, and 11 after 36′. In 36′, the smoke fills the entire available space, i.e., 49 rooms on the four floors.
In order to evaluate the reliability of the results obtained with the simple smoke filling model, the transport of smoke was also simulated using the 3D CFD software SAFIR, validated for many fire scenarios (see for example [10]). The simulation covered the first 21′ of fire, before the transmission of the fire to the adjacent rooms of compartment A08. Figure 13 shows the smoke concentration field after 15′ of fire.
The filling chronology of the building predicted by SAFIR is given in Figure 14. This chronology is relatively close to the one determined by the network model (Figure 12). The smoke first fills floor A, in less than 15′, and then moves towards the stairwell (A06). The filling of the upper floors (B, C and D) starts with room D15 in 15′ and then is simultaneous for rooms 09 of floors B to D (17′). Note that the filling of floor D earlier than that of floors B and C is due to gravity, as well as the size and configuration of the building. The hot smoke rises to floor D and accumulates there before filling floors B and C almost simultaneously. For a taller building, the smoke would have cooled more before reaching the top floor, likely promoting the filling of the intermediate floors. Before the ignition of rooms A04, A07, and A08, 18 rooms are filled with smoke up to 1.80 m above the floor.
As assumed in the simple filling model, rooms fill up one after the other up to the height of the soffits, and then spread the smoke to adjacent compartments. When a room is connected to several rooms by a door (e.g., A08), the smoke is distributed evenly, and in the case of a connection through a horizontal opening (here, the stairwell), all connected upper rooms fill almost simultaneously.
The histogram in Figure 15 compares the filling times obtained with the network model and SAFIR. The network model slightly underestimates the filling times, i.e., the rooms fill up faster. In the CFD simulation, the smoke tends to accumulate on the second floor, to the detriment of the upper floors. One of the reasons for these discrepancies is that the correlation of Bailey et al. [29], validated on corridor fires, is not fully adapted to the configuration of the building. With the network model, the smoke does not cool fast enough, which accelerates the successive filling of the rooms. However, the comparative analysis shows a satisfactory agreement, in terms of chronology and filling times, with an average deviation of approximately 3′.
Second fire scenario
When the emergency exits are open, the propagation of smoke is influenced by the ventilation. The smoke filling chronology obtained with the SAFIR code in this configuration is shown in Figure 16. It differs significantly from that obtained when the emergency exits are kept closed (Figure 13). The first rooms to be filled are the archive room A08 and the main entrance A04, after 6′ of fire. After 15′, the smoke fills the offices A14 and A15, it circulates to the upper floors and invades the co-working spaces C09 and D09. From 17′ onwards, a difference in filling between the four floors of the building can be noticed. The smoke invades first the spaces on floors C and D (D08, C14, C15, D14, and D15), while the filling of floor B just starts (B09). The co-working spaces A07 and A09 are filled with smoke. After 21′, the difference in filling between the different floors is obvious. Floors A and D have almost finished filling, with 6 and 7 rooms filled out of 12, respectively, 4 for floor C and only 2 on floor B. The interaction with ventilation modifies the transport of smoke and therefore the filling of the rooms. The smoke is transported in priority to floors C and D, which slows down the filling of the other floors, and in particular floor B. In addition, the openings to the outside cause a loss of smoke flow, which escapes through the emergency exits. The histogram in Figure 17 allows us to compare the results obtained with the network model and SAFIR. The differences between the two models are more marked than for the first scenario. The opening of the emergency exits modifies the path taken by the smoke, which circulates in priority towards floors C and D, which the network model cannot consider. It underestimates the filling times, especially for rooms A09 and A07 on floor B. In other words, the simple filling model shows its limits when the ventilation conditions create a strong interaction between the fire and the complete system [1].

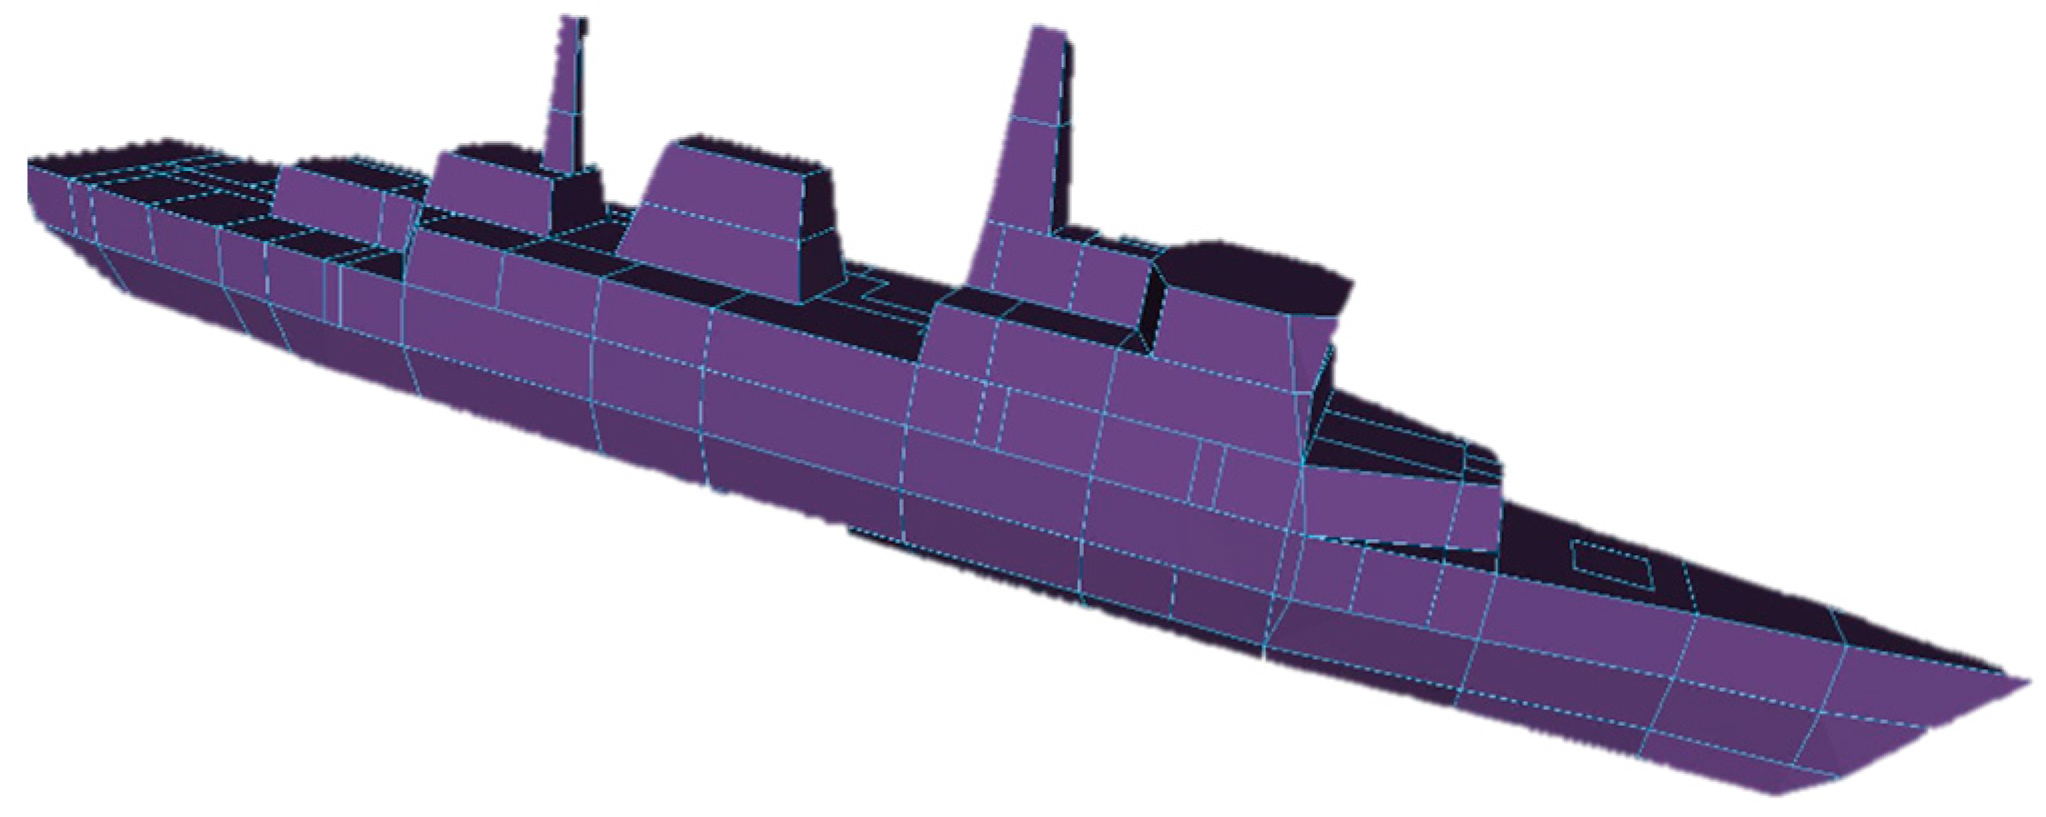
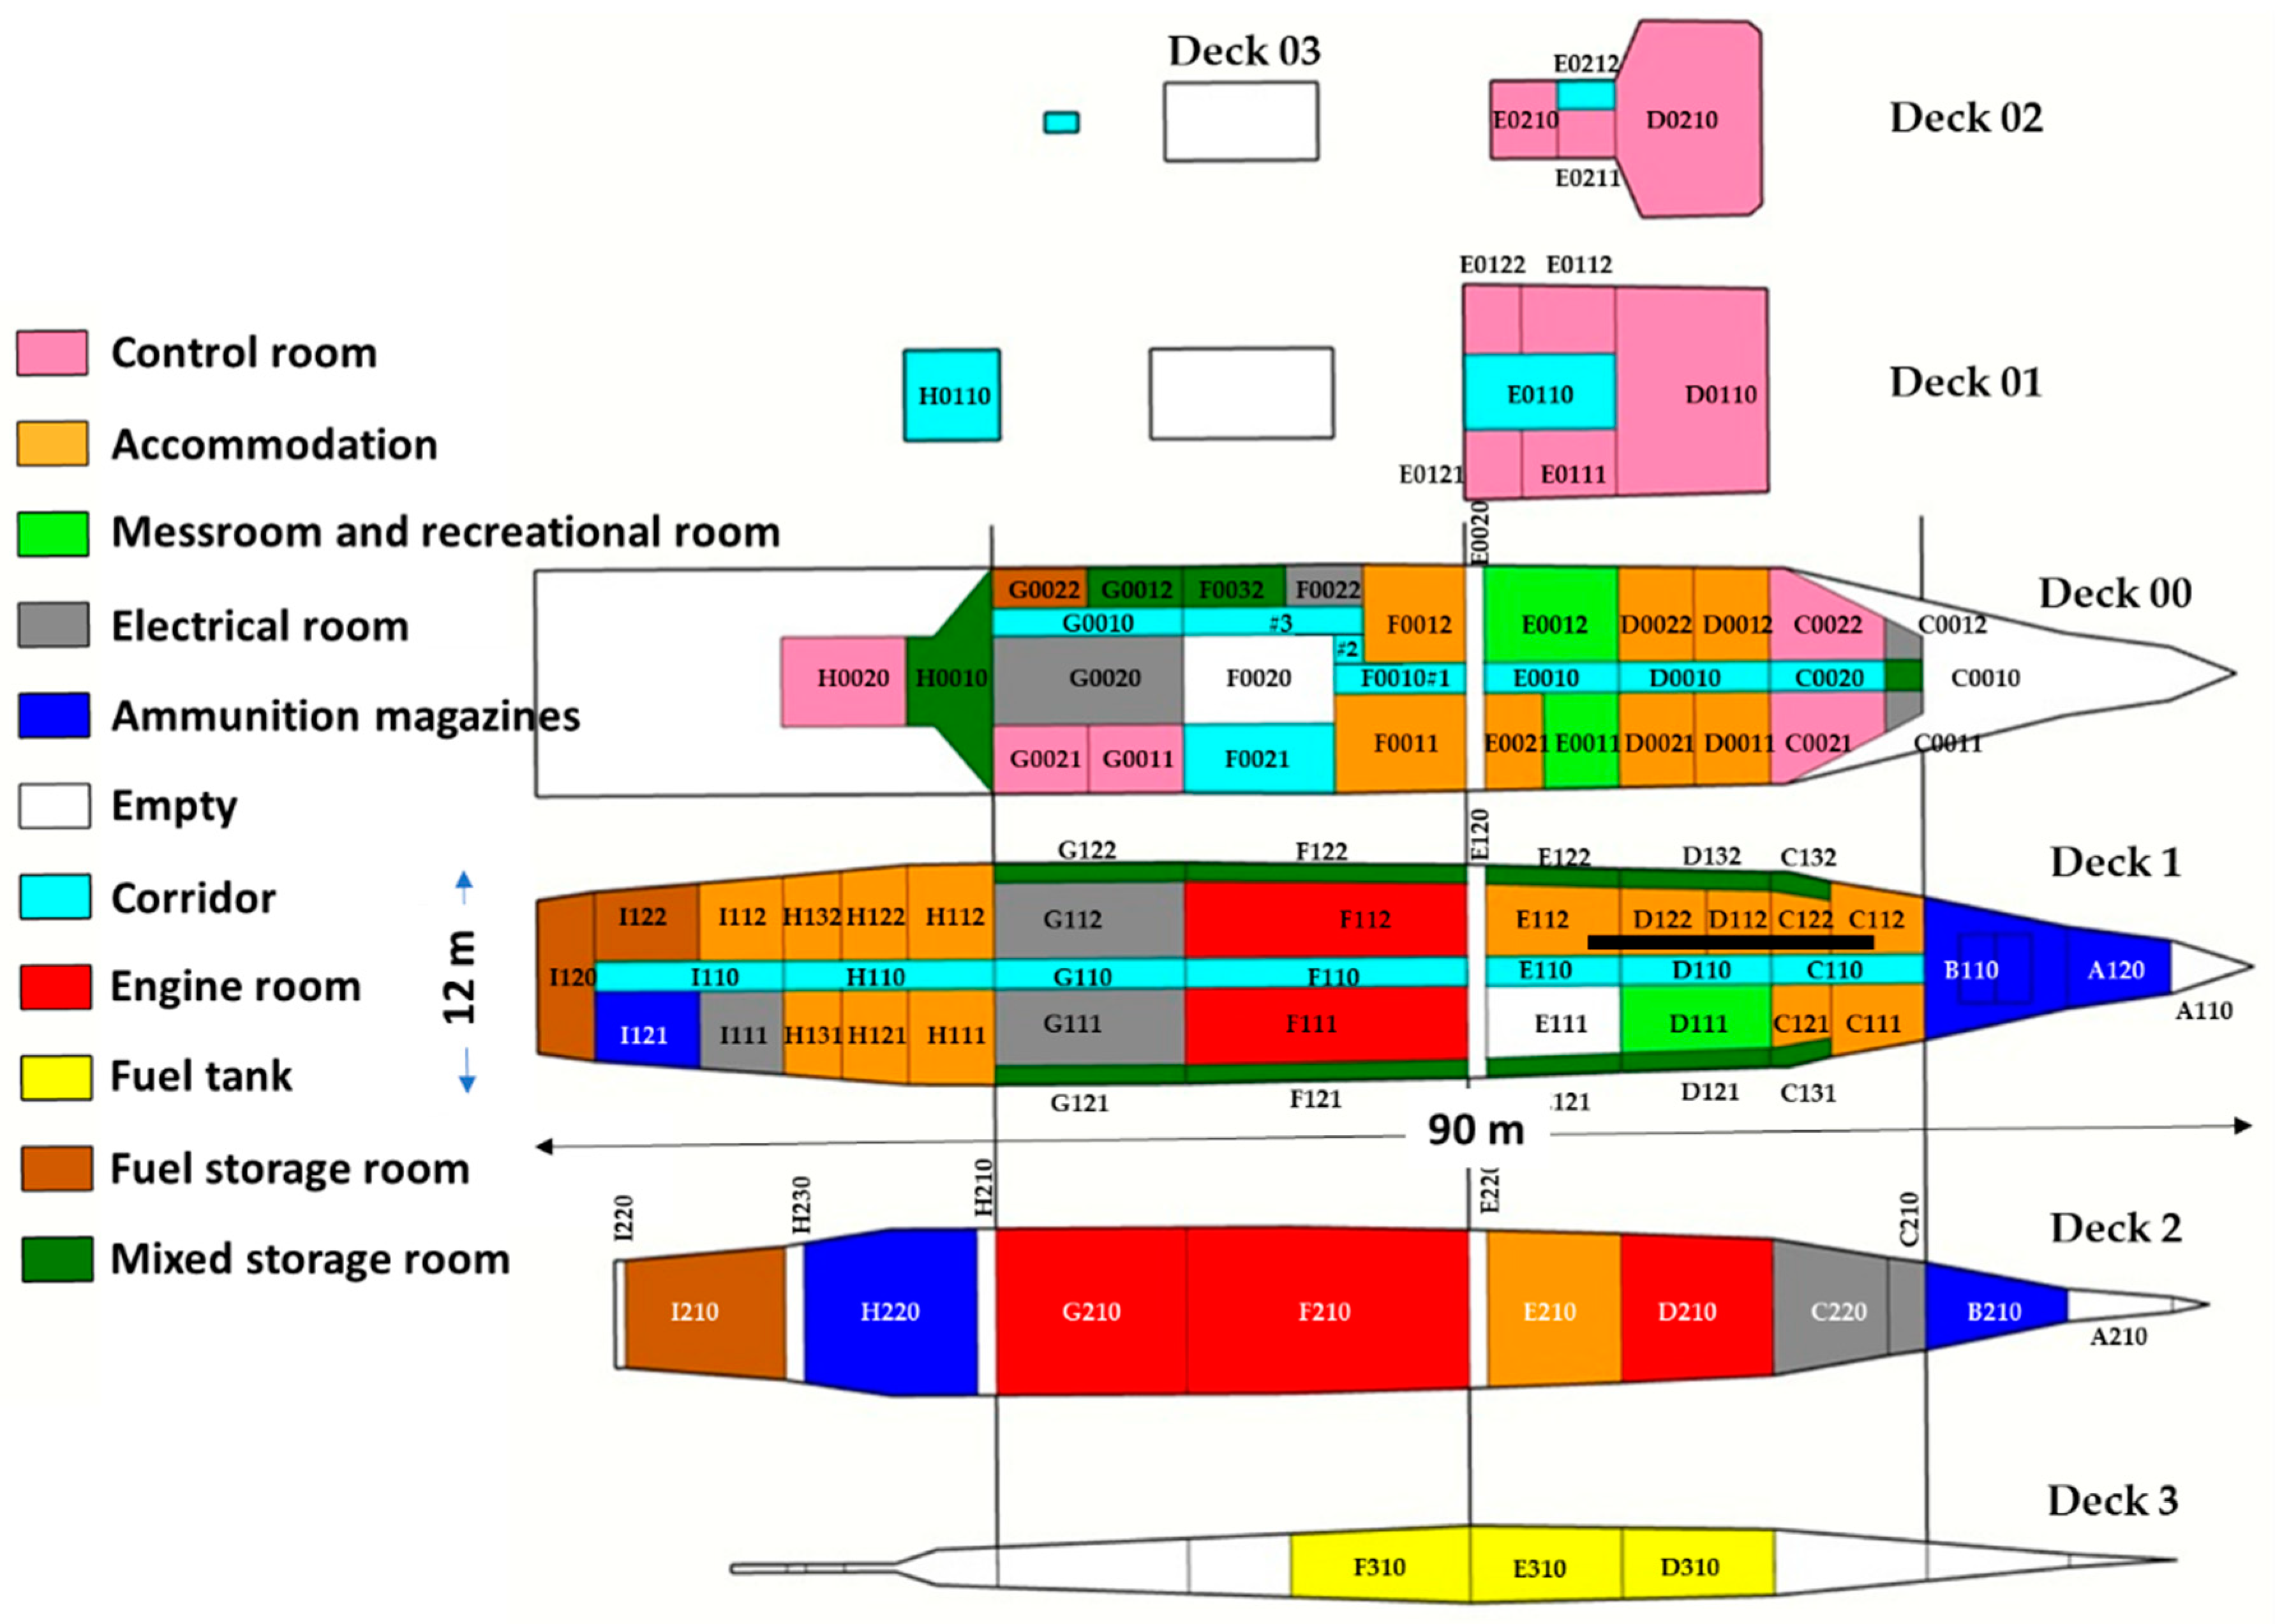
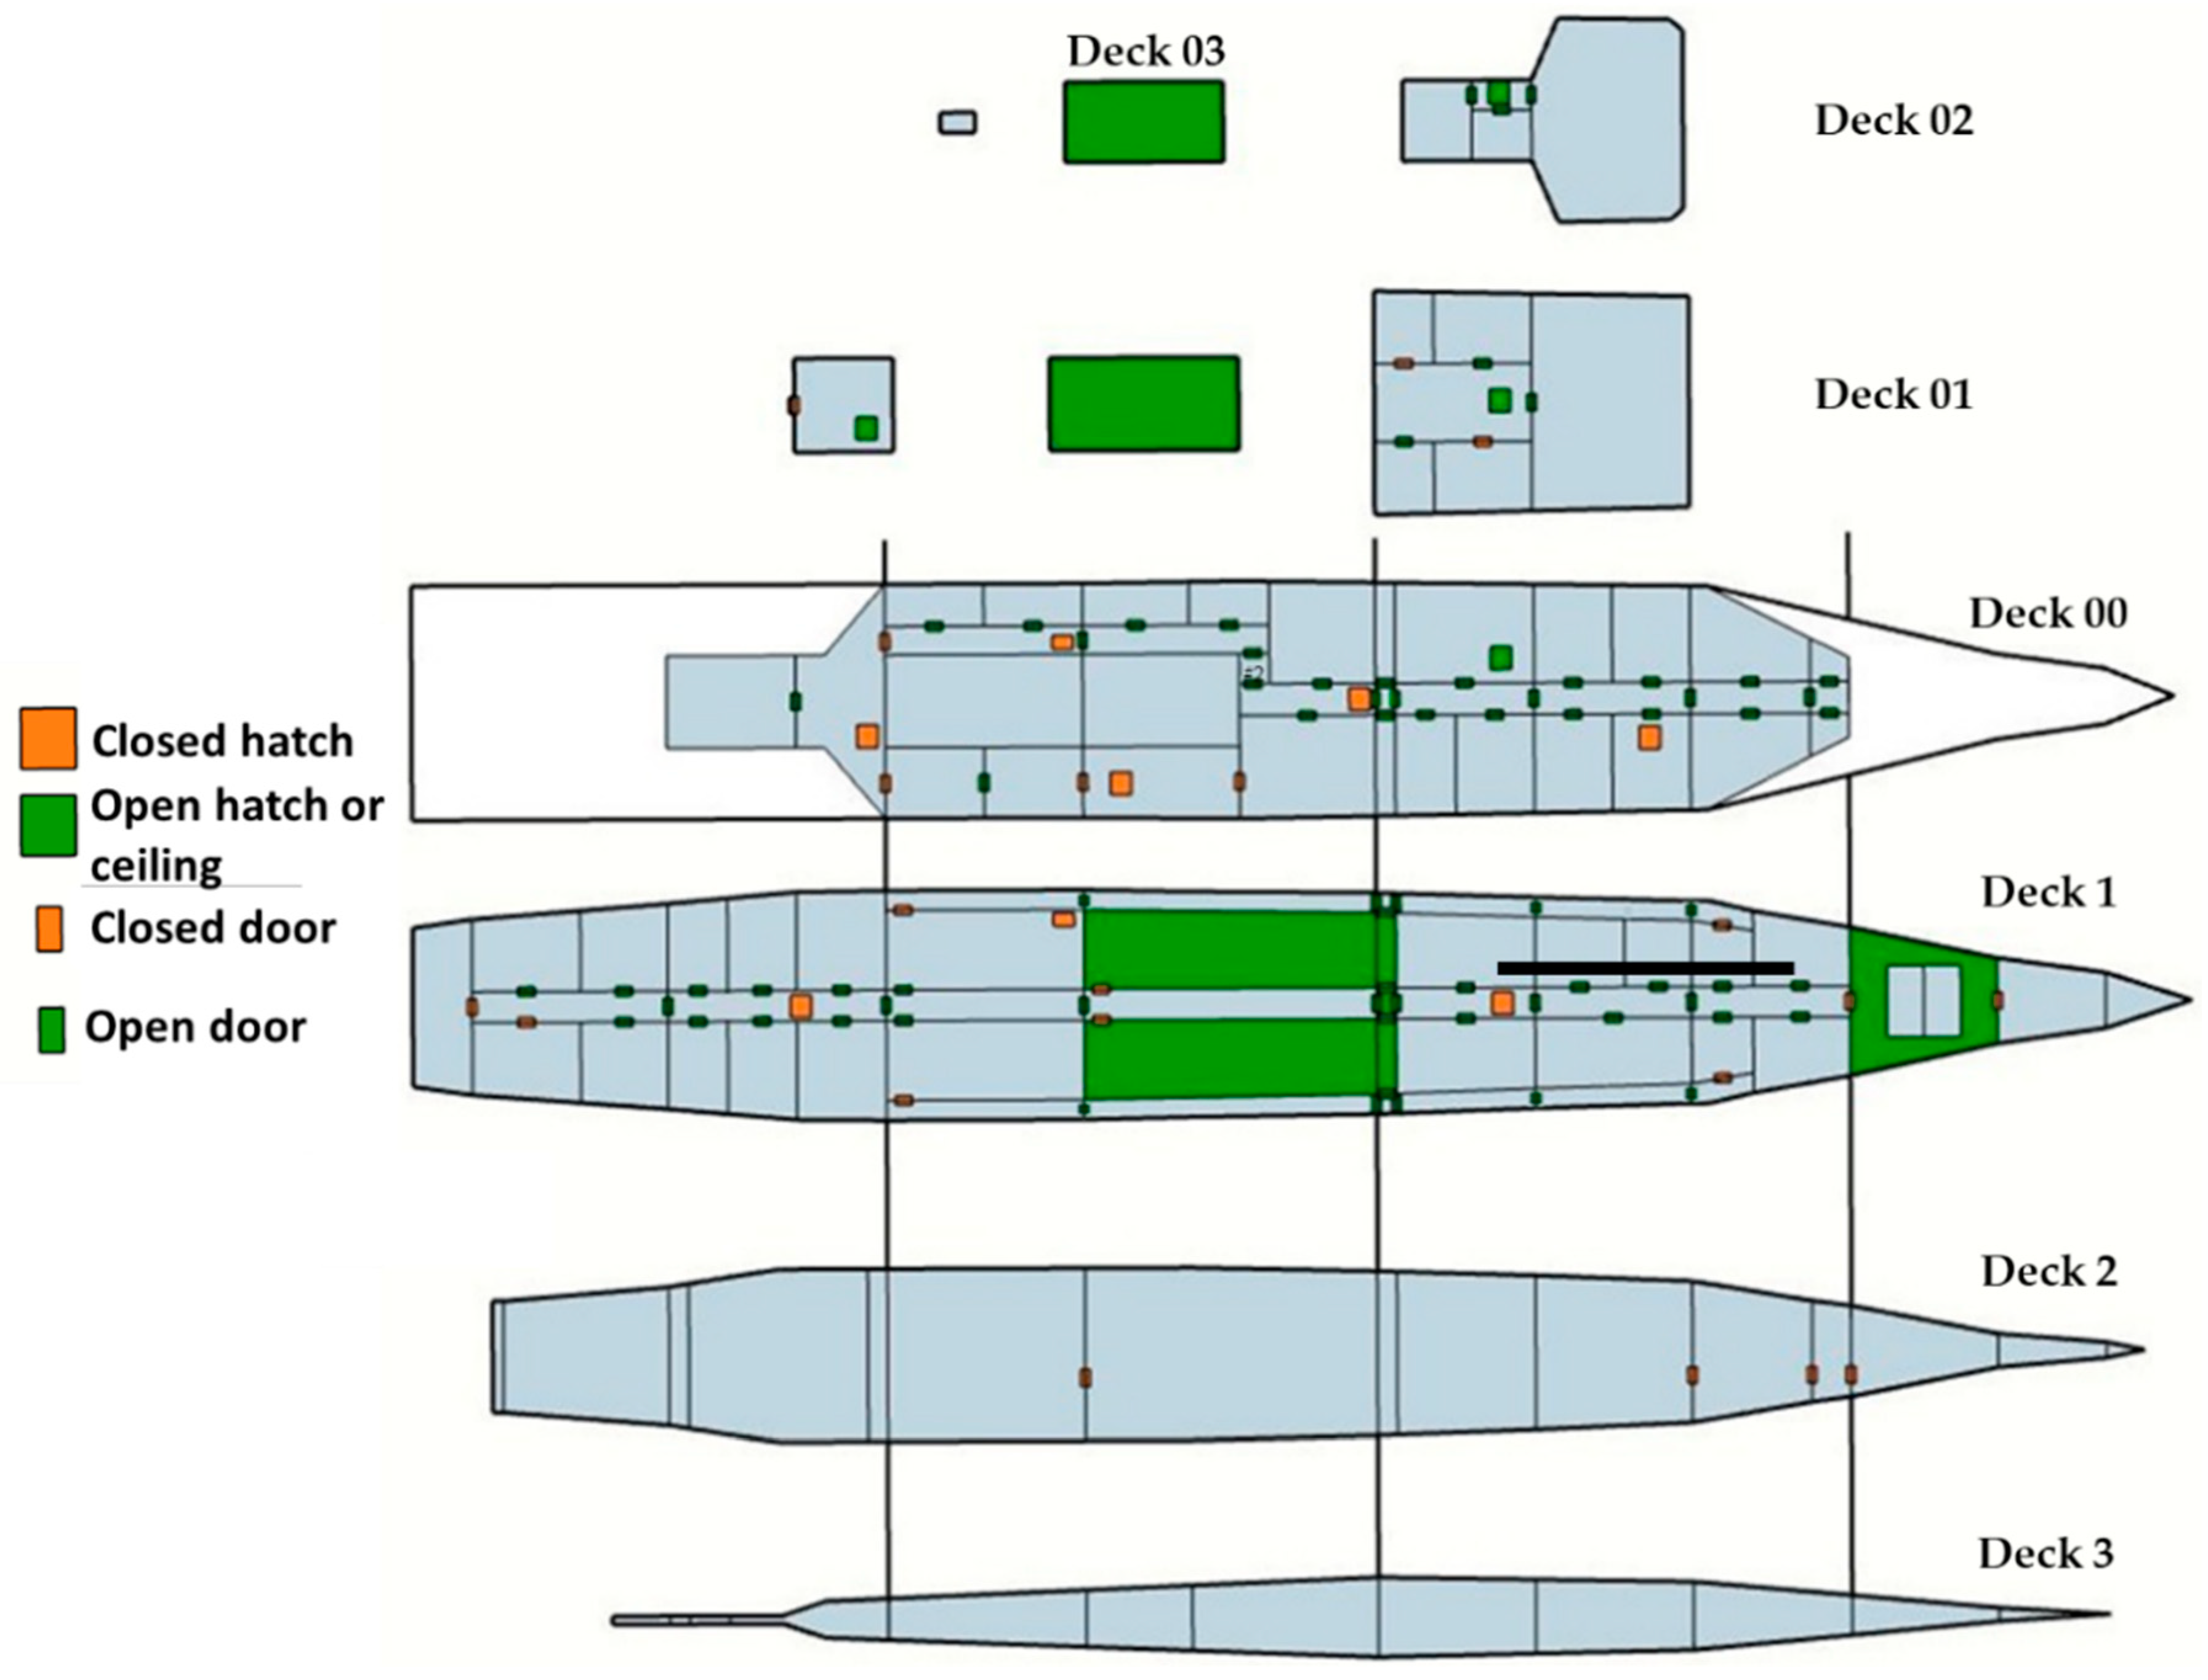
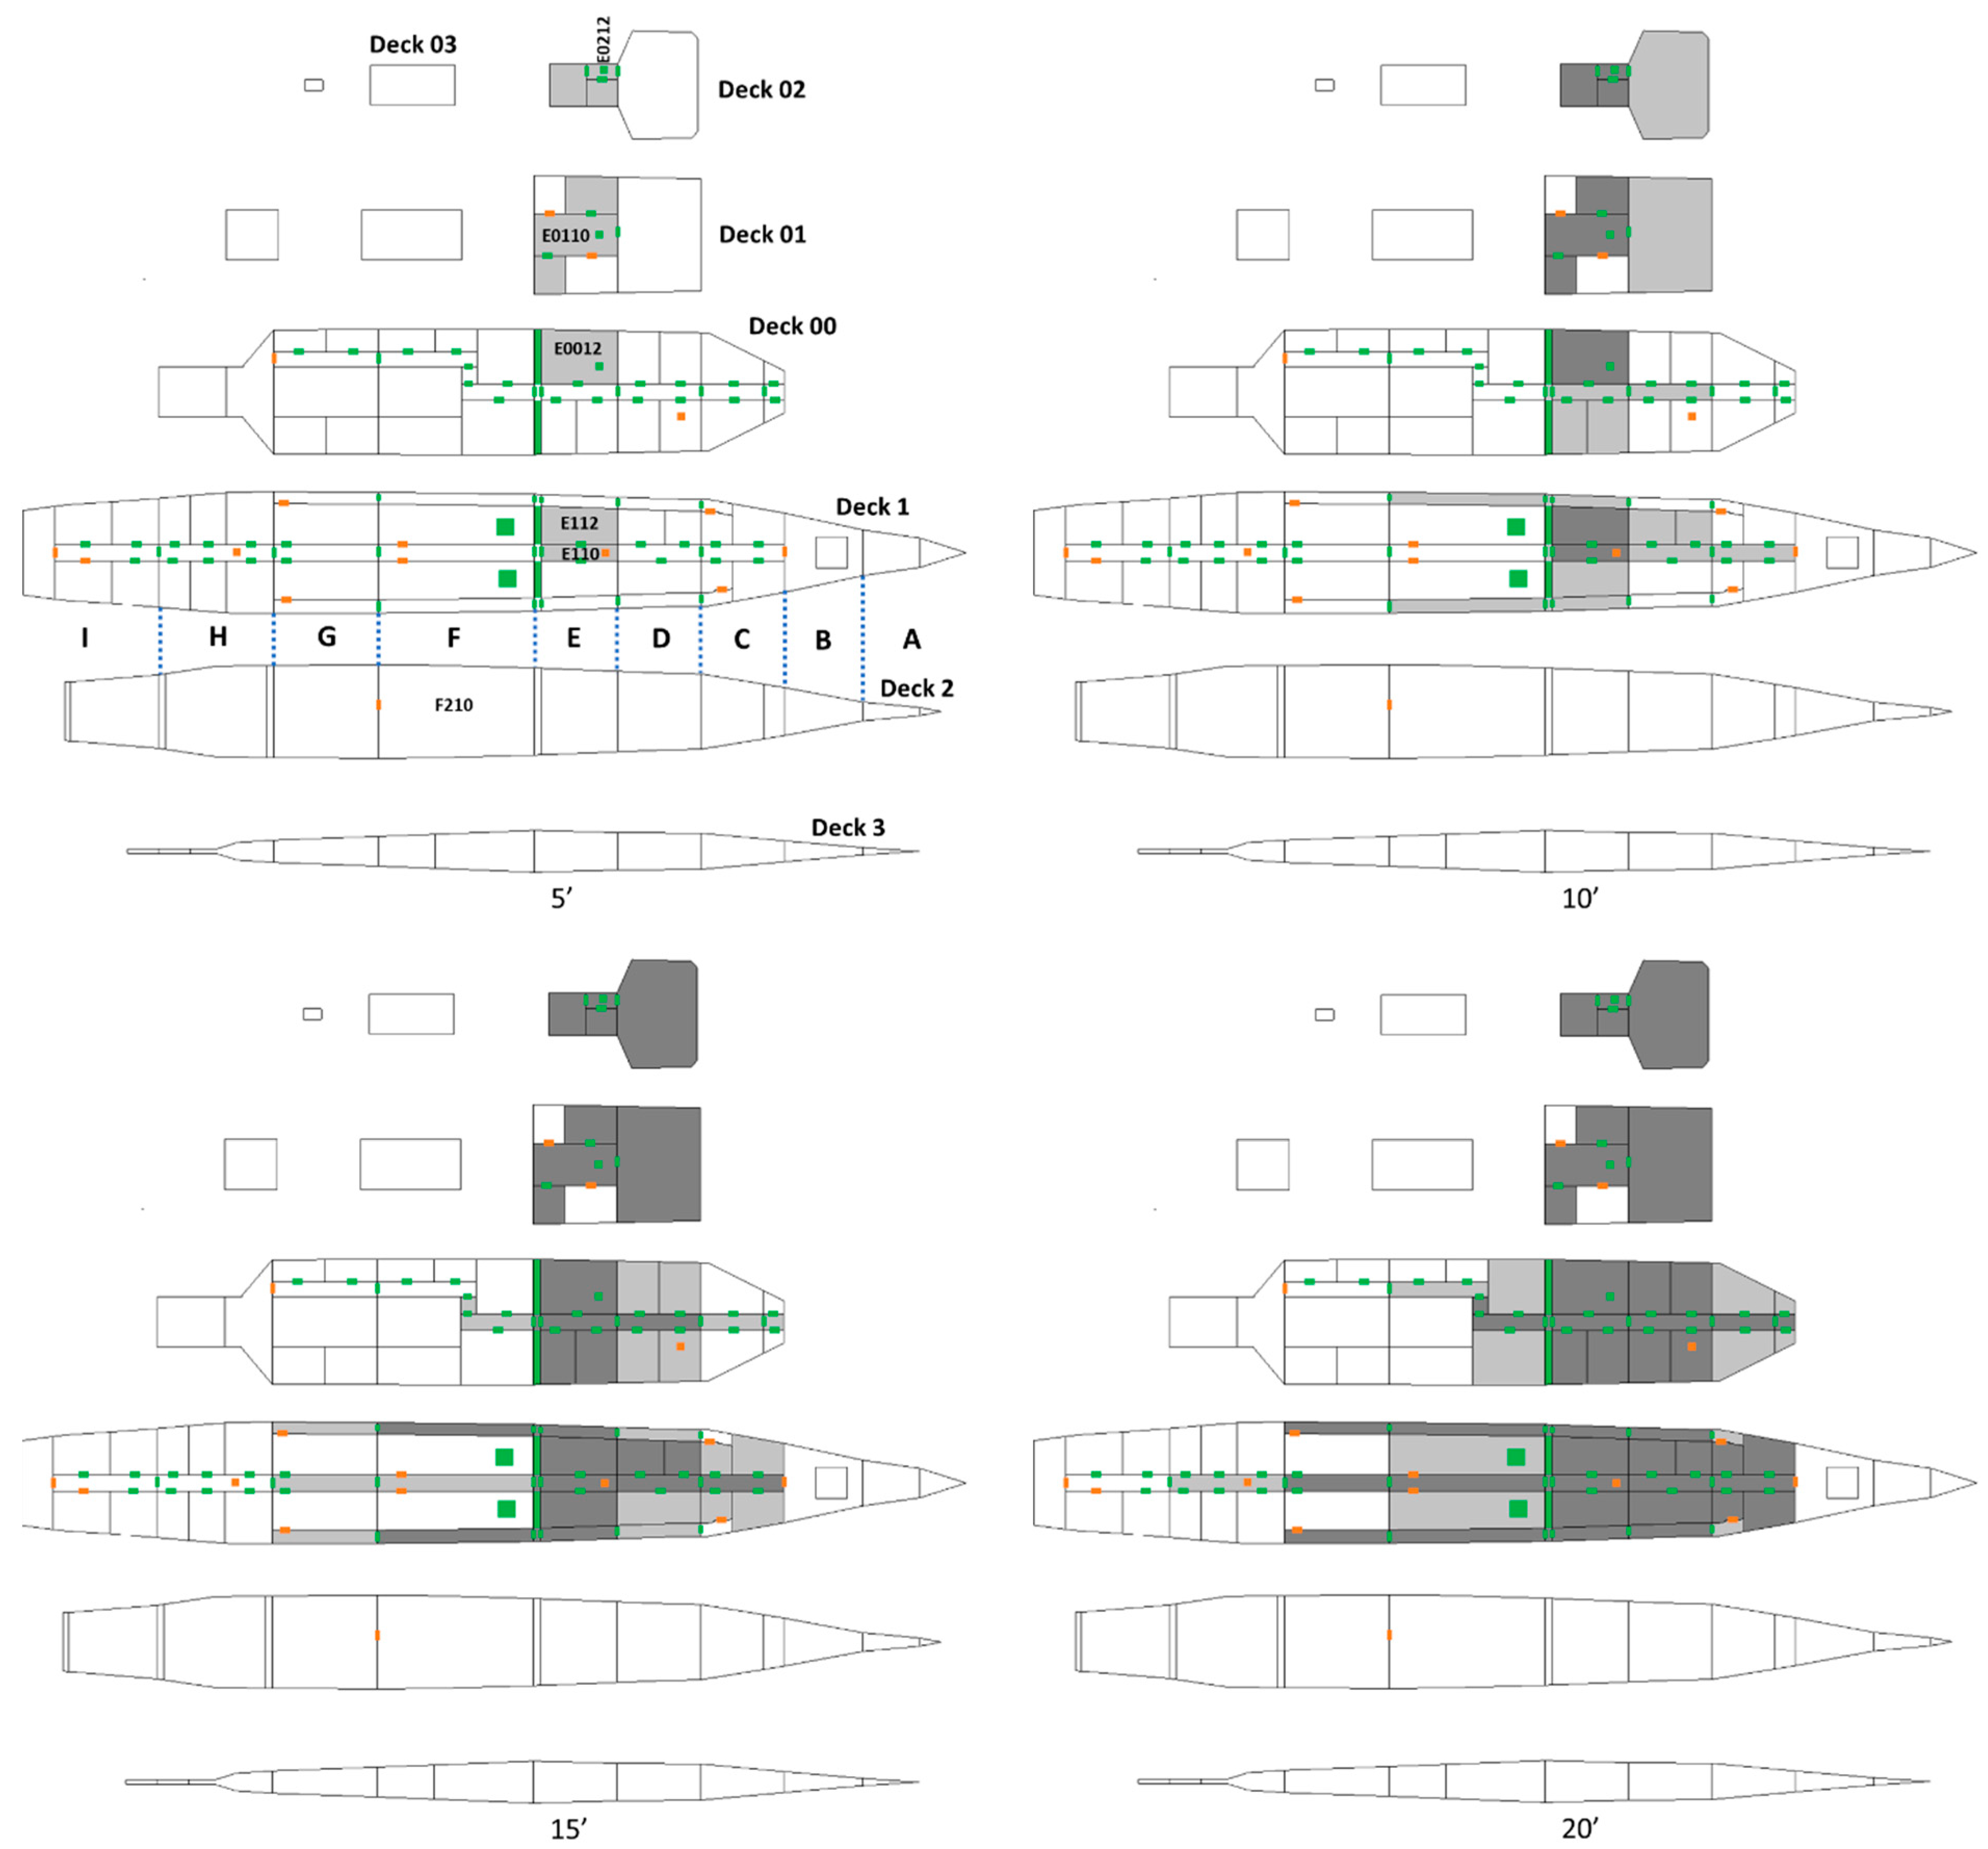
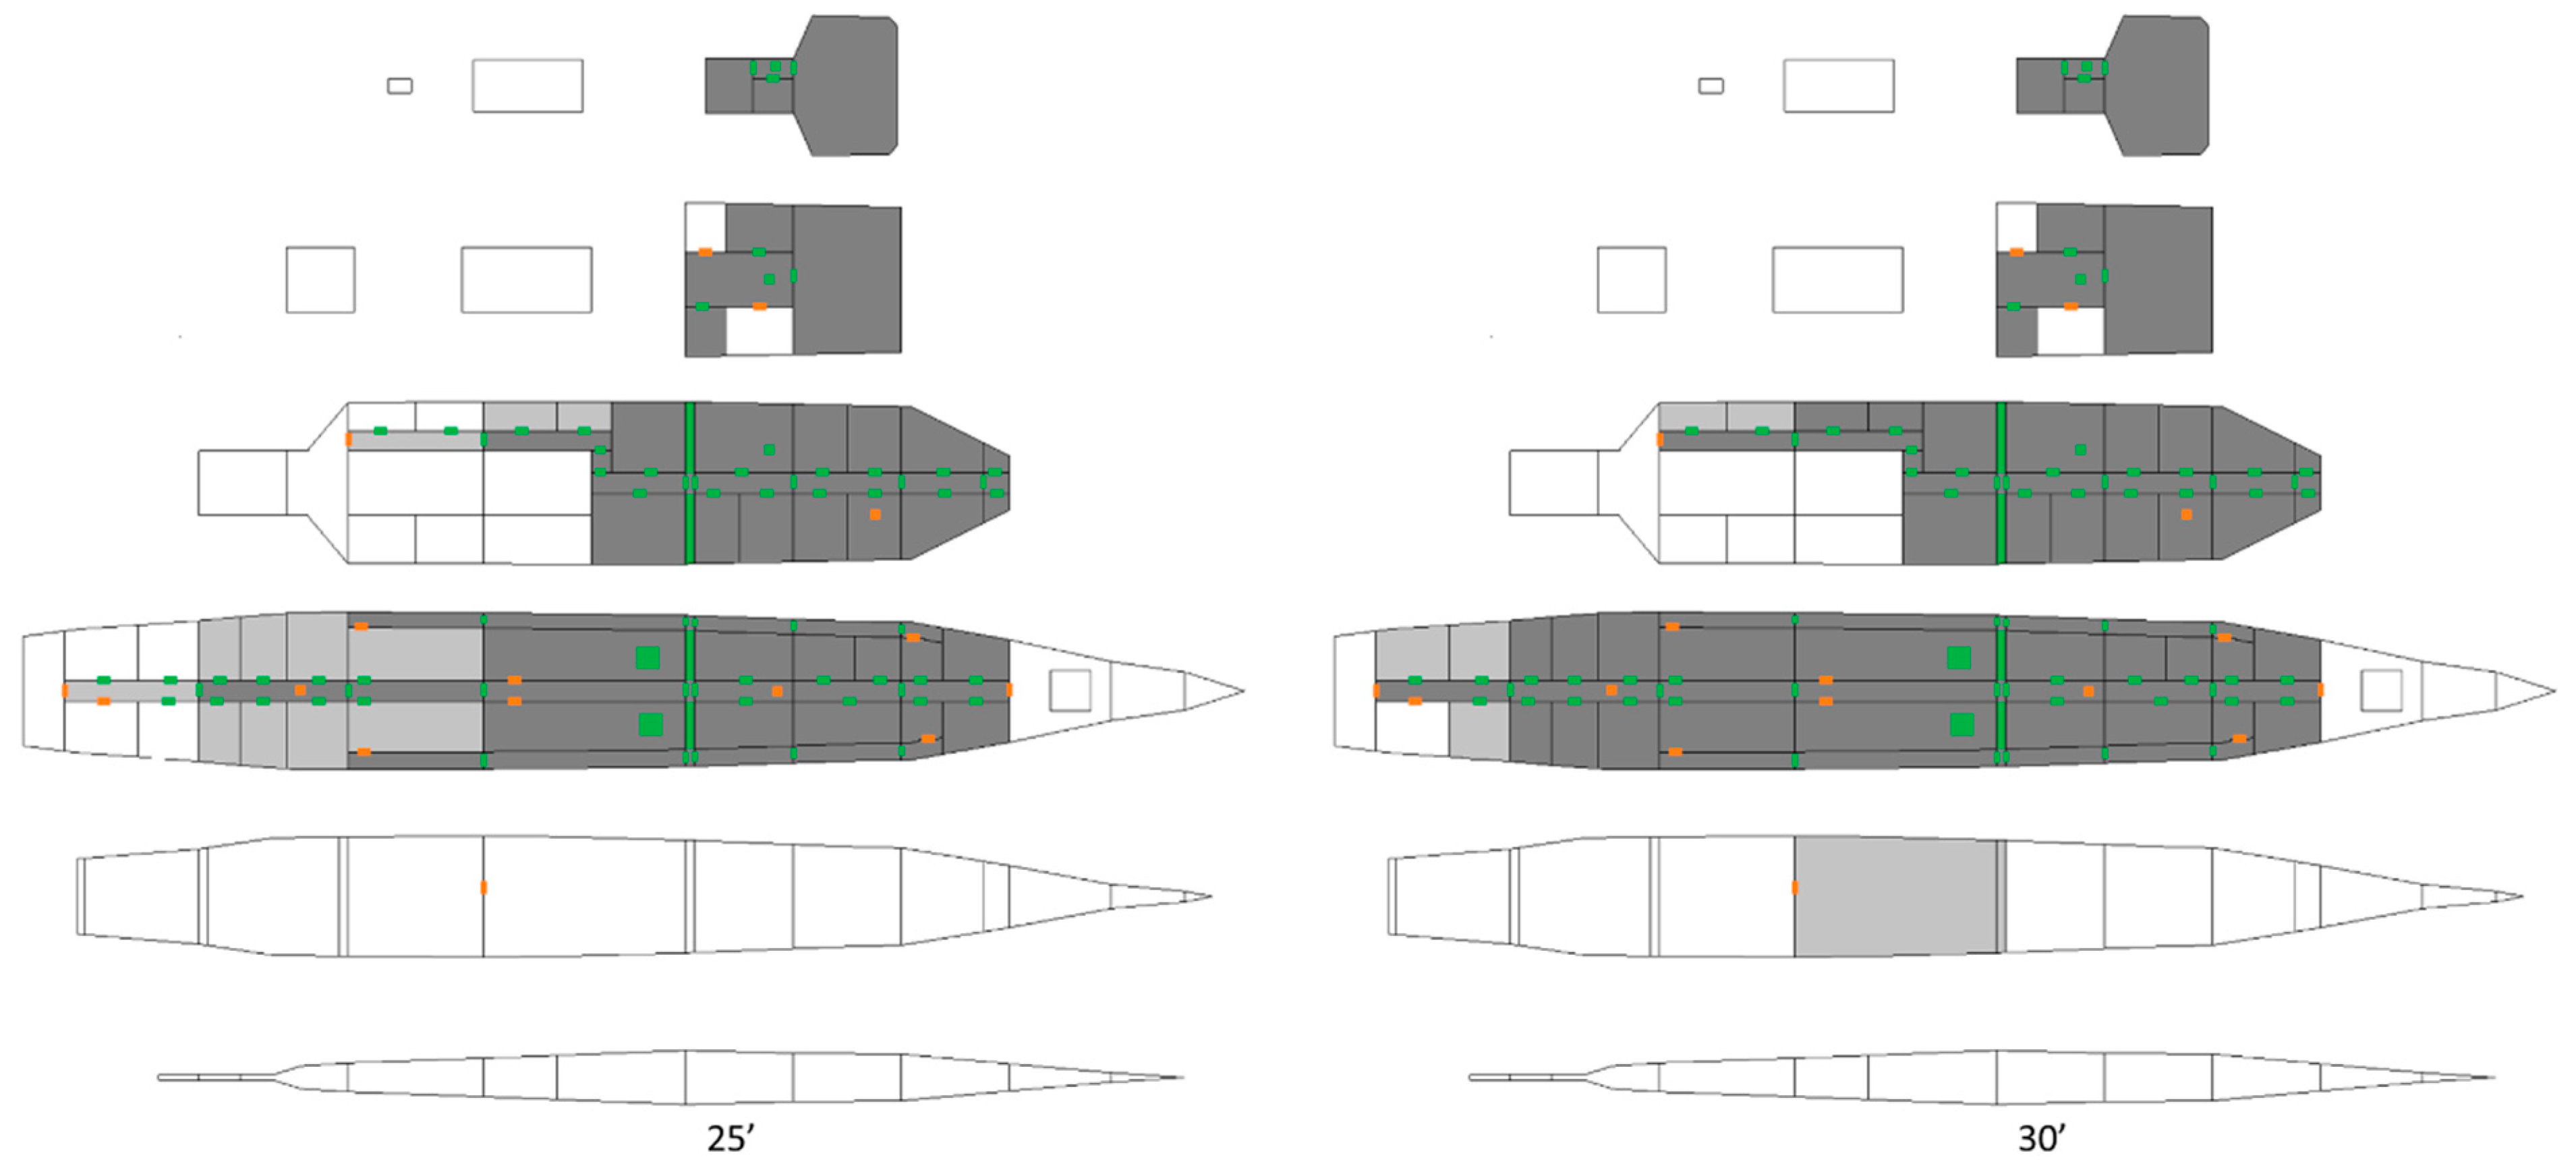
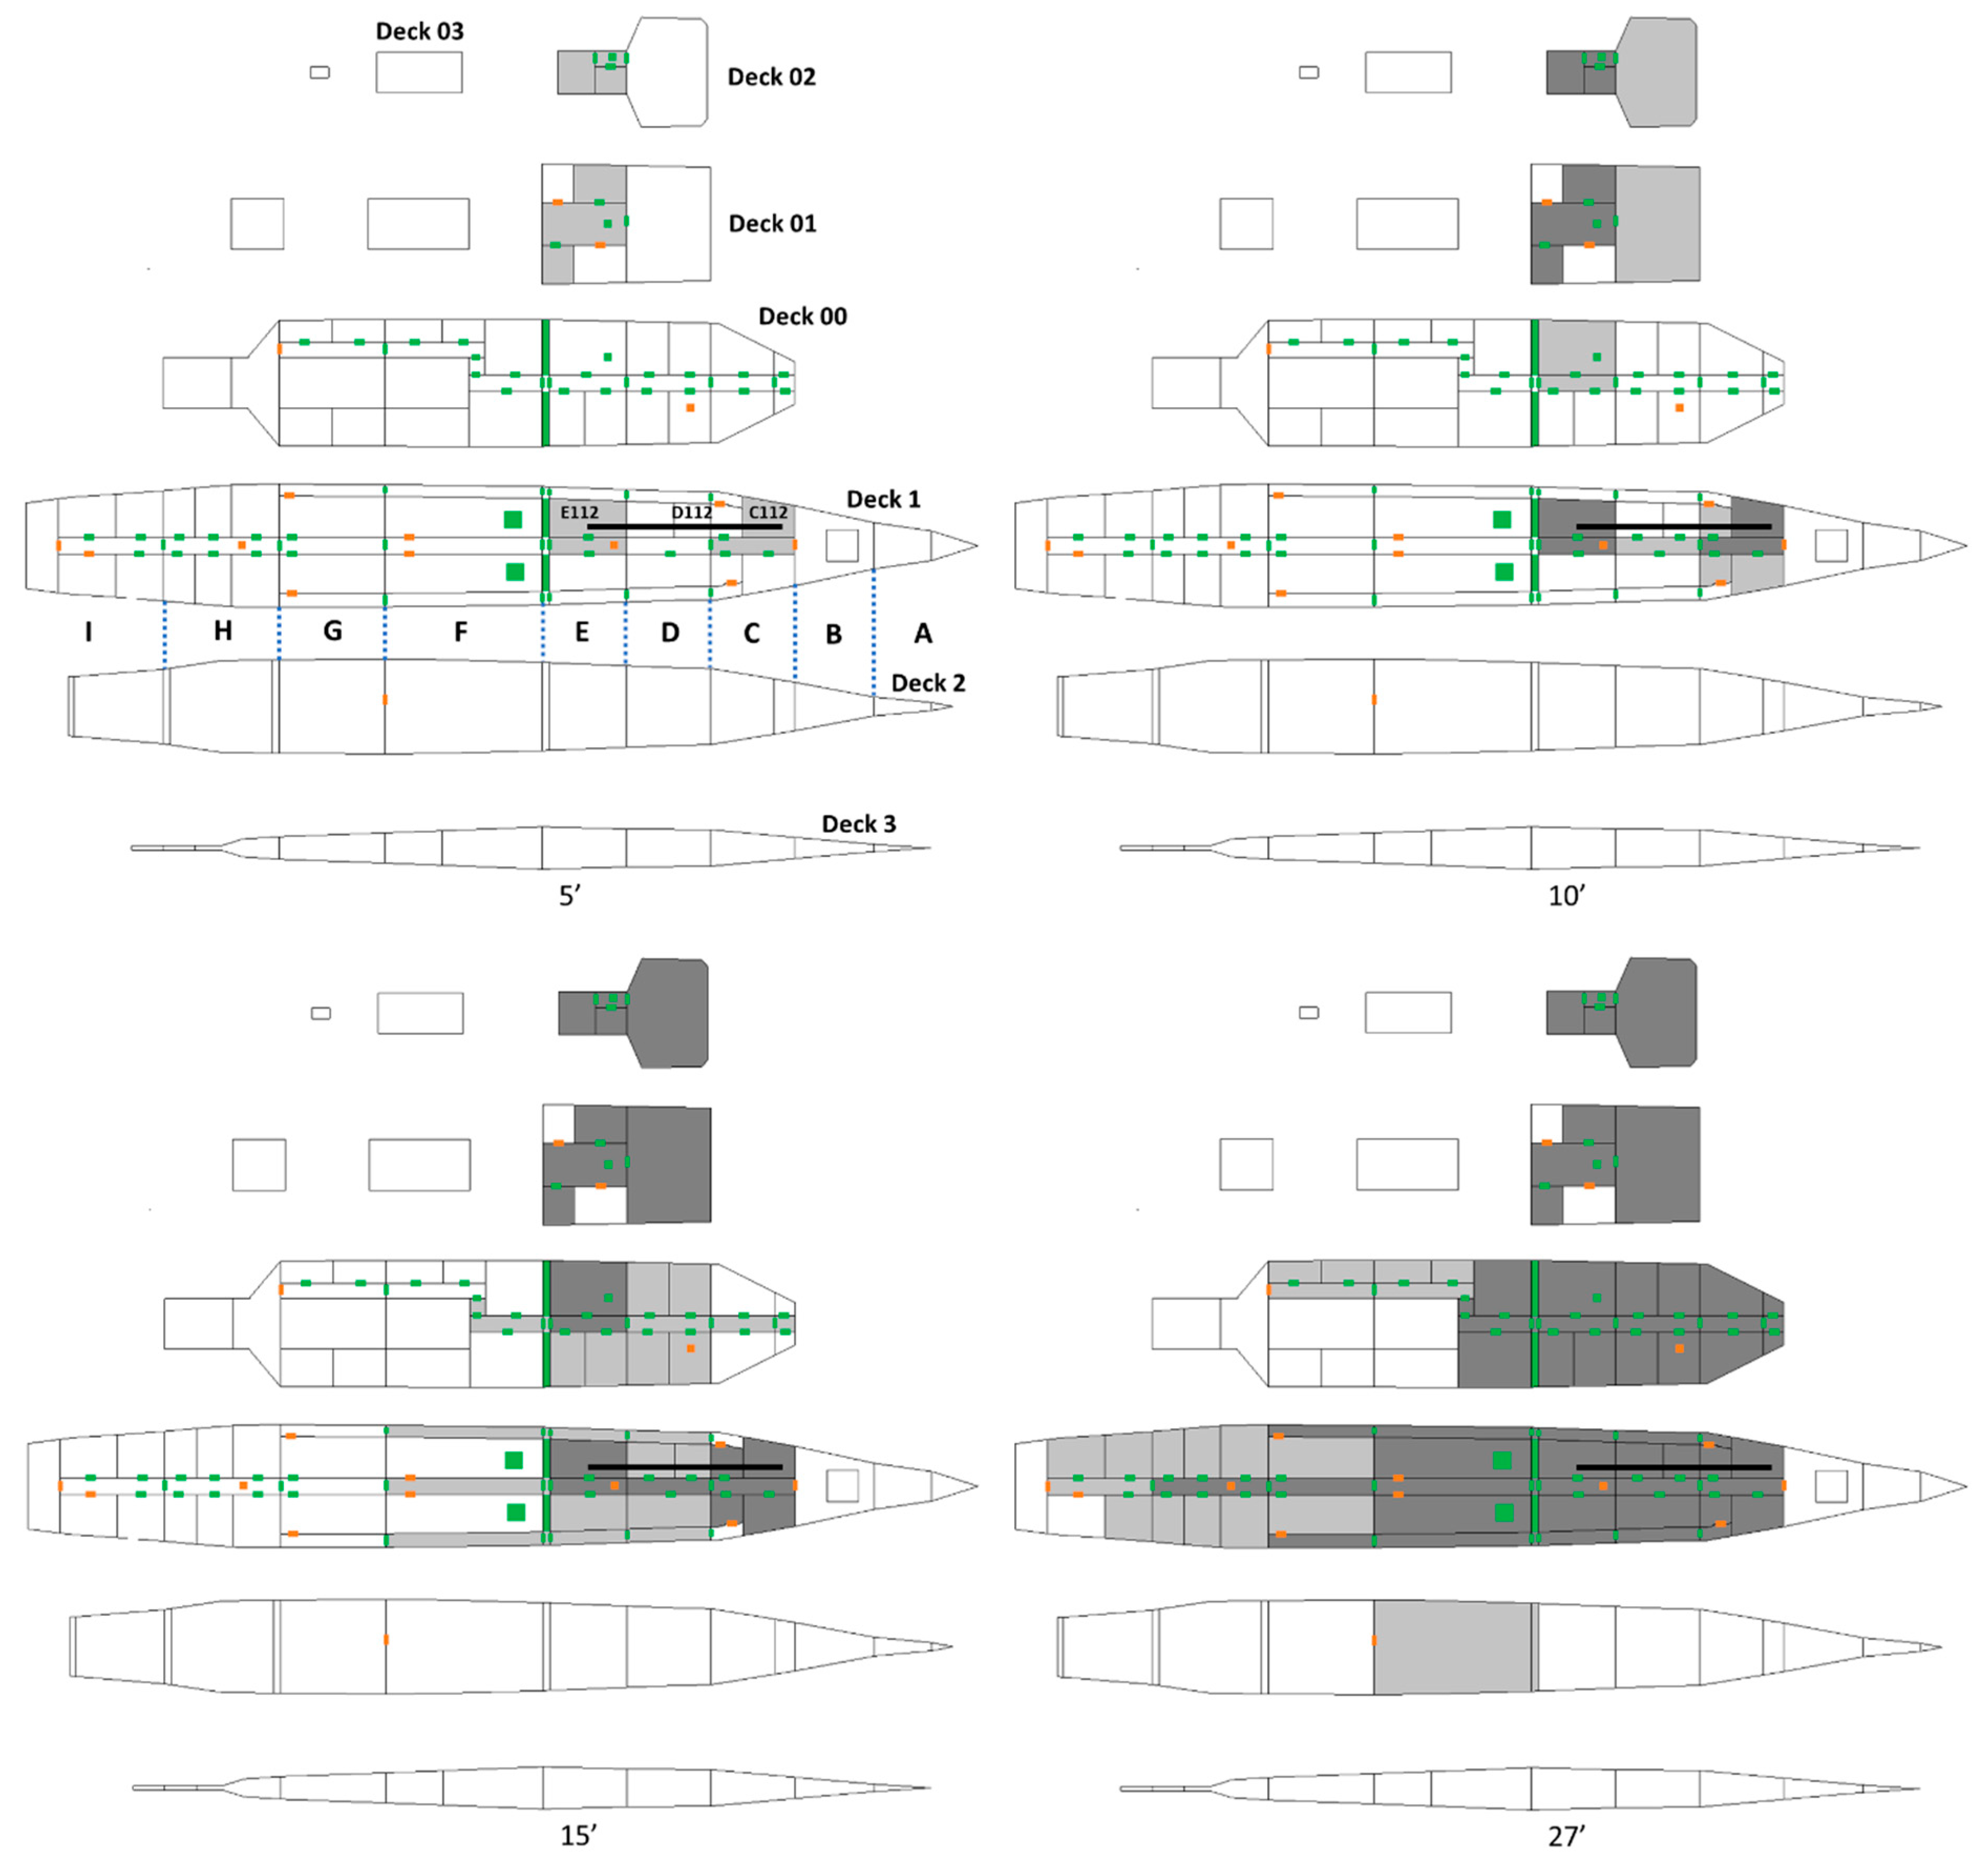
3.2. Application to a Full-Scale Generic Military Corvette

The network model is applied to a generic corvette, the SURVIVE® corvette from QinetiQ [34] (Figure 18). This corvette, with dimensions of 90 m × 12 m × 16 m, is composed of seven decks and 115 compartments, 96 of which are sensitive (i.e., contain combustible elements) and likely to propagate fire. As for the four-story building, the simulation is done in two steps: first, for each of the sensitive compartments, the zone model calculates the duration of the different phases of fire and transmission through the barriers, as well as the time evolution of smoke properties; second, the network model is used to calculate the fire and smoke propagation in the entire corvette.
First of all, sensitive compartments are classified according to their function into 10 different types. Compartments that do not contain any fuel are referred to as “empty”. Figure 19 and Figure 20 show the referencing and distribution of the compartments, as well as the positions and status of the openings (i.e., doors, staircases, and access hatches to the decks). Table 5 describes the fuel content of each type of fire-prone compartments, the equivalent fuel(s) used, and, in the last four columns, the values of the parameters needed to construct their design fire curve (see Section 2.2). Most of these data were evaluated during visits aboard French Navy corvettes, with the assistance of DGA naval architects. Note that the ammunition storage magazines and fuel storage tanks are not modelled. These compartments are not susceptible to burning because of the reinforced protection systems they are equipped with. The compartment walls are made of 1 cm steel, covered or not with insulation depending on the type of compartment and its location in the corvette. Table 6 gives the thermal properties of the materials making up the bulkheads of the corvette. An overview of the insulation system on board the corvettes is provided as Supplementary Materials with the manuscript (Figures S1 and S2).
As shown in Figure 19 and Figure 20, we placed a horizontal ventilation duct on deck 1. Two fire scenarios are presented and discussed, depending on whether the ventilation is off or on when the fire starts and beyond. For both scenarios, the fire starts in compartment E112 on deck 1.

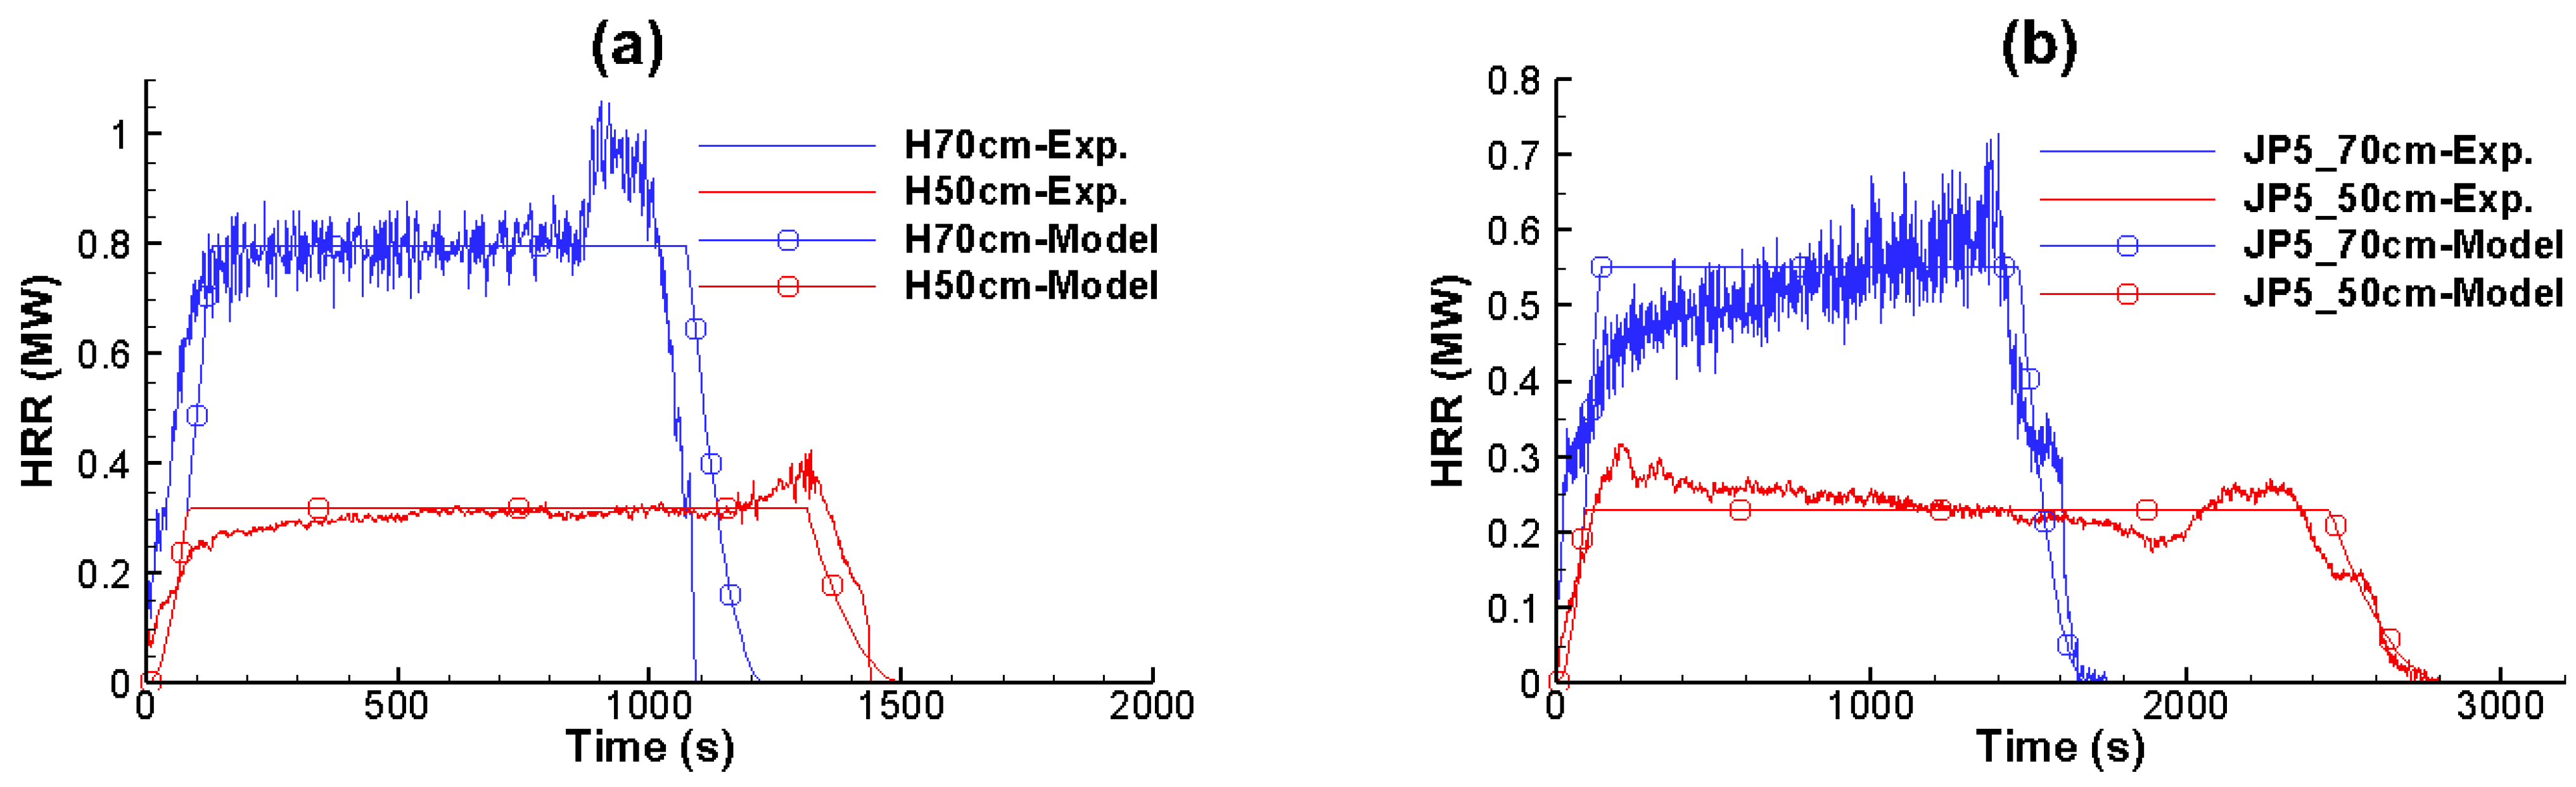
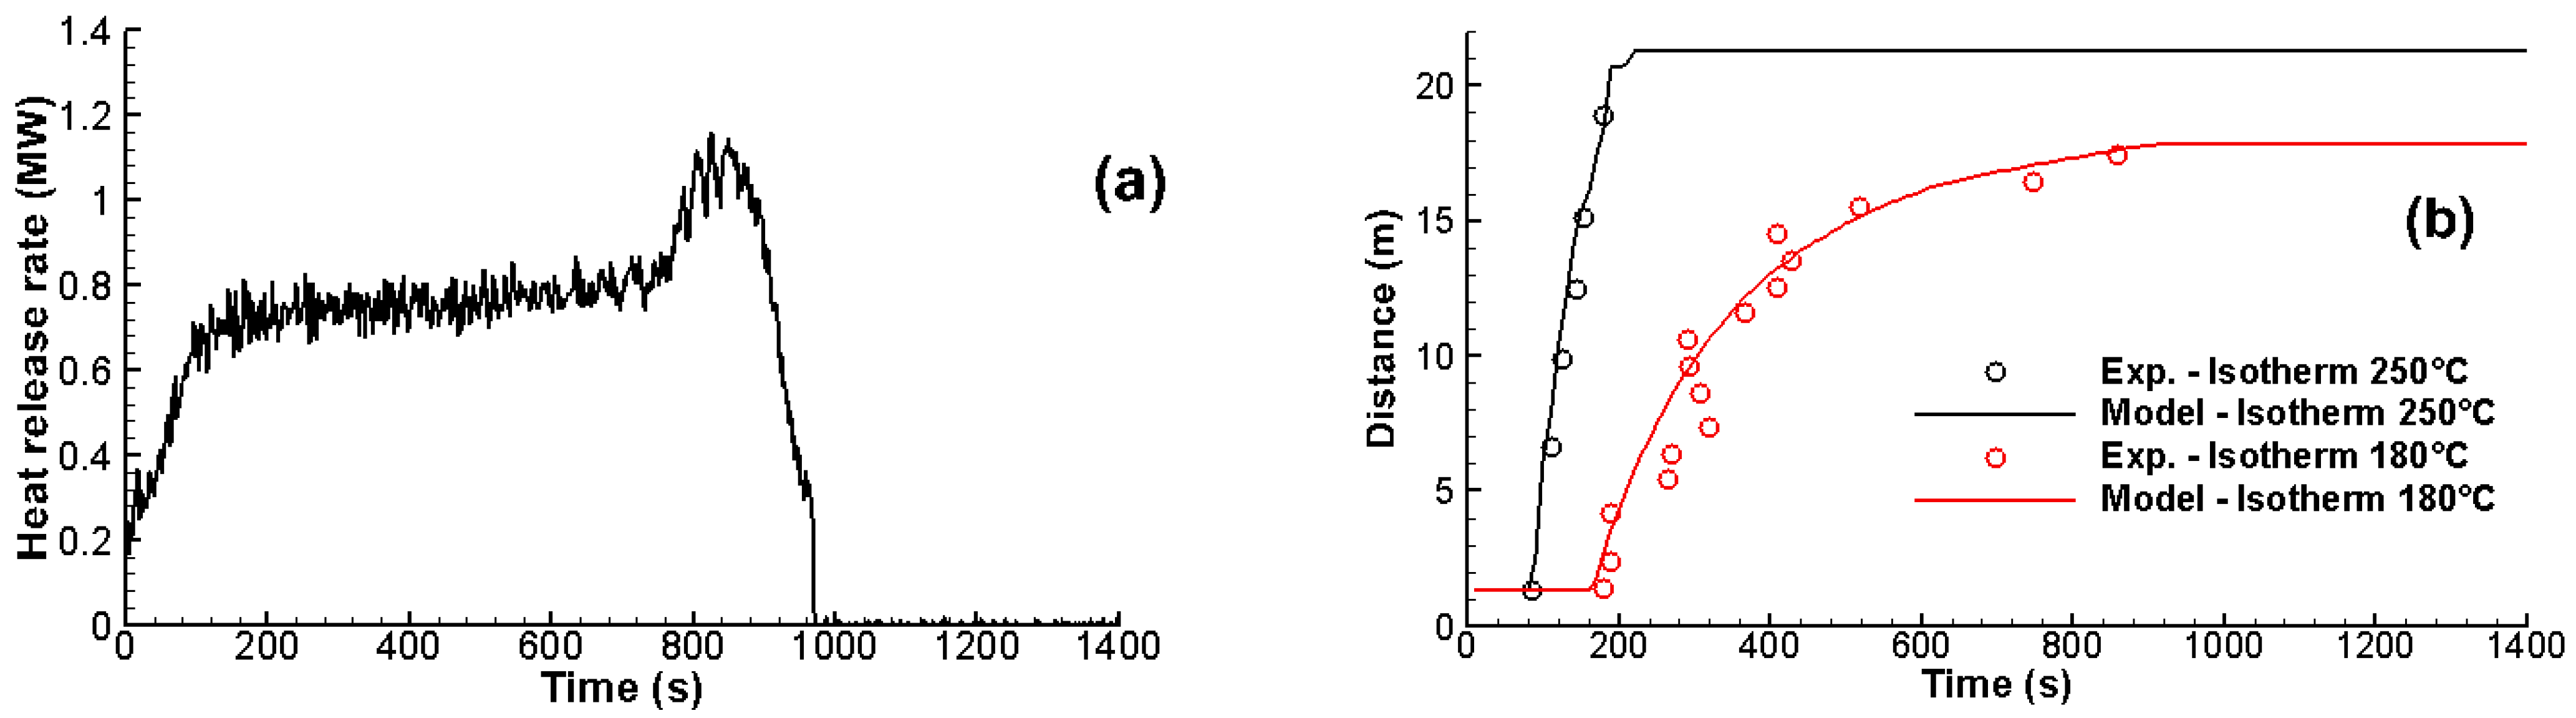
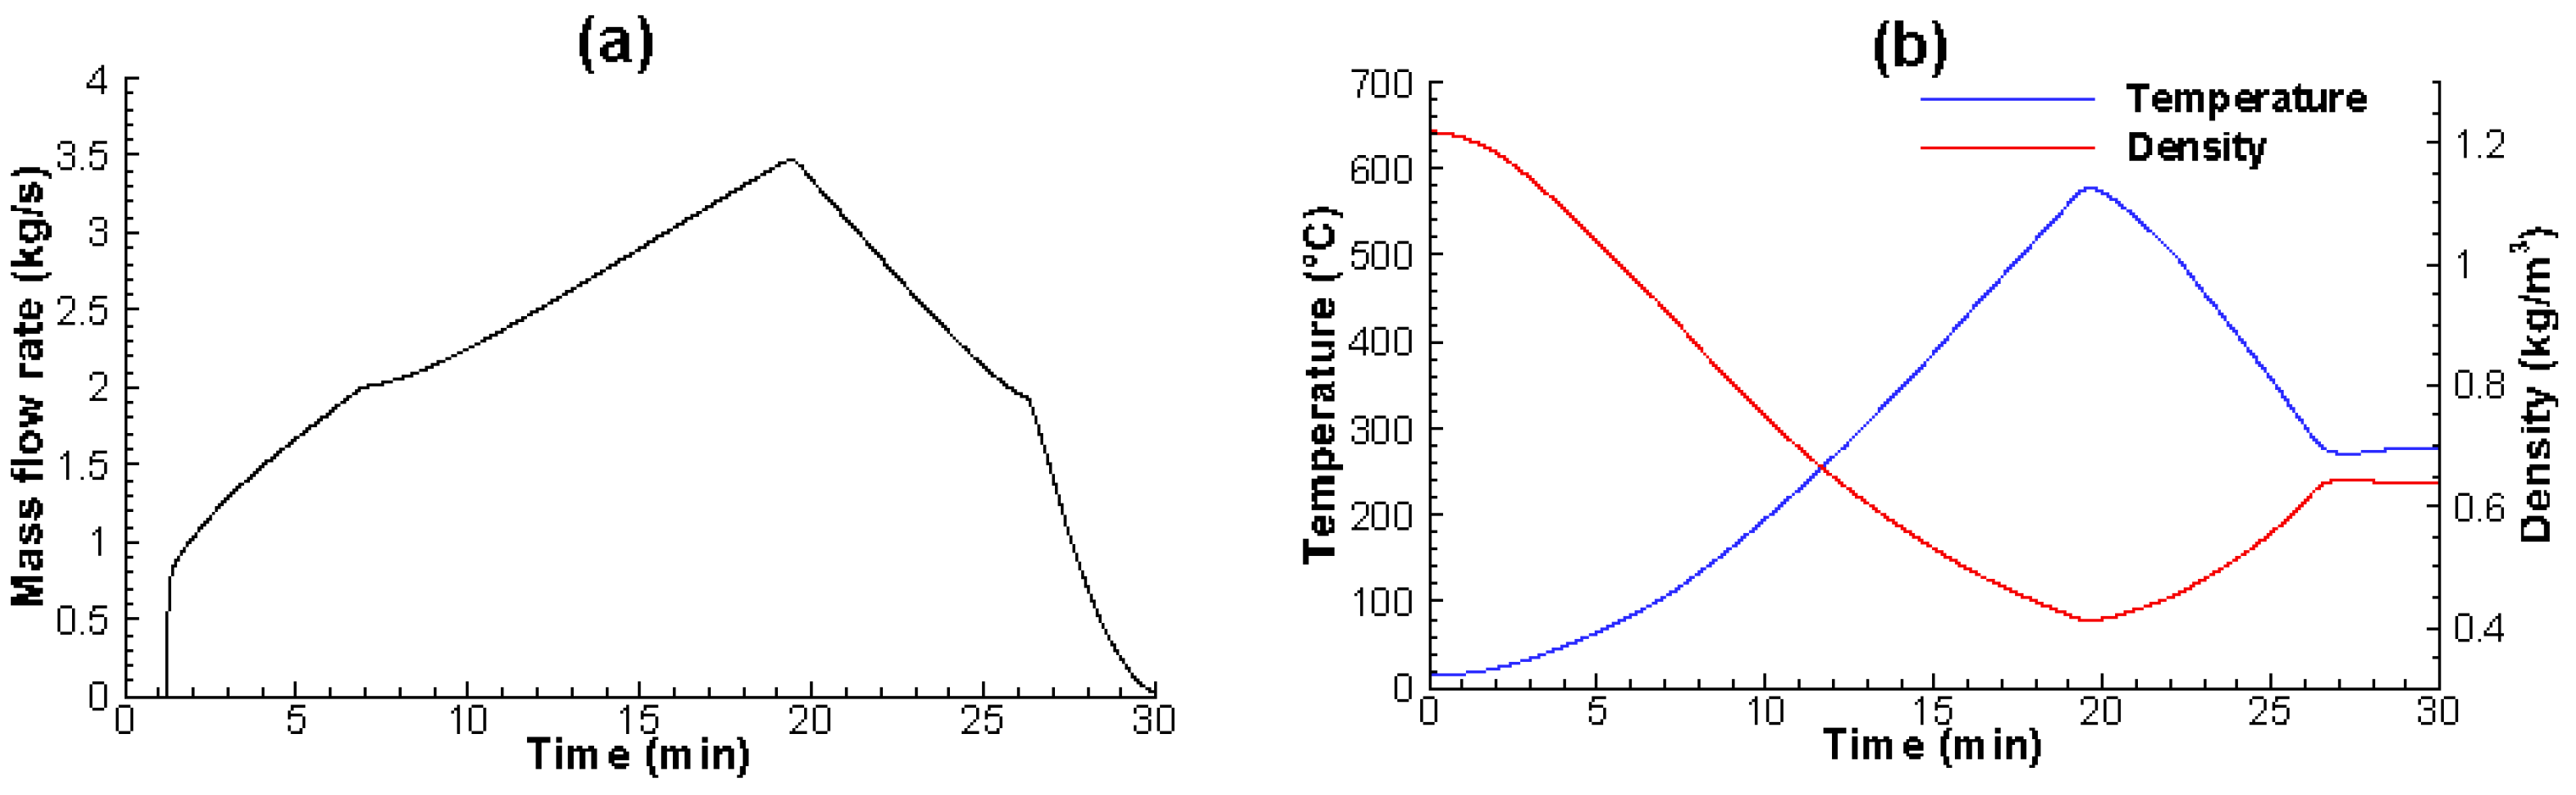
3.2.1. Zone Model Results

For both scenarios, the zone model was applied to describe the fire development and smoke production in the 96 fire-prone compartments of the corvette, for a total of 184 simulations. Combustion properties of the equivalent fuels in Table 5 are available in [20].
The example of the accommodation compartment E112 is given below for the first scenario (i.e., ventilation was off). Compartment E112 measures 7 m × 3.7 m × 3 m. It is made of 1 cm thick bare steel walls, has an upward opening of 0.81 m2 to room E0012, and has a 2 m × 1 m door to corridor E110. The prescribed HRR time curve in E112 is evaluated using the values of the parameters in Table 5 and the strategy presented in [14] for compartments where multi-fuel combustion occurs. The design fire of E112 is plotted in Figure 21.
The times of the fire phases and barrier failures in E112, as well as the time evolution of the mass flow rate, temperature, and density of the smoke leaving E112 were calculated using the zone model. Flashover, decay, and extinguishment take place after 12′57”, 16′00”, and 21′21”, respectively. Due to the thermal properties of bare steel, the durations of the fire resistance of the walls are relatively short, namely 14′30”, 15′11”, and 19′44” for the side walls, ceiling, and floor, respectively. Although not shown here, the smoke mass flow rate reaches its maximum value in 15′, i.e., 2.8 kg/s; it then remains constant for 10′ and gradually decreases. The smoke temperature reaches 550 °C at the moment of flashover, then continues to increase until it reaches 610 °C after 25′ of fire. At this moment, the density is minimum, with 0.4 kg/m3.

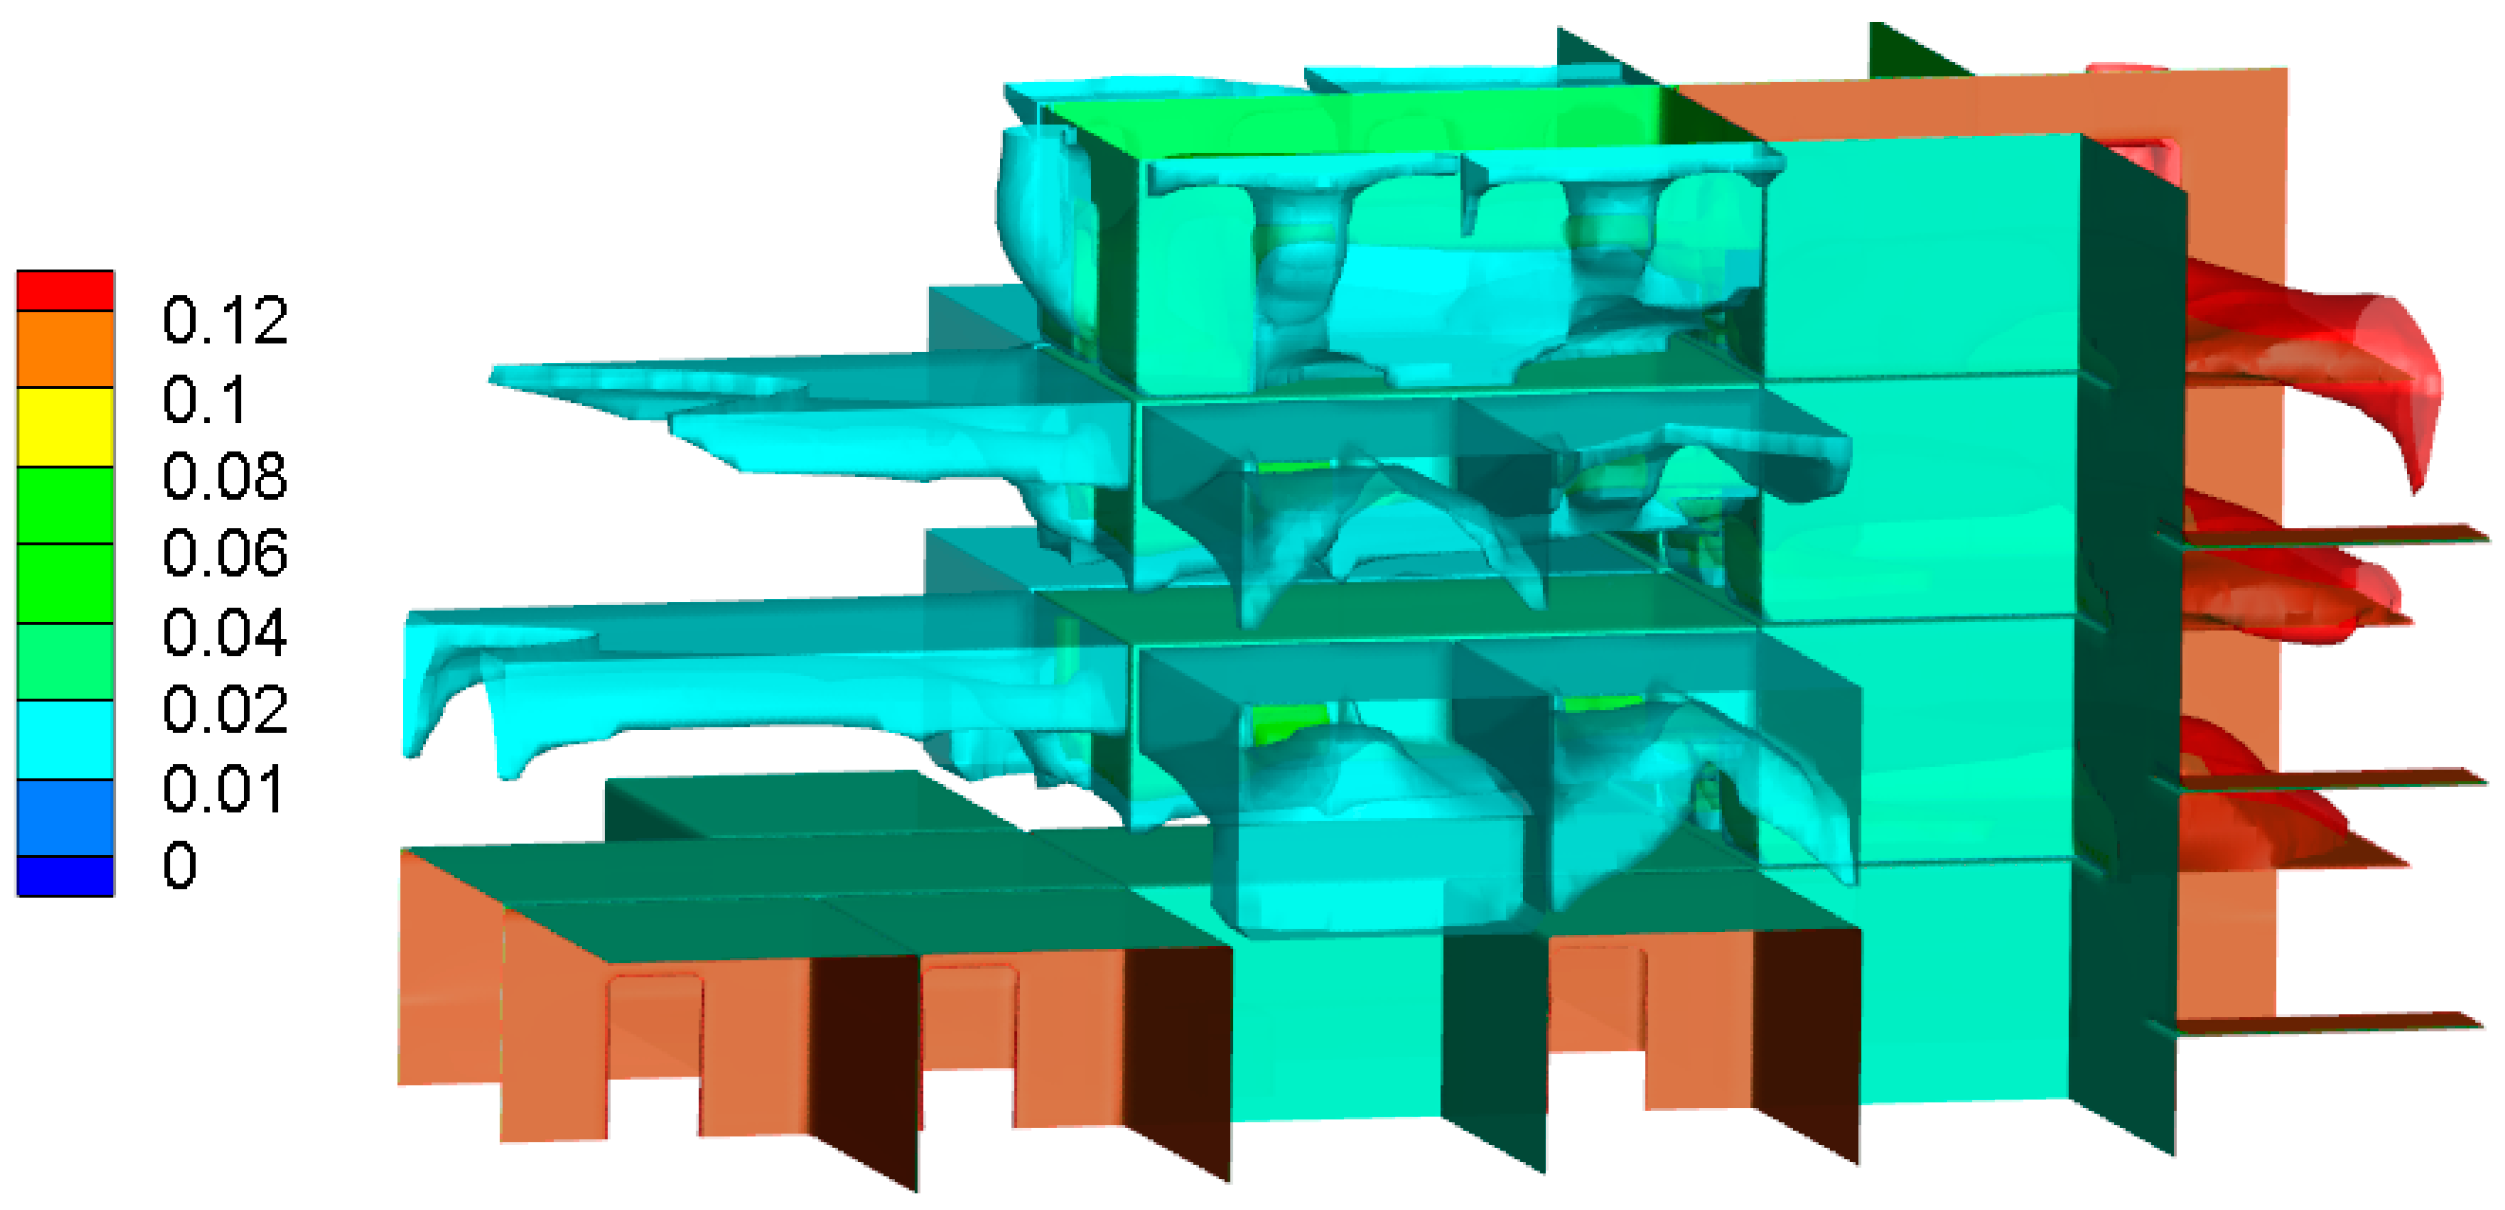
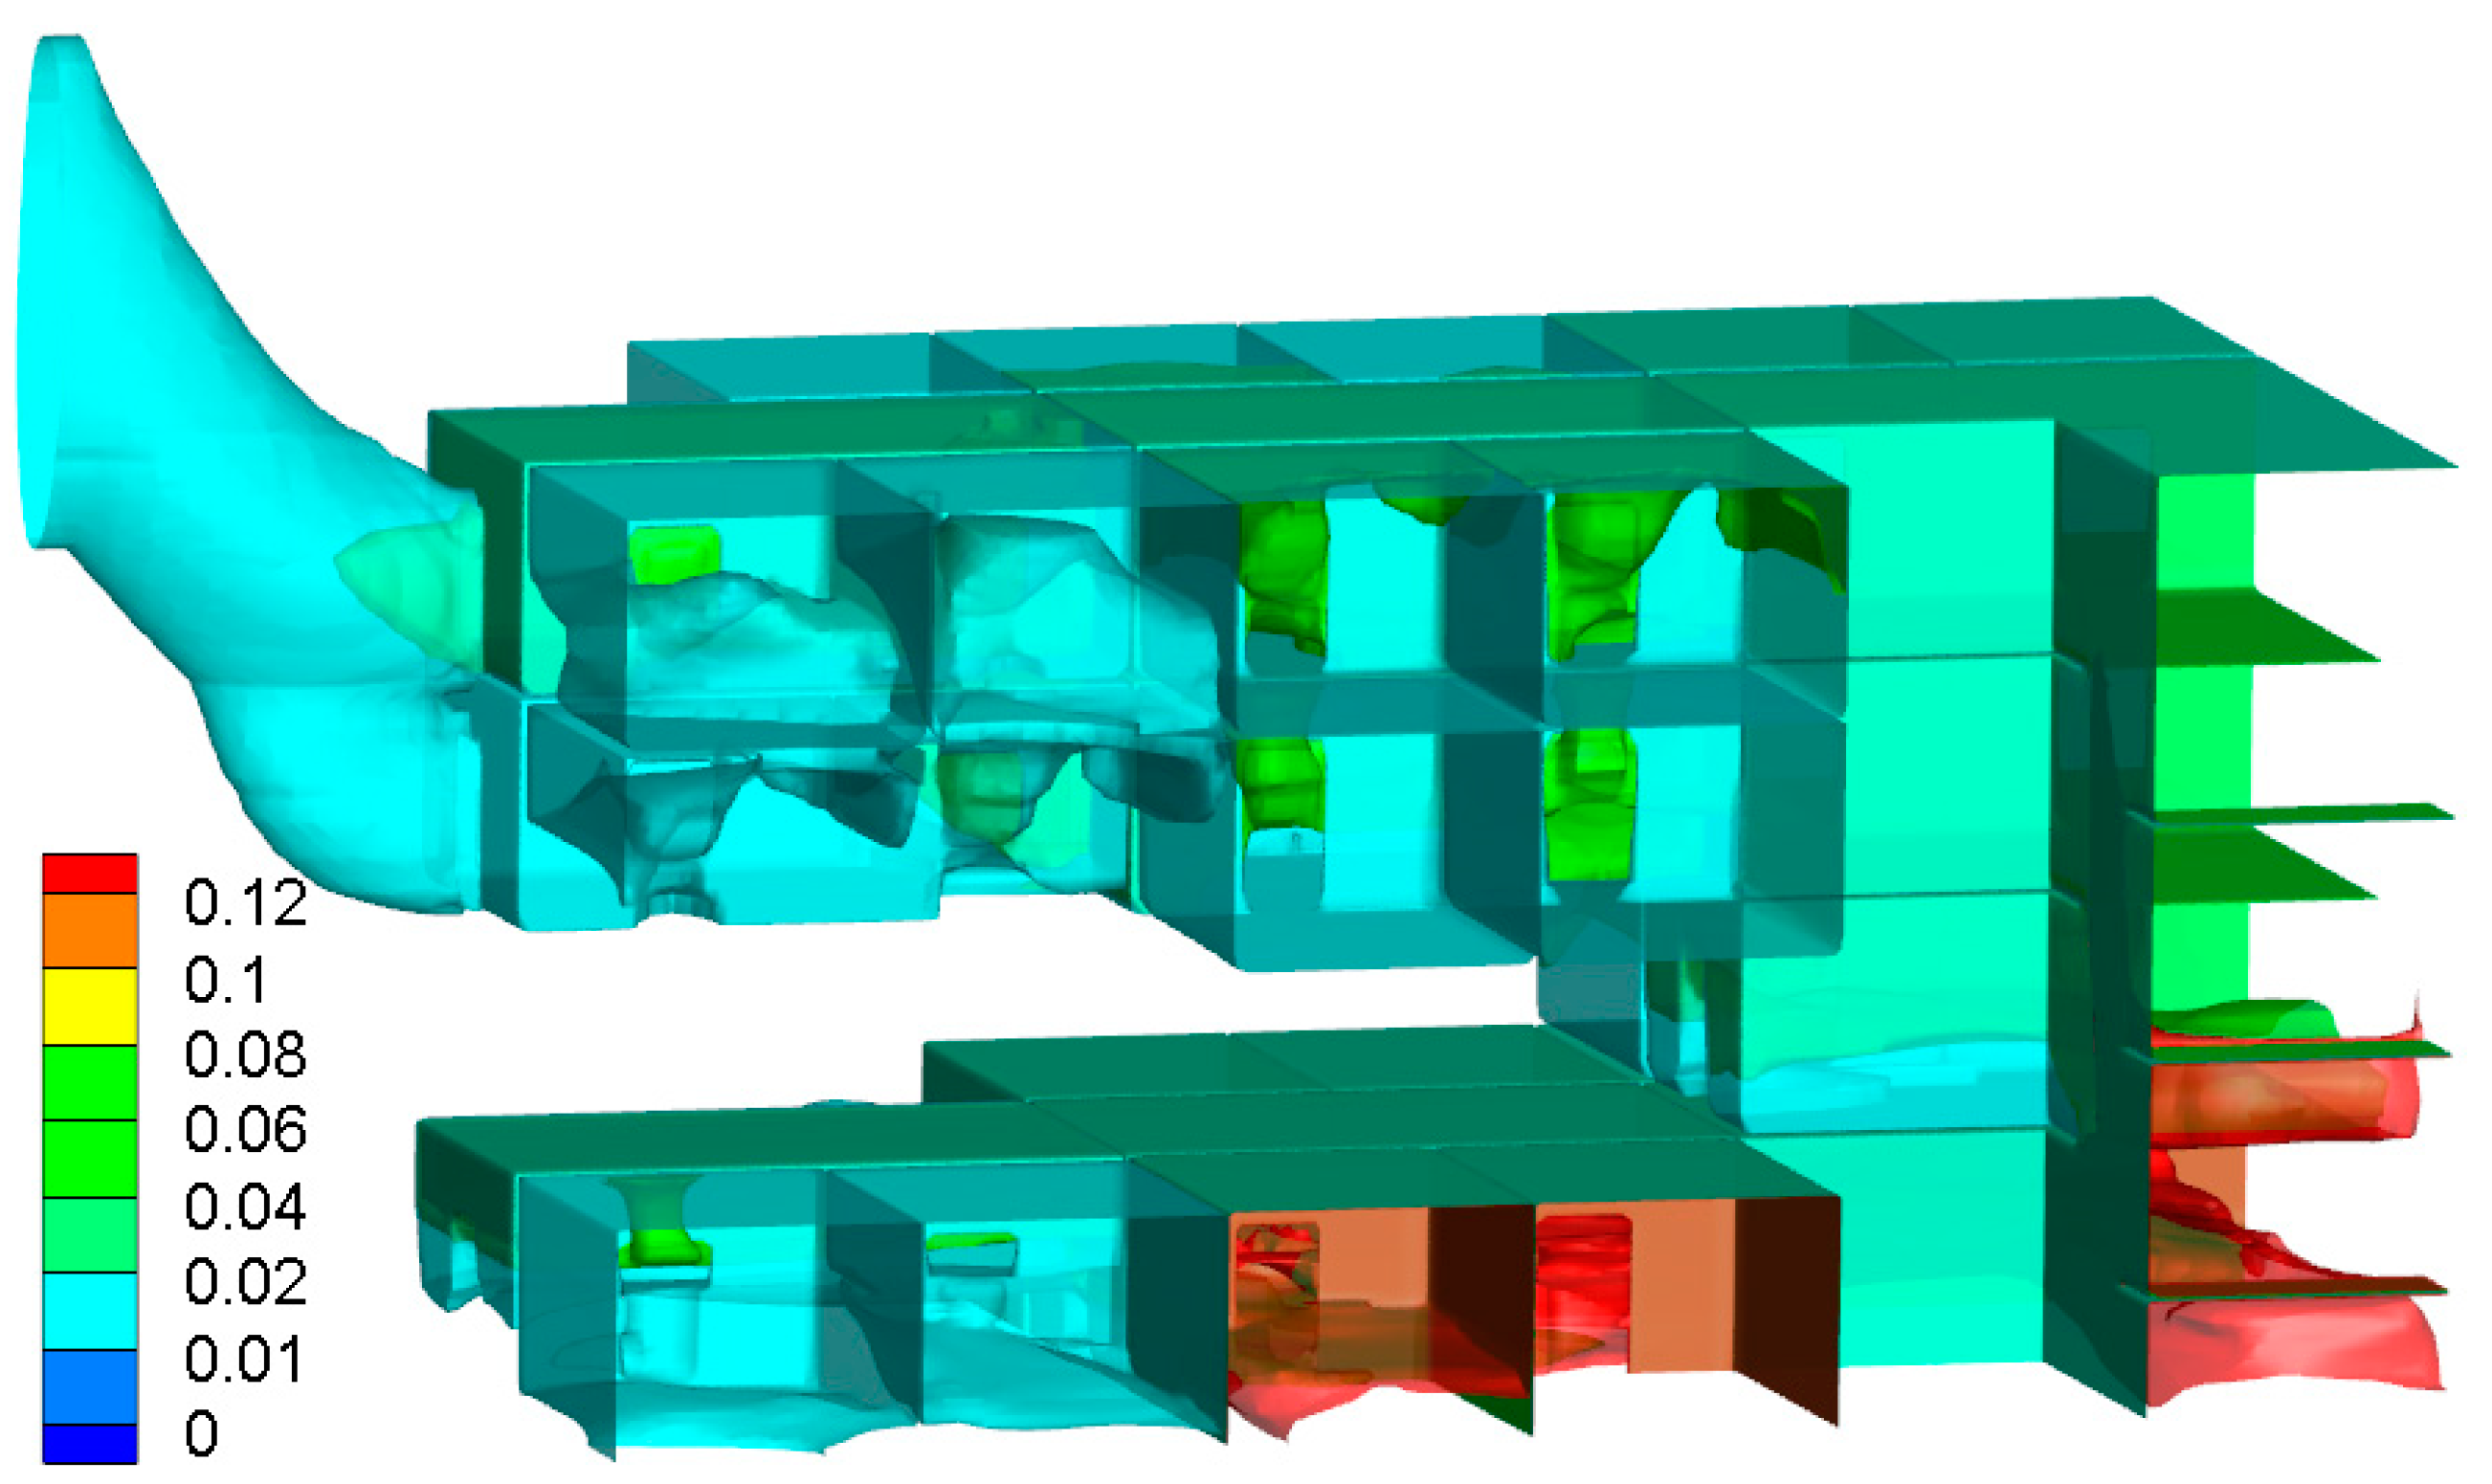
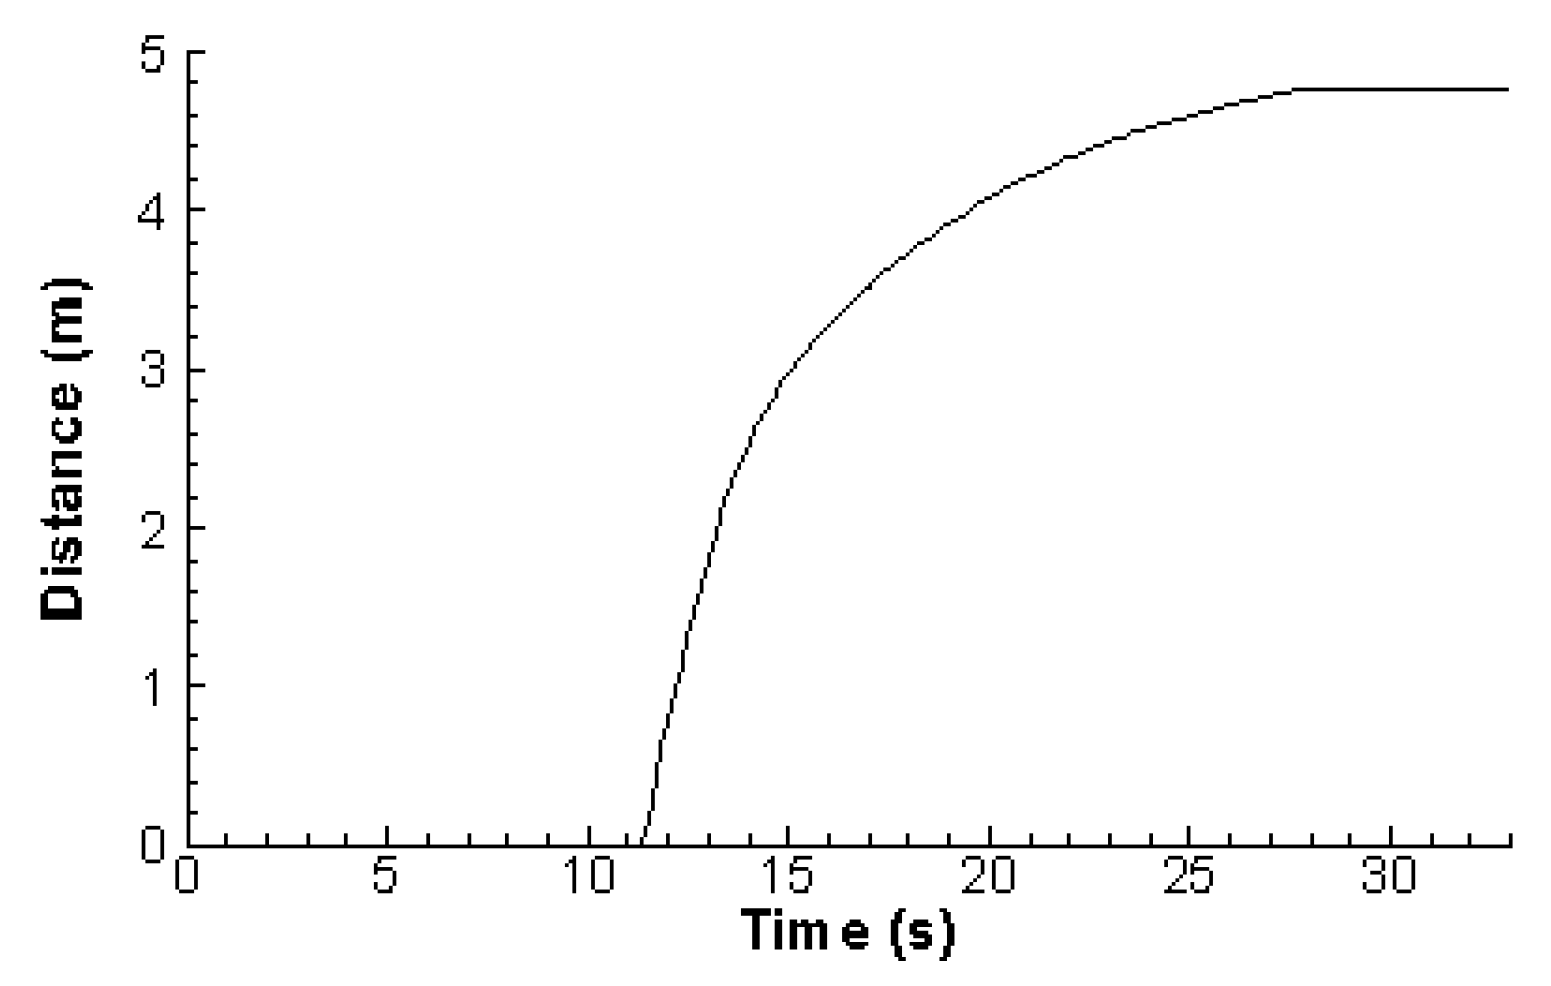
3.2.2. 1D CFD Model Results

When the ventilation is on (second fire scenario), the hot smoke generated by the fire in compartment E112 enters the ventilation duct, passes through compartments D122 and D112, and then enters compartment C112. The 1D CFD model was used to determine the time after which duct failure occurred in D122, D112, and C112. The results obtained show that the maximum temperature of the smoke in room C112, located at 8 m from E112, was 489 °C, which did not allow for igniting the fuels present in this room. On the contrary, transmission to rooms D122 and D112, located at 0 m and 4.5 m from E112, occurred after 11′30” and 23′50” of fire, respectively, as shown in Figure 22, where the distance travelled from E112 by the isotherm 350 °C in the duct is plotted over time.
On average, a run takes approximately 15 CPU seconds on a 3.40 GHz/16 GB RAM PC.

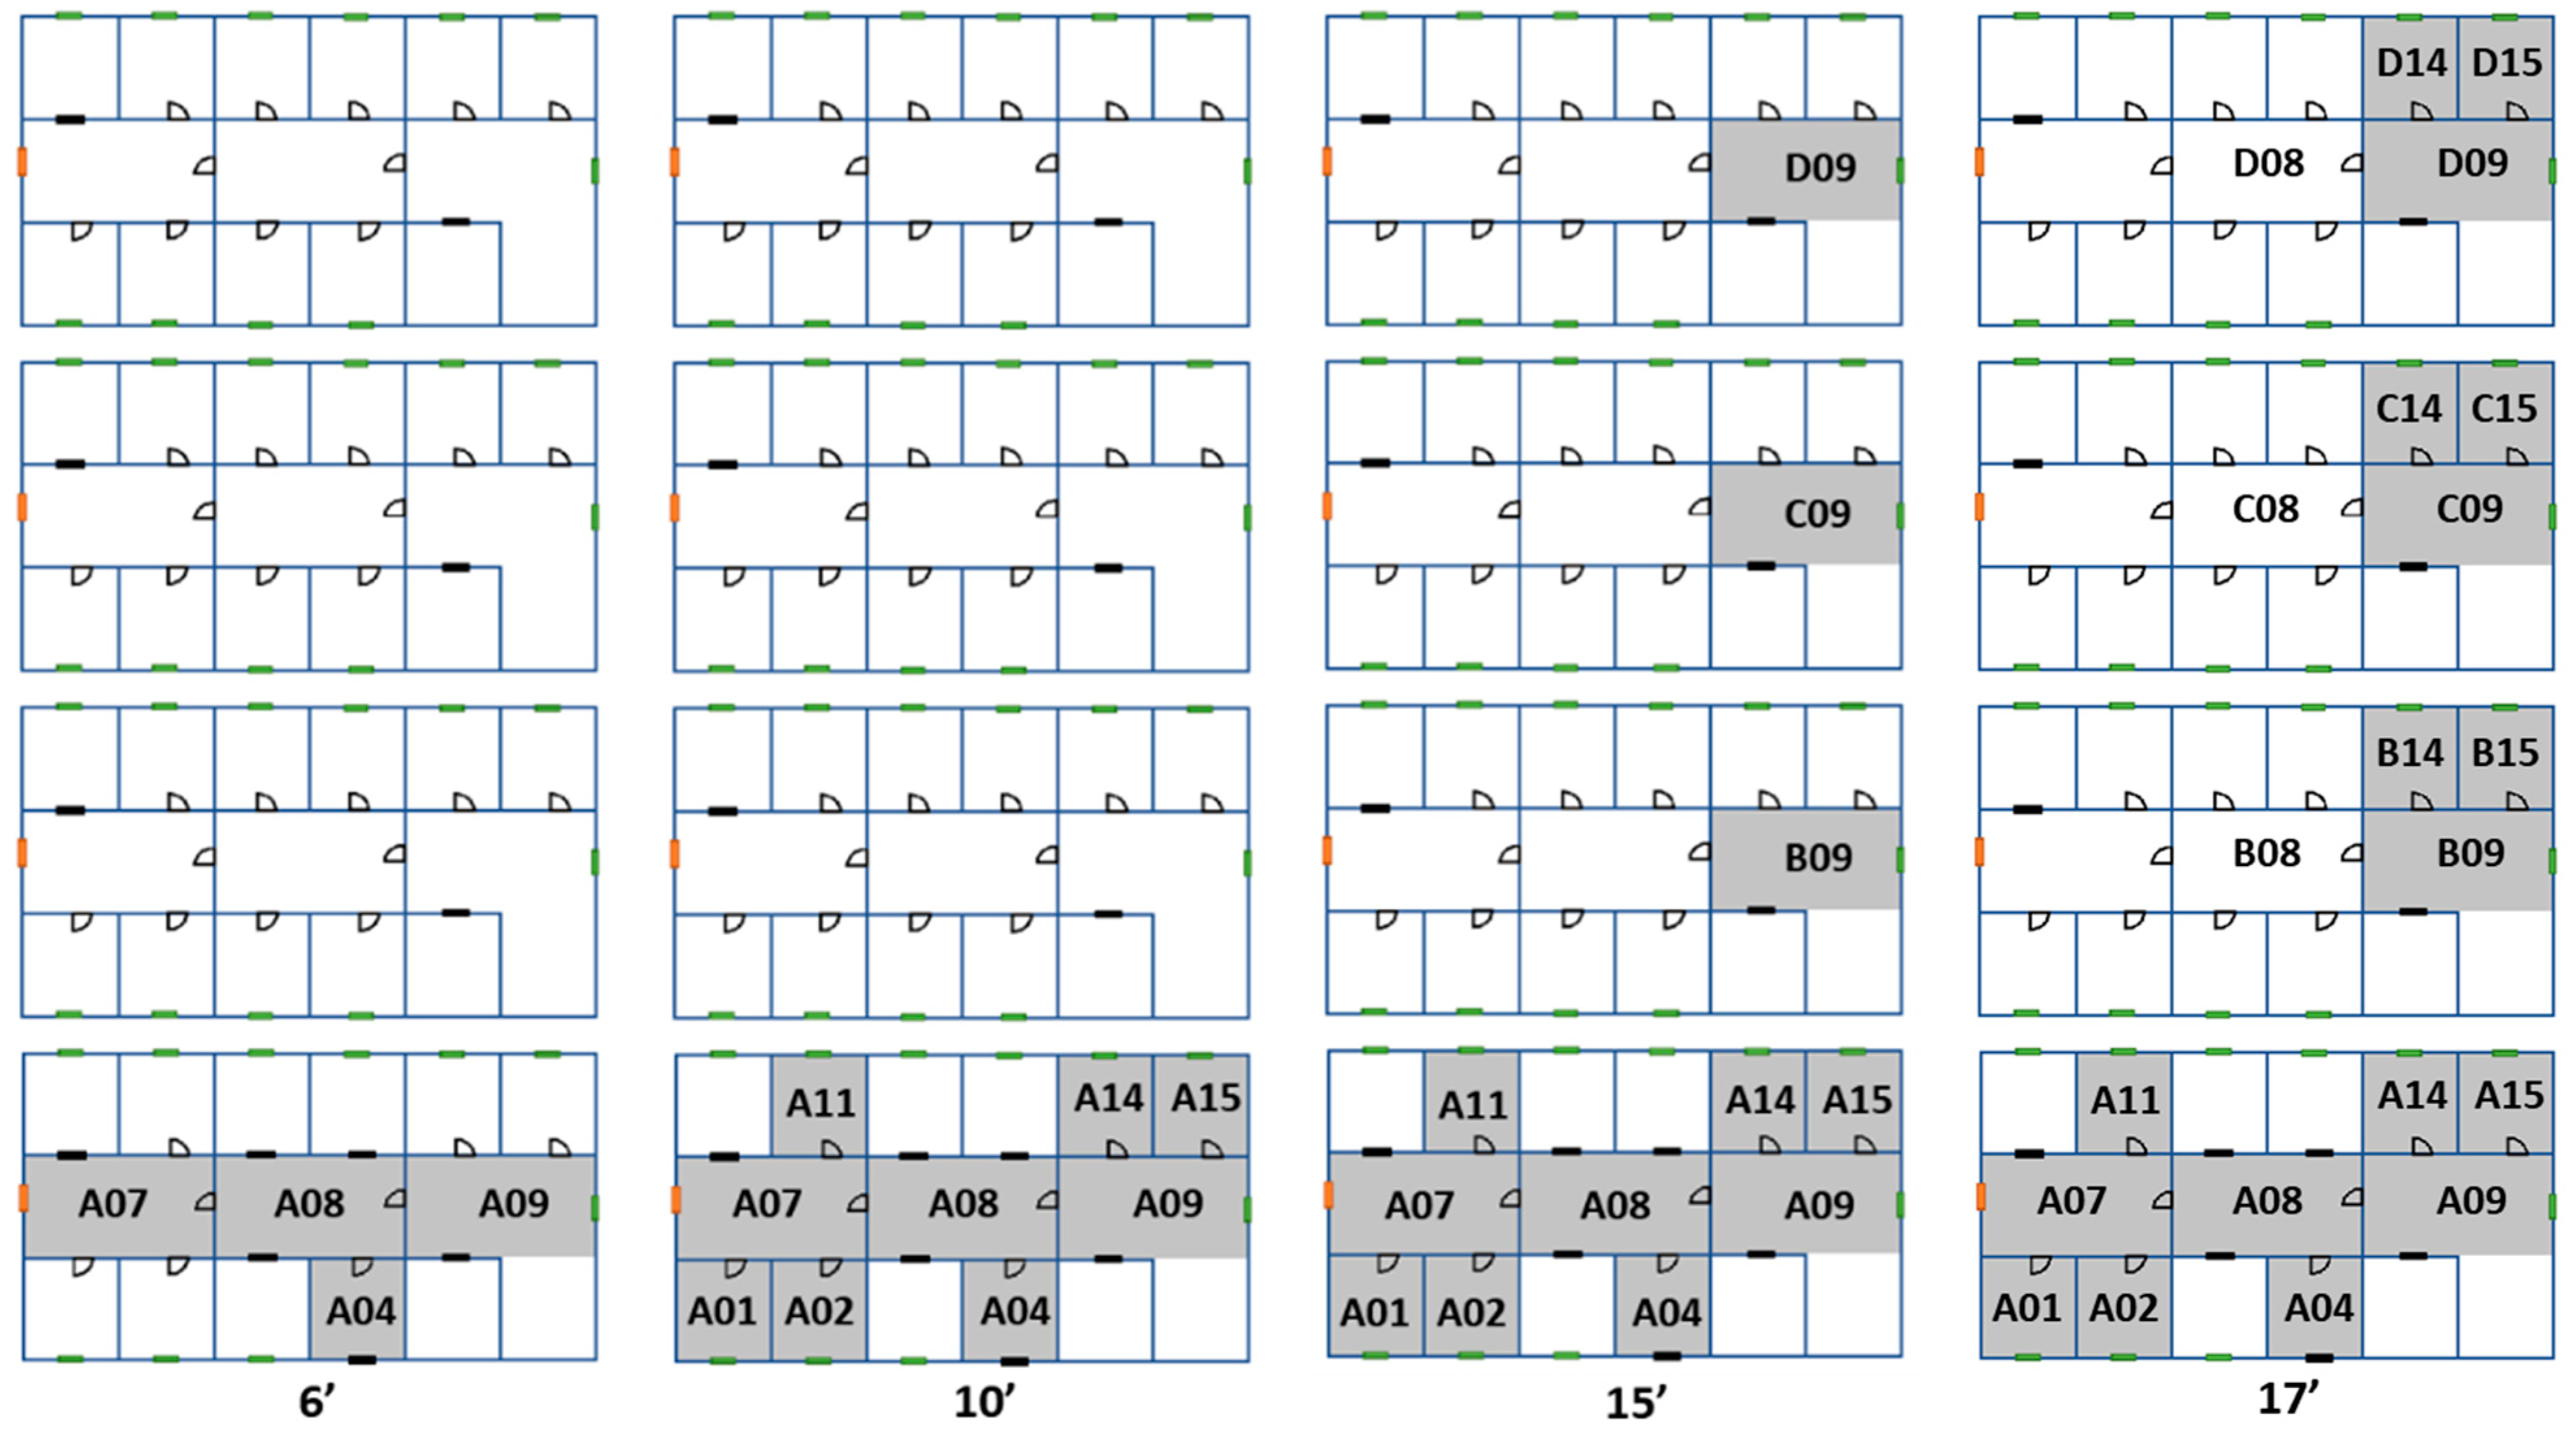
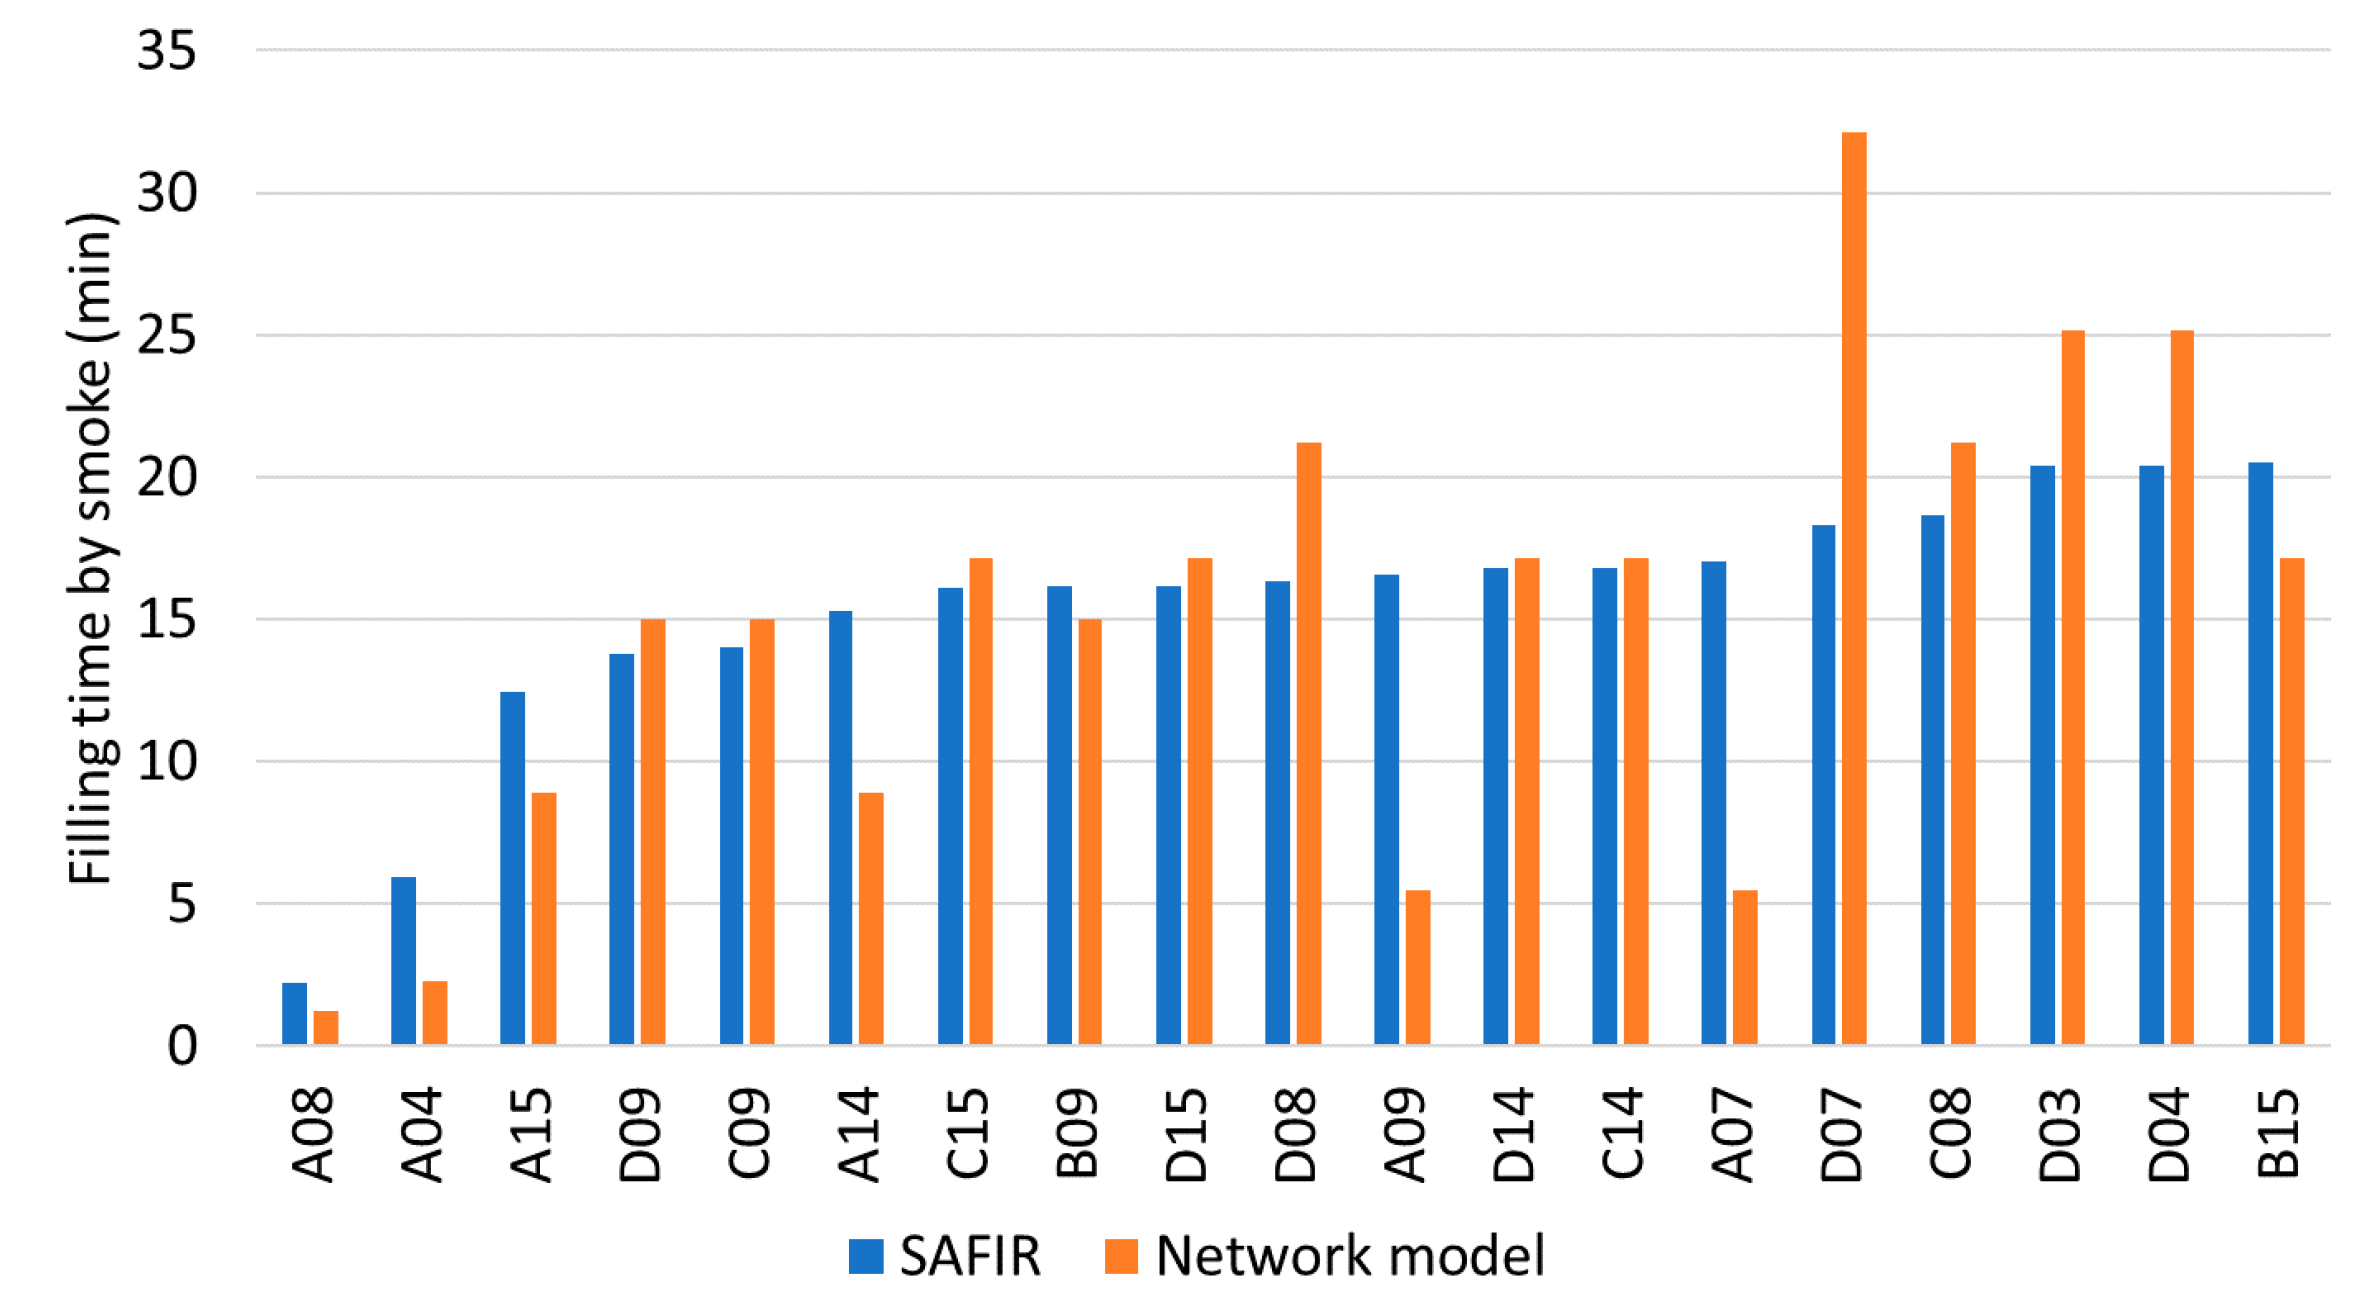
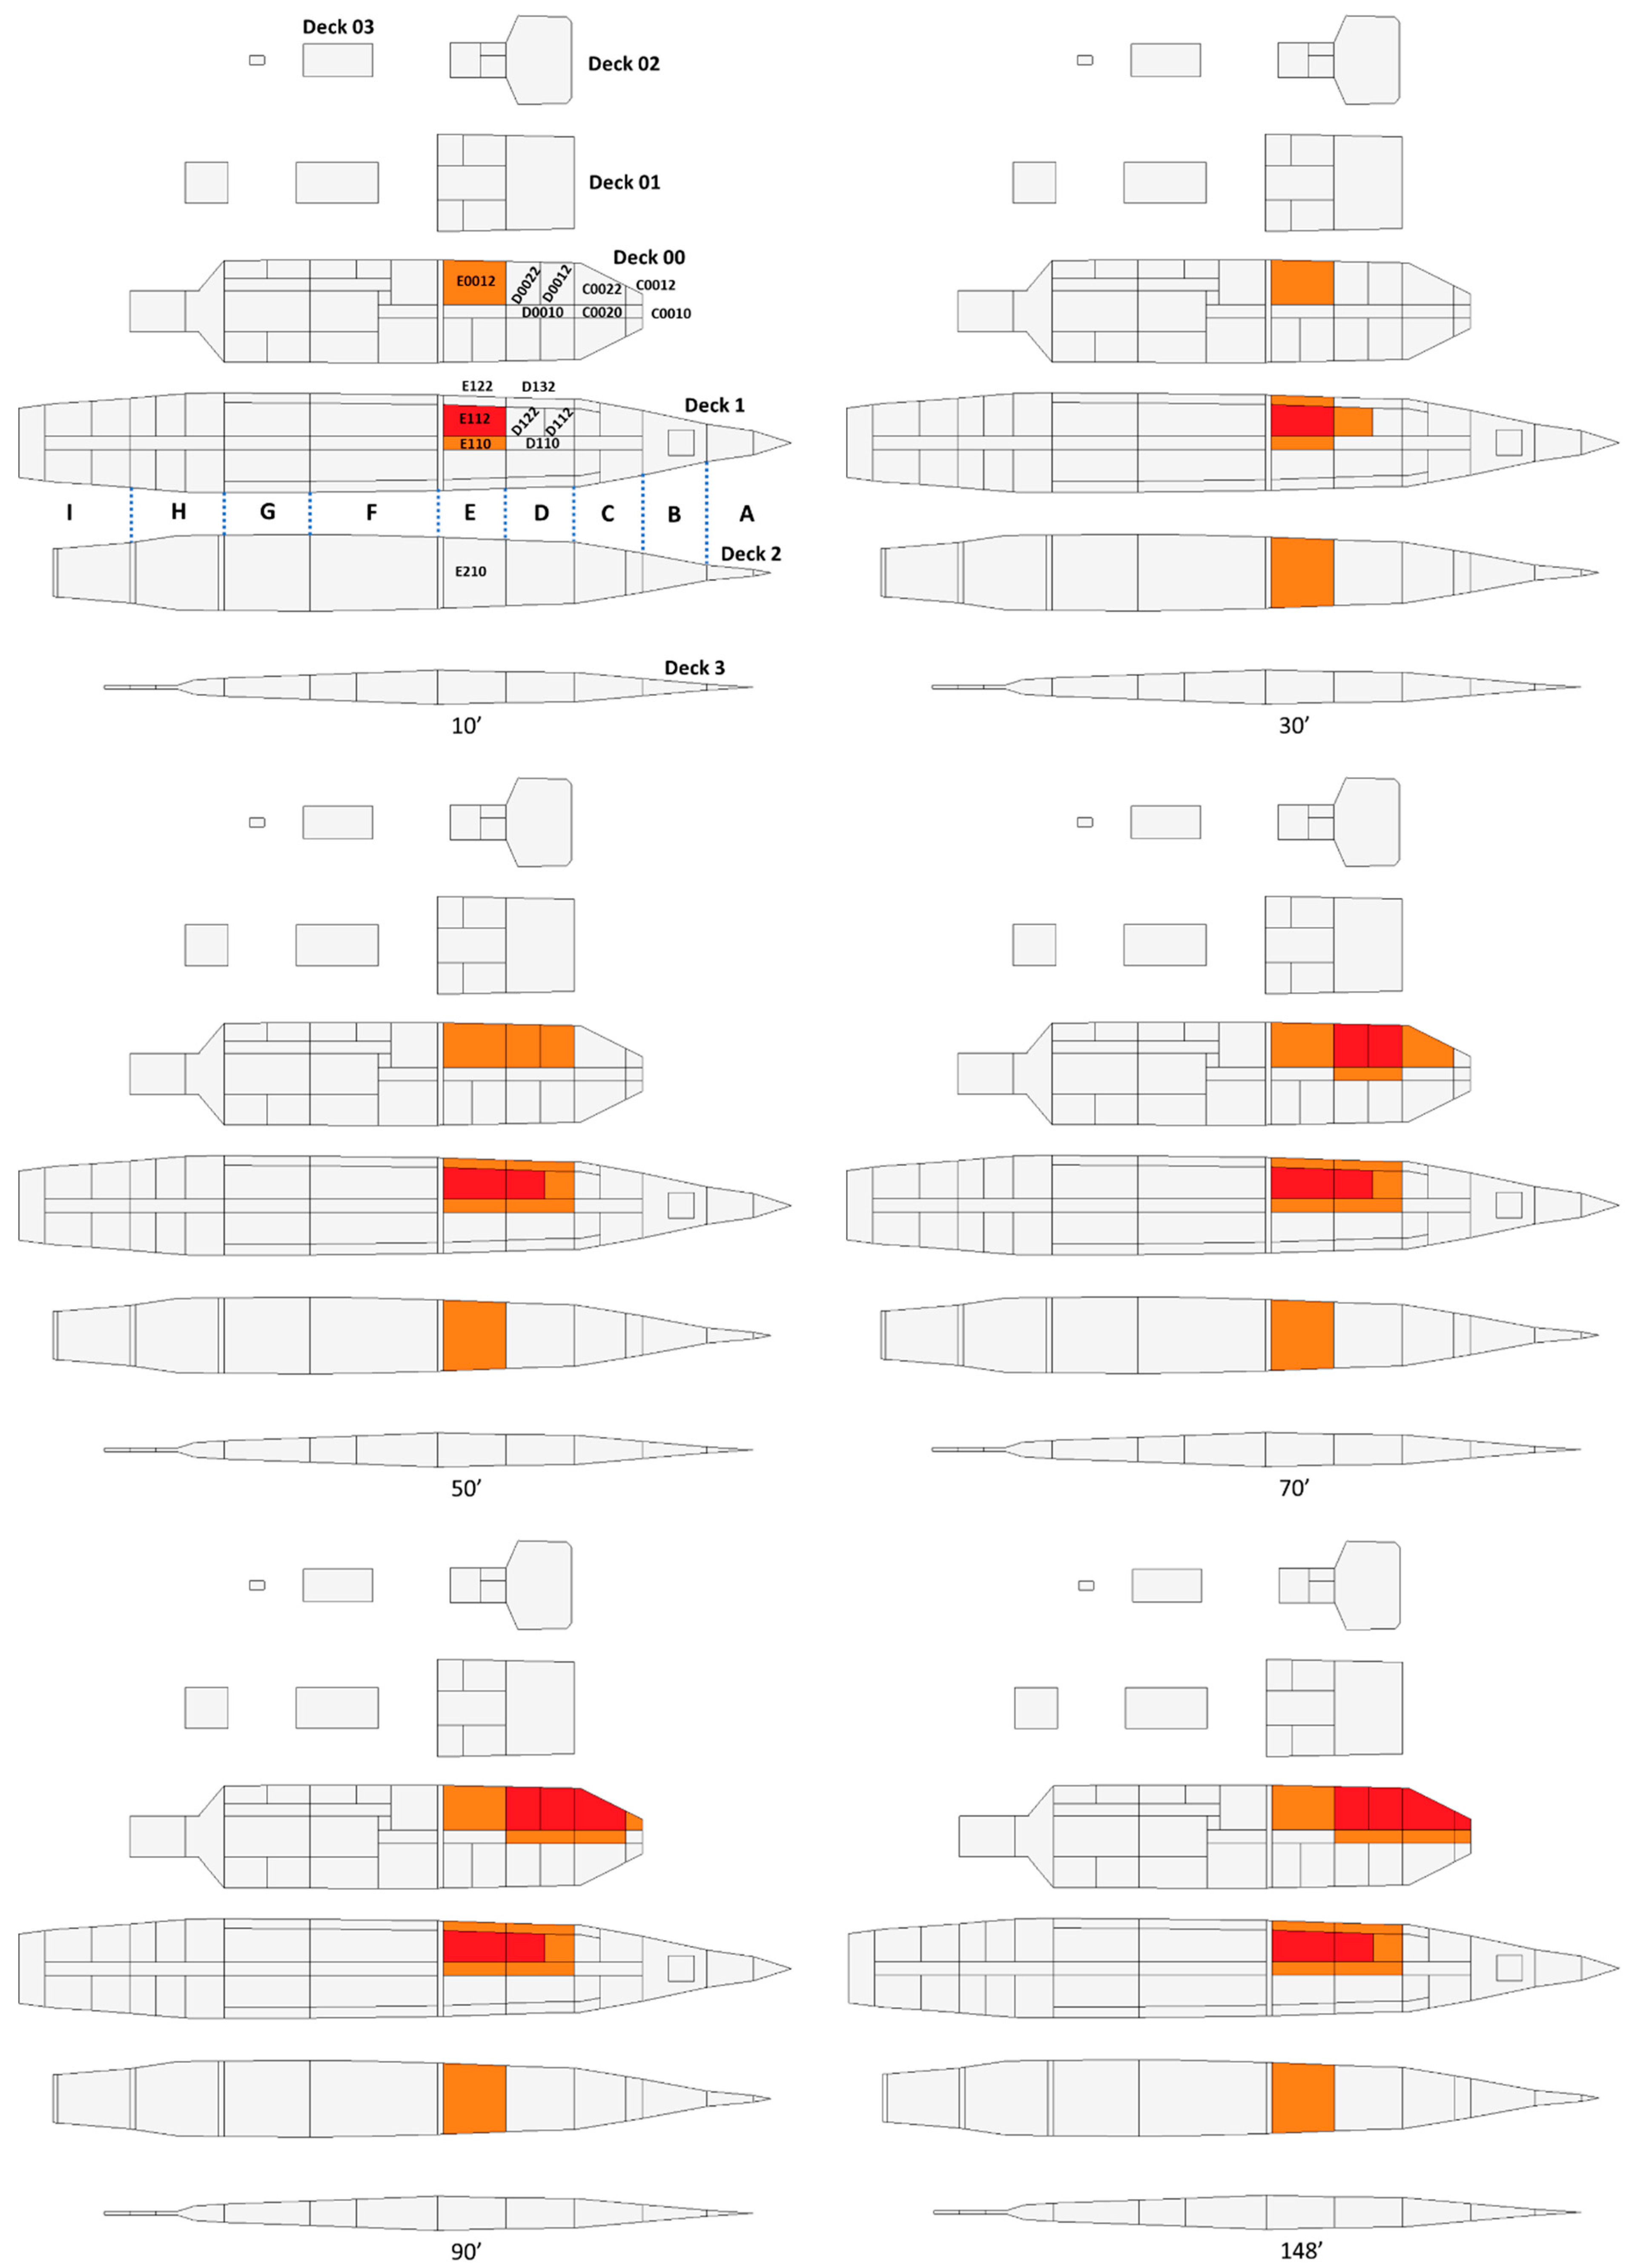
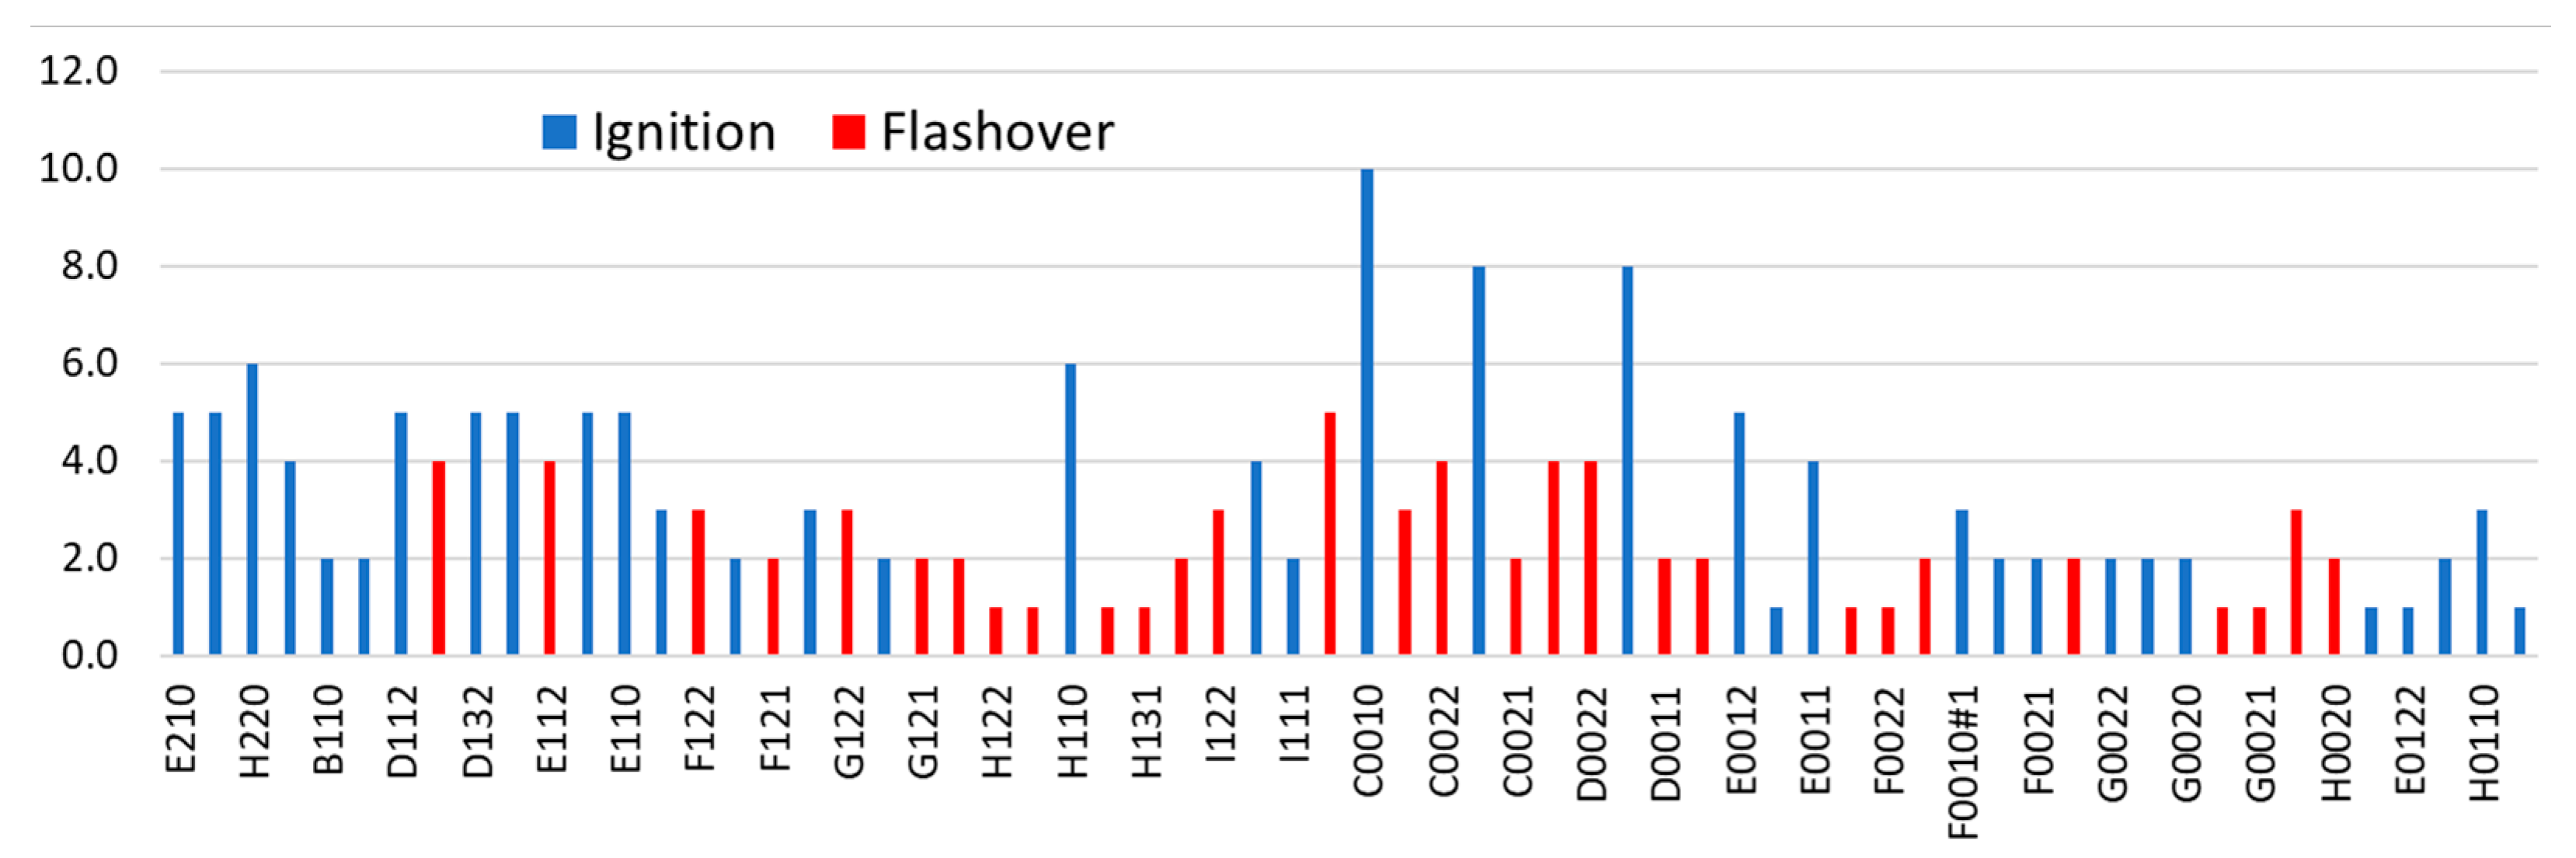
3.2.3. Network Model Results

Using the results obtained from the zone and 1D CFD models, the propagation of fire and smoke in the corvette was simulated by the network model. Table 7 gives the ignition and flashover times in each compartment affected by the fire for both scenarios.
As shown in Table 7 and Figure 23, the fire spreads through the openings and the walls. The onset of flashover in E112 at 9′ allows for the fire to spread to the adjacent rooms connected by an opening, i.e., by a hatch to room E0012 and an open door to room E110. The fire then spreads through the side walls to rooms E122 and D122 in 18′, and then through the floor to room E210 after 22′. The fire then gradually spreads to section D, first to deck 1 via room D110 after 34′, then via rooms D112 and D132 at 43′. The fire finally reaches deck 00, igniting rooms D0012 and D0022 (45′) and D0010 (54′). It spreads to deck 00 in section C, in room C0022 at 63′, then in rooms C0020, C0012, and C0010 after 72′, 81′, and 148′. In 148′, the fire spreads to 16 rooms on three decks (decks 2 to 00). Of the 16 rooms affected, 6 reach the flashover. Corridors stop the spread of fire from one side of the ship to the other. The cofferdams, placed between each section, also limit the propagation of fire from one section to another and, in our case, confine the fire in sections C to E.
As expected, the smoke affects more rooms than the fire (Figure 24). During the first minutes of the fire, the transport of smoke is vertical. As the fire origin compartment E112 is connected by a hatch to rooms E0012, E0110, and E0212, the smoke logically spreads to the upper decks, which are filled with smoke in only 10′. After 15′ of fire, sections D and E are filled with smoke on four different decks (decks 1 to 02). The fire then spreads laterally to the two remaining decks (decks 1 and 00). Section C is filled after 20′, followed by sections F and H, 5′ later. It is necessary to wait 30′, after the rooms of the upper decks are filled, for the room F210 of deck 2 to be affected by the smoke. After 30′, the smoke fills all the available space, i.e., 76 rooms on decks 2 to 02 in which the smoke interface is less than 1.80 m.
If we compare the simulation results obtained for the two fire scenarios (Table 7), it can be observed that mechanical ventilation leads to an earlier ignition of the rooms connected to the fire origin compartment by the ventilation duct, in particular room D112, which ignites 19′ earlier. On the other hand, it only slightly modifies the ignition and flashover times of the other rooms, the difference not exceeding 2′, nor the duration of the fire (148′ vs. 147′). The mechanical ventilation slightly modifies the filling of the rooms by the smoke from the fire origin compartment, as observed by comparing Figure 24 and Figure 25. As the duct is open in room C112, this room will start filling with smoke at the same time as E112. The duct connecting rooms E112 and C112 transports the smoke to room C112, which fills up to 1.80 m from the floor after only 5′, compared to 15′ in the case without mechanical ventilation. The smoke is shared between the filling of the upper decks (section E) through the hatches and the filling of section C by the ventilation duct. Ten minutes after the start of the fire, the filling of the rooms is slightly delayed compared to the case without ventilation, with 18 of the 25 planned rooms filled with smoke. The smoke in the ventilation duct slows down faster and therefore takes longer to fill the same rooms. After 15′ of fire, the upper floors are filled, and the spread is lateral on decks 1 and 00. It takes 27′ for all decks to be filled. The ignition of room D112, which occurs 19′ earlier by transmission of the fire via the ventilation duct connected to room E112, increases the production of smoke. The entire available space, i.e., 76 rooms, is filled with smoke in 27′ instead of 30′ in the case without mechanical ventilation.

4. Fire Vulnerability and Risk Maps

The network model can be used to provide vulnerability and risk maps, allowing for the compartments to be classified according to their vulnerability or their propensity to generate serious fires. The procedure is as follows: a fire is ignited in one of the structure’s sensitive compartments, and the average number of times the other compartments are affected by the fire (ignition, followed or not by flashover) is recorded; this is repeated for each of the sensitive compartments, and an average is calculated over all fire scenarios. In the example given below, we are only focusing on the spread of fire in the corvette, assuming that the mechanical ventilation was off. The histogram in Figure 26 allows for a quick assessment of the vulnerability of each sensitive compartment. The most vulnerable room is room C0010, which was hit 10 times by fire. However, it did not experience any flashover, making it unsuitable for spreading fire. The same goes for rooms C0020 and D0010, which are slightly less vulnerable, having been hit only 8 times. Nearly a third of the rooms, mainly on decks 0 and 1, experienced one or more flashovers (in red in Figure 26).
The results can also be used to rank compartments based on their propensity to generate fires of varying severity when they originate the fire. Examination of Figure 27 shows that some compartments have a greater ability to generate fully developed fires in other compartments, such as compartments D122, E112, H122, H132, C0022, D0012, and D0022. These are compartments with a high degree of connectivity (the “super nodes” or “hot spots” of the network) and whose fuel load and ventilation conditions can lead to sufficiently large and oxygenated fires.
Vulnerability and risk maps can thus be used to help decision makers identify areas to defend or contain using reinforced detection and protection systems (e.g., insulation or water spray systems).

5. Conclusions

This paper presents a hybrid multiscale approach to produce real-time fire and smoke maps in large multicompartment structures. The proposed approach is based on a network model, whose inputs are determined from two validated models, namely a zone model and a 1D CFD model. Two demonstration cases for a four-story office building and a generic military corvette are presented herein. For the first one, a statistical study is conducted to produce fire risk maps, ranking the building compartments by to their propensity to burn or generate fires of varying severity, and identifying the sensitive and vulnerable areas to be defended. At this stage of development, smoke transport is calculated by a simple filling model whose limits are identified, by comparing results from such a model with results from a validated 3D CFD software for the building application. A good agreement is found when smoke propagation is not influenced too much by the entire building system and its ventilation. Otherwise, when a strong two-way interaction exists, the agreement degrades. Although further work is needed to improve the modeling of smoke transport, we believe that the hybrid approach could be the basis of a decision support tool, ranging from simple sizing of fire detection and control systems, or design of less vulnerable architectures, to fire risk prevention and real-time fire management in multicompartment structures and the training of firefighting staff. The hybrid approach allows modelers to extend the computational domain and explicitly examine an entire system that may have hundreds or even thousands of compartments. This could only be achieved with a CFD code (due to the computational resources it would require) by simplifying the geometry of the system or by considering only a part of the total system and expand conclusions to the entire system [1]. The hybrid method therefore appears to be a good compromise between accuracy and simulation time to simulate fire and smoke propagation in very large structures, with time constraints being a permanent challenge in fire safety engineering.

Supplementary Materials

The following supporting information can be downloaded at: https://www.mdpi.com/article/10.3390/app12094123/s1: Figure S1: Deck plans of the corvette, showing ceiling insulation; Figure S2: Deck plans of the corvette, showing bulkhead and hull insulation.

Author Contributions

Software, N.D. and N.S.; conceptualization, methodology, and writing—original draft, B.P.; investigation, Y.P., M.M. and P.P.; project administration, J.L.; data curation, T.P. and D.A. All authors have read and agreed to the published version of the manuscript.

Funding

This research was funded by the Association Nationale de la Recherche et de la Technologie ANRT under CIFRE grant n° 2017/1739. and jointly by the Délégation Générale de l’Armement DGA and the Agence Nationale de la Recherche ANR under grant n°ANR-17-ASMA-0005.

Institutional Review Board Statement

Not applicable.

Informed Consent Statement

Not applicable.

Data Availability Statement

Data supporting the results of this study are available on request from J.L.

Acknowledgments

The authors wish to express their thanks for the financial support of ANRT, DGA, and ANR.

Conflicts of Interest

The authors declare no conflict of interest. The funders had no role in the design of the study; in the collection, analyses, or interpretation of data; in the writing of the manuscript; or in the decision to publish the results.

References

  1. Ralph, B.; Carvel, R. Coupled hybrid modelling in fire safety engineering; a literature review. Fire Saf. J. 2018, 100, 157–170. [Google Scholar] [CrossRef]
  2. Olenick, S.M.; Carpenter, D.J. An updated international survey of computer models for fire and smoke. J. Fire Prot. Eng. 2003, 13, 87–110. [Google Scholar] [CrossRef]
  3. Walton, W.D. Zone computer fire models for enclosures. In SFPE Handbook of Fire Protection Engineering, 3rd ed.; DiNenno, P.J., Ed.; National Fire Protection Association: Quincy, MA, USA, 2008. [Google Scholar]
  4. International Survey of Computer Models for Fire and Smoke, Combustion Science & Engineering, Inc. Available online: http://www.firemodelsurvey.com/ZoneModels.html (accessed on 14 March 2022).
  5. Tanaka, T.A. Model of Multiroom Fire Spread; NBSIR 83-2718; National Institute of Standards and Technology: Gaithersburg, MD, USA, 1983.
  6. Wade, C.A. A User’s Guide to BRANZFIRE 2004; Building Research Association of New Zealand: Wellington, New Zealand, 2004. [Google Scholar]
  7. Peacock, R.D.; McGrattan, K.B.; Forney, G.P.; Reneke, P.A. CFAST—Consolidated Fire and Smoke Transport Version 7—Volume 1: Technical Reference Guide, NIST Technical Note 1889v1; National Institute of Standards and Technology: Gaithersburg, MD, USA, 2015.
  8. McGrattan, K.; Hostikka, S.; McDermott, R.; Floyd, J.; Vanella, M.; Weinschenk, C.; Overholt, K. Fire Dynamics Simulator Version 6—Technical Reference Guide, Volume 1: Mathematical Model; Volume 2: Verification; Volume 3: Validation; Volume 4: Configuration Management, 6th ed.; NIST Special Publication 1018; National Institute of Standards and Technology: Gaithersburg, MD, USA, 2017.
  9. OpenFOAM: User Guide v2112. Available online: https://www.openfoam.com/documentation/guides/latest/doc/guide-applications-solvers-combustion-fireFoam.html (accessed on 14 March 2022).
  10. Mense, M.; Pizzo, Y.; Prétrel, H.; Lallemand, C.; Porterie, B. Experimental and numerical study on low-frequency oscillating behaviour of liquid pool fires in a small-scale mechanically ventilated compartment. Fire Saf. J. 2019, 108, 102824. [Google Scholar] [CrossRef]
  11. Floyd, J.E.; Hunt, S.P.; Williams, F.W.; Tatem, P.A. A Network Fire Model for the Simulation of Fire Growth and Smoke Spread in Multiple Compartments with Complex Ventilation. J. Fire Prot. Eng. 2005, 153, 228. [Google Scholar] [CrossRef] [Green Version]
  12. Cheng, H.; Hadjisophocleous, G.V. Dynamic modeling of fire spread in building. Fire Saf. J. 2011, 46, 211–224. [Google Scholar] [CrossRef]
  13. Kacem, A.; Lallemand, C.; Giraud, N.; Mense, M.; De Gennaro, M.; Pizzo, Y.; Loraud, J.-C.; Boulet, P.; Porterie, B. A Small-World Network Model for the Simulation of Fire Spread Onboard Naval Vessels. Fire Saf. J. 2017, 91, 441–450. [Google Scholar] [CrossRef]
  14. Porterie, B.; Pizzo, Y.; Mense, M.; Sardoy, N.; Louiche, J.; Dizet, N.; Porterie, T.; Pouschat, P. Development and validation of a zone fire model embedding multi-fuel combustion. Appl. Sci. 2022, 12, 3951. [Google Scholar] [CrossRef]
  15. ISO/PDTS 16733; Fire Safety Engineering—Selection of Design Fire Scenarios and Design Fires. International Standards Organization: Geneva, Switzerland, 2005; Volumes 2–4, 7, pp. 14–17.
  16. British Standards Institution. PD 7974-1:2003, Application of Fire Safety Engineering Principles to the Design of Buildings—Part 1: Initiation and Development of Fire within the Enclosure of Origin; British Standards Institution: London, UK, 2003. [Google Scholar]
  17. Bukowski, R.W. Fire hazard analysis. In Fire Protection Handbook, 19th ed.; Cote, A.E., Ed.; National Fire Protection Association: Quincy, MA, USA, 2003; Volume I, Chapters 3–7. [Google Scholar]
  18. Heskestad, G.; Delichatsios, M.A. The Initial Convective Flow in Fire. Symp. (Int.) Combust. 1979, 17, 1113–1123. [Google Scholar] [CrossRef]
  19. Heskestad, G.; Delichatsios, M.A. Environments of Fire Detectors—Phase I: Effect of Fire Size, Ceiling Height, and Material, Volume I: Measurements (NBS-GCR-77-86), Volume II: Analysis (NBS-GCR-77-95); National Technical Information Service (NTIS): Springfield, VA, USA, 1977.
  20. Tewarson, A. Generation of heat and chemical compounds in fires. In SFPE Handbook of Fire Protection Engineering, 3rd ed.; DiNenno, P.J., Ed.; National Fire Protection Association: Quincy, MA, USA, 2008. [Google Scholar]
  21. Babrauskas, V. Estimating pool fire burning rates. Fire Technol. 1983, 19, 251–261. [Google Scholar] [CrossRef]
  22. Babrauskas, V. Ignition Handbook; Fire Science Publishers: Issaquah, WA, USA, 2003. [Google Scholar]
  23. Graf, S.H. Ignition Temperatures of Various Papers, Woods and Fabrics. Bulletin n 26; Engineering Experiment Station: Oregon State College, Corvallis, OR, USA, 1949. [Google Scholar]
  24. STM Standard D777; Standard Test Methods for Flammability of Treated Paper and Paperboard. ASTM International: West Conshohocken, PA, USA, 1997.
  25. White, K.A. Ignition of Cellulosic Paper at Low Radiant Fluxes. NASA Technical Memorandum 107311; Lewis Research Center: Cleveland, OH, USA, 1996. [Google Scholar]
  26. Porterie, B.; Pizzo, Y. Characterization of Ignition of Combustible Targets; DGA Internal Report; DGA: Los Angeles, CA, USA, 2017. [Google Scholar]
  27. Gottuk, D.T.; Lattimer, B.Y. Effect of Combustion—Conditions on Species Production. In SFPE Handbook of Fire Protection Engineering, 3rd ed.; DiNenno, P.J., Ed.; National Fire Protection Association: Quincy, MA, USA, 2008. [Google Scholar]
  28. Yamaguchi, J.-I.; Tanaka, T. Simple equations for predicting smoke filling time in fire rooms with irregular ceilings. Fire Sci. Technol. 2005, 244, 165–178. [Google Scholar] [CrossRef] [Green Version]
  29. Bailey, J.L.; Forney, G.P.; Tatem, P.A.; Jones, W.W. Development and validation of corridor flow submodel for CFAST. J. Fire Prot. Eng. 2002, 12, 139–161. [Google Scholar] [CrossRef]
  30. Hu, L.H.; Huo, R.; Li, Y.Z.; Wang, H.B.; Chow, W.K. Full-scale burning tests on studying smoke temperature and velocity along a corridor. Tunn. Undergr. Space Technol. 2005, 20, 223–229. [Google Scholar] [CrossRef]
  31. Law, M. Fire safety of external building elements—The design approach. AISC Eng. J. 1978, 15, 59–74. [Google Scholar]
  32. Giraud, N. A Network Model of Fire Spread in Large Multi-Compartment Structures. Ph.D. Thesis, Aix-Marseille University, Marseille, France, 2016. [Google Scholar]
  33. European Standard EN 1991-1-2; Eurocode 1: Actions on Structures, Part 1–2: General Actions, Actions on Structures Exposed to Fire. CEN: Brussels, Belgium, 2003.
  34. QinetiQ. Marine Design Software. Available online: https://www.qinetiq.com/en/what-we-do/services-and-products/marine-design-software (accessed on 14 March 2022).
Figure 1. Hybrid multiscale approach schematic.
Applsci 12 04123 g001
Figure 2. The successive phases of enclosure fire development and notations used. t i g is the ignition time, t f o is the flashover time, t d e is the time of fire decay, t e n d is the time when fire ends, τ f o is the duration of fire growth phase from ignition to flashover, τ f d is the duration of the fully developed phase, and τ d e is the duration of the decay phase.
Applsci 12 04123 g002
Figure 3. Predicted and measured HRR time curves of (a) heptane and (b) JP5 pool fires with diameters of 50 cm and 70 cm.
Applsci 12 04123 g003
Figure 4. Example of a network graph, showing connectivity between compartments.
Applsci 12 04123 g004
Figure 5. Flow chart of the network model.
Applsci 12 04123 g005
Figure 6. Schematic of the DIAMAN device, showing the instrumented ventilation duct.
Applsci 12 04123 g006
Figure 7. (a) Heat release rate of a 70 cm diameter heptane pool fire, and (b) distances traveled in time by the isotherms at 180 and 250 °C.
Applsci 12 04123 g007
Figure 8. Plans of (a) the first floor ( z = 0 ) and (b) the second floor ( z = 3 m) of the four-story building. The layouts of the compartments on the third and fourth floors (not shown) are identical to that of the second floor. The fire starts in compartment A08 (red star).
Applsci 12 04123 g008
Figure 9. HRR time curves for the three types of building compartments.
Applsci 12 04123 g009
Figure 10. Time evolution of (a) mass flow rate, and (b) temperature and density of the smoke leaving the archive room.
Applsci 12 04123 g010
Figure 11. First fire scenario in the four-story building: fire maps predicted by the network model after 19′, 27′, 34′, and 63′ of fire. Color code: orange: ignited compartments; yellow: compartments where the fire was transmitted through an exterior window; red: compartments where fire is fully developed; gray: compartments where fire is extinguished.
Applsci 12 04123 g011
Figure 12. First fire scenario in the four-story building: smoke maps predicted by the network model after 6′, 10′, 15′, 17′, 21′, 25′, 32′, and 36′ of fire. The areas in gray correspond to compartments where the smoke height is less than 1.80 m.
Applsci 12 04123 g012aApplsci 12 04123 g012b
Figure 13. First fire scenario in the four-story building: smoke concentration field (in ppm) predicted by the 3D CFD code SAFIR after 15′ of fire.
Applsci 12 04123 g013
Figure 14. First fire scenario in the four-story building: smoke maps predicted by the 3D CFD code SAFIR after 6′, 10′, 15′, 17′, and 21′ of fire. The shaded areas correspond to compartments where the smoke height is less than 1.80 m.
Applsci 12 04123 g014
Figure 15. First fire scenario in the four-story building: comparison between the filling times predicted by the network model and the 3D CFD code SAFIR.
Applsci 12 04123 g015
Figure 16. Second fire scenario in the four-story building: smoke concentration field (in ppm) predicted by the 3D CFD code SAFIR after 15′ of fire.
Applsci 12 04123 g016
Figure 17. Second fire scenario in the four-story building: comparison between the filling times predicted by the network model and the 3D CFD code SAFIR.
Applsci 12 04123 g017
Figure 18. 3D view of the generic corvette SURVIVE®.
Applsci 12 04123 g018
Figure 19. Deck plans of the corvette, showing the referencing and distribution of the compart-ments.
Applsci 12 04123 g019
Figure 20. Deck plans of the corvette, showing the location and status of the corvette’s openings.
Applsci 12 04123 g020
Figure 21. Design fire of the accommodation compartment E112.
Applsci 12 04123 g021
Figure 22. Distance travelled over time by the isotherm 350 °C in the ventilation duct, measured from the fire origin compartment.
Applsci 12 04123 g022
Figure 23. First fire scenario in the corvette (no mechanical ventilation): fire maps predicted by the network model after 10′, 30′, 50′, 70′, 90′, and 148′ of fire. Color code: orange: compartments where ignition occurs but not flashover; red: compartments where fire is fully developed.
Applsci 12 04123 g023
Figure 24. First fire scenario in the corvette (no mechanical ventilation): smoke maps predicted by the network model after 5′, 10′, 15′, 20′, 25′, and 30′ of fire. The areas in gray correspond to compartments where the smoke height is less than 1.80 m: in light gray, the compartments affected by smoke at the current time; in dark gray, those affected by smoke at previous times.
Applsci 12 04123 g024aApplsci 12 04123 g024b
Figure 25. Second fire scenario in the corvette (with mechanical ventilation): smoke maps predicted by the network model after 5′, 10′, 15′, and 27′ of fire. The areas in gray correspond to compartments where the smoke height is less than 1.80 m: in light gray, the compartments affected by smoke at the current time; in dark gray, those affected by smoke at previous times.
Applsci 12 04123 g025
Figure 26. Histogram of the average number of times a room was affected by a fire, followed (in red) or not (in blue) by a flashover. For example, compartment E0012 was involved with fire 5 times, but flashover occurred only once.
Applsci 12 04123 g026
Figure 27. Histogram of the average number of rooms affected by the fire, with (in red) or without (in blue) flashover, depending on the fire origin compartment. For example, a fire starting in room D122 causes the ignition of 15 rooms, 5 of which reach flashover.
Applsci 12 04123 g027
Table 1. Nature and initial mass of the fuel components present in the three types of compartments and values of the parameters required to build their design fires. In this table, for each fuel component, m 0 is the initial mass of fuel, α g r is the fire growth rate, Δ h c h is the chemical heat of combustion, p is the fraction of m 0 beyond which fire begins to decay, H R R m a x is the maximum value of HRR, and A f is the surface area of fuel (see Section 2.2). Combustion properties of wood, PMMA, and PU foam are available in [20].
Type of CompartmentFuel Components m 0
(kg)
α g r
(W/s2)
Δ h c h
(MJ/kg) [20]
p H R R m a x
(MW)
A f
(m2)
Fire Load Density (MJ/m2)
Private officeWood pine17.5312.40.650.2401
PMMA15.01524.20.850.760153.5
PU foam17.54928.00.850.8101
Co-working
compartment
Wood pine35.0312.40.650.5202
PMMA30.01524.20.851.560253.5
PU foam35.04928.00.851.7702
Archive roomWood pine200.03.12.40.654.000262.0
Table 2. Thermal properties of the constituent materials of the walls and partitions of the four-story building (manufacturer’s data).
MaterialConductivity
(W/m/deg.)
Density
(kg/m3)
Specific Heat
(J/kg/deg.)
Emissivity
Plasterboard BA130.2590010000.9
Rock wool0.0386010300.9
Concrete1.75230021600.7
Table 3. Zone model results for the eight fire scenarios. NF means no flashover.
FireType ofOpen DoorsWindowsTime (mm′ss″)
ScenarioCompartmentOpen 1/ClosedFlashoverDecayExtinguishment
FS1Private
office
1 (e.g., A01)0/17′49″9′20″29′00″
FS21/0NF
FS3Co-working
compartment
4 (e.g., A07 with emergency exits closed)-9′20″10′00”28′11”
FS44 (e.g., A09 with stairwell)0/19′20″
FS51/0NF
FS65 (e.g., A07 with emergency exits open)-NF
FS76 (e.g., B08)-NF
FS8Archive room3 (A08)-18′46″19′40″30′10″
1 Due to a break in the glazing of the windows facing the outside.
Table 4. Fire chronology for the first fire scenario in the four-story building.
Compartment NumberFloorTime (min)
IgnitionFlashoverExtinguishment
A08101825
A041192528
A071192629
A091192729
A011273336
A021273336
A111273336
A141273336
A151273336
B09227-55
B01234-63
B02234-63
B11234-63
B14234-63
B15234-63
Table 5. Characteristics of the different types of compartments.
Type of CompartmentContentEquivalent Fuel(s) m 0
(kg/m2)
α g r
(W/s2)
p H R R m a x   1
(MW)
A f / A F   2
(%)
Control roomElectronic and computer equipment, electrical cablesPU foam2.7490.850.657.5
PMMA4.530.800.457.5
AccommodationFurniture, bedding, textiles, …PU foam7.7490.850.657.5
PMMA4.330.800.457.5
Messroom and recreational roomChairs, benches, woodenfurniture, …PU foam1.1490.850.653.33
PMMA3.630.800.453.33
Pine wood1630.650.393.33
Electrical roomElectric cablesPMMA7530.800.4510
Ammunition storage magazinesNot modelled
CorridorElectric cablesPMMA4530.800.4520
Engine roomHydrocarbonsHeptane12.1490.951.405
Diesel fuel11.4490.851.565
Fuel tankNot modelled
Fuel storage roomHydrocarbons, oils, …Heptane71490.951.4010
Mixed storage roomHydrocarbons, wooden furniture, electrical equipment, …Heptane91.6490.951.403.33
PMMA26430.800.453.33
1 Value of H R R m a x for a 1 m diameter pool fire. 2 Ratio of the surface area of fuel to the floor area in %.
Table 6. Thermal properties of the constituent materials of corvette bulkheads (manufacturer’s data).
MaterialConductivity
(W/m/deg.)
Density
(kg/m3)
Specific Heat
(J/kg/deg.)
Emissivity
Steel5478504700.95
Rockwool UMPA 24 6.026 × 10 7 T 2 2.245 × 10 4 T + 4.840 × 10 2 2410000.9
Rockwool UMPA 36 3.358 × 10 7 T 2 5.595 × 10 5 T + 2.107 × 10 2 3610000.9
Rockwool UMPA 66 1.856 × 10 7 T 2 6.636 × 10 6 T + 1.345 × 10 2 6610000.9
Glass wool PI 6620.0371610000.9
Rockwoll SEAROX 5.0 × 10 7 T 2 1.332 × 10 4 T + 3.254 × 10 2 10010000.9
Table 7. Ignition and flashover times for the two fire scenarios in the corvette. The values in black correspond to the first scenario (without mechanical ventilation); the values in red correspond to the second fire scenario (with mechanical ventilation).
CompartmentDeckType of CompartmentTime (min)
IgnitionFlashover
E1121Accommodation0099
E001200Messroom99--
E1101Corridor109--
D1221Accommodation18173331
E1221Mixed storage1818--
E2102Accommodation2221--
D1121Accommodation4324--
D1101Corridor3432--
D1321Mixed storage4341--
D001200Accommodation45435452
D002200Accommodation45435553
D001000Corridor5452--
C002200Control room63627270
C002000Corridor7271--
C001200Electrical room8179144143
C001000Mixed storage148147--
Publisher’s Note: MDPI stays neutral with regard to jurisdictional claims in published maps and institutional affiliations.

