1. Introduction
Surface plasmon polaritons (SPPs) are propagating electromagnetic waves that include plasma oscillations of negatively charged particles in metal and lightwave in dielectric/air. In recent years, SPP-based optoelectronic devices have received a lot of interest for their ability to detect a very little variation of analyte refractive index (RI) and provide high sensitivity, immunity to electromagnetic interference, label-free and real-time detection [
1,
2]. The surface plasmon resonance (SPR) occurs at a particular frequency (i.e., resonant wavelength) and similar polarization state when the surface plasmon (SP) is excited by the evanescent electric field and the input-guided lights are phase matched. The resonant wavelength of the SPR-based sensing device is extremely responsive to the analyte in contact and a little alteration of the sensing medium RI results in resonant wavelength shifting; therefore, a qualitative measure of the wavelength shift allows to track unknown analyte RI. Different optical structures, for example, the prism-based structure proposed by Otto and Kretschmann–Raether, fiber Bragg grating, optical fiber, or microstructured optical fiber, are used that increase the momentum of the light to excite SPPs at the metal–dielectric/metal–air boundary by evanescent wave [
3]. The mechanical components of the prism-based sensors are larger in size and associated with moving parts, which limits their applications for the remote sensing operation. Optical fiber-based sensors have great advantages over the prism-based sensors for their small size, flexible nature, and remote sensing operation [
4,
5]. For example, an SPR-based optical-fiber sensor with metallic grating is shown in [
4] with a maximum sensitivity of 25 µm/RIU for RI sensing range from 1.33 to 1.38. However, limited structural parameters of these sensors prohibit their wider operations, and to work as a sensor, cladding needs to be removed. Among different SPR-based sensing configurations, the SPR integrated photonic crystal fiber (PCF) sensors allow endless ways to couple strongly core-guided light with the SP by reshaping structural parameters based on sensing applications and overcome the limitations of conventional systems [
6,
7]. Due to miniaturization, real-time sensing, flexible design, and remote sensing properties, PCF-based SPR sensors can be applied for many useful sensing applications [
7,
8,
9]. The operation of the PCF-based SPR sensors is primarily classified depending on the material deposition either outside on the dielectric of PCF or inside the airhole wall of PCF. Metal layer deposition on the internal wall of PCF leads to good detection of analyte due to easy coupling of the core mode with SPP mode [
10]. However, metal deposition on the wall of a tiny air hole and infiltration of liquid analyte is laborious. On the other hand, metal film deposition over the dielectric surface of PCF makes the sensor fabrication easier, which opens the possibility of novel designs of PCF sensors such as D-shaped sensors, exposed-core sensors, U-shaped sensors, and so on [
11,
12,
13]. The selection of plasmonic metal is crucial to improve the sensitivity of these sensors. Silver, aluminum, copper, and gold are frequently used as sensing media [
14]. Though silver has lower optical damping and a narrow loss spectrum, it exhibits oxidation difficulty in the surroundings aqueous medium [
15]. Gold shows superior performance among all these metals due to being chemically inert, biocompatible, having larger peak shift, and being stable in an aqueous environment [
14,
16].
Most of the substances of interest have an RI less than 1.40. Different biological and chemical samples have an RI in the range of 1.40 to 1.44 [
17,
18]. For example, the RI of kerosine is 1.44, different alcohols have higher RI, such as 1-hexanol which has an RI of 1.416 and 4-methyl-2-pentanol which has an RI of 1.41. Moreover, mammalian (e.g., bovine, porcine, canine, and human) tissues have RIs higher than1.40. For example, the human kidney has an RI of 1.417, and the bovine muscle has an RI of 1.41.
In recent years, intensive efforts have been devoted towards designing D-shaped PCF sensors because they enhance the sensing performance as the energy transfer increases from core to plasmonic mode due to a closer distance between the plasmonic film and core of the PCF [
19]. To fabricate the D-shaped PCF sensors, a portion of PCF is polished by the side-polishing process, and the plasmonic film is placed over the flat surface [
19]. For example, a flat surface-based D-type PCF sensor with a hollow core was proposed in [
20] and using spatially distributed bimetallic layers was proposed in [
21]. However, a deep polishing depth increases the fragility of the PCF, and the flat surface of D-type PCF needs to be smooth, otherwise a nonuniform sensing surface arises that affects sensing performance. The sensing performance increases significantly by introducing a microchannel in the PCF sensor because of the reduction in separation of the sensing layer and core region. For example, a microchannel-based D-shaped sensor showed maximum sensitivity of 27,800 nm/RIU for RI range of 1.37 to 1.41 [
22]. A hexagonal lattice D-shaped PCF sensor containing an open ring channel was proposed in [
12] that can detect RI from 1.20 to 1.29 with a low wavelength sensitivity of 11,055 nm/RIU. This sensor requires extra care to make a D-shape, otherwise at the stage of the side-polishing process of the PCF side, air holes of the open ring may be damaged. A PCF sensor with two microchannels was designed to detect RI from 1.23 to 1.29 with a maximum sensitivity of 13,000 nm/RIU [
23]. The problem with the sensor is that double sides of the PCF need side polishing to obtain a D-shape with microchannels on both sides of the PCF. Moreover, the sensor has low sensitivity and a low detection range. Microchannels not only improve the performance of the D-shaped sensors but also boost the sensing performance of the circular-shaped PCF sensors. For example, a U-shaped microchannel in a circular-shaped PCF next to the core showed maximum sensitivity of 66,000 nm/RIU and a wider sensing range [
13]. However, the problem of the microchannel-embedded PCFs is the difficulty of the fabrication of the channel by using a focused ion beam or laser micromachining process. The sensing layer can also be placed close to the core in the case of exposed core grapefruit fiber-based sensors to increase performance [
24,
25,
26]. Additionally, in suspended core microstructured-fiber, the sensing layer is close to the core that can detect multi analyte [
27]. Besides SPR-based RI sensors, other new RI sensors such as long-range SPP and Bloch surface wave based sensors are proposed to detect RI effectively [
28,
29].
The aim of this work is to detect a wide range of analyte RI with very high sensitivity by incorporating the benefits of a D-shaped PCF sensor and avoiding its surface roughness effect. Therefore, an improved design of a D-shaped PCF-based SPR sensor is proposed in this work with a large semicircular open channel. The construction of the novel D-shaped PCF sensor is easier because of its hexagonal lattice structure. The channel open-up process can be completed along with the fabrication of D-shaped PCF by the side-polishing method. To avoid the fragility of the PCF, we use a shallow polishing depth. Plasmonic material gold is deposited on the interior surface of the large semicircular channel. Since the plasmonic layer is deposited inside the curved channel, we can ignore the surface roughness effect of the D-shaped PCF on the sensing performance. Due to the poor adhesion of gold with the background silica, a thin adhesive coating of TiO2 is placed over the curved surface of the channel. Numerical analysis shows that the PCF-based sensing device has a wider detection range of analytes with wavelength sensitivity of 63,000 nm/RIU and maximum amplitude sensitivity of 1439 RIU−1. The large semicircular-shaped channel provides quick infiltration of analyte and effortless cleaning of the channel.
2. The Structure of the Sensor
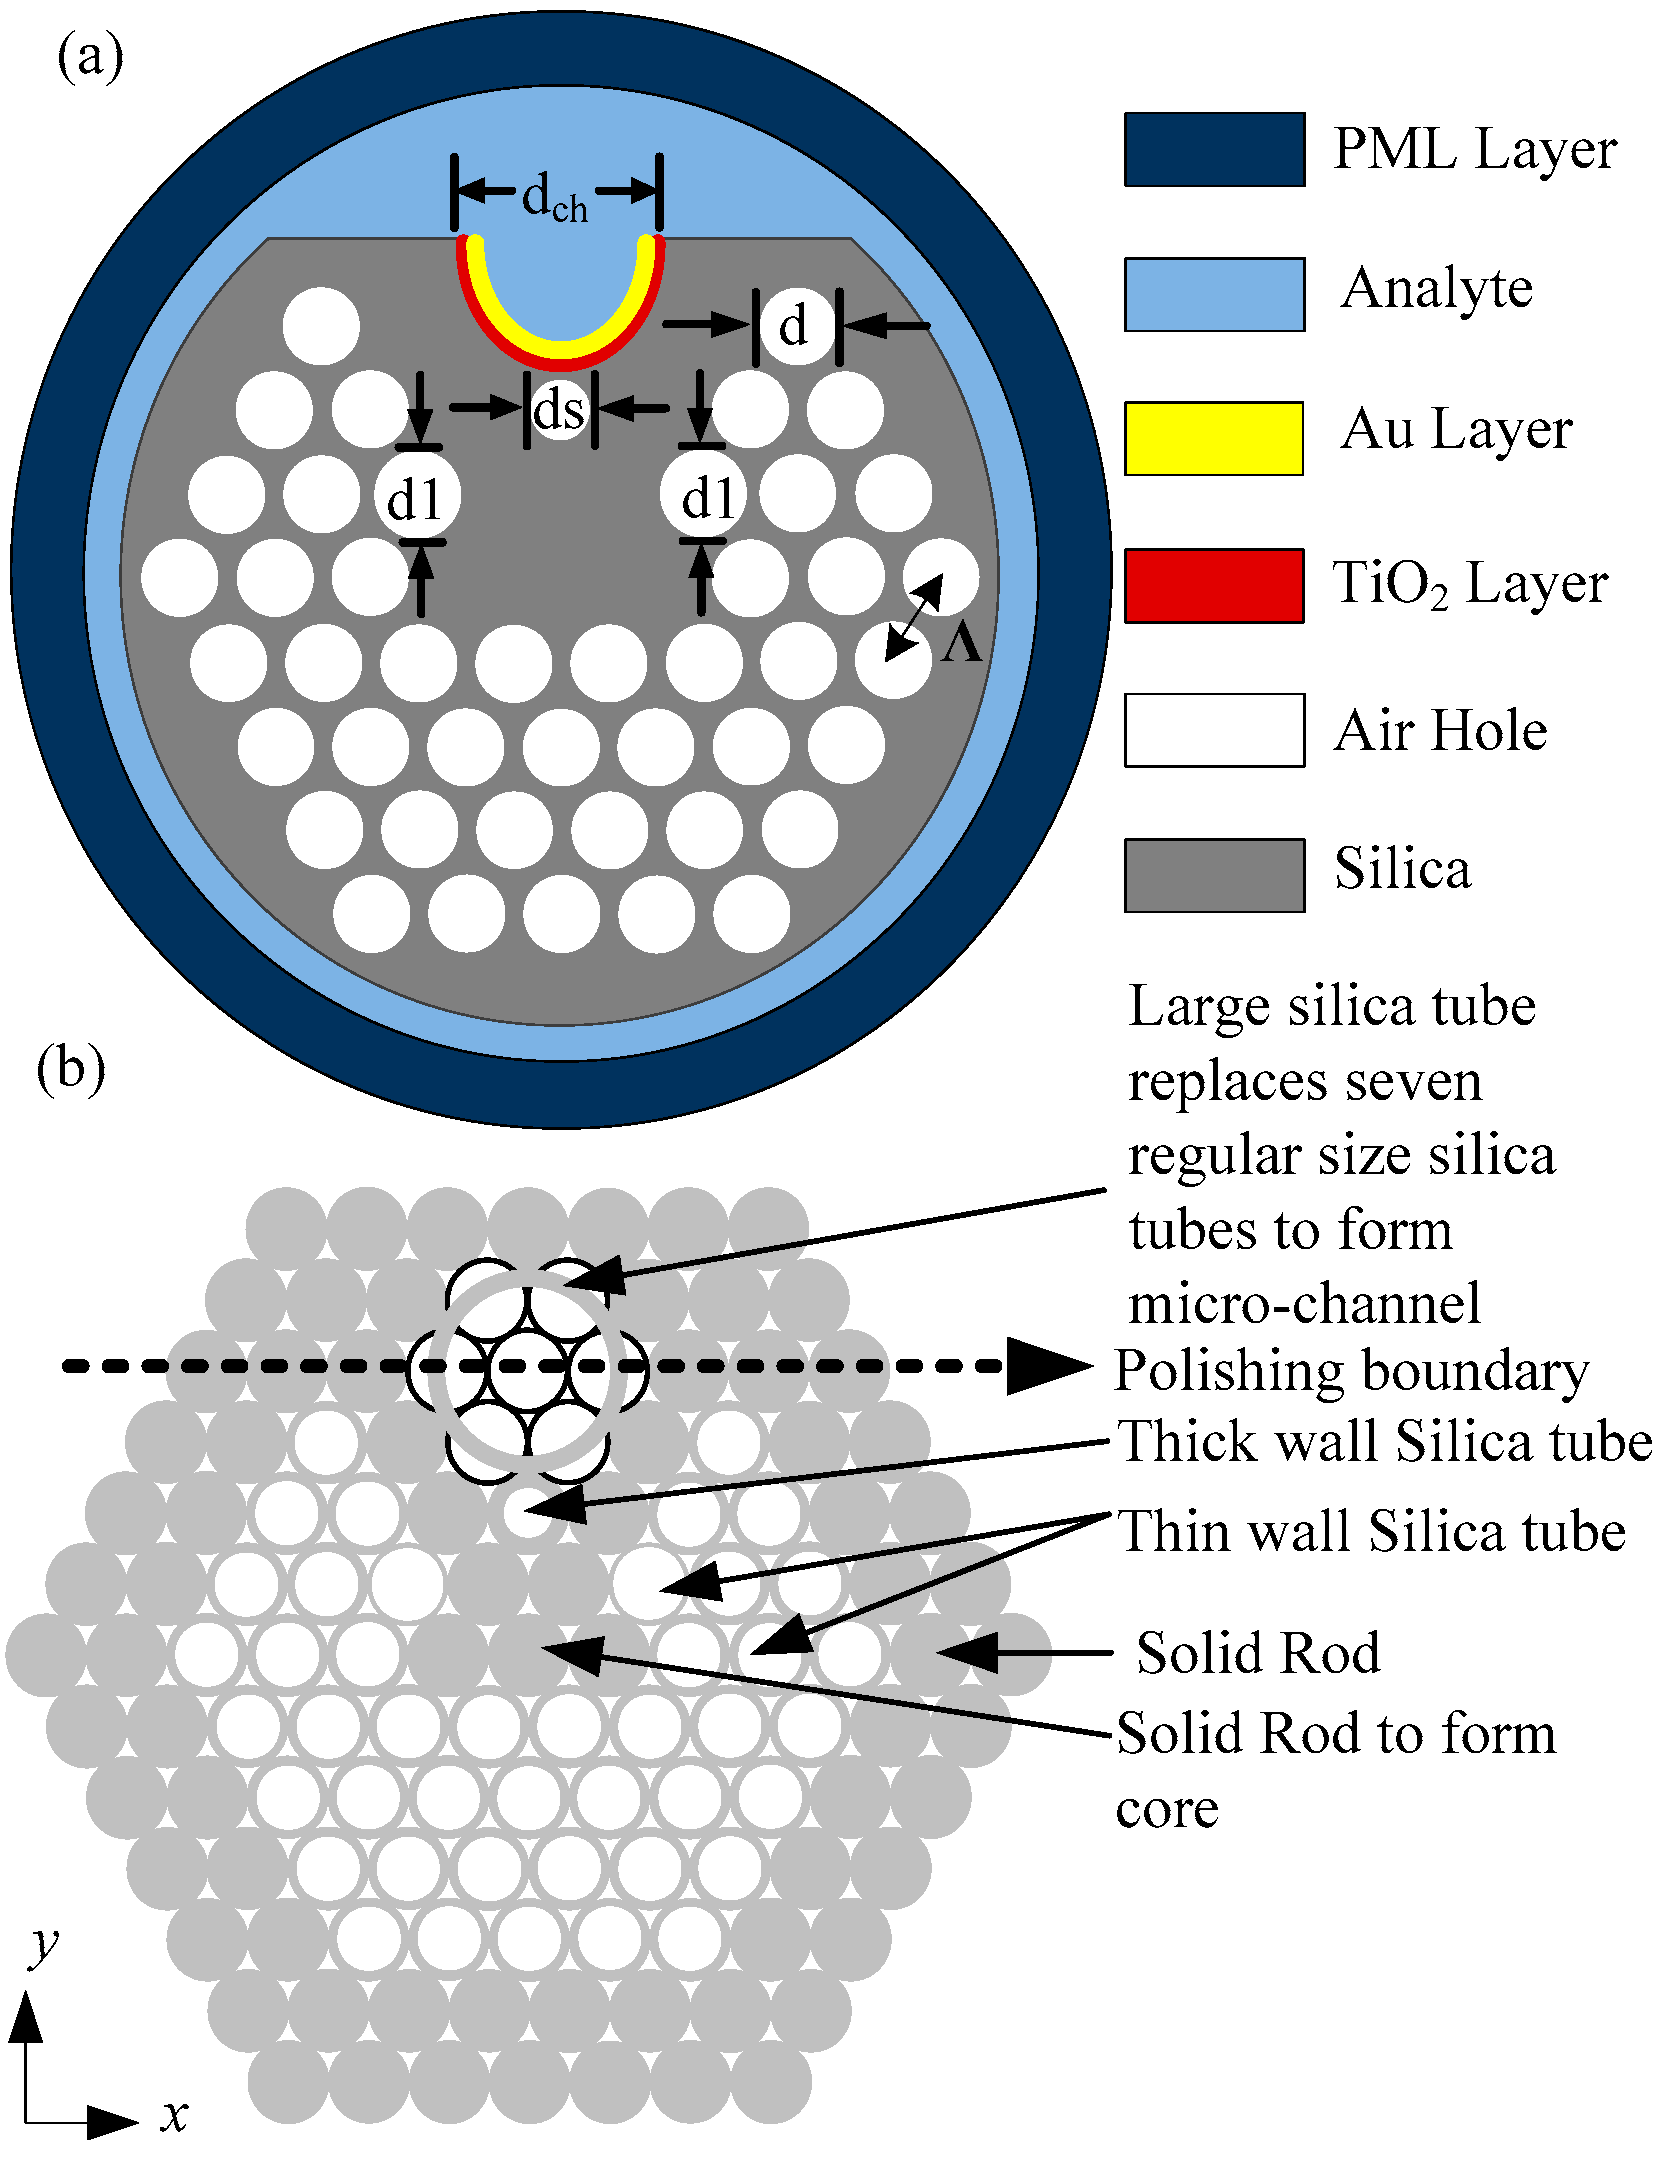
The illustration of the proposed PCF-based plasmonic biosensor is demonstrated in the transverse plane in
Figure 1a that contains silica as background material. The refractive index
n as a function of wavelength
λ of the PCF background material silica is evaluated by the following Sellmeier equation:
The values of the coefficients A and B in Equation(1) are the same as those in [
30]. In the proposed PCF, four air-hole layers are organized in a hexagonal lattice with an optimized pitch constant Λ = 2 µm. The stack preform of the PCF is shown in
Figure 1b.
Figure 1b shows that selected air holes around the center are replaced by silica’s solid rods to form a single core and leakage path for light to create an evanescent electric field that reaches the plasmonic material to excite free electrons.
Figure 1 shows that a microchannel with a larger air hole of diameter d
ch = 2.2Λ is inserted in the PCF to contain the analyte. The air holes with a shrunk diameter d
s = 0.6Λ and enlarged diameter d
1 = 0.9Λ control the interaction of light with the plasmonic film and the analyte channel. All other air holes in the PCF have a diameter d = 0.8Λ. It should be noted that the structural parameters used in the model are optimized to detect analyte RI from 1.33 to 1.44 with very high sensitivity. The preform structure shows that a thick silica tube is used for the smallest air hole, and thin silica tubes are used for the larger air holes. The dimensions of air holes considered in this model are larger than the smallest air hole of the PCF fabricated in Ref. [
31]. Therefore, the stack preform of the hexagonal lattice-based proposed sensor indicates that the manufacturing process of PCF can be achieved by following the stack-and-draw fiber drawing technique [
31].
In order to easily fill up the analyte into the microchannel, the PCF is polished by side-polishing technique as described in Ref. [
19], starting from the top of the PCF to the polishing boundary as shown in
Figure 1b, which leads to the formation of the D-shaped PCF sensor and opens a microchannel. The wider channel reduces the distance between the core of the PCF and the plasmonic film that leads to the strong resonance and efficient energy exchange of the coupled modes. After opening the microchannel, 6 nm of TiO
2 is deposited inside the open channel to work as an adhesive layer, and on top of that, 40 nm gold is deposited as a plasmonic medium. In this modified D-shaped PCF sensor, the flat surface is not required to be smooth because the plasmonic layer (gold) is deposited on the inner plane of the larger air hole. Moreover, the inner wall of the larger air hole has a smooth surface by itself; therefore, no additional efforts are necessary to make the sensing layer smooth, such as in the case of the flat surface of a D-shaped sensor. A high-quality thin film of the plasmonic and adhesive layer can be deposited inside the open-air hole by using physical vapor deposition (e.g., sputtering, electron beam evaporation) and chemical vapor deposition process (e.g., atomic layer deposition) [
32,
33]. Moreover, a long-lasting immobilized uniform gold layer can be deposited by using the nano particle-layer-deposition (NLD) process, even in the case of uneven circular silica capillary [
34]. In addition, the Tollens’ reaction chemical coating method can be used to deposit metal in the inner plane of the open channel [
35]. The permittivity of gold is found by the following the Drude–Lorentz model:
where
ω is the angular frequency. The other parameters in Equation (2) can be found from [
36]. The RI of adhesive layer TiO
2 is found from [
37] as follows:
The PCF has a finite number of air holes in the cladding that result in power loss from the core of the PCF. The loss of fundamental mode during propagation is computed by the following equation:
where
represents the free space wave number, and
indicates the imaginary component of effective RI of the fundamental mode [
11].
3. Performance Analysis and Numerical Results
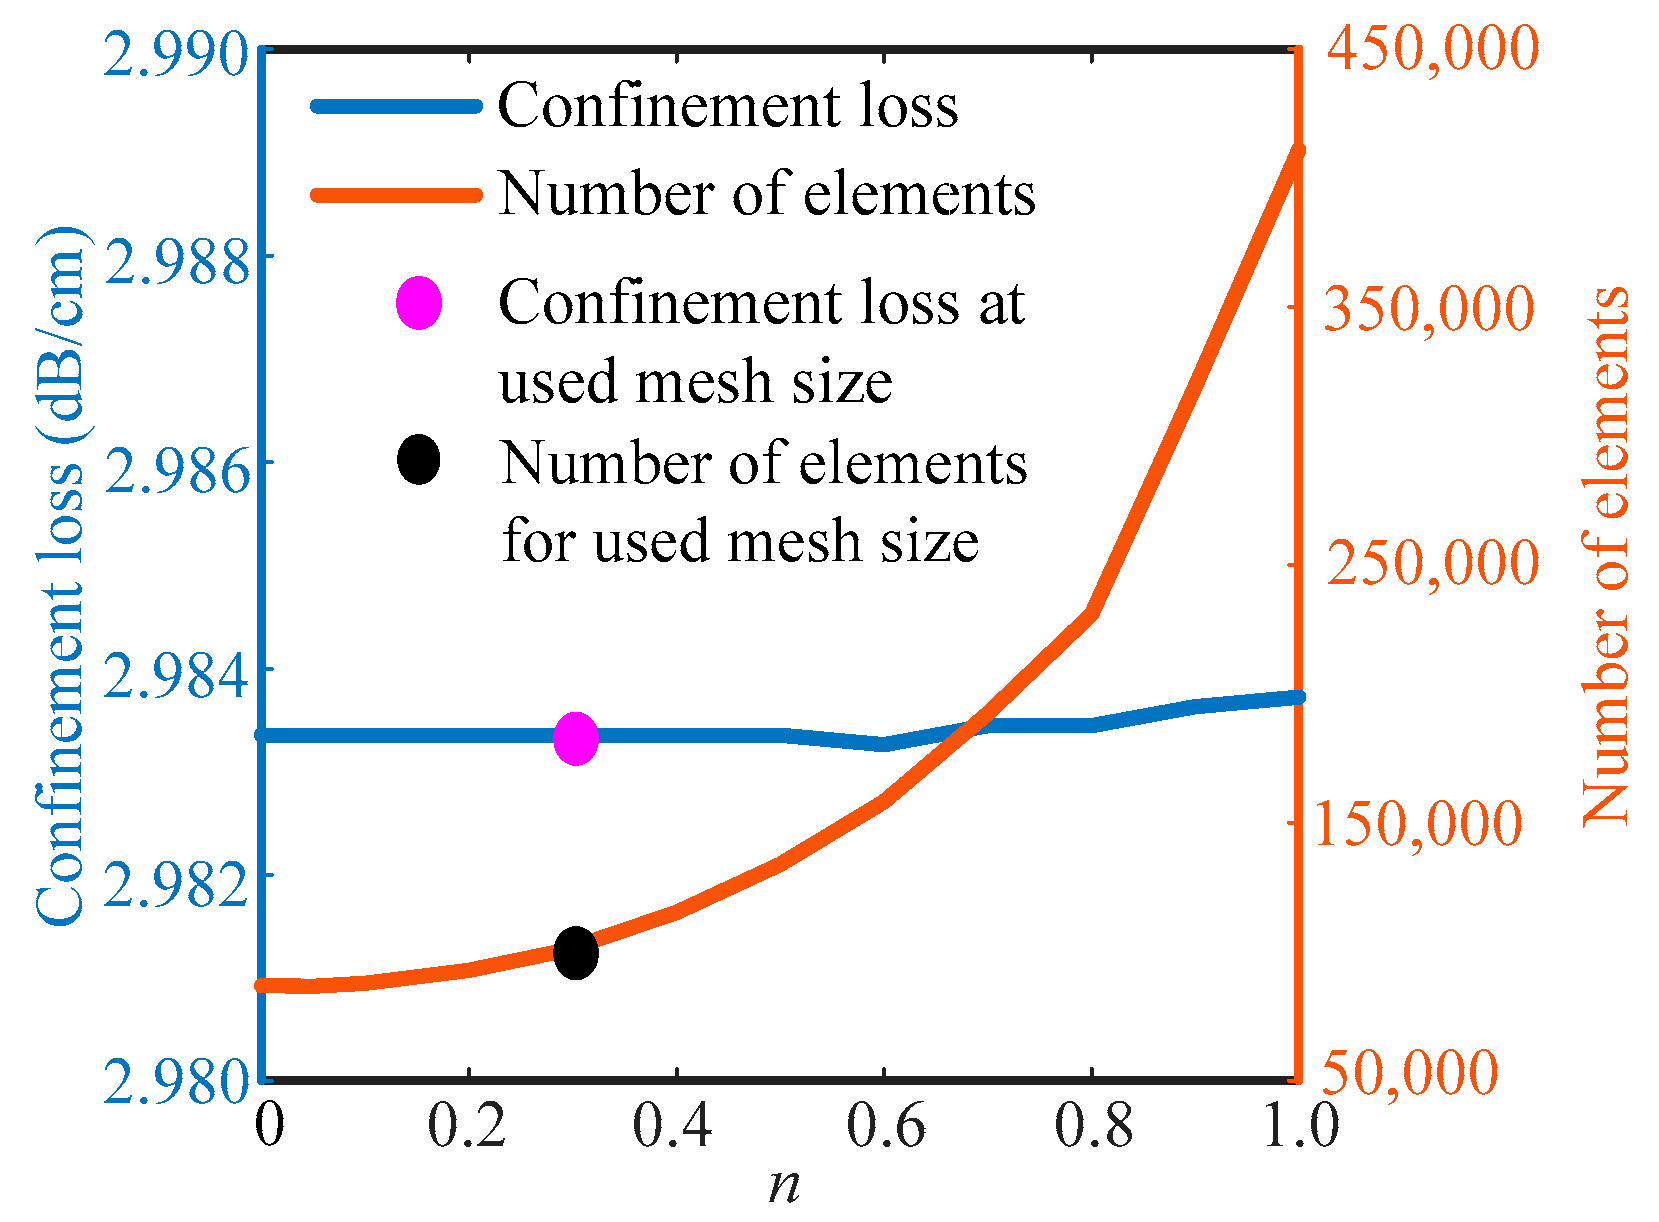
To numerically explore the optical properties of the proposed sensor, finite element method (FEM)-based commercial software COMSOL Multiphysics is used. For computational purposes, we use a circular perfectly matched boundary to attenuate all electromagnetic radiation that arrives at the boundary. Maximum mesh size is found by
for the entire geometry, where
n is the mesh size parameter that increases up to 1 and
is the operating wavelength.
Figure 2 shows the confinement loss and the maximum number of elements as a function of
n. In this model, the region of silica is much larger compared with the air-gap regions. From
Figure 2, it can be seen that confinement loss remains almost constant for
n< 0.6. Therefore, to make the computation process faster, we use 100,168 elements.
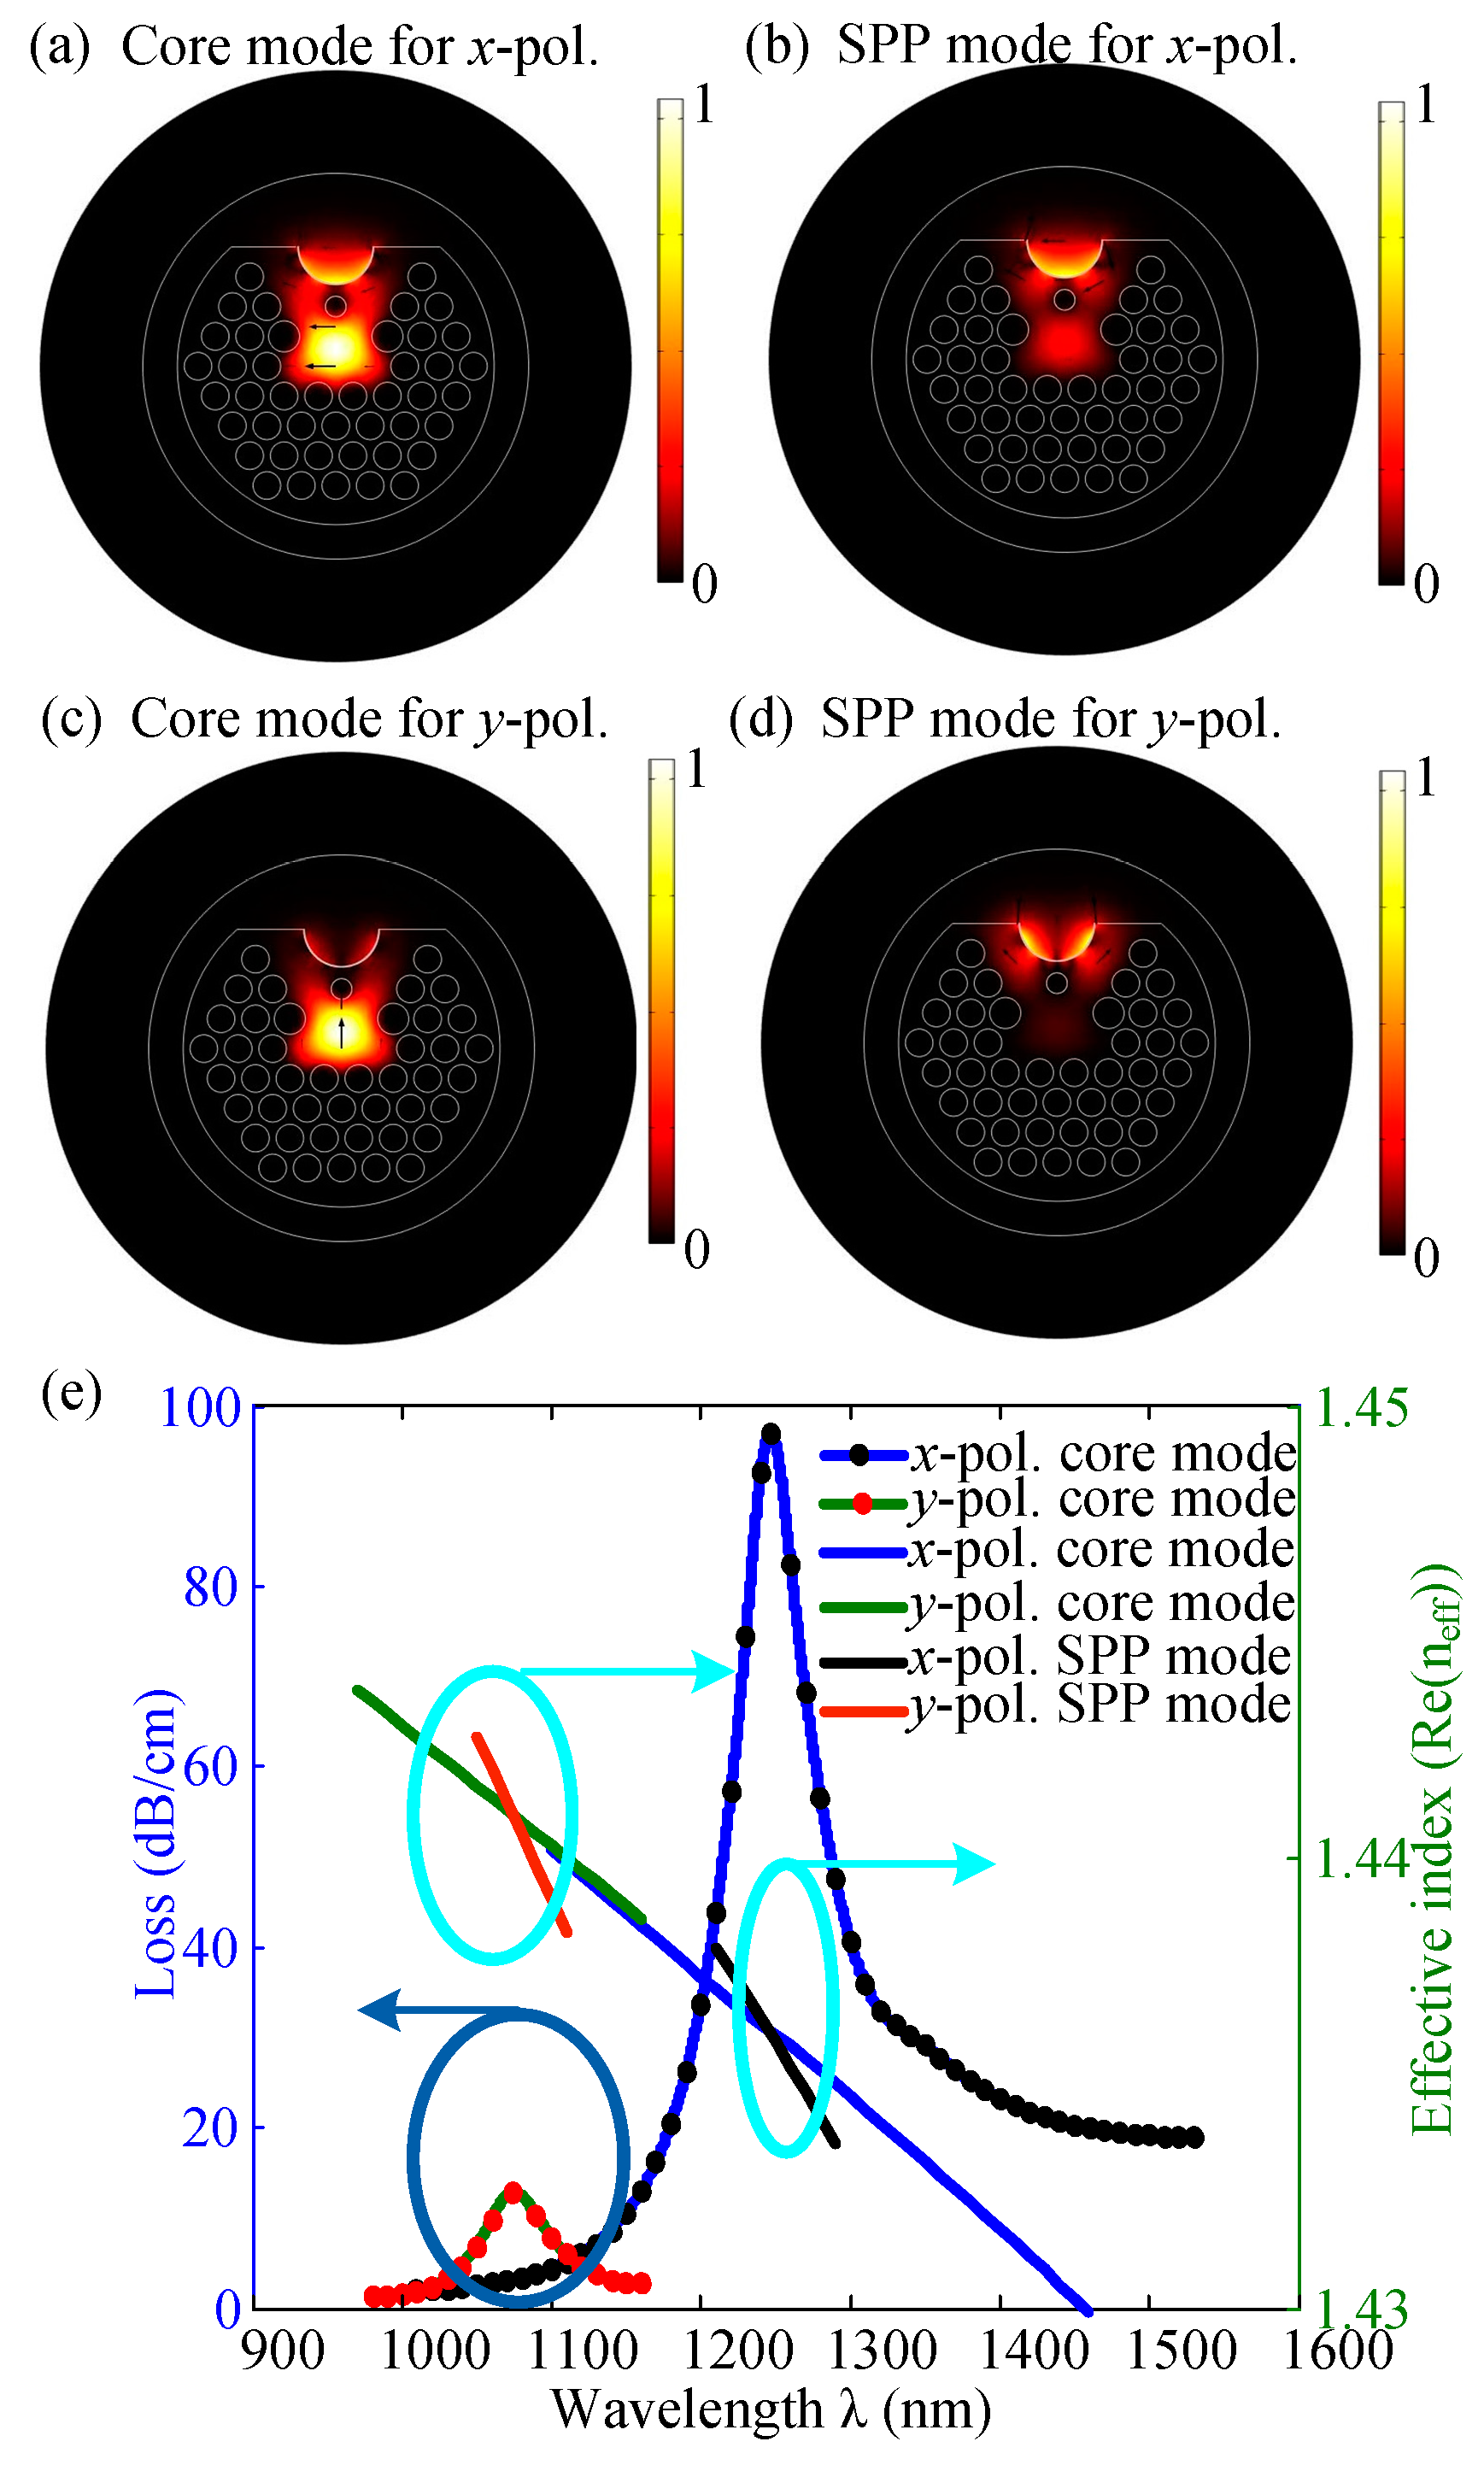
Asymmetrical structure of the PCF results in the existence of birefringence. Therefore, light propagating inside the fiber shows
x-and
y-polarizations of the fundamental and SPP modes, as shown in
Figure 3a–d.The field distribution of these modes is shown for the analyte RI = 1.43 at the resonant wavelengths.
Figure 3e demonstrates the RI and confinement loss as a function of wavelength for the fundamental and the SPP modes for both
x- and
y-polarizations. It is seen that resonance occurs at the phase-matching wavelength that results in maximum energy transfer from the fundamental modes to the SPP modes, and confinement loss becomes maximum for both polarized lights. For example, phase matching or resonant wavelengths are 1250 nm for
x-polarization and 1080 nm for
y-polarization. Additionally, the peak confinement losses at the resonant wavelengths are 97.04 and 12.89 dB/cm for
x-and
y-polarizations, respectively. As the operating wavelength, red/blue shifts far from the resonant wavelength, and the confinement loss approaches its tail from the peak loss. From
Figure 3, it is noted that at the resonant condition, energy transmission increases significantly from the core to the SP for the
x-polarized field compared with the
y-polarized field because of efficient excitation of metal electrons by the evanescent wave. As a result, we consider sensor optical characteristics for
x-polarization.
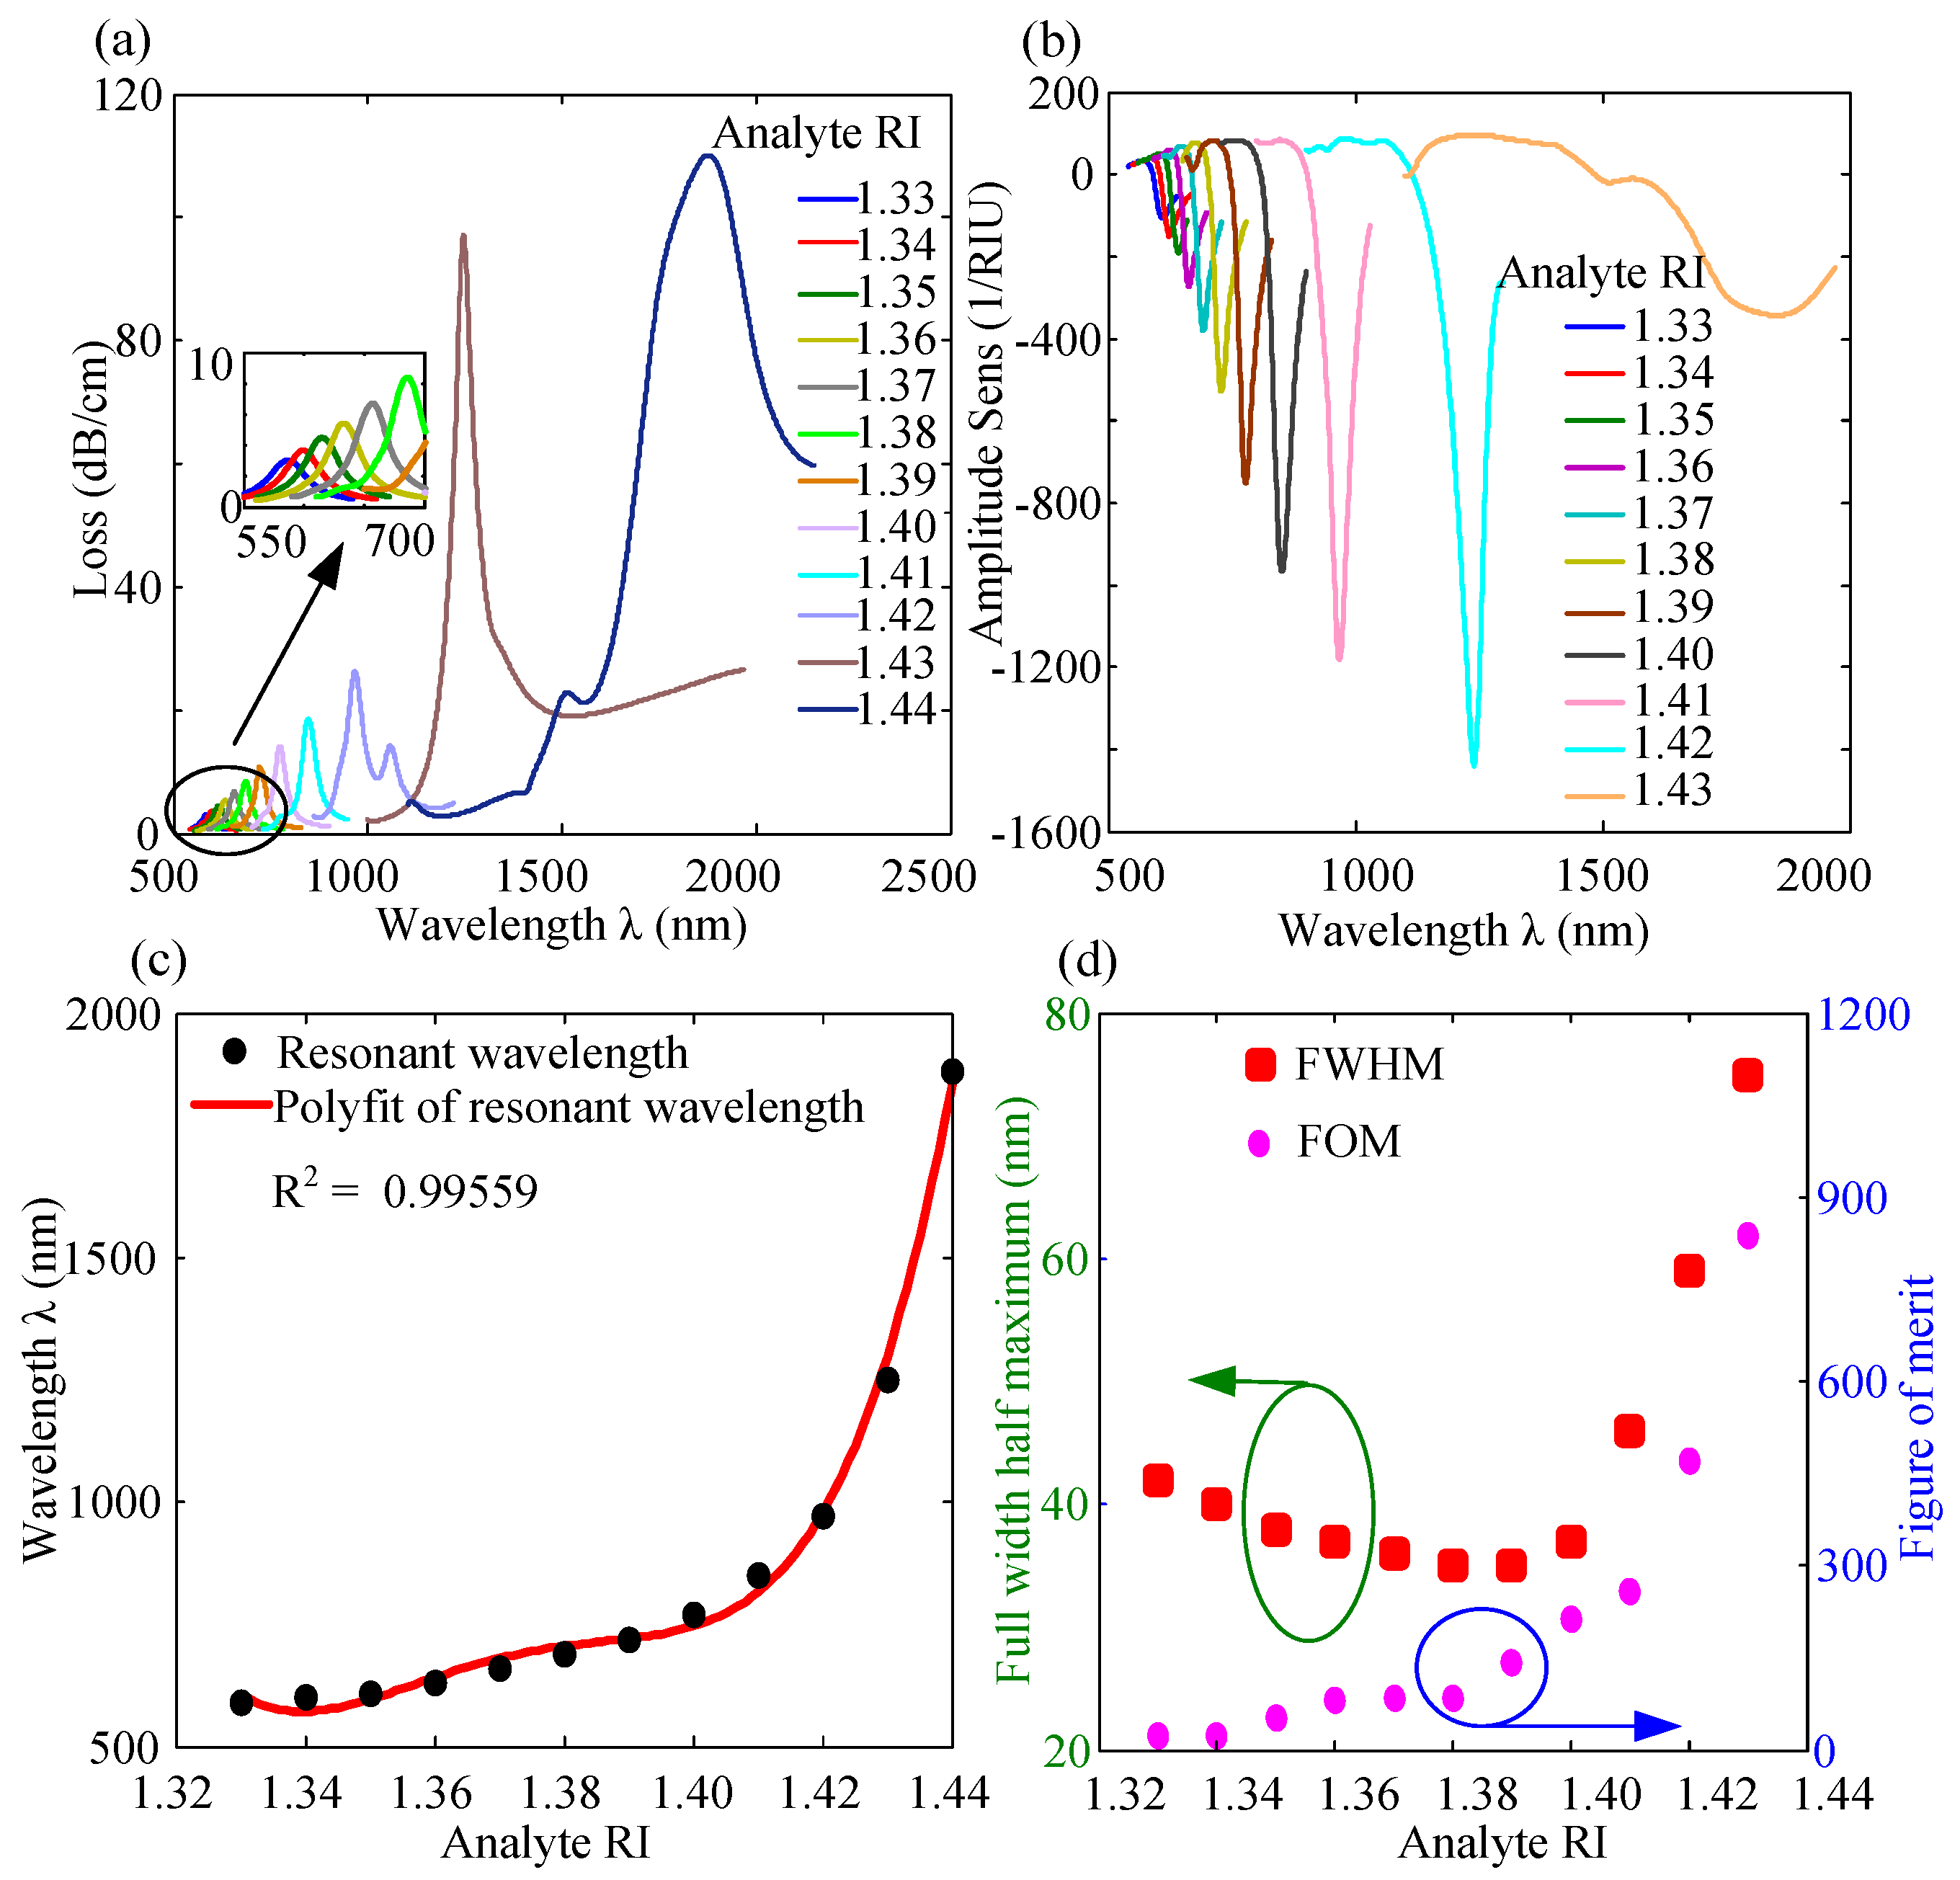
The propagation loss spectra of the
x-polarized fundamental mode are shown in
Figure 4a due to the medium placed in the channel with RI ranging from 1.33 to 1.44. The increase in the analyte RI results in the reduction in core-cladding index contrast; as a result, resonant wavelength redshifts and peak confinement loss raises. The resonant wavelengths and peak confinement losses are shown in
Table 1 for different analyte RI. The loss spectrum for higher analyte RI (e.g., 1.44) shows multiple resonance peaks at longer wavelengths similar to the Ref. in [
38], where only the largest peak loss is considered to find the resonant wavelength. The higher peak loss is considered due to larger energy transmission from the core mode to SPP mode compared with the other subpeaks.
The increase in analyte RI results in the redshift of the resonant wavelengths that are used to find the wavelength sensitivity by the following equation
where ∆λ
resonance is the amount of redshift of the resonant wavelengths in nm for the difference of analyte RI of ∆
na [
11]. Since ∆
na = 0.01 is constant in our analysis, wavelength sensitivity
shows higher values for larger ∆
λresonance. For example, the resonant wavelength changes from 590 nm to 600 nm as
na changes from 1.33 to 1.34, which results in the wavelength sensitivity of 1000 nm/RIU. Similarly, for the increase in
na from 1.43 to 1.44, the change of
λresonance is maximum (i.e., from 1250 nm to 1880 nm), which leads to the maximum wavelength sensitivity of 63,000 nm/RIU. The wavelength sensitivities are listed in
Table 1 for other analytes’ RI.
The sensitivity parameter termed as the resolution of a sensor detects the minimum change in RI and can be found as follows:
where
is the minimum spectral resolution [
11].
Table 1 shows sensor resolutions for analytes’ RI from 1.33 to 1.43. The
Table 1 shows that as analyte RI changes from 1.43 to 1.44, the sensor resolution is minimum (i.e., 1.59 × 10
−06 RIU), corresponding to the highest wavelength sensitivity of 63,000 nm/RIU. The smallest resolution 1.59 × 10
−06 RIU in
Table 1 indicates the detector’s ability to discriminate between analytes’ RI that are close enough.
There is another important sensor parameter known as amplitude sensitivity, which is measured by the amplitude interrogation method. The amplitude sensitivity analysis is a low-cost sensitivity measurement process compared with wavelength sensitivity because this method does not engage spectral manipulation. The amplitude sensitivity is defined as below:
where
is confinement loss for analyte RI of
na at a particular wavelength λ.
indicates change in propagation loss at wavelength λ for
change in analyte RI [
11]. The amplitude sensitivity depends only on
and
because
in our analysis.
Figure 4b shows the amplitude sensitivity spectra of different analytes’ RI varying from 1.33 to 1.43. The maximum amplitude sensitivity increases gradually with the increase in the analyte RI from 1.33 to 1.42. Such as, for the increase in analyte RI from 1.33 to 1.34 (i.e.,
), the maximum amplitude sensitivity is found as 106.64 RIU
−1 and the change in RI from 1.34 to 1.35 (i.e.,
) results in the maximum amplitude sensitivity of 145.89 RIU
−1. However, the maximum amplitude sensitivity decreases form 1439.00 RIU
−1 to 343.59 RIU
−1 with the change in the analyte RI from 1.43 to 1.44.
Table 1 shows peak amplitude sensitivities for analytes’ RI from 1.33 to 1.43.
Table 1 shows that the highest amplitude sensitivity is 1439.00 RIU
−1 with a resolution of 6.94 × 10
−06 RIU for change in analyte RI from 1.42 to 1.43.
The resonant wavelengths for different analytes’ RI in the range of 1.33 to 1.44 and the polynomial fitting are shown in
Figure 4c. From resonant wavelengths, it is found that the R-squared value of the sensor is close to unity (i.e., R
2 = 0.99559), which indicates the sensor is highly linear. The full width at half maximum (FWHM) is found from the loss spectra of different analyte RI and plotted in
Figure 4d and shown in
Table 1. The FWHM decreases with the increase in the analyte RI and reaches a minimum for RI = 1.39 and increases again with the increase in analyte RI. The FWHM is used to characterize the sensor in terms of the figure of merit (FOM), which is a ratio of wavelength sensitivity to the FWHM.
Figure 4d shows that FOM increases with the increase in the analyte RI. The highest FOM is 839 for analyte RI = 1.43 as shown in
Table 1.
4. The Effect of Structural Parameters
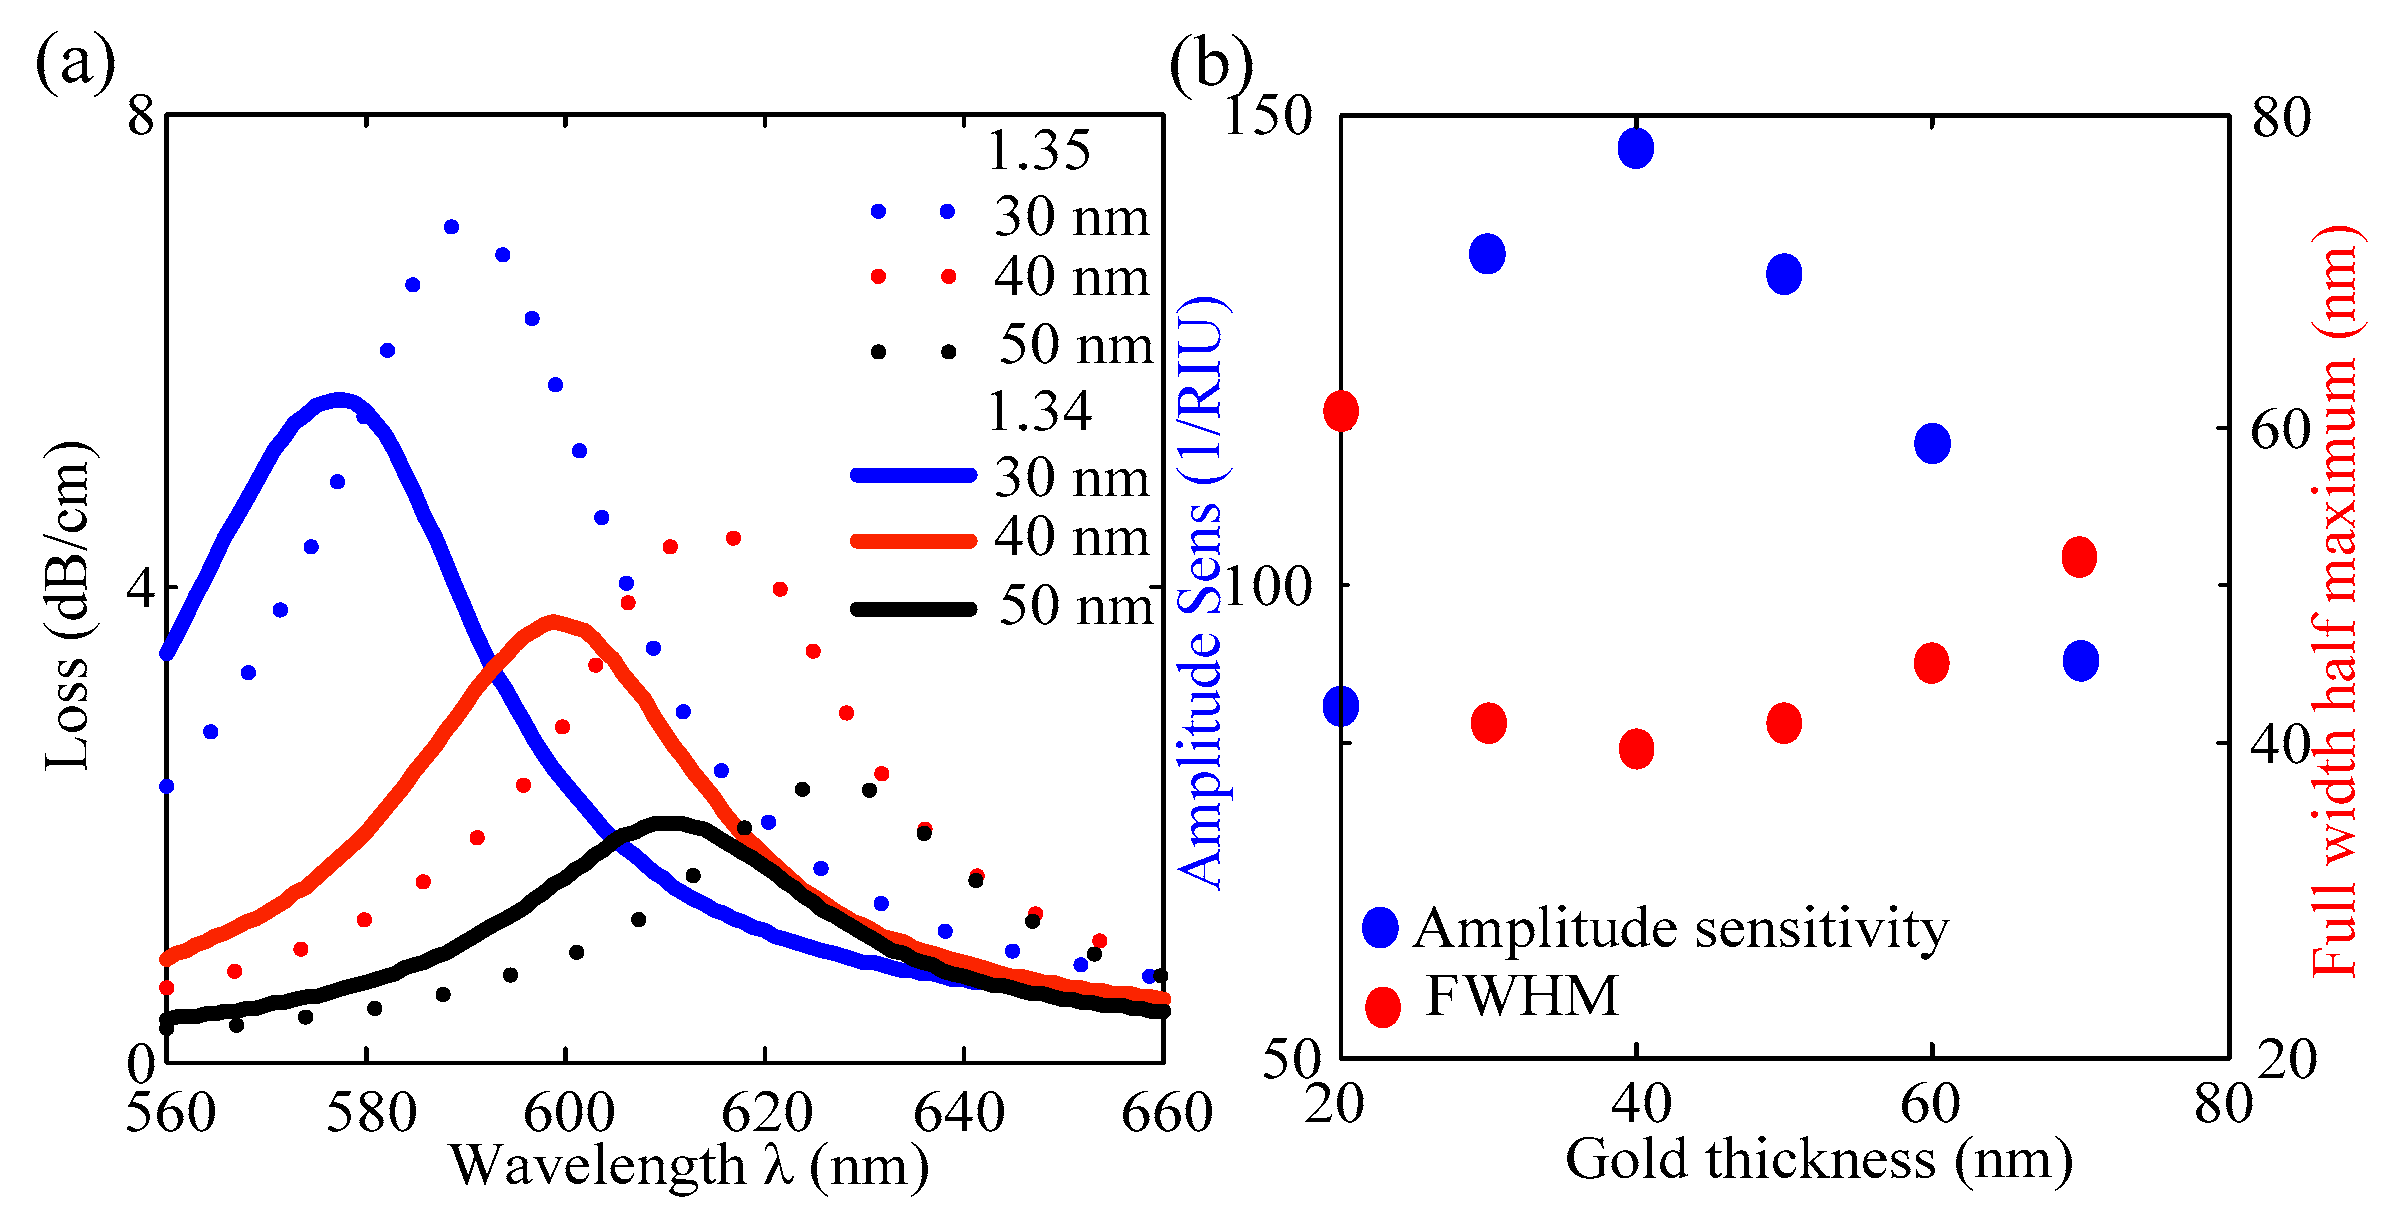
Since the thickness of the plasmonic layer controls the mode coupling between the core and SPP mode, the performance of the sensor is affected by this parameter, as shown in
Figure 5. Loss spectra of analyte RIs 1.34 and 1.35 are shown in
Figure 5a for the gold thickness of 30, 40, and 50 nm. As the gold thickness increases, the peak loss component decreases due to the decrease in the depth of penetration of the electric field in the metal layer. For example, peak losses are 7.10, 4.42, and 2.36 dB/cm for the gold thickness of 30, 40, and 50 nm, respectively, in the case of RI = 1.35. The change in loss spectra affects the amplitude sensitivity and FWHM as shown in
Figure 5b in the case of analyte RI of 1.34. From
Figure 5b, it is seen that amplitude sensitivity reaches a maximum for the gold thickness of 40 nm. However, the FWHM is found to be minimum for the gold thickness of 40 nm. The change in gold thickness hardly affects the wavelength sensitivity; therefore, FOM (i.e., FOM = 25.21 in the case of analyte RI = 1.34) must have the highest magnitude at the gold thickness of 40 nm.
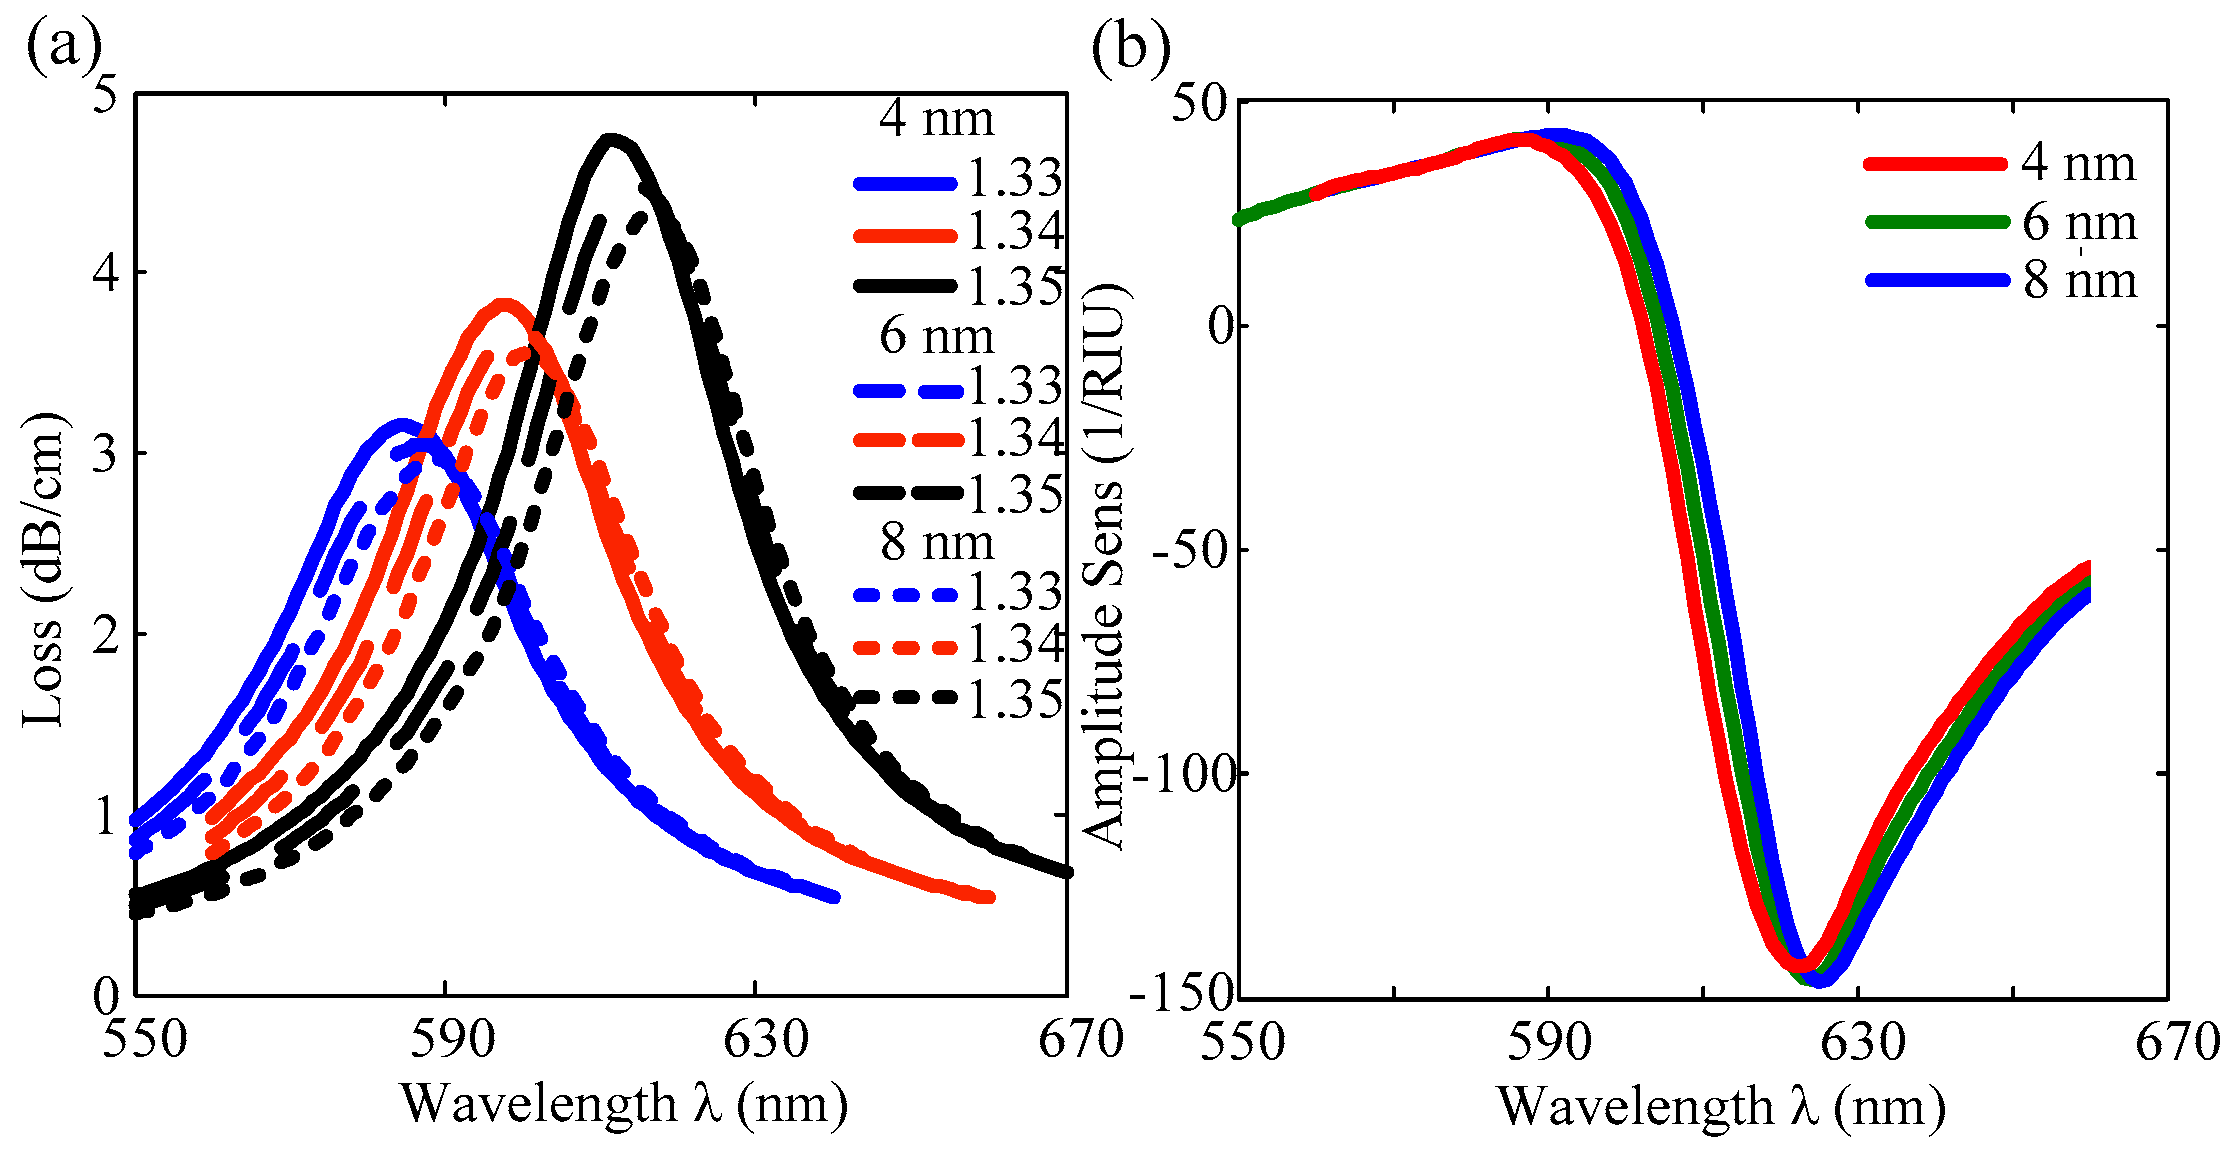
To determine the effect of thickness of the adhesive layer on the sensing performance, loss spectra are shown in
Figure 6a for analyte RI of 1.33, 1.34, and 1.35. The penetration of electrical waves decreases with the increase in metal thickness. Therefore, in all cases of analyte RIs, the peak confinement loss increases with the decrease in the adhesive layer thickness. For example, the peak losses are 4.16, 4.22, and 4.62 dB/cm for analyte RI = 1.35 in the case of TiO
2 thicknesses of 8, 6, and 4 nm, respectively. The amplitude sensitivities also altered due to the change in loss spectra. However, the effect of the TiO
2 layer on the sensitivity is not significant. For example, for analyte RI of 1.34, the maximum amplitude sensitivities are 143.04, 145.89, and 146.21 RIU
−1 for the TiO
2 layer of 4, 6, and 8 nm.
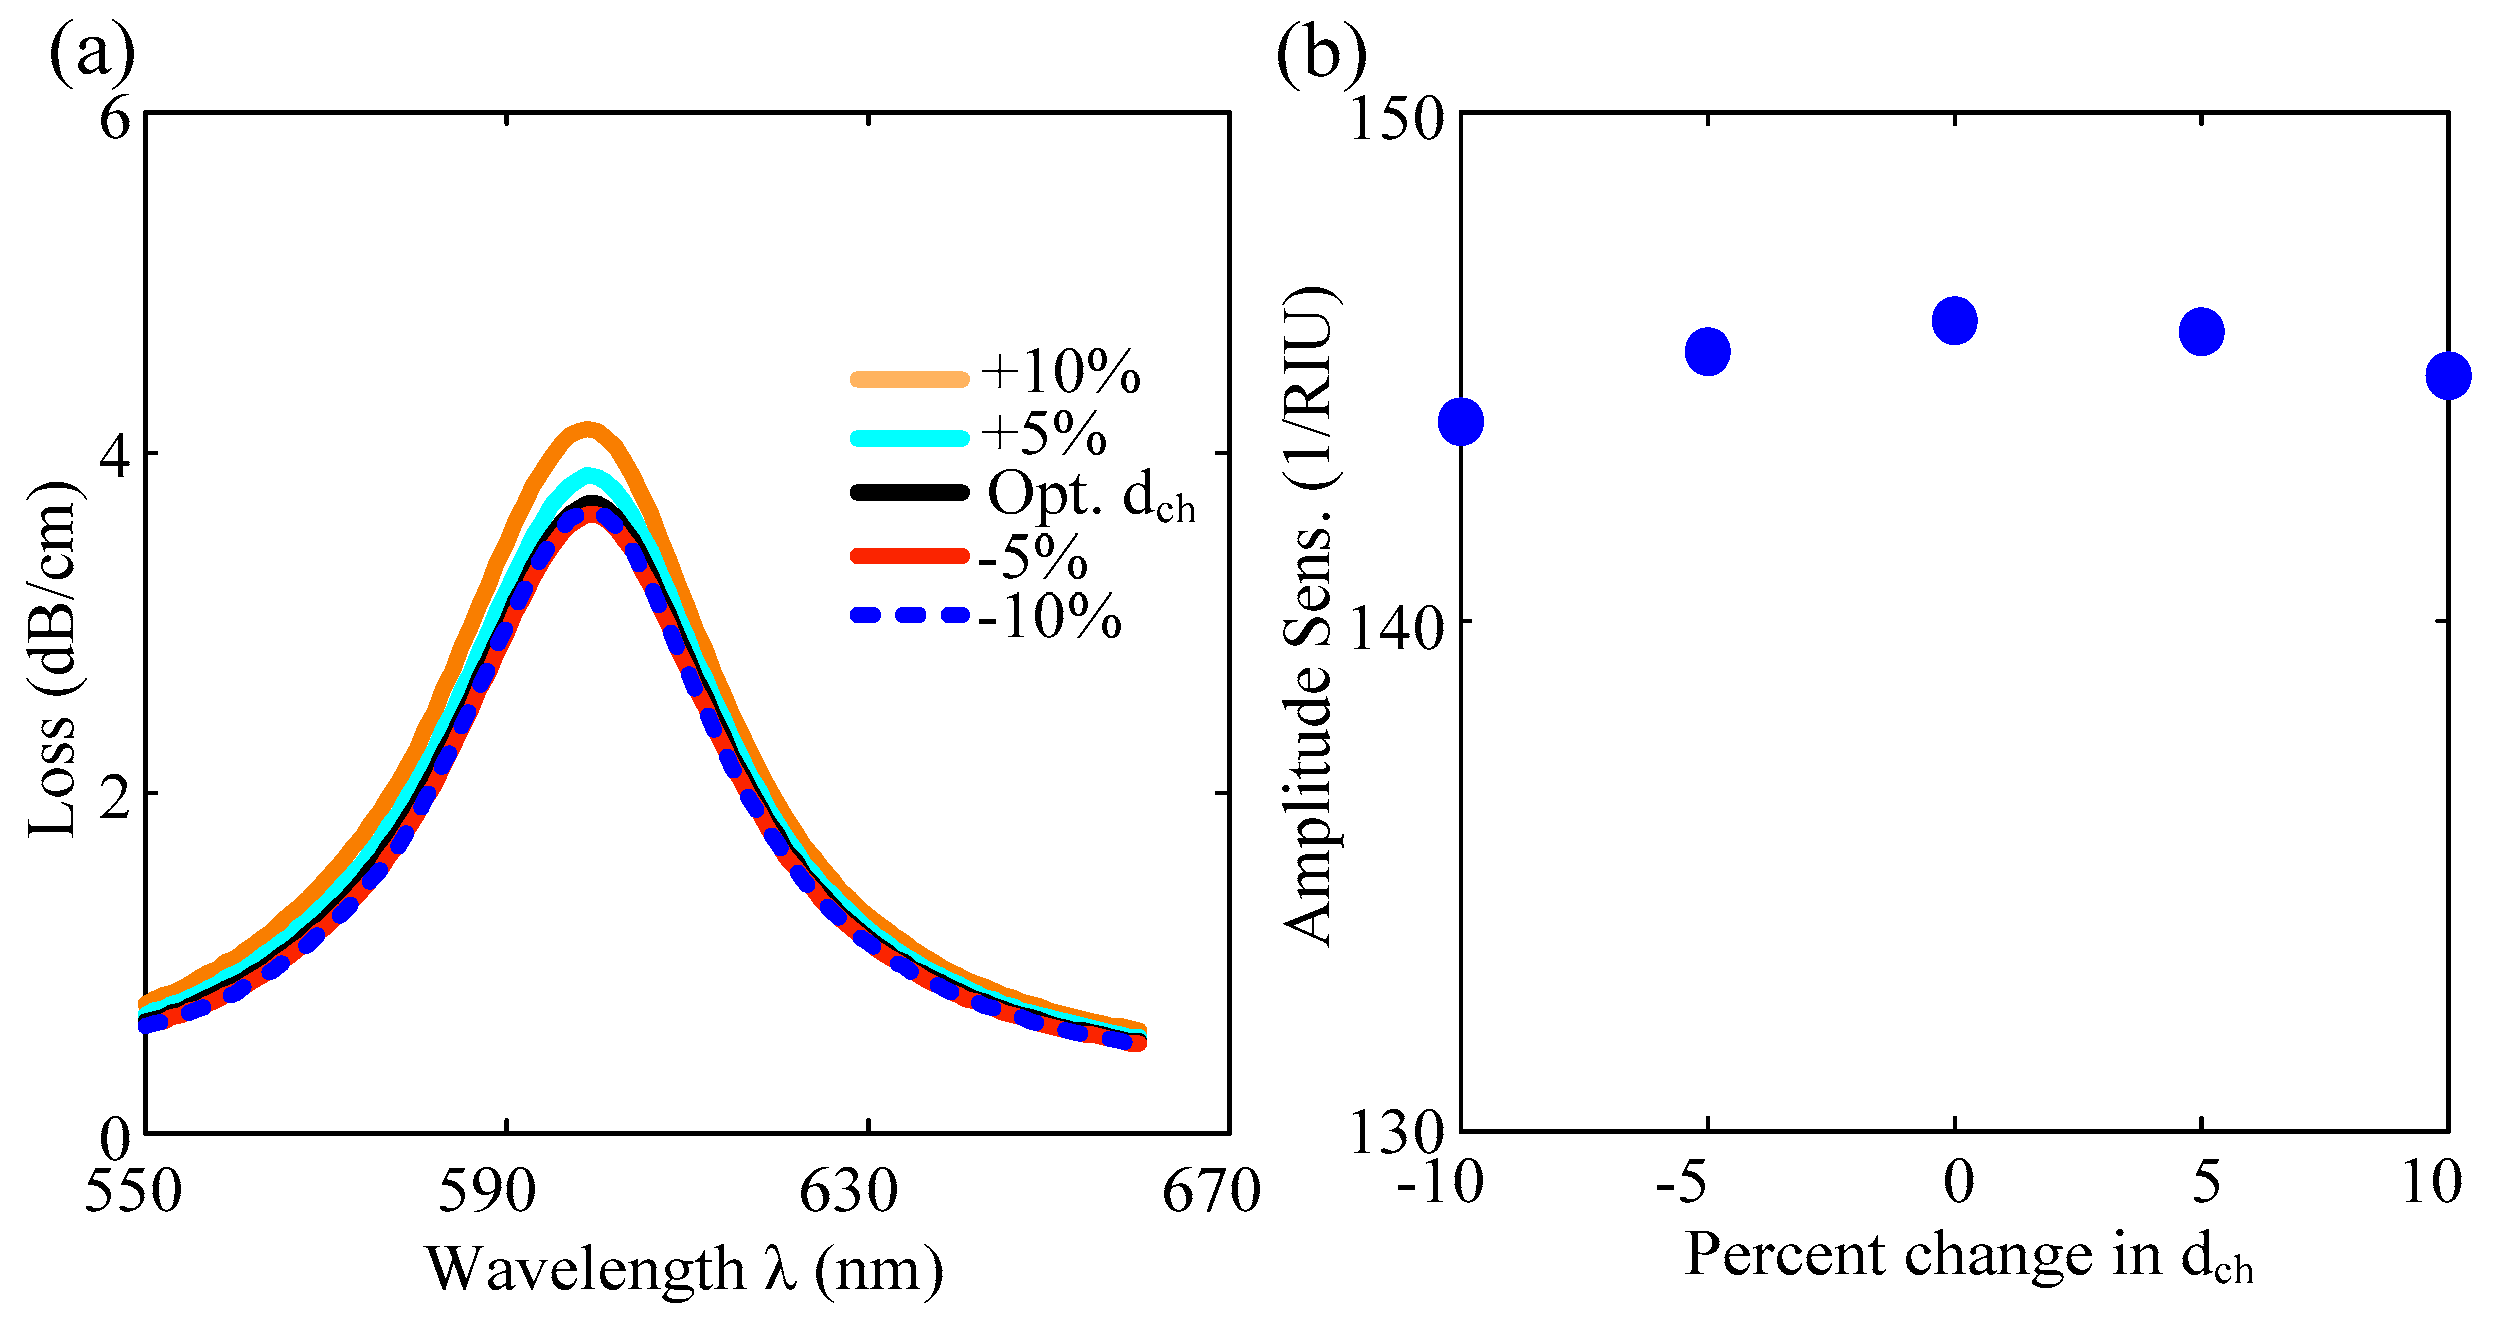
The distance between the semicircular-shaped channel and the core of the PCF is fixed in this sensor. However, the distance between the channel and the core of the PCF can be changed by varying the diameter of the channel. For the increase in channel diameter by +10%, the distance between the core and plasmonic layer decreases by −10%, which leads to the easy coupling between the core mode and SPP mode. As a result, energy shifts significantly from the core to the SPP mode, and the peak loss increases as shown in
Figure 7a. However, the resonant wavelength remains constant for the change in the channel size within ±10% of the d
ch. Additionally, as the channel dimension decreases from the optimum value, there is no significant change in the energy transfer of the core mode to the plasmonic mode, as shown in
Figure 7a. The channel dimension affects only the amplitude sensitivity, as shown in
Figure 7b. From
Figure 7b, it is found that the amplitude sensitivity is larger for the optimum channel size d
ch, and other values of d
ch result in lower amplitude sensitivities.
In
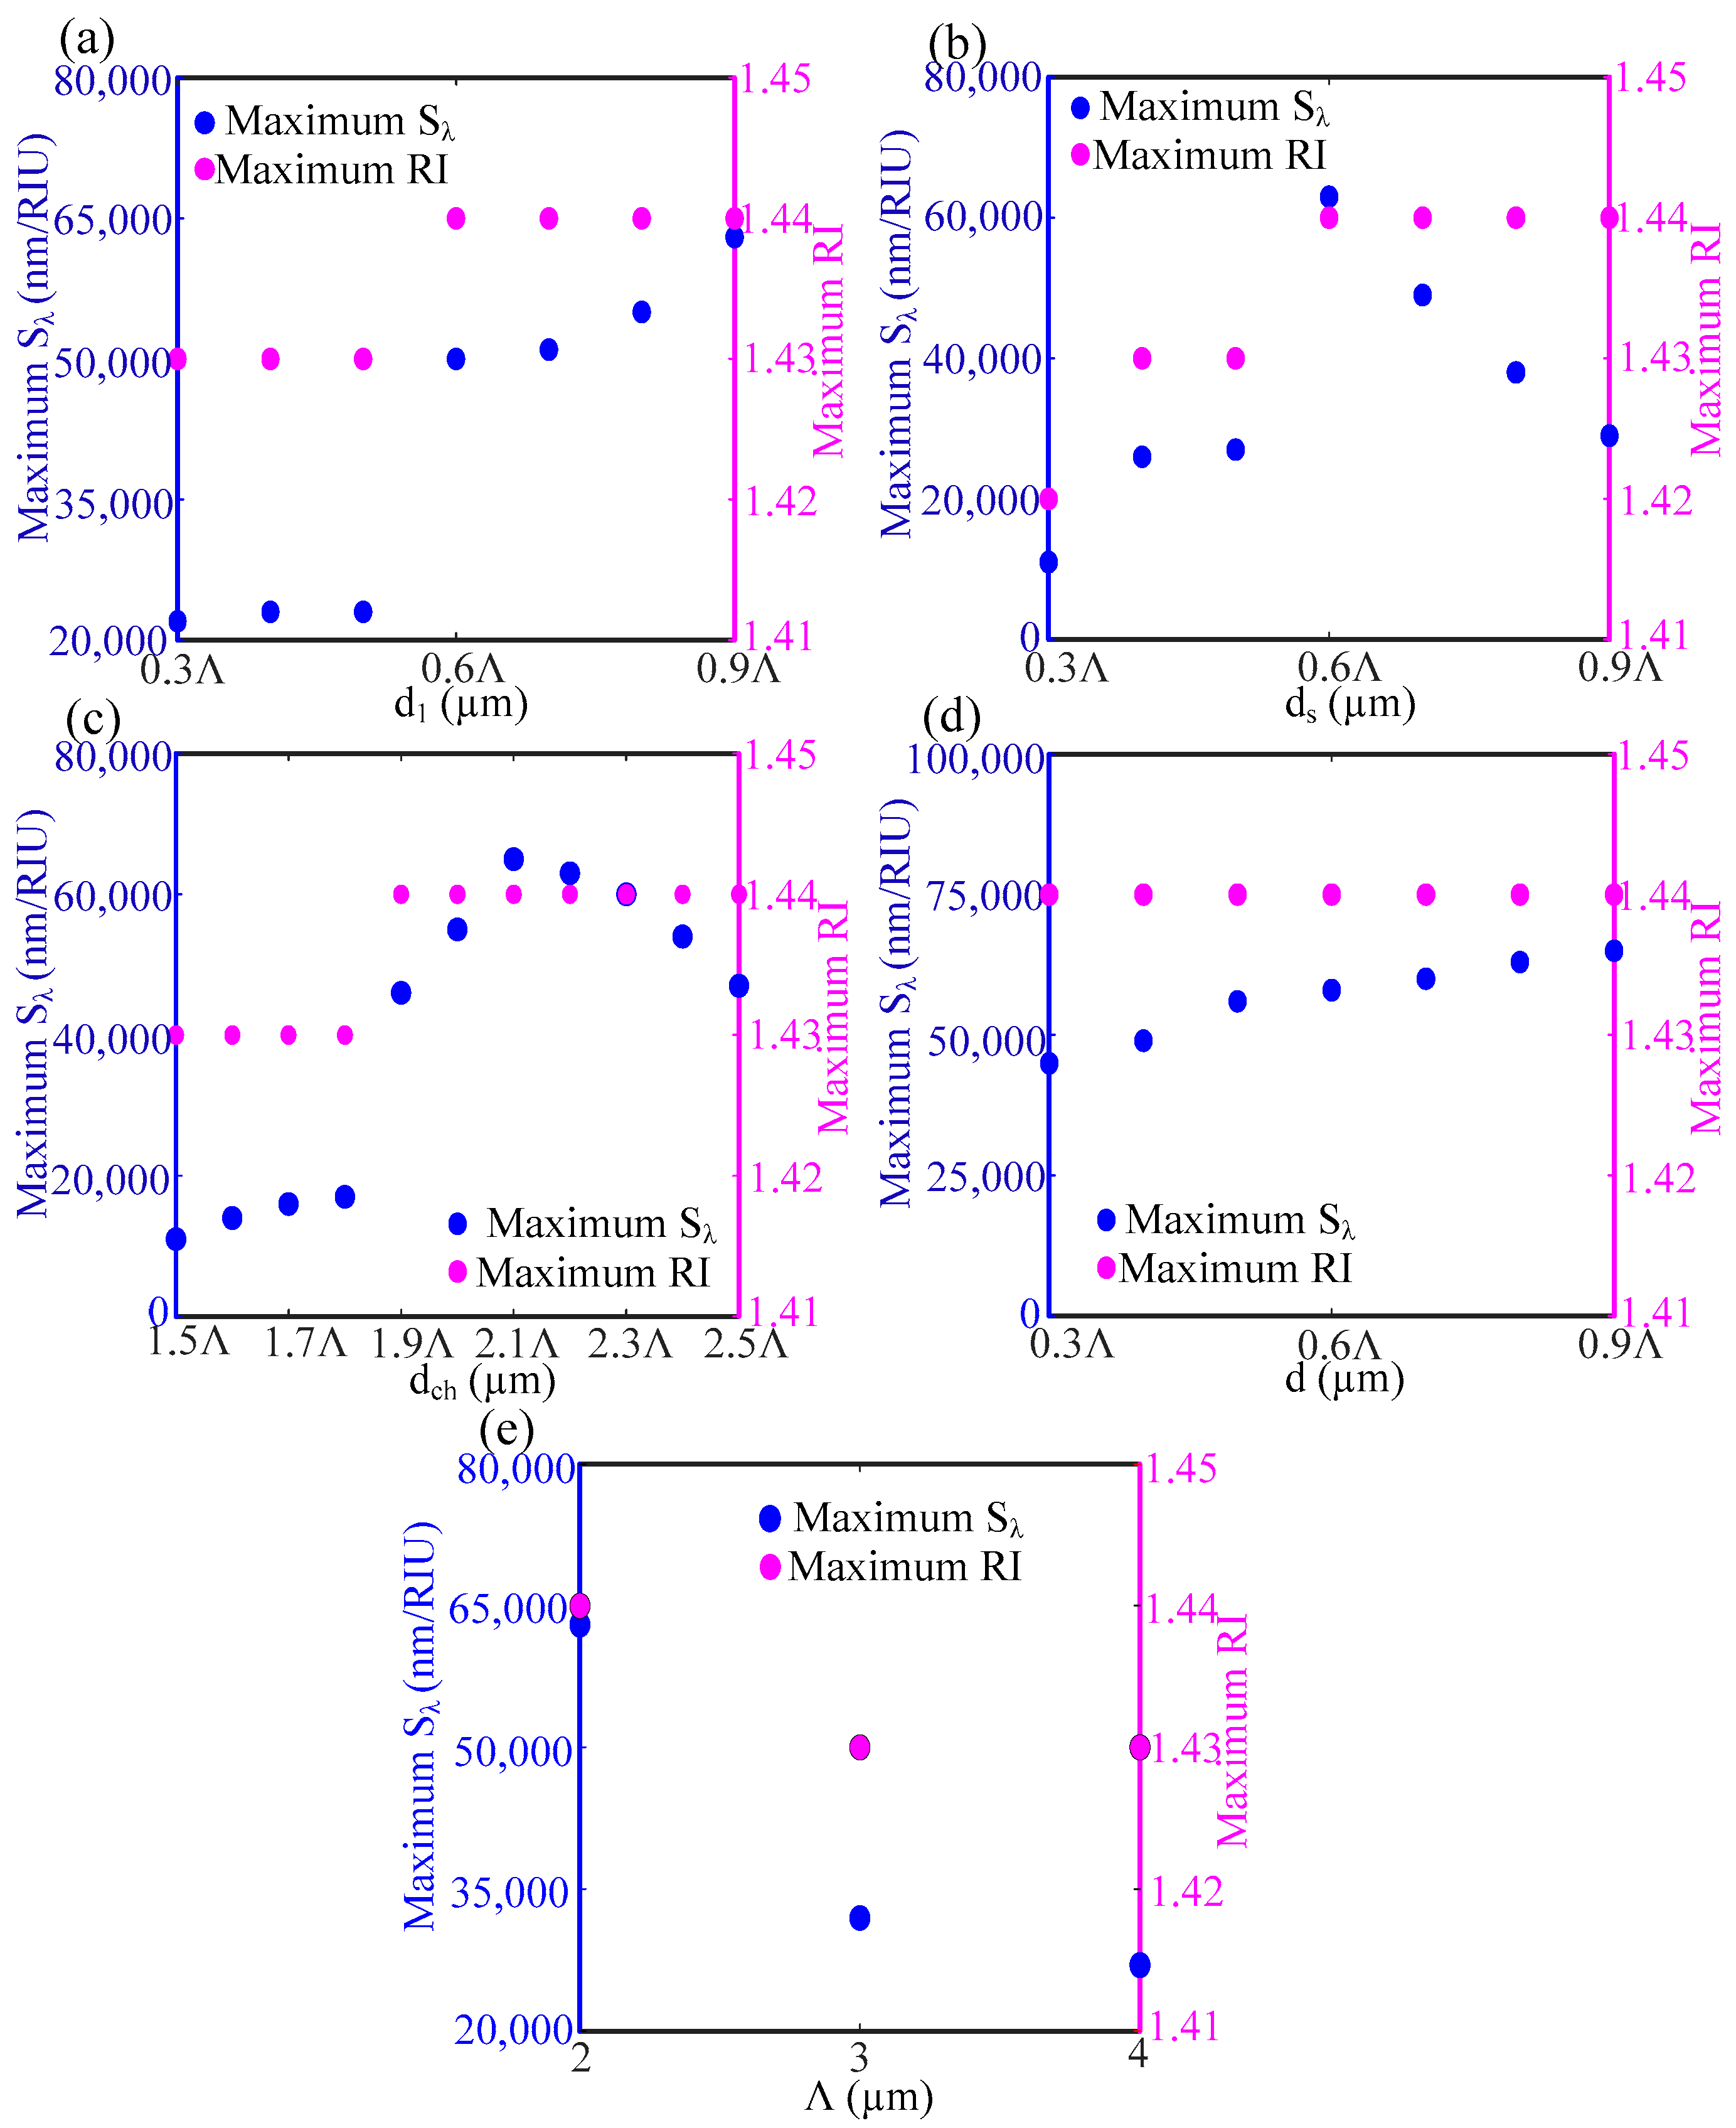
Figure 8, the effects of sensor structural parameters on the maximum wavelength sensitivity and sensing range are further explored.
Figure 8a shows that as the air hole diameter d
1 increases beyond 0.6Λ, the sensing range raises to 1.44 from 1.43. The wavelength sensitivity S
λ increases significantly to 50,000 nm/RIU for d
1 = 0.6Λ, and a further increase in d
1 results in the gradual increment of S
λ. From
Figure 8b, it is found that S
λ is maximum only for d
s = 0.6Λ, and the sensing range remains constant at 1.44 for d
s ≥ 0.6Λ. The sensing range and S
λ decrease with the decrease in d
s. Even in the absence of the air hole with diameter d
s, the maximum sensing range becomes 1.42. The effect of outer channel diameter d
ch is shown in
Figure 8c. The maximum sensing range of 1.44 is obtained for d
ch ≥ 1.9Λ, and the maximum S
λ is found at d
ch = 2.1Λ. For d
ch = 2.2Λ, the maximum S
λ decreases only 3% from the maximum S
λ found at d
ch = 2.1Λ. The structural parameter d has no effect on the maximum sensing range for the values of d from 0.3 Λ to 0.9 Λ, as shown in
Figure 8d. However, the maximum S
λ increases gradually with the increase in d.
Figure 8e shows that the maximum sensitivity and sensing range is larger for the optimum pitch size of 2 µm.
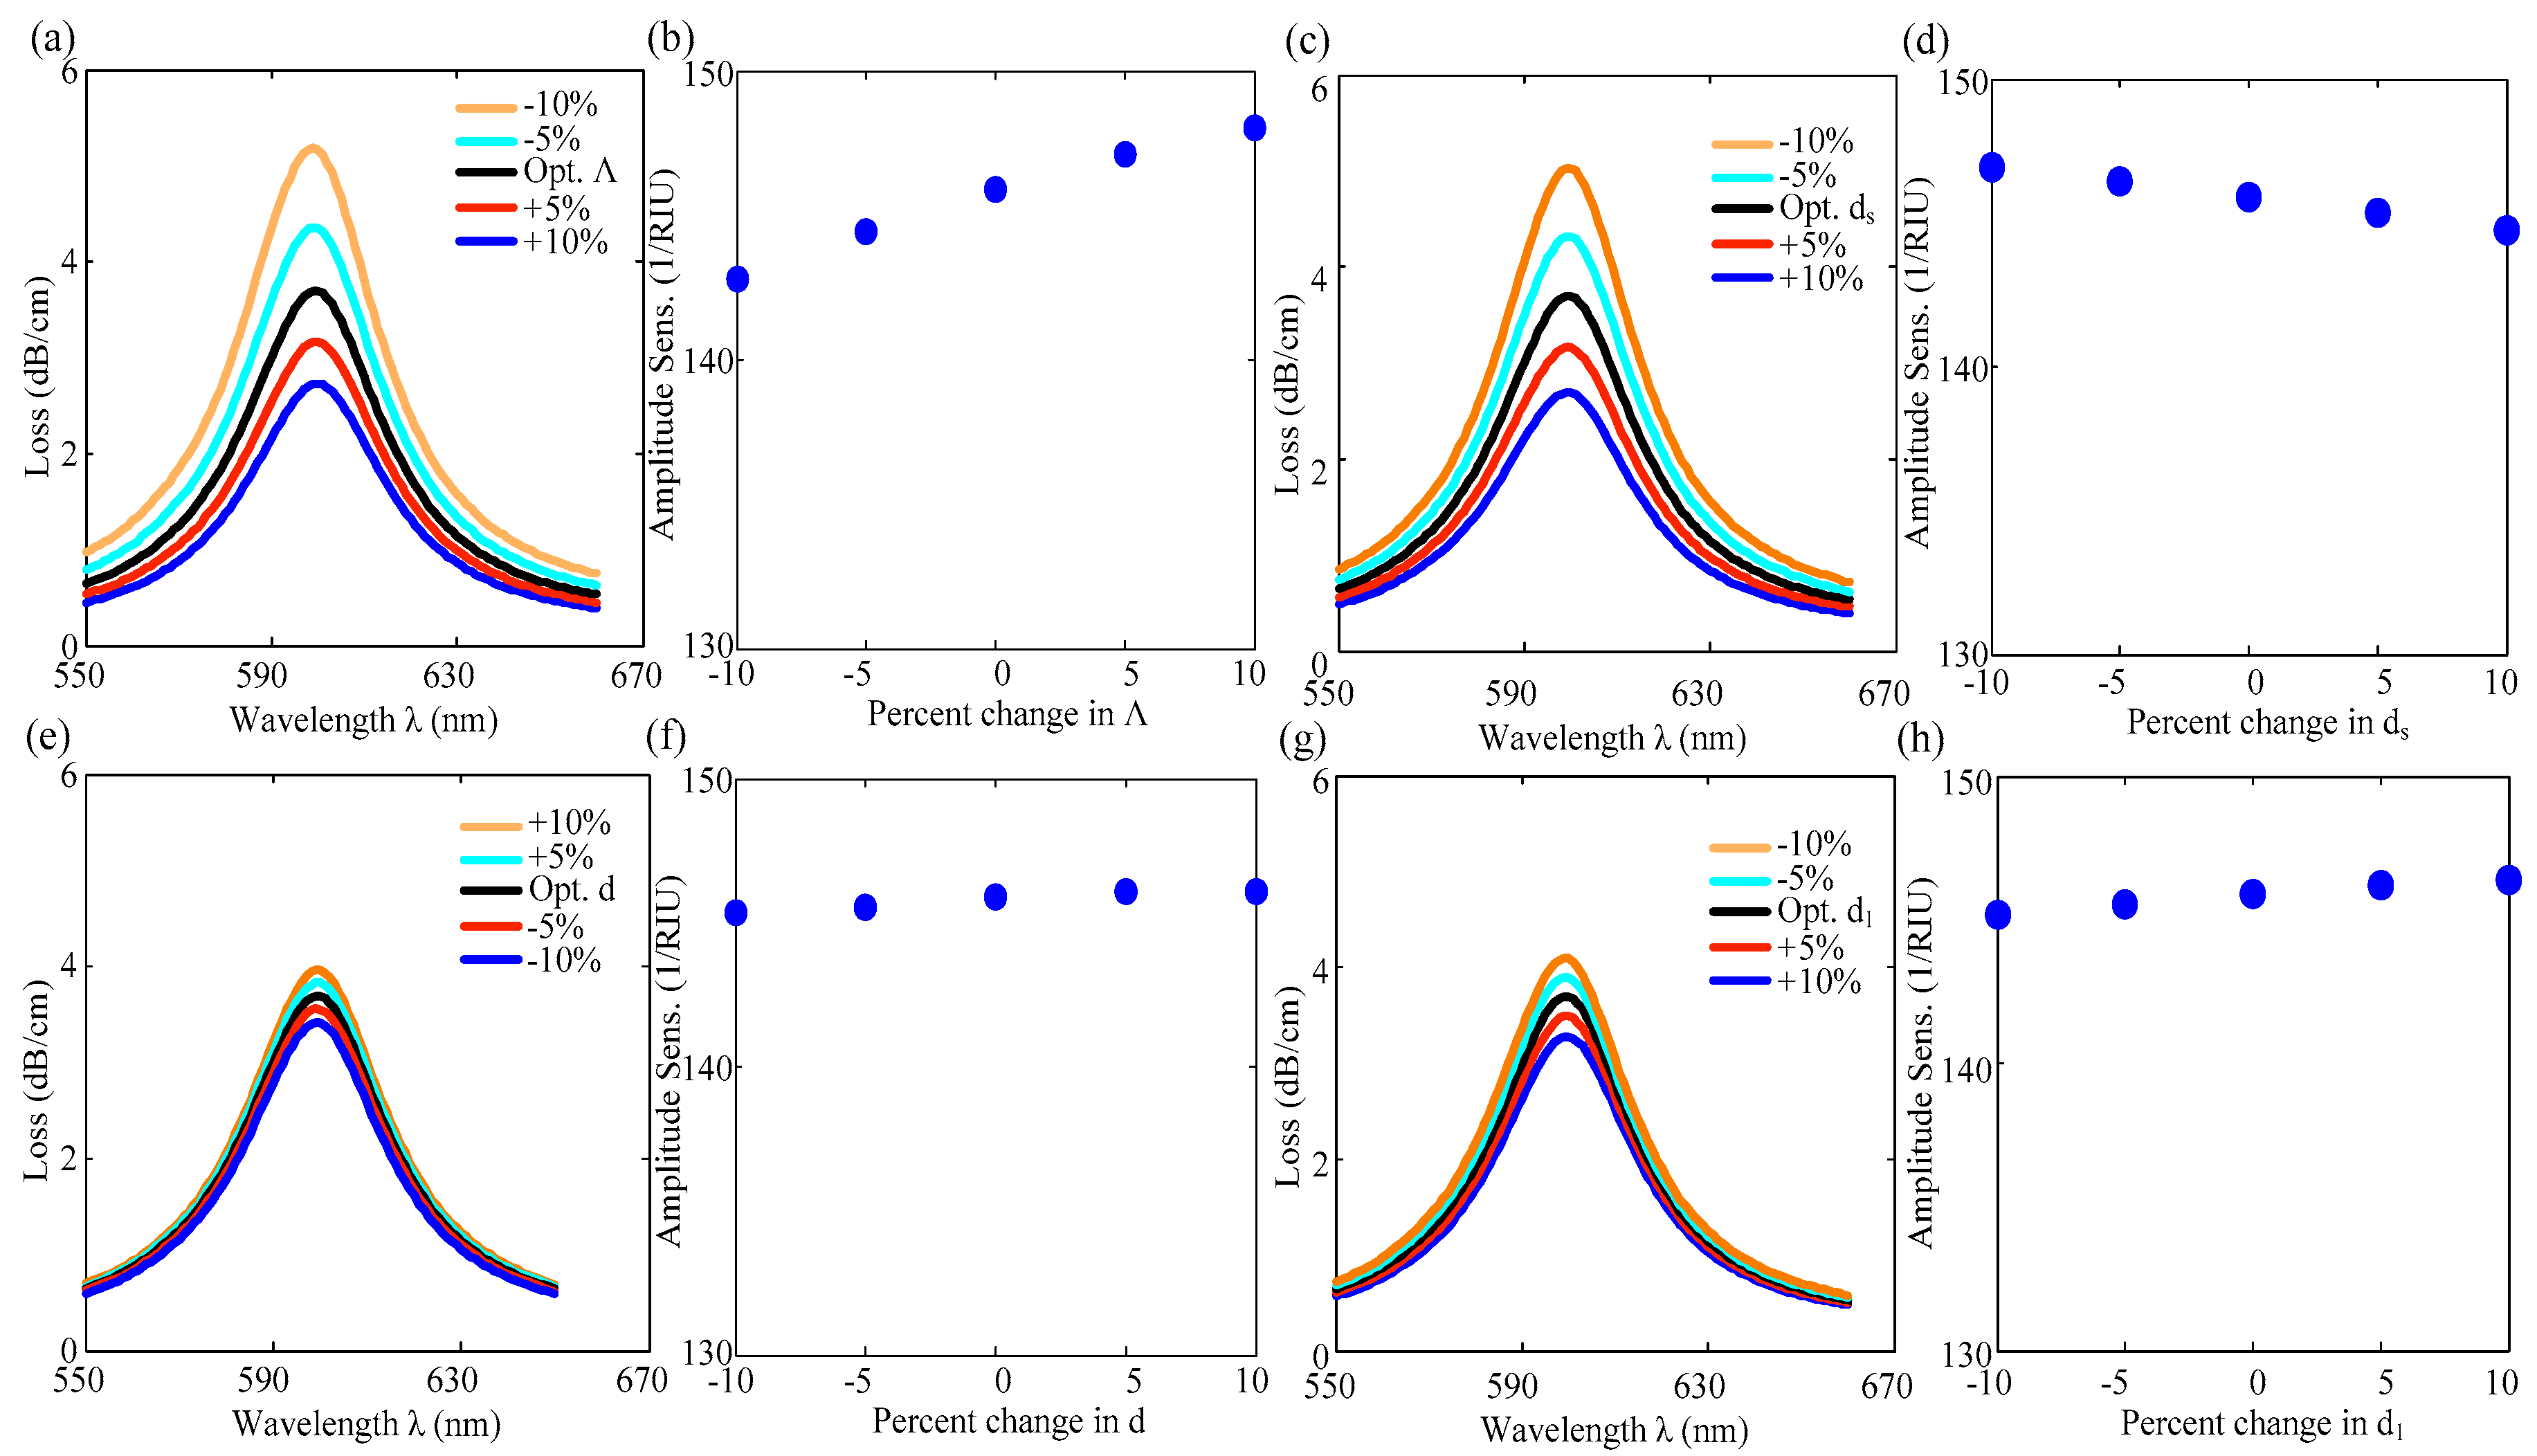
To investigate fabrication tolerance, the dependence of the sensing parameters is examined by varying all the structural parameters of the PCF sensor within ±10% of the optimized value.
Figure 9a,b shows loss spectra and amplitude sensitivity, respectively, for the change in pitch. All air hole diameters depend on the pitch, so a reduction in pitch results in the opening of the leakage path. Therefore, a reduced pitch leads to an increment of confinement loss and vice versa. For example, as the pitch is reduced by −10%, the peak loss increases by about 40%. Since the resonant wavelength remains unchanged, the wavelength sensitivity stays unaffected by the change in pitch. However, the amplitude sensitivities are altered significantly by the alteration in pitch. For example, the amplitude sensitivity increases by 1.48% for the increase in pitch by +10%. Another structural parameter d
s plays an important role in the sensing performance, as shown in
Figure 9c,d. The air hole diameter d
s regulates the evanescent wave that interacts with the plasmonic material. The smaller size of ds leads to a larger leakage path and more light to interact with the analyte. Thus, the energy transfer increases from the fundamental modes to the plasmonic modes for the reduction in ds. For example, the peak loss at the resonant wavelength rises by 36% from the optimum due to the −10% decrease in d
s. Additionally, the amplitude sensitivity increases by only 0.72% for the −10% decreases in d
s. However, the wavelength sensitivities are unchanged due to the change in d
s, similar to the case of pitch change. The effect of air hole diameter d is shown in
Figure 9e,f, and that of air hole diameter d
1 is shown in
Figure 9g,h. As one can see from
Figure 9e–h, the effect of the change in parameters d and d
1 is not significant because these parameters can hardly affect the leakage path. Therefore, peak loss and the resonant wavelength are almost the same, which leads to no noteworthy change in the wavelength and amplitude sensitivities.
Different open channel-based PCF sensors are available where the plasmonic layer is deposited either on the curved surface or flat surface of D-shaped sensors [
39]. In some cases, a microchannel is produced in PCF by a complex milling process [
40]. To avoid the complex fabrication process of the open channel, a large air hole is inserted in the stack preform of PCF that has a hexagonal lattice structure. We compare the performance analysis of those previously reported PCFs with the proposed open channel-based PCF sensor in
Table 2. The sensor performance is analyzed in terms of maximum wavelength sensitivity, amplitude sensitivity, wavelength resolution, and FOM. The proposed sensor not only shows better performance but also eliminates the complex fabrication process. The structural parameters considered in the model are compatible with the fabrication process of the sensor by using the stack-and-draw fiber drawing technique. The fabrication tolerance investigation shows that structural parameter variations within ±10% of their optimized value barely affect the wavelength and amplitude sensitivities. It is noteworthy that a fiber can be fabricated for structural parameter variation within ±1%. The robust performance with a high sensitivity enables the sensor for biomedical application in the sensing range of RI from 1.33 to 1.44.


 ,
, 
