Abstract
Using the test–retest data of the relative gravity field and earthquake monitoring catalog of the Three Gorges Reservoir (TGR) from October 2001 to October 2009, this paper systematically analyzes the changes in the gravity field in the head area of the reservoir and the temporal and spatial distribution characteristics of seismic activity during the impoundment process. It also employs the surrogate reshuffling tests to calculate the cross-correlation between the reservoir water level and the seismic activity sequence and discusses the influence of the rising reservoir water level on the gravity field and seismic activity in the reservoir region. Then, by constructing a three-dimensional finite-difference model based on the theory of fluid–solid coupling, the mechanism of reservoir-induced earthquakes is discussed from the aspects of direct reservoir water load and reservoir water infiltration. The results show that: (1) The rising reservoir water level has had a critical impact on the gravity field and seismic activity in the reservoir’s head area. The cumulative changes in the gravity field from October 2001 to November 2008 show that water impounding has led to a huge banded positive anomaly of gravity along the river near Xiangxi, which reached 450 × 10−8 ms−2. The seismicity activity dominated by micro-earthquakes after a 135 m water level rose rapidly, and the monthly average earthquake frequency increased from 2.00 before the impoundment to 92.60 after the 175 m stage. (2) From the beginning of the impoundment to the experimental impoundment stage of 175 m, the time series correlation test result between the monthly frequency of earthquakes and the water level of the reservoir also changed from uncorrelated before the water storage to correlated when the time lag was 0 months at a 95% confidence threshold. This indicates that the seismic activity obviously has a direct relationship with the load pressure produced by the rapid rise of the reservoir water level, which causes the instability of the mines, karst caves, shallow rock strata, and faults within 10 km along the river and near the reservoir bank, and consequently induces earthquakes. (3) As the TGR enters the 175 m high-level operation stage, the cross-correlation test confirmed that the seismic activity and the reservoir water level show negative correlation characteristics under the time lag of 4 to 5 months, indicating that the seismic activity has a lagging response to the reservoir water level change. The continued infiltration of the reservoir water, followed by the softening of the faults and other actions, triggered the Xiangxi M4.1 earthquake at the center of the four quadrants of gravity anomalies near Xiangxi on 22 November 2008. The Xiangxi segment of the reservoir and its periphery, a triangular geological region where the Xiannvshan faults, the Jiuwanxi fault, and the Yangtze River meet, might be at risk of having reservoir-induced tectonic earthquakes.
1. Introduction
There have been many reports about earthquakes triggered/induced by the rising reservoir water level since Carder introduced the concept of reservoir earthquakes in the study of the earthquake event in the Mead Lake area of the United States [1]. According to studies, these reservoir-induced earthquakes were found in 95 locations around the world, and there were four destructive reservoir earthquakes above M6.0, such as the Koyna M6.3 earthquake in India in 1967 [2]. The construction of various special monitoring networks has increasingly enhanced the monitoring capability in many reservoir areas, which has continuously captured more and more reservoir earthquake events [3,4,5,6,7,8].
About in width and in depth, covering the western part of Hubei Province and the eastern part of Chongqing City, the Three Gorges Reservoir (TGR) is the world’s largest hydropower station. It has a capacity of and a water surface area of approximately 1045 km2 [9]. With the impounding process of the TGR, the water level before the dam in the reservoir area gradually rose from around 60 m to 135 m, 156 m, and 175 m. Thereafter, it fluctuated between 30 and 40 m each year. Such long-term and cyclical water level changes have profoundly impacted the gravity field, crust strain and stress fields, and seismic activity in the TGR area and its outer limit. As of the end of 2020, the Three Gorges Monitoring Area has monitored about 13,963 earthquakes above M0, including 8063 earthquakes of 0 to 0.9 magnitude, 5308 of 1.0 to 1.9 magnitude, 536 of 2.0 to 2.9 magnitude, 45 of 3.0 to 3.9 magnitude, 10 of 4.0 to 4.9 magnitude, and 1 earthquake of above 5.0 magnitude. The most intense one was the Badong county M5.1 earthquake on 16 December 2013.
Yao et al. studied many such seismic activities using the earthquake catalogue of small earthquakes with precise positioning that systematically gives the temporal and spatial distribution and activity characteristics [10]. The ETAS model that can detect the triggering effect of the fluid showed that the impoundment played an important role in triggering the 2013 Badong M5.1 earthquake sequence [11]. The change in Coulomb Failure Stress calculated by the coupled three-dimensional poroelastic finite-element model further suggested that the procedure or occurrence of the earthquakes was facilitated by impoundment [9]. However, aside from the tectonic reservoir earthquakes, such as the Badong M5.1 earthquake, the collapsing of a large number of mines and karsts in the area along the river also caused the earthquakes. They have no obvious seismic faults, and the vertical crustal compression created by water impoundment is the leading cause. The most direct observational data were obtained from the precision leveling observation to the ground subsidence of the reservoir area. On the other hand, as the observation distance increases, the steep mountains and complex terrains in the Three Gorges Reservoir area cause the heavy accumulation of precision leveling error [12,13]. In contrast, the InSAR data are primarily used for monitoring the displacement of landslides in the area [14]. Therefore, we have yet to see any large-scale vertical deformation studies of the Three Gorges’ crust being published.
However, it is encouraging that Walsh and Rich gave the solution integration of the change of elevation δh and the change of gravity δg using the model of gravity change caused by elastic deformation in a uniform non-weighted half-space and the principle of virtual work. Therefore, gravity observation can directly reflect the crustal movement in the vertical direction [12]. At the same time, because mobile gravity is easy to use and can quickly produce measurements, it can identify the gravitational effect of faults caused by material migration and tectonic deformation [15]. In recent years, there have been several strong earthquakes that happened after substantial mobile gravity anomalies were detected. A stark example is the Wenchuan M8.0 earthquake on 12th May 2008. The consensus is that strong and destructive earthquakes are more likely to happen in a gradient zone with positive and negative changes in the gravity field [16].
The dynamic difference of the gravity field in the TGR area before and after the 135 m impoundment was calculated using the test–retest data of mobile gravity. It showed that the maximum change in the dam area was about [17]. Yang et al. further employed the ZY-3 high-resolution multispectral remote sensing image to obtain the lake water data library. Results from the integration of the Newton load model showed that the gravity increment on either side of the TGR bank could reach [18]. The changes could increase the background of the regional seismicity. However, the current theoretical calculation models, such as the cuboid model [19] or the negative Green’s function integral method, only consider the direct effect of the gravity change of the massive water load and fail to assess the gravity change effect caused by underground water infiltration. Therefore, it would be difficult to determine the impact of water impoundment on the gravitational field using a simple theoretical model and obtain reliable results. Yet, the results of gravity observations obtained are precisely the superposition of the two effects above.
Facing such significant mobile gravity anomalies, as a typical local area where earthquakes occur frequently in reservoirs, these long-term re-measured gravity data combined with rich earthquake catalog data will certainly provide a rare opportunity to reveal reservoir-induced earthquakes. However, we have yet to see any report that gives a comprehensive analysis about the changes in the gravity field and seismic activity in the reservoir area induced by the TGR’s impoundment over a long period of time.
First, we used the earthquake monitoring catalog and test–retest data of the relative gravity field, which were collected by the reservoir-induced earthquake monitoring system for the Yangtze River Three Gorges Project (Figure 1) from 2001 to 2009 during the reservoir’s impounding process, focusing on the key monitoring areas of the Three Gorges Project (110.2~111.1° E 30.6~31.2° N), to study the impact of the rising reservoir water level on the regional gravity field and seismicity. Secondly, the cross-correlation and reshuffling tests were used to calculate the time series correlation between the monthly frequency of the earthquake and the water level. Based on this, we further discuss the mechanism of the TGR earthquakes by establishing a three-dimensional finite-element model and tried to gain a new understanding of the relationship between the reservoir’s seismicity and the water level.
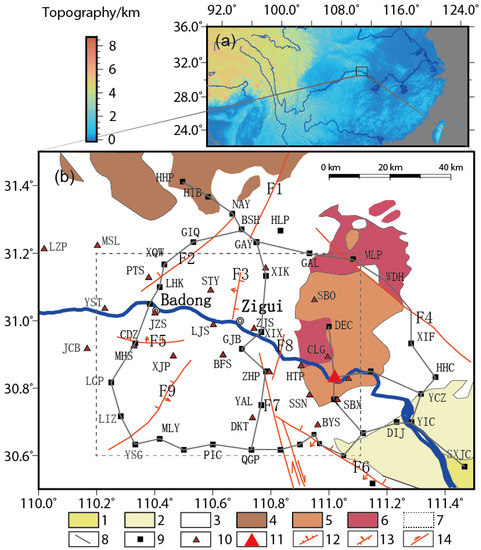
Figure 1.
Comprehensive information of the head area of the TGR. (a) The location of the study area; (b) overview of the geological structure in the head area of the TGR and the reservoir-induced earthquake monitoring system for the Yangtze River Three Gorges Project. (1. Quaternary strata; 2. Cretaceous~Upper Triassic upper caprock structural sublayer; 3. Sinian~Middle Triassic lower caprock structural sublayer; 4. Middle Proterozoic-upper basement structural sublayer; 5. Lower Proterozoic-lower basement structural sublayer; 6. Jingningian period intermediate-acid igneous rocks; 7. The Three Gorges key monitoring area; 8. Gravity Survey Line; 9. Gravity observation network; 10. Seismic stations; 11. The Three Gorges Dam; 12. Normal fault; 13. Reverse fault; 14. Strike–slip fault. Faults: F1, Xinhua faults; F2, Gaoqiao faults; F3, Shuitianba faults; F4 Wuduhe, faults; F5, Badong faults; F6, Tianyangping faults; F7, Xiannushan faults; F8, Jiuwanxi faults; F9, Longwangchong faults).
2. Geological Structure Characteristics of the Reservoir’s Head Area
The head area of the TGR is located in the Upper Yangtze Platform fold belt of the Yangtze Quasi-Platform. The structural framework of the study area is mainly composed of the Zigui Basin, the Huangling anticline, and the southern part of the Shennongjia dome [20]. The main active faults include Xiannvshan faults, Jiuwanxi faults, Shuitianba faults, Gaoqiao faults, and Tianyangping faults, shown in Figure 1.
The active faults surrounding the Huangling anticline are typically strike–slip normal faults. Among them, the faults along the northwest and the northeast, such as the Xiannvshan faults and Shuitianba faults, are usually dextral strike–slip normal faults. On the other hand, the Gaoqiao faults along the northeast are sinistral strike–slip normal faults. The Huangling anticline and its surrounding area are under constant squeezing and shearing forces and, at the same time, constantly uplifting and expanding, which are the main causes of such a complex structure. Consequently, the surrounding active faults produce a strike–slip action, while still being normal faults. The risk of reservoir-induced earthquakes under such a geo-structure is worth employing multiple observation methods for further discussion [20].
3. Data and Methods
3.1. Gravity Surveying and Data Adjustment
The TGR and the reservoir-induced earthquake monitoring system is shown in Figure 1 and Figure 2. There are two LCR gravimeters onsite for mobile gravity observations. The accuracy of the LCR gravimeters is greater than , and the drift is less than per hour. Furthermore, once every three years, the LCR gravimeter is attuned with China’s gravity calibration baseline. The assessment schedule and paths are arranged with two assessment rounds annually. The first starts from March to April and the second from October to November. The annual observation data from October to November were selected to avoid the influence of rainfall and other seasonal effects.
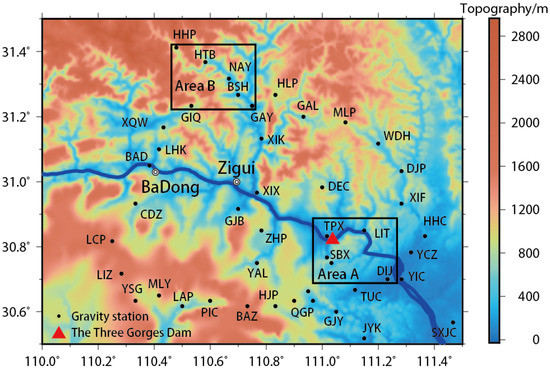
Figure 2.
Codes of the gravity station and area selection for the interpolation algorithms: A represents riverside and B hills.
The joint assessment is a round-trip starting in Wuhan with onward and backward field assessment paths. It was observed that the gravity value differences of the starting and ending stations, for both the onward and backward assessments on the same path, kept lower than for the two gravimeters and for the same gravimeter; if not, the assessments were restarted. After adjustment, the precision of the mobile gravity surveillances was from from 2002 to 2009, as shown in Figure 3a.
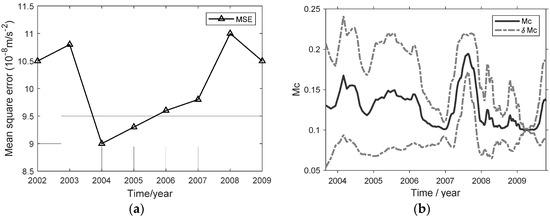
Figure 3.
Data accuracy and integrity: (a) Mean-squared error of the gravity observation network from 2002 to 2009. (b) Magnitude of completeness calculated by using Zmap.
3.2. Gridding of Gravity Data
The study area is the hill region and the region along the river. After being adjusted for the whole area, the gravity data were interpolated using three interpolation algorithms, Kriging, Radial Basis Function (RBF), and Triangulation with Linear Interpolation (TLI) [21].
First, the calibrated gravity data of the two areas were removed, indicated by the rectangles, as shown in Figure 2. Then, the gravity data outside the rectangles were used in the interpolation. The adjusted gravity data were the true values and were compared with the interpolated values. Therefore, the algorithms’ performance was determined by the differences divided by the true values, as shown in Table 1. Appendix A gives a further explanation of gridding and several intermediate diagrams using the example of the Kriging interpolation algorithm of the dynamic changes of the gravity field from October 2002 to October 2003, around the 135 m water level stage.

Table 1.
The percentage of relative error between different interpolation results and the observed value.
After gridding of gravity data, accidental errors, superficial crust, and local anomaly sources were eliminated. The deep crust and regional anomaly sources are highlighted. The point data that did not show the continuity and trend of gravity changes were also eliminated so that the differential image of the gravity field can have a greater accuracy, reflecting the characteristics of the gravity field changes in the study area during the TGR’s impoundment process.
3.3. Earthquake Monitoring Catalog
The Seismic Digital Telemetry Network of the Yangtze River Three Gorges Project Reservoir Earthquake Monitoring System was built in 1997 and was officially put into operation in October 2001. It has 24 seismic digital high-gain telemetry stations located between the Sandouping Dam site and Nanmuyuan of Badong County from east to west. (Figure 1). From January 2001 to December 2009, 3986 seismic events were observed in the key monitoring area of the TGR’s head area (Figure 4 and Figure 5), with the magnitude of completeness between M0.1 and M0.2 calculated by using Zmap [22] (Figure 3b), which can ensure that the earthquakes in time and space are basically complete. It can be used to analyze and study the correlation between seismic activity and reservoir water level. To quantitatively discuss the time-domain correlation between seismic activity and water impounding, we tried to use the cross-correlation and reshuffling tests [23,24] to calculate the correlation between the monthly seismic frequency of M ≥ 0.2 seismic activity and the reservoir water level and give the cross-correlation coefficient and the confidence threshold under different time lag parameters.
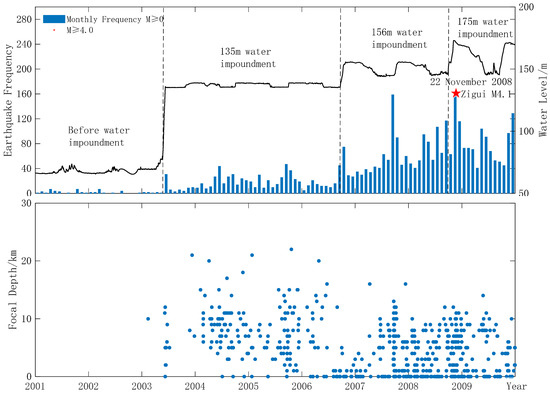
Figure 4.
Reservoir water level, monthly seismic frequency, and the earthquakes above M4.0 during the impounding process of the TGR (January 2001–December 2009, M ≥ 0).
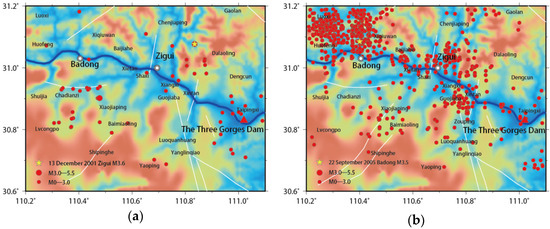
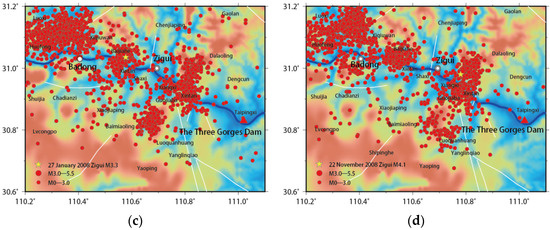
Figure 5.
Spatial distribution of seismicity in the study area during the impoundment of the Three Gorges Project (January 2001–December 2009, M ≥ 0). (a) Before the water impoundment; (b) 135 m stage; (c) 156 m stage; (d) 175 m experimental stage.
3.4. Cross-Correlation Method Based on Reshuffling Tests
In order to answer the question “whether there is a clear correlation between seismic activity and artificial inducements”, Schultz et al. used the cross-correlation and reshuffling tests to determine the cross-correlation coefficient and time lag between the time series of earthquake numbers and artificial inducements [23,24]. Compared with the simple Pearson correlation coefficient method, the cross-correlation and reshuffling tests determine the statistical confidence interval and can detect accurate time lag signals [25].
The algorithm is based on two discrete time series data sets and . In the first step, the input data set should undergo dimensionality reduction () before the standardized cross-correlation calculation, where represents the serial number of and . Through the translation of the time axis, the cross-correlation coefficient under different time lag conditions and is calculated, and the result ranges from −1 to 1.
In the second step, the cross-correlation coefficient thresholds under different confidence levels are calculated. On the premise of keeping the spectrum value unchanged to ensure the autocorrelation of the same period, for the univariate linear process , the substitution variable is:
Here, < 2π is an independent random number. The Monte Carlo method is used to generate the random number and obtain replacement data sets . By calculating the cross-correlation coefficient between the replacement data set and , the cross-correlation function distribution of “noise” is simulated, and the threshold value of under different confidence conditions is obtained. In testing the hypothesis, according to previous studies, a confidence level of 95% and above is usually selected as the minimum value of statistical significance. The peak value of represents the best guess of the time lag, and the peak width above the confidence threshold (such as 95%) represents the error caused by discrete sampling and noise.
4. Gravity Field Changes and Seismicity during the Process of Water Impounding
The progress and occurrence of earthquakes is a process of regional tectonic stress accumulation and energy release. With the continuous rise of the reservoir water level during the Three Gorges Project’s impoundment process, the direct and massive water load, infiltration, and water–rock coupling make the crustal stress–strain field in the head area of the TGR go through a complex process of rapid accumulation and release, during which the density change inside the crust is inevitably reflected in the Earth’s gravitational field. A comprehensive analysis of the evolution process of regional gravity may better reveal the development and occurrence of reservoir-induced earthquakes. Therefore, based on the differential dynamic variation images of the Earth’s gravity field (Figure 6), the average monthly earthquake frequency (Table 2), and the temporal and spatial distribution of seismic activity (Figure 4 and Figure 5), the gravity field changes and seismic activity during the impoundment of the Three Gorges Project is comprehensively analyzed.
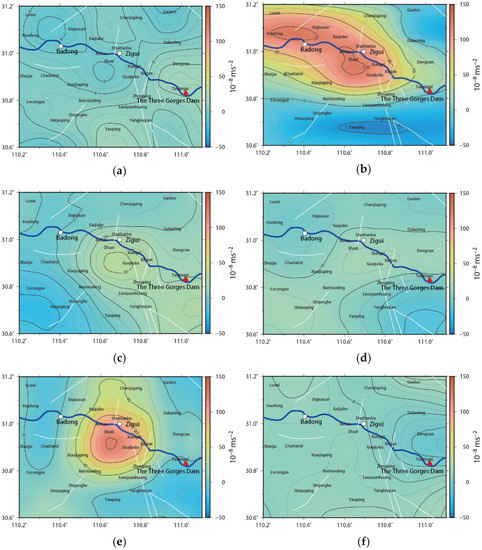
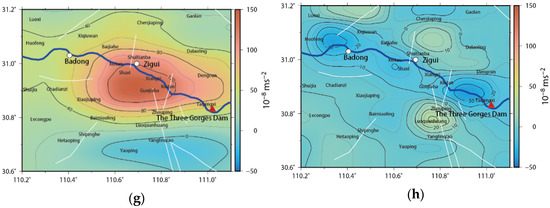
Figure 6.
Gravity field differential dynamic variation images in the study area during the impoundment of the Three Gorges Project (October 2001–October 2009). (a) October 2001–October 2002; (b) October 2002–October 2003; (c) October 2003–November 2004; (d) November 2004–October 2005; (e) October 2005–November 2006; (f) November 2006–November 2007; (g) November 2007–November 2008; (h) November 2008–October 2009.

Table 2.
Average monthly earthquake frequency in different magnitude grades of the study area and in different impoundment stages of TGR.
4.1. Before the Water Impoundment
Before the TGR’s impoundment in May 2003, it is shown in Figure 6a that the change of the gravity field in the study area was relatively simple. It was mostly in a state of calm and relaxation, maintaining the pattern of change that is increasing in the south and decreasing in the north. The magnitude of the change is fairly small, from , which is equivalent to the observation error, indicating that the gravity field is in a relatively stable state during this period. The strikes of the Jiuwanxi faults, Tianyangping faults, and the southern segment of the Xiannvshan faults are consistent with the gravity contours, suggesting that active faults control the gravity field. During the same period, the level of seismic activity was quite low (Figure 4). The monthly average seismic frequency of earthquakes above M0 was around 2.00 (Table 2). They were distributed in a relatively uniform dot pattern in the study area, which have no clear consistency with the flow direction of the Yangtze River (Figure 5a). The seismic activity b value at this stage is about 0.68, within the range of natural tectonic earthquakes (0.6~0.8) [10], indicating that most of them are likely natural earthquakes before the impoundment.
4.2. The 135 m Stage
From 25 May 2003 to 19 September 2006, the period was the water impounding stage of 135 m. As the reservoir water level rose rapidly, the direct water load obviously had immediate gravity effects. Two regions in the study area, Badong and Zigui, both had a peaking positive anomaly of banded gravity along the river, covering a huge area. The latter had a positive anomaly reaching (Figure 6b). The visible expansion on both sides of the reservoir bank not only demonstrated the scope of the reservoir water’s impact, but also showed the strengthening of the indirect gravity effect. As the reservoir water level stabilized near 135 m, a positive gravity anomaly of around appeared near Xiangxi, indicating an infiltration of the reservoir water in the area (Figure 6c). At the same time, the spatial consistency between the gravity field and the active fault worsened compared to before the impoundment, implying that the control effect of the active faults weakened in the short term.
As shown in Figure 4 and Table 2, the time series of the reservoir water level and monthly earthquake frequency indicated that the seismic activity after the 135 m water level rose rapidly, and the monthly average earthquake frequency increased from 2 before the impoundment to 18.9 after. However, the added ones were mainly micro-earthquakes of magnitude 0.0–0.9. In terms of spatial distribution, the seismic activities during this period were predominately distributed in the areas within 10 km on both sides of the reservoir bank, such as Badong and Zigui (Figure 5b). The largest seismic event was the Badong earthquake of magnitude 3.5 on 22 September 2005. The focal depth of seismic activity at this stage was usually shallow, most of them within a range of 5 km. Some earthquakes that coincided with the distribution of mines and karsts along the river were even close to the surface [26]. The seismic activity b value at this stage was about 0.91 [10], which is significantly greater than 0.68, the value before the impoundment. It had obvious characteristics of reservoir-induced earthquakes. It is worth noting that the positive gravity anomaly area along the river forms a good spatial envelope for the seismic activity during the corresponding period, indicating that the direct reservoir water load has an important impact on the seismic activity.
4.3. The 156 m Stage
From 20 September 2006 to 27 September 2008, this period was the water impounding stage of 156 m. The gravity field of the study area continued the positive anomaly characteristics of the area along the river, and the positive anomaly of gravity near Xiangxi reached (Figure 6e). This indicated that the area along the river was experiencing continuous pressure under the further increase of the direct load of the reservoir water. However, the impact of water impounding activities on the stress–strain state may be more concentrated around Xiangxi.
Micro-earthquakes still dominated the seismic activity in the area along the river during the period. The frequency of earthquakes of magnitude M0.0–0.9 was about 4-times higher than that of the 135 m stage, and the frequency of earthquakes in the range of M1.0–3.9 also increased simultaneously. The monthly average frequency of earthquakes during the period reached 74.3, indicating that seismic activity continued to increase (Table 2). The spatial distribution of the epicenter within the 156 m stage continued to be in line with the positive anomaly of gravity. While further extending to both sides of the reservoir bank (Figure 5c), the focal depth deepened to within 10 km (Figure 4), indicating that the infiltration of the reservoir water in the vertical and horizontal was evident, becoming an important influencing factor other than the direct water load.
4.4. The 175 m Experimental Stage
After September 2008, the Three Gorges Project entered the 175 m experimental impoundment stage. The reservoir water level continued to rise and reached the high point of above 172 m for the first time in December 2008. The large-scale positive anomaly of gravity along the river appeared again in the study area, especially around the Xiangxi reservoir segment of the Yangtze River, with a positive anomaly extreme value of about (Figure 6h). The seismic activity still continued the transient response characteristics of the 156 m impoundment stage (Figure 6b), further extending to both sides of the reservoir bank with the Yangtze River as the axis.
After the reservoir water level rose to 175 m, which is the high-level operation stage, the annual periodic change of the reservoir water level fluctuated between 30 and 40 m (Figure 4). The gravity field and seismic activity of the reservoir area began to show more complex dynamic changes. As shown in Figure 6g, there was a noticeable banded negative anomaly of gravity in the area along the Yangtze River. The negative anomaly extreme values were about , appearing near Taipingxi of Badong and Zigui because the direct reservoir water load decreased due to the drop in the water level from November 2008 to October 2009. At the same time, it was clear that there was a positive anomaly of gravity on the north and south sides of the Xiangxi reservoir segment of the Yangtze River. Luoquanhuang of Zigui recorded an extreme positive anomaly value of about . There is a high gradient characteristic of excessive positive and negative anomalies near Xiangxi, which is in the center area of the four quadrants. The Xiannvshan faults and the Jiuwanxi faults are once again consistent with the gravity field, suggesting that the former is starting to control the latter. Moderate and strong earthquakes are prone to occur in the central area of the four quadrants of changing gravity related to tectonic activities or in the high gradient zone of the transition between positive and negative anomalies [16]. The Xiangxi segment of the reservoir, a triangular area where the Xiannvshan faults and Jiuwanxi faults meet the Yangtze River, may be at risk of having moderate earthquakes on the periphery of this area. When the reservoir water level reached 172 m for the first time, the Zigui M4.1 earthquake erupted in November 2008, which was the first earthquake with a magnitude of M4.0 or more since the impoundment of the TGR.
5. Time Series Correlation Test of Seismic Activity and Reservoir Water Level Based on Reshuffling Tests
The above analysis of seismic activity and gravity field differentiation in the water impounding process indicates that there is a clear correlation between the impoundment of the Three Gorges Project and seismic activity. To evaluate this correlation and give quantitative evidence, we used the cross-correlation and reshuffling tests to give the time series correlation between the reservoir water level and the monthly frequency of earthquakes. Figure 7 shows the cross-correlation coefficients and 95% confidence threshold under different time lag conditions.
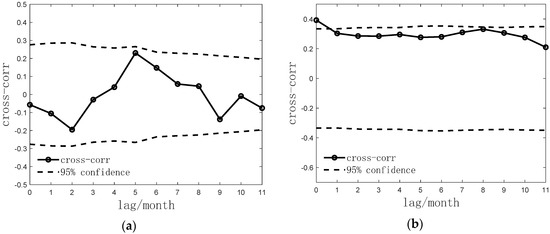
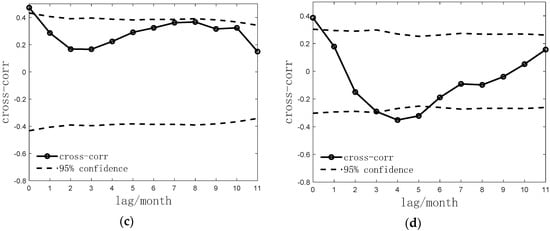
Figure 7.
Correlation test between monthly frequency of seismicity and reservoir water level in the study area during the impoundment of the Three Gorges Project (January 2001–December 2009). (a) Before the impoundment; (b) 135 m stage; (c) 156 m stage; (d) 175 m stage.
Since the beginning of water impounding in May 2003, the water level of the TGR had gone through the stages of 135 m, 156, and 175 m. The correlation test result between the monthly frequency of earthquakes and the water level of the reservoir also changed from uncorrelated before the water storage (Figure 7a) to correlated when the time lag was 0 months at a 95% confidence threshold (Figure 7b–d), indicating that the continuous rise of the reservoir water level has a decisive effect on the seismic activity. It is worth mentioning that, during the three stages of water impoundment, they both achieved a correlation coefficient of about 0.4 when the time lag was 0 months, of which the result seems relatively small. However, Luciano Telesca used the reshuffling tests method to study the Koyna reservoir earthquake in India and pointed out that the maximum correlation coefficient between the two was merely 0.13. Still, it cannot be plainly said that the two are not relevant since they passed the reliability test [13]. The significance of the reshuffling tests method is to provide a threshold of the correlation coefficient by simulating the distribution of various types of noise. It can answer the scientific question of practical significance of how much the correlation coefficient implies a correlation between seismic activities and reservoir water level changes [24].
As the TGR enters the 175 m high-level operation stage, the annual change of the reservoir’s water level is around 30–40 m. The time series cross-correlation test of the monthly frequency of earthquakes and the reservoir water level confirms that the seismic activity and the reservoir water level show negative correlation characteristics under the time lag of 4 to 5 months, indicating that the seismic activity has a lagging response to the reservoir water level change (Figure 7d). The lagging response phenomenon has been observed in many reservoir earthquake-prone areas, such as the Koyna area of India and the Aswan Dam area of Egypt [23,27]. It usually occurs several years or even decades after the water impoundment. Although the above two still maintain the characteristic of a synchronous positive response, the new lagging response is direct evidence of the continuous infiltration of reservoir water in the study area, suggesting that its influence on the crustal stress–strain field in the study area has gradually deepened [23,27]. This is an interesting question that is worthy of our analysis of the causing mechanism and an attempt to further explain it.
6. Causing Mechanism of Seismicity during the Impoundment
The mobile gravity observation intuitively outlined the impact range and amplitude of the impoundment of the Three Gorges Project on the crust in the study area. It shows that the direct reservoir water load, water infiltration, and water–rock coupling have an important influence on seismic activities in the reservoir area (Figure 8). Furthermore, the correlation test between seismic activity and reservoir water level changes further provides pieces of evidence to the forming mechanism.
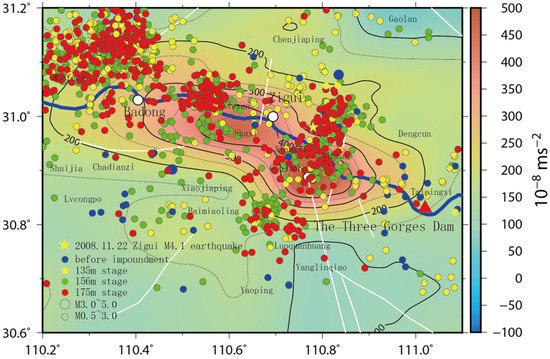
Figure 8.
Changes in the gravity field (October 2001–November 2008) and seismicity.
As a result, to explore the causing mechanism of the reservoir earthquakes, a necessary simplification was made to the complex faults system in the Three Gorges Reservoir area based on the fluid–solid coupling theory [28,29,30], and a three-dimensional finite-difference model of the study area was established, as shown in Appendix B. To analyze the effect of the direct water load on the crustal stress–strain field, Figure 8 shows the distribution of the maximum shear–strain near the surface of the study area. The pore water pressure at the section near Xiangxi is given, so that we can understand the water seepage during the impounding process. Based on these gravity observations and numerical simulations, we then discuss the causing mechanism of the TGR earthquake.
6.1. Influence of Direct Reservoir Water Load
Observations of the gravity can directly reflect the vertical crustal movement in the crust, and the positive gravity anomaly indicates that the area is squeezed in the vertical direction. The cumulative changes in the gravity field from October 2001 to November 2008 given in Figure 8 show that water impounding has led to a huge banded positive anomaly of gravity along the river in the study area. The positive anomaly of gravity near Xiangxi reached . It formed a good envelope for the seismic activity in the head area of the reservoir, indicating that the direct reservoir water load caused by the impoundment has a huge impact on the crustal stress–strain field in the study area.
At the same time, from the maximum shear–strain field near the surface of the study area, it can be seen that, before the water impoundment, the crustal shear–strain field of the study area is closely related to the distribution of active faults (Figure 9a), which is about 1.3, a relatively low level. As the reservoir water level rose to 135 m and 156 m, the maximum crustal shear–strain field along the river increased to 3.0 and 3.4. Then, finally, at the 175 m stage, it reached 7.0 at the intersection of the Jiuwanxi faults and the Yangtze River (Figure 9b–d). At the beginning of the 135 m water impounding stage, especially, the upstream of the dam showed noticeable characteristics of banded strips along the river (Figure 9b), which is consistent with the positive gravity anomaly range.
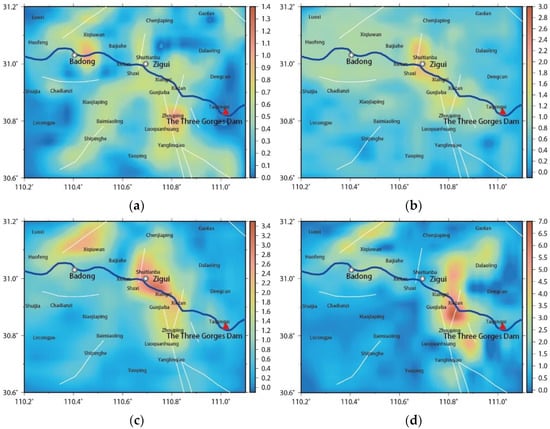
Figure 9.
The maximum shear–strain field at 500 m below the ground in the study area: (a) before the impoundment, (b) 135 m stage, (c) 156 m stage, and (d) 175 m stage.
The characteristics of the crustal strain field obtained by the numerical simulation indicate that water impoundment would create drastic changes in the crustal stress–strain field along the river. It also explains why the 20 m to 30 m changes of the reservoir water level, before and after different impounding stages, can cause such a substantial transformation in seismic activity characteristics (Figure 5). After further combining the distribution characteristics of the banded strips of the positive gravity anomalies along the river (Figure 8), we can understand the mechanism of reservoir earthquakes directly induced by reservoir water loads. To elaborate, the instant elastic loading at the bottom of the reservoir caused the instability of mines, karst caves, shallow rock strata, and faults within 10 km along the river and near the reservoir bank to induce earthquakes [26], which manifested as an “instantaneous” response to the rise of the reservoir water, non-tectonic (induced) reservoir earthquakes.
6.2. The Effect of Reservoir Water Infiltration
After the 175 m water impounding stage, the Three Gorges Reservoir began the high-level periodical operation stage. Beside the periodical annual changes, the direct water load of the reservoir no longer increased significantly. The difference calculation of relative gravity at this stage mostly reflects the gravitational effect of faults caused by material migration and tectonic deformation. Figure 10 shows that Xiangxi is the tectonic intersection of the Xiannvshan faults and the Jiuwanxi fault. When the reservoir water level stays unchanged, there are still noticeable positive anomalies of gravity, implying that the reservoir has strong bottom water infiltration.
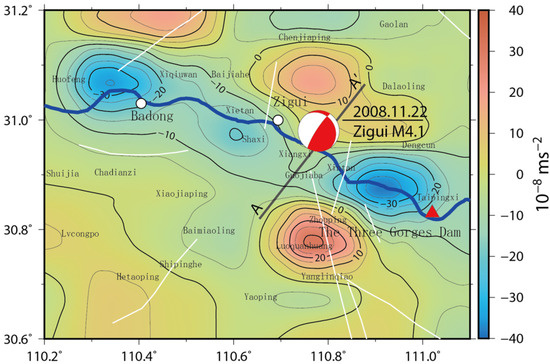
Figure 10.
Changes in the gravity field after November 2008 (November 2008–October 2009) and the focal mechanism of the Zigui M4.1 earthquake.
From the water pressure distribution of the pores at the A-A′ section shown in Figure 11, it can be seen that, as the reservoir water level rises, the water pressure of the pores in the crust along the river demonstrates an increasing trend. The extreme values at the 135 m, 156 m, and 175 m stages are about 6 Mpa, 9 Mpa, and 12 Mpa, respectively. Significant local extremes of pore water pressure appeared around the structural intersection of the Xiannvshan faults, Jiuwanxi faults, and the Yangtze River (red box in Figure 11). A series of numerical simulations and the results are spatially consistent with the four-quadrant features of gravity anomalies, indicating that the reservoir water is rapidly infiltrating following the structure weakness near the faults’ zone. At the same time, the maximum shear–strain field at the intersection of the structure also reached the historical peak value of 7.0, suggesting that the activity of the faults’ zone has drastically increased (Figure 9d). It is worth noting that the Zigui M4.1 earthquake on 22 November 2008 occurred right at the center of the four quadrants of gravity anomalies near Xiangxi. It can be seen from the focal mechanism in Figure 10 that a relatively large tectonic earthquake was triggered after the 175 m water impounding stage, indicating that water infiltration and water–rock coupling in the reservoir began to trigger tectonic reservoir earthquakes.
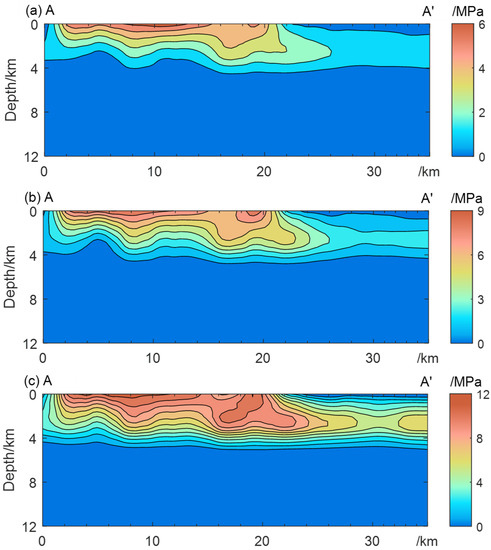
Figure 11.
Pore pressure of A-A′ profile under different water levels: (a) 135 m stage, (b) 156 m stage, and (c) 175 m stage.
The mechanism of reservoir water infiltration triggering structural reservoir earthquake is as follows [26]: First, the reservoir water produces water pressure during the infiltration process, diffusing pores and reducing the normal stress, which in turn reduces the friction of the faults and causes earthquakes; second, the physical and chemical effects of the reservoir water on the faults or rocks, such as softening, lubrication, expansion, and stress corrosion, cause rock masses to destabilize and shake.
7. Conclusions
Using the test–retest data of the relative gravity field and the earthquake monitoring catalog of the TGR, this paper systematically analyzed the changes in the gravity field in the head area of the reservoir and the temporal and spatial distribution characteristics of seismic activity during the impoundment process. It also employed the cross-correlation and reshuffling tests to calculate the cross-correlation between the reservoir water level and the seismic activity sequence and discussed the influence of the rising reservoir water level on the gravity field and seismic activity. By constructing a three-dimensional finite-difference model based on the theory of fluid–solid coupling, the forming mechanism of the Three Gorges Reservoir earthquake was discussed from the aspect of direct reservoir water load and reservoir water seepage. The result showed the following:
- (1)
- The rising reservoir water level has had a crucial impact on the gravity field and seismic activity in the reservoir’s head area. The cumulative changes in the gravity field from October 2001 to November 2008 show that water impounding has led to a huge banded positive anomaly of gravity that reaches along the river near Xiangxi. The seismicity activity dominated by micro-earthquakes rose rapidly after the 135 m water level, and the monthly average earthquake frequency increased from 2.00 before the impoundment to 92.60 after the 175 m stage. The massive amount of water load caused the study area to have a positive anomaly of banded gravity along the river, which is centered on Badong county and Xiangxi Estuary of Zigui county. It also formed a good spatial envelope due to the sudden increase in seismic activity during the corresponding periods, which means that the variation of gravity can reveal the influence range of direct reservoir water load.
- (2)
- From the beginning of the impoundment to the experimental impoundment stage of 175 m, the time series correlation test result between the monthly frequency of earthquakes and the water level of the reservoir also changed from uncorrelated before the water storage to correlated when the time lag was 0 months at a 95% confidence threshold. Further gravity observations and numerical simulation results showed that the seismic activity obviously has a direct relationship with the load pressure produced by the rapid rise of the reservoir water level, which causes the instability of the mines, karst caves, shallow rock strata, and faults within 10 km along the river and near the reservoir bank, and consequently induces earthquakes.
- (3)
- As the TGR entered the 175 m high-level operation stage, the cross-correlation test confirmed that the seismic activity and the reservoir water level showed negative correlation characteristics under the time lag of 4 to 5 months, suggesting that the seismic activity has a lagging response to the reservoir water level change. Gravity and numerical simulation results showed the continued infiltration of the reservoir water, followed by the softening of the faults and other actions, triggering the Xiangxi M4.1 earthquake at the center of the four quadrants of gravity anomalies near Xiangxi on 22 November 2008. The Xiangxi segment of the reservoir and its periphery, a triangular geological region where the Xiannvshan faults, the Jiuwanxi fault, and the Yangtze River meet, might be at risk of having reservoir-induced tectonic earthquakes.
Author Contributions
Conceptualization, methodology, coding, validation, writing, Q.M. and X.D.; formal analysis, Q.M. and L.Z.; conceptualization, methodology, review, Y.Y. and W.L. All authors have read and agreed to the published version of the manuscript.
Funding
This study was funded by the project of China Three Gorges Corporation (0799217) and the National Natural Science Foundation of China (Grant No. 42174177).
Institutional Review Board Statement
Not applicable.
Acknowledgments
Thanks to the Earthquake Monitoring and Forecast Center of the Hubei Earthquake Administration and the Reservoir Induced Earthquake Research Office of the Earthquake Research Institute of China Earthquake Administration for providing gravity flows and seismic observation data for this study. The author also wants to give heartfelt thanks to the anonymous Reviewers, who provided valuable comments on this article.
Conflicts of Interest
The authors declare no conflict of interest. The funders had no role in the design of the study; in the collection, analyses, or interpretation of the data; in the writing of the manuscript; nor in the decision to publish the results.
Appendix A. An Example of Gridding the Gravity Observation Data
The following uses the Kriging interpolation algorithm [31,32] of the dynamic changes of the gravity field from October 2002 to October 2003, around the 135 m water level stage, as an example to explain the gridding of gravity data in more detail.
Appendix A.1. An Overview of Kriging Interpolation
Kriging interpolation is an interpolation method based on the variation function and its model. Besides considering the correlation between the position of the interpolation points and the position of the known data points, it also reflects the spatial correlation of the variables. To calculate, we must first know the total number of data sample points , the spatial distance from all surrounding sample points to the point to be interpolated, the lag distance, and the spatial attribute of each sample point. Suppose some observation points are on the space area. is the corresponding observation value, then the observation value of the local variable at the unknown point to be interpolated is obtained by Equation (A1).
Among them, is the Kriging weights coefficient.
Conditional unbiasedness, minimum estimated variance, and the Lagrange multiplier are used to obtain the Kriging equations composed of variation function. The variation function is defined as Equation (A2), denoted as
Among them, and are the true values of the local variable at the distances and . To obtain the variation function at any distance and facilitate subsequent data interpolation or prediction, it is necessary to perform fitting of .
Appendix A.2. Gridding of Gravity Observation Data before and after 135 m Water Impounding Stage
Figure A1a shows the distribution of gravity stations from October 2002 to October 2003. We chose riverside Area A and mountain Area B near the Three Gorges Dam for credibility testing. Figure A1b,c show the distribution of stations and their observed values after removing the stations in Areas A and B, respectively. The observation values are represented by different colors.

Figure A1.
The difference results of the gravity observations from October 2002 to October 2003. (a) All stations, (b) remove the riverside Area A, and (c) remove the mountain Area B.
In the Matlab environment, we used the observation data of Figure A1 and the DACE toolbox to perform Kriging interpolation, and the result is shown in Figure A2. Obviously, there is no noticeable change in the overall gravity field after removing the interpolation results of the stations in Area A and when all stations are used, suggesting that the overall error of the Kriging interpolation results in the area along the river being relatively small. After the stations in Area B were removed, the contours in the northern part of the study area changed significantly, although the overall shape was still maintained. It also shows that the interpolation accuracy of the mountain Area B might be low, and the interpolation results depend on the distribution of stations to a relatively large extent.
We then used the station observation values in Figure A1 to compare with the Kriging interpolation results after subtracting Areas A and B, as shown in Figure A3a. It can be seen that the observation value at the five stations in Area A was relatively consistent with the Kriging interpolation result . In comparison, the consistency at the six stations in Area B was relatively poor. Then, the percentage of relative error between the Kriging interpolation results and the observed value was calculated, which is , as shown in Figure A3b. According to the overall performance of the Kriging, Radial Basis Function (RBF), and Triangulation with Linear Interpolation (TLI) interpolation method (Table 1), we eventually chose the Kriging interpolation to complete the gridding of all eight phases of gravity data because it is the most accurate, as shown in the Figure 6.

Figure A2.
Kriging interpolation of the dynamic changes of the gravity field from October 2002 to October 2003. (a) All the stations, (b) after removing the stations in Area A, and (c) after removing the stations in Area B.
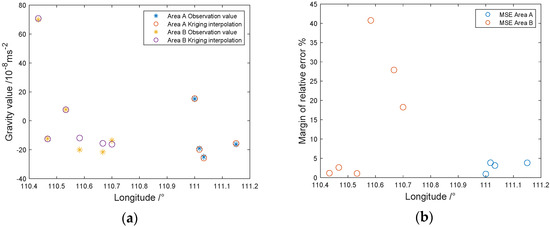
Figure A3.
Error analysis of Areas A and B: (a) observed value and Kriging interpolation result and (b) distribution of relative error.
Appendix B. Three-Dimensional Finite-Difference Model Based on Fluid–Solid Coupling Theory
Appendix B.1. Model Building
The Three Gorges Reservoir is a type of mountain and valley reservoir. Using the critical monitoring areas of the Three Gorges Project (110.2~111.1° E 30.6~31.2° N) as the study object and employing the 1:50,000 digital topographic map and regional geophysical exploration data, a three-dimensional finite-difference model based on the theory of fluid–solid coupling [28,29] was constructed under the environment of Ansys/Multiphysics and Flac3d 6.0, as shown in Figure A4.
Due to the weak pre-processing function of Flac3d 6.0, the undulating topographic surface of the model built in ANSYS was used, as shown in Figure A4a. A certain necessary simplification to the complex faults system in the study area was made (Figure 1), and eight faults zones and block geometric models were obtained, as shown in Figure A4b. The model’s thickness was taken from the water level before the water impounding to 12 km deep in the crust. The model was divided into six stratums, and the Mohr–Coulomb constitutive model was adopted. According to the lithology data in the Zigui area, Table A1 gives the stratigraphic division and physical and mechanical parameters [30].
We used hexahedral elements to mesh the geometric model in ANSYS and then import Flac3d for fluid–solid coupling calculations. The mesh division of the finite-difference model in the study area is shown in Figure A4c, and the total number of elements is about 500,000.

Figure A4.
The finite-difference model of the head area of the Three Gorges Reservoir: (a) free surface, (b) geometry model of fault zone and block, and (c) mesh division.

Table A1.
Underground stratification and lithology related parameters, Adapted with permission from Ref. [30]. 2020, Journal of Geodesy and Geodynamics.
Table A1.
Underground stratification and lithology related parameters, Adapted with permission from Ref. [30]. 2020, Journal of Geodesy and Geodynamics.
| Number | Lithology | Thickness | |||||||
| 1 | Gravel, hard clay | 1500 | 32.00 | 110.00 | 1600 | ||||
| 2 | Sandstone, mudstone | 1500 | 26.80 | 7.00 | 27.80 | 27.20 | 223.00 | 2630 | |
| 3 | Siltstone, shale | 1000 | 15.60 | 10.80 | 32.10 | 34.70 | 197.00 | 2570 | |
| 4 | Limestone | 1000 | 22.60 | 11.10 | 32.00 | 42.00 | 134.00 | 2680 | |
| 5 | shale bookstone | 2000 | 8.80 | 4.30 | 27.80 | 14.40 | 202.00 | 2660 | |
| 6 | Limestone | 5000 | 43.90 | 30.20 | 32.10 | 51.00 | 10.34 | 2690 |
Appendix B.2. Calculation Steps and Boundary Condition Settings
We divided the fluid–solid coupling calculation into two steps: (1) constraining the vertical displacement of the sides and the bottom surface; applying gravity to calculate the ground stress field; (2) on the basis of Step 1, the pore water pressure of the upper surface was set to 0 (permeable boundary), and the four sides and the bottom of the model were set as impervious boundaries. We set the initial saturation to 0 and applied water loads and corresponding pore water pressures at the 135 m, 156 m, and 175 m water levels, respectively, to the surface of the area where the Yangtze River is located on the surface of the model. At the same time, we turned on the Flac3d mechanics and fluid processes to perform fluid–solid coupling calculations until convergence.
Appendix B.3. Post-Processing
Since our 3D finite-difference model takes into account the topography of the Three Gorges Reservoir area, we evenly extracted the maximum shear–strain calculation results at 500 m deep underground to analyze the crustal stress–strain field, as shown in Figure 9. Figure 9a shows the calculation results under self-weight conditions, which represent the crustal stress–strain state before the water impounding. However, Figure 9b–d show the calculation results under three water impounding stages, which were used to discuss the influence of the direct reservoir water load.
Compared with before the water impounding, the study area will produce a relatively larger pore water pressure field after the water impounding. For the fluid–solid coupling problem, the distribution of the pore water pressure field can directly reflect the reservoir water infiltration. Therefore, we chose the A-A′ section, a triangular structure near the intersection of the Xiannvshan faults, the Jiuwanxi faults, and the Yangtze River, to extract the numerical calculation results of the pore water pressure field at the section location and performed post-processing on it. In addition, since the model before water impoundment only considers its weight, it is meaningless to post-process the results of pore water pressure before the water impounding. Figure 11 shows the pore water pressure distribution at the A-A′ section at the 135 m, 156 m, and 175 m water levels.
References
- Carder, D.S.; Isaacks, W.H.; Greenwood, W.P. Influence of reservoir loading on local earthquake activity. Geol. Soc. Am. Bull. 1947, 58, 1264. [Google Scholar]
- Gupta, H.K. A review of recent studies of triggered earthquakes by artificial water reservoirs with special emphasis on earthquakes in Koyna, India. Earth-Sci. Rev. 2002, 58, 279–310. [Google Scholar] [CrossRef]
- Drakatos, G.; Papanastassiou, D.; Papadopoulos, G.; Skafida, H.; Stavrakakis, G. Relationship between the 13 May 1995 Kozani-Grevena (NW Greece) earthquake and the Polyphyto artificial lake. Eng. Geol. 1998, 51, 65–74. [Google Scholar] [CrossRef]
- Jimenez, A.; Tiampo, K.F.; Posadas, A.M.; Luzon, F.; Donner, R. Analysis of complex networks associated to seismic clusters near the Itoiz reservoir dam. Eur. Phys. J.-Spec. Top. 2009, 174, 181–195. [Google Scholar] [CrossRef]
- Al-Saigh, N.H. The Mechanism of Induced Seismicity at Mosul Reservoir Based on the First Motion Analysis. J. Geol. Soc. India 2010, 76, 399–402. [Google Scholar] [CrossRef]
- Cheng, H.; Zhang, H.; Shi, Y. High-resolution numerical analysis of the triggering mechanism of M(l)5.7 Aswan reservoir earthquake through fully coupled poroelastic finite element modeling. Pure Appl. Geophys. 2016, 173, 1593–1605. [Google Scholar] [CrossRef]
- Grasso, J.R.; Karimov, A.; Amorese, D.; Sue, C.; Voisin, C. Patterns of reservoir-triggered seismicity in a low-seismicity region of France. Bull. Seismol. Soc. Am. 2018, 108, 2967–2982. [Google Scholar] [CrossRef]
- Xuan, N.B.; Trong, D.C.; Long, Q.N.; Bach, X.M.; Le, H.T.; Hien, P.L.; Goyal, R.; Than, A.T.; Hung, N.P. Assessment on maximum magnitude of natural and triggered earthquake when water is impounded in the mining pit: A case study in Nui Nho quarry, Vietnam based on gravity and magnetic data. Russ. J. Earth Sci. 2020, 20, 1. [Google Scholar]
- Zhang, H.; Cheng, H.; Pang, Y.; Shi, Y.; Yuen, D.A. Influence of the impoundment of the Three Gorges Reservoir on the micro-seismicity and the 2013 M5.1 Badong earthquake (Yangtze, China). Phys. Earth Planet. Inter. 2016, 261, 98–106. [Google Scholar] [CrossRef] [Green Version]
- Yao, Y.S.; Wang, Q.L.; Liao, W.L.; Zhang, L.F.; Chen, J.H.; Li, J.G.; Yuan, L.; Zhao, Y.-N. Influences of the Three Gorges Project on seismic activities in the reservoir area. Sci. Bull. 2017, 62, 1089–1098. [Google Scholar] [CrossRef] [Green Version]
- Jiang, H.K.; Song, J.; Wu, Q.; Li, J.; Qu, J.H. Quantitative investigation of fluid triggering on seismicity in the Three Gorge Reservoir area based on ETAS model. Chin. J. Geophys.-Chin. Ed. 2012, 55, 2341–2352. [Google Scholar]
- Jiang, F. Role of Gravimetry in Monitoring the Crustal Deformation of Three Gorges Reservoir Area. Geomat. Inf. Sci. Wuhan Univ. 2003, 28, 679–682. [Google Scholar]
- Xing, C.; Gong, K.; Du, R. Crustal deformation monitoring network for three gorges project on yangtze river. J. Geod. Geodyn. 2003, 23, 114–118. [Google Scholar]
- Tu, P.; Cen, Z.; Chen, H. Monitoring landslides deformation in three gorges reservoir area by using the repeat-pass spaceborne InSAR. Remote Sens. Technol. Appl. 2010, 25, 886–890. [Google Scholar]
- Zhang, S.; Chen, Z.; Wang, Q.; Liu, J.; Zhang, P. The anomaly feature extraction of mobile gravity in the sichuan-yunnan region using wavelet transform methodthe case study of the ludian m_s6.5 and jinggu m_s6.6 earthquakes in 2014. J. Geod. Geodyn. 2020, 40, 87–93. [Google Scholar]
- Zhu, Y.; Liu, F.; Zhang, G.; Xu, Y. Development and prospect of mobile gravity monitoring and earthquake forecasting in recent ten years in China. Geod. Geodyn. 2019, 10, 485–491. [Google Scholar] [CrossRef]
- Sun, S.; Xiang, A.; Zhu, P.; Shen, C. Gravity change and its mechanism after the first water impoundment in three gorges project. Acta Seismol. Sin. 2006, 28, 485–492. [Google Scholar] [CrossRef]
- Yang, Y.; Gao, Y.; Wang, W.; Kang, S.; Yang, G. Analysis of the influence of water impoundment and drainage in the Three Gorges Reservoir on the ground gravity change. Sci. Surv. Mapp. 2018, 43, 66–70. [Google Scholar]
- Yang, G.; Shen, C.; Wang, X.; Sun, S.; Liu, D.; Li, H. Numerical simulation of gravity effect of water-impoundment in three gorges reservoir. J. Geod. Geodyn. 2005, 25, 19–23. [Google Scholar]
- Li, X.; Yao, Y.; Zeng, Z.; Liu, L. Analysis of the formation system of the present tectonic stress field in the head area of the three gorges reservoir. J. Geomech. 2006, 12, 174–181. [Google Scholar]
- Liu, J.Z.; Wang, T.Q.; Chen, Z.H.; Zhang, P.; Zhu, C.D.; Zhang, S.X. Analyzing gravity anomaly variations before the 2016 Ms 6.4 earthquake in Menyuan, Qinghai with an interpolation/cutting potential field separation technique. Appl. Geophys. 2018, 15, 137–146. [Google Scholar] [CrossRef]
- Wiemer, S.; Wyss, M. Minimum magnitude of completeness in earthquake catalogs: Examples from Alaska, the western United States, and Japan. Bull. Seismol. Soc. Am. 2000, 90, 859–869. [Google Scholar] [CrossRef]
- Telesca, L. Analysis of the cross-correlation between seismicity and water level in the koyna area of india. Bull. Seismol. Soc. Am. 2010, 100, 2317–2321. [Google Scholar] [CrossRef]
- Schultz, R.; Telesca, L. The cross-correlation and reshuffling tests in discerning induced seismicity. Pure Appl. Geophys. 2018, 175, 3395–3401. [Google Scholar] [CrossRef]
- Little, M.A.; McSharry, P.E.; Moroz, I.M.; Roberts, S.J. Testing the assumptions of linear prediction analysis in normal vowels. J. Acoust. Soc. Am. 2006, 119, 549–558. [Google Scholar] [CrossRef] [Green Version]
- Zhang, L.; Yao, Y.; Shen, X.; Wei, G.; Chen, J. Study on type and focal mechanism of the earthquakes in three gorges reservoir. J. Geod. Geodyn. 2014, 34, 77–82. [Google Scholar]
- Telesca, L.; ElBary, R.E.F.; Mohamed, A.E.-E.A.; ElGabry, M. Analysis of the cross-correlation between seismicity and water level in the Aswan area (Egypt) from 1982 to 2010. Nat. Hazards Earth Syst. Sci. 2012, 12, 2203–2207. [Google Scholar] [CrossRef] [Green Version]
- Dvorkin, J.; Nur, A. Dynamic poroelasticity—A unified model with the squirt and the biot mechanisms. Geophysics 1993, 58, 524–533. [Google Scholar] [CrossRef]
- Xie, X.D. Study on Mechanism of Reservoir-Induced Seismicity Based on Theory of Fluid-Solid Coupling in the Danjiangkou Reservoir Area. Ph.D. Thesis, Wuhan University, Wuhan, China, April 2010. [Google Scholar]
- Yu, J.; Wang, Q.; Zhao, Y. Stress field of the three gorges based on fluid-solid coupling simulation. J. Geod. Geodyn. 2020, 40, 928–930, 941. [Google Scholar]
- Hundelshaussen, R.; Costa, J.F.C.L.; Marques, D.M.; Bassani, M.A.A. Localised kriging parameter optimisation based on absolute error minimisation. Appl. Earth Sci.-Trans. Inst. Min. Metall. 2018, 127, 153–162. [Google Scholar] [CrossRef]
- Ryu, J.S.; Kim, M.S.; Cha, K.J.; Lee, T.H.; Choi, D.H. Kriging interpolation methods in geostatistics and DACE model. KSME Int. J. 2002, 16, 619–632. [Google Scholar] [CrossRef]
Publisher’s Note: MDPI stays neutral with regard to jurisdictional claims in published maps and institutional affiliations. |
© 2022 by the authors. Licensee MDPI, Basel, Switzerland. This article is an open access article distributed under the terms and conditions of the Creative Commons Attribution (CC BY) license (https://creativecommons.org/licenses/by/4.0/).