1. Introduction
Liquefied petroleum gas (LPG) is mainly composed of propane and butane gases, which are produced generally from the wet natural gas purification (55%) and the refining process of crude oil (45%). While LPG is used extensively for heating and cooking, its reforming is required for vehicle applications by a low energy output. A solution is to reform LPG towards hydrogen generation as a clean fuel and different methods such as steam and oxidative reforming techniques are used [
1].
Malaibari [
2] studied the hydrogen production from the LPG through oxidative steam reforming with bimetallic catalysts. Moreover, in the performed experiments by Khandan et al. [
3], the LPG steam conversion reactions on the nickel catalysts supported by four different zeolites (H-Y, Na-Y, HZSM5, and ferrierite) were examined. The type of support and the specific surface area significantly affected the catalyst activity and selectivity; however, the Ni/Na-Y catalyst exhibited the highest surface area (696.4 m
2/g) and a low degree of coke formation. Hence, the stability of the LPG steam reforming process was increased. Thus, the highest LPG conversion of about 95.7% and H
2 yield of 48.6% was observed for the Ni/Na-Y catalyst.
Using a thermodynamic analysis, Silva et al. [
4] investigated the operational conditions of molecular hydrogen production through the LPG steam and oxidative conversion process. The performance of LaNiO
3 as a catalyst precursor was analyzed based on the thermodynamic equilibrium predictions. The H
2 formation increased at high temperatures and water concentrations, while the coke production decreased gradually.
Wang et al. [
5] performed a parametric study on the auto-thermal LPG reforming. The effects of temperature and the ratios of steam and O
2 to carbon (S/C and O
2/C) along with the performance indicators of the LPG conversion extent, catalyst coking, and sulfur poisoning were studied. In addition, Zhixiang et al. [
6] used the auto-thermal reforming for propane conversion where the water–gas shift and preferential oxidation occur when water is added to the system. Hence, the temperature in the hot and cold streams can be controlled in a balanced condition.
So far, the electrical plasma discharges have recently been used for the conversion of gases such as methane, ethane, acetylene, and other hydrocarbons to hydrogen and syngas [
7,
8]. Aleknaviciute et al. [
9] converted propane gas to hydrogen with a low CO
x production using an atmospheric pressure cold plasma system. They used argon to increase the ionization rate in the plasma discharge medium of the system. The discharge input power joined with the residence time of propane gas in the discharge medium of the system had a significant effect on the propane conversion. Hence, the hydrogen selectivity and efficiency of energy conversion were increased. In a theoretical work by Khadir et al. [
10], a plasma discharge system which was based on dielectric barrier discharge (DBD) at the gas pressure of 600 torr was used for conversion of the pure methane gas. The applied voltage was assumed to be sinusoidal and the temporal variations of the discharge parameters were examined. While their numerical findings were compared with experimental works, it was found that the dielectric capacitance plays a critical role in the methane conversion and H
2/CH
4 ratio.
Lindner et al. [
11] implemented a micro-plasma for conversion of the liquid fuel methanol and five different experiments showed that the conversion within the microchannel reached about 100%. The results of the experiments on the variations of the input electrical power, flow rate, and concentration were validated by a numerical model. Meanwhile, the continuous production of hydrogen gas along with carbon black from CH
4 using a specific reactor based on the direct current (DC)-spark discharge plasma at atmospheric pressure was experimentally examined by Moshrefi et al. [
12]. Their experimental findings showed that, while the density of different formed species in the plasma discharge medium of the reactor increased, a stable performance of the reactor for long time applications was guaranteed. Moreover, at higher methane supply rates, while the density of hydrogen molecules was decreased, the flow rate of formed hydrogen was higher.
On the other hand, there is lack in the investigations of the conversion of LPG to hydrogen using the electric discharge technique in the literatures. The electric discharge technique is expected to be an efficient technique for conversion of LPG to other alternative fuel gases such as hydrogen and study of the electric and spectroscopic characteristics of the electric discharge in LPG is one of the important keys to understanding the conversion mechanisms and achieve efficient reforming of LPG.
Elradi et al. [
13] investigated the electric discharge in LPG using DC high voltage (0.4–3 kV) at gas pressure in the range of 1 to 25 torr and the electric and spectroscopic characteristics of the discharge were studied at different discharge conditions. Deviations from Paschen’s law were observed as a result of the change of the distance between the two electrodes. Two discharge modes, namely, glow and spark discharges, were observed in the discharge current waveforms. The discharge current waveforms indicated a repetitive pulsed behavior with frequencies of 5 kHz to 5 MHz depending upon the applied voltage and the gas pressure. The emitted spectra from the discharge were also studied near both the cathode and anode using different electrode materials. The H
α line and C
2 Swan band system were observed, which confirmed the conversion of LPG to hydrogen and carbon clusters.
In 2018, Moshrefi et al. [
14] introduced a DC reactor with rotating electrode for hydrogen production from methane decomposition and the effect of the electrode rotational frequency over the methane decomposition was studied. One of the main conclusions was that the methane conversion and energy efficiency with the rotating electrodes was improved in comparison to the fixed electrode, because the produced plasma was stabilized in this configuration.
In this work, a new rotating electrode plasma reactor is introduced for hydrogen production from LPG gases. The developed plasma reactor works at atmospheric pressure, room temperature, and a relatively low operating power. Hence, it has a stable performance without electrical shocks. Electrical characterization of the plasma produced in this reactor is performed to determine the plasma mode. Then, the hydrogen production, conversions of the C4H10 and C3H8 gases and the energy efficiency of the conversion in the developed reactor are studied by GC. Moreover, preliminary characterization of this plasma is made using the OES technique and the main objective is to study the applicability of this reactor in hydrogen production with low COx formation, by analyzing the emission spectrum and species formed inside the plasma. The dependence of the spectrum on the applied high voltage, electrode rotation frequency, and flow rate is also studied. The main plasma parameters of discharge produced in this reactor, such as the gas temperature, the electron density and temperature are determined as these parameters have an important influence on the capacity of plasma for the dissociation of the C4H10 and C3H8 molecules of the mixture.
2. Materials and Methods
A schematic diagram of the different parts of the innovated plasma reactor is shown in
Figure S1 of the Supplementary Materials. The discharge medium consists of a cylindrical glass tube with an 80 mm diameter and 110 mm length. A disk electrode with a 50 mm diameter and a 2 mm thickness was been placed on the axe of a glass tube as an anode which was connected to the high voltage. This anode could be rotated by an electric motor that allows for varying its frequency between 9000 and 18,000 revolutions per minute (rpm). Moreover, a cylindrical electrode clinging to the inner wall of the glass tube was connected to the ground. The electrodes were made of copper, and the gap distance between the two electrodes was fixed at 10 mm. The cylindrical electrode was covered by a dielectric polyamide layer. Therefore, a dielectric barrier discharge (DBD) could be produced between the electrodes when a high voltage was applied.
The LPG had been left to flow through the discharge medium at the flow rate range of 1–5 standard liters per minute (sLm). This LPG gas exited through the bottom part of the reactor, which was open to the air with a conical shaped piece designed to reduce the air entrance (see
Figure 1). Therefore, the reactor was considered to be working at atmospheric pressure.
The used samples of LPG consisted of about 65% butane (C4H10) and 35% propane (C3H8). Some traces of plasma and other hydrocarbons such as ethane, ethylene, propylene, butylene, etc., were also expected. An AC power supply of 50 Hz manufactured by our laboratory was used as the high voltage source (0–22 kV).
Generally, owing to their special geometrical constructions and non-uniformity of the electric field, the ionization rate in this plasma discharge media was significantly high. The values of the ionization degree, namely, the ratio of the electron density to the density of neutral particles (α = ne/na), was between 10−5 and 10−4, and that is high for this type of plasma. Moreover, due to the rotation of the power electrode, fewer electrical shocks were created in the discharge medium of the plasma reactor. Additionally, this plasma reactor could dissociate heavy hydrocarbon molecules at atmospheric pressure and room temperature as a hydrocracker.
Figure 1 shows the experimental set-up used to perform the experiments. A spectrometer (HR4000 Ocean Optics) was used for the spectroscopic measurements. This spectrometer had a focal distance of 101.6 mm, a grating of 2400 grooves/mm, and a linear silicon CCD array of 3648 pixels. The slit width of the spectrometer was adjusted to be 5 microns. The UV-optical emission light was probed at 5mm away from the plasma zone by putting an optical fiber on the quartz tube. The full spectrum in the wavelength range of 200–1100 nm at every millisecond was recorded. It must be noted that, to calibrate these spectrometers, a light source which can produce emission lines in the spectral range must be provided. An HG-1 Mercury–Argon lamp was used for this purpose. To tightly focus on the plasma zone for better collecting the emitted light of the plasma, a confocal quartz lens was used in the experimental setup to obtain the optical spectra with a high signal-to-noise ratio. Indeed, an optical fiber probe was placed on the focal point of the lens.
For electric characterization, the discharge current was measured with an AC/DC current probe (Tektronix, Beaverton, OR, USA, TCP202) which was connected to an oscilloscope (Tektronix, Beaverton, OR, USA, HM1508).
GC was used to study the H2 formation from the LPG remediation. The exhaust gases were analyzed using a compact-gas chromatograph (CGC) type GC, Agilent 6890 N (Agilent, Santa Clara, CA 95051, USA), equipped with Hayesep Q and N and molecular sieve 139 (MS-139) packed columns, a thermal conductivity detector (TCD) (Agilent, Santa Clara, CA 95051, USA) for the H2 analysis and a flame ionization detector (FID) (Agilent, Santa Clara, CA 95051, USA) for the hydrocarbon analysis.
3. Results and Discussion
3.1. Electrical Characterization
The plasma discharge was initiated inside the plasma reactor by applying an AC high voltage between 10 and 15 kV on the electrodes. The voltage waveform measured in the plasma discharge at the applied voltage of 14 kV is shown in
Figure S2 of the Supplementary Materials.
The variations of the current waveforms of the plasma discharge as a function of voltage, the rotation frequency of the power electrode, and the gas flow rate are presented in
Figure 2. The charge current was due mainly to the formation of instantaneous current shocks between the electrodes for high voltage conditions. These filamentary shocks produced instabilities in the discharge and fluctuation of the current shape. When the applied voltage was increased, the number of shocks increased also, and the discharge current was higher (
Figure 2a). As shown in
Figure 2b, the detected current also had a high dependence on the frequency of the power electrode. The increment in this frequency resulted in the discharge current rising. The behavior with the gas flow was the opposite case. A higher gas flow rate produced a reduction in the current, due to the reduction in the current shocks by the increment in the flow rate.
Figure 3 shows the formation of the filamentary current shocks in the reactor for the stationary power electrode and different rotation frequencies of this electrode. When the rotation frequency increased, the number of shocks was incremented, and the discharge filled the reactor. This fact explains the growth that was observed in the current waveform.
The average of the consumed power was obtained from the integration of instants power over a period according to the following equation [
15]:
Table 1 shows the value of the averaged consumed power,
P, together with the current in the peak,
Ip, for the different studied conditions. The maximum variation of the consumed power was with the applied voltage, where
P grew clearly when the applied voltage was increased. As shown, a slighter dependence had the power on the motor revolution frequency. This power decreased for the higher rpm. Finally, the consumed power decreased in the highest flow rate, where the current shocks reduced.
When the power electrode started to rotate, the filaments were increased in the plasma discharge and consequently the electrical current was slightly raised. Because of this increase in the electrical current, the consumed power was also changed from 360 W to 375 W. Moreover, the neutral particles passed faster from the electric field zone with the increase in the gas flow rate in the plasma medium. The ionization and thus the production of charged particles in the plasma medium, which affected the electrical current, was decreased. When the current was dropped, the consumed power was also decreased.
3.2. GC of the Exhaust Gas
The results of the GC showed that hydrogen and carbon molecules, between the other species, were detected in the exhaust gas. These molecules were produced by the decomposition of the C
4H
10/C
3H
8 species in the plasma discharge. The conversion factors of these species were obtained using the following equations:
where the moles of the converted hydrocarbons are calculated by the difference between the inlet and outlet concentrations obtained by the GC.
The dependence of the conversions on the applied voltage, the electrode rotation frequency, and the gas flow rate are shown in
Figure 4. The behaviors were similar to the peak intensity and the consumed power (see
Table 1). The C
4H
10/C
3H
8 conversion grew with the applied voltage and the rotational frequency and decreased with the flow rate. This could mean that the decomposition of LPG species is also related to the number of current shocks formed in the reactor.
The energy efficiency (
η) of the LPG conversion in the developed reactor gives us an idea of the energy required for this conversion in the studied conditions. It is calculated from the number of moles of butane and propane converted by second, which can be obtained from the values of the conversion factors and the gas flow rate, divided by the consumed input power:
Figure 5 shows the variations of the energy efficiency as a function of applied voltage, rotational frequency of the power electrode, and the gas flow rate. As can be seen, the energy efficiency of the reactor decreased by increasing the applied voltage while it grew at a higher rotation frequency of the power electrode and the gas flow rate.
As mentioned, when the voltage grows, the number of filamentary shocks does also, and the consumed power and the LPG conversion increase consequently, but this study shows that the energy efficiency decreases for high applied voltage. This means that additional energy is not efficiently used for LPG decomposition. There are different processes that cause the energy lost in the plasma discharge, especially the joule heating and electron-heavy particle impacts, which result in all electron collisions not being effective for LPG conversion in the plasma. Thus, the exchange of kinetic energy between the electrons and the heavy particles largely determines the efficiency of the conversion.
The highest growth of the energy efficiency is produced when the gas flow varies. The energy efficiency of the designed reactor increased from 1.1 to 6.7 mmol/kJ when the gas flow varied from 1 to 5 sLm at the applied voltage of 14 kV and a power electrode rotation frequency of 18,000 rpm. Although the LPG conversion decreased with the flow due to the formation of less shocks in the plasma, higher inlet flows produced a greater amount of LPG treated by the time unit.
For a fixed applied voltage and LPG gas flow,
Figure 5b shows the dependence of energy efficiency on the frequency of the rotating power electrode. As shown, the rotation electrode produced a more energy efficient conversion of LPG. It is possible to treat a larger amount of LPG gas with less energy consumption and the highest number of filaments produced in the reactor when the electrode started to rotate (see
Figure 3), produced a better LPG conversion with a small variation of the consumed power.
The energy efficiency at the static configuration had a maximum value of 1.65 mmol/kJ in this work which was more than the 1.21 mmol/kJ in ref. [
14]. Moreover, the maximum value of the energy efficiency was 6.7 mmol/kJ in the applied voltage of 14 kV, rotational frequency of 18,000 rpm, and gas flow rate of 5 sLm, which is higher than the efficiency peak of 1.46 mmol/kJ in the ref. [
14].
In hydrogen production applications, it is very relevant to know the ability of the reactor to produce hydrogen and its subproduct carbon molecule when the C
4H
10/C
3H
8 species are decomposed. The selectivities of H
2 and C
2 species are defined with this purpose:
The selectivities depend on the reactions responsible for the hydrogen and carbon production from the dissociation of the C
4H
10/C
3H
8 molecules and their derivatives. A detailed study of the possible reactions that occur inside the filamentary is presented in
Section 3.1.
Figure 6 plots the dependence of the H
2 selectivity on the applied voltage, the electrode rotation frequency, and the gas flow rate.
Figure 6a shows that selectivity grows with the applied voltage for the stationary power electrode, and that means that the increase of the C
4H
10/C
3H
8 conversion is accompanied by a more effective H
2 formation when the voltage grows. The selectivity raises also with the electrode rotation frequency in the range from 9000 to 18,000 rpm (
Figure 6b), being the maximum value of this factor equal to 98% for 18,000 rpm. It is shown that, in the designed reactor, the rotation of the power electrode allows for improving the H
2 formation with a low power consumption. Conversely to the other parameters, when the gas flow rate increases in the range from 1 to 5 sLm, the hydrogen selectivity decreases from 98 to 84% (
Figure 6c), and that means that the hydrogen released when the C
4H
10/C
3H
8 molecules are decomposed by forming other species are different to H
2 molecules. Therefore, despite the improvement of energy efficiency with the gas flow, the conversion factors and efficiency of the H
2 formation decrease.
Figure 6 also shows the variations of C
2 selectivity as a function of voltage applied on the electrode, rotation frequency of the power electrode, and the gas flow rate. The dependences on electric voltages and gas flow were similar to the hydrogen case, but a different dependence was found when the electrode rotation frequency varied. In the case of C
2, its selectivity in the exhaust gas dropped when the rotation frequency was raised. An explanation of this behavior could be that the carbon produced in the LPG decomposition deposited on the reactor wall in a cluster or recombined with the other molecules.
The soot deposited on the walls was weighed, in order to determine the dependence on the working conditions, but it was found that part of the carbon cluster was lost due to the dragging by the exhaust gas to the bottom hole. The results of this measure are presented in the
Figure S4 of the Supplementary Materials, but the dependences on rotational frequency and flow rate are not representative because the dragging effect was higher.
Other important parameters to know the applicability of this technology are the production rates of H
2 and C
2 in the exhaust gas.
Figure S5 of the Supplementary Materials shows the estimated vales of these production rates for the different working conditions. The maximum H
2 production for the conditions of 1 sLm and 14 kV corresponded to 2.3 mmol/s (4.6 mg/s) when the rotational frequency was 18,000 rpm and, when the flow was varied, a higher value of 7.1 mmol/s (14.2 mg/s) could be reached. The technical procedure to separate this hydrogen from the C
2 and other elements is important for its applicability and will be the aims of further studies.
3.3. Spectroscopic Characterization
In the last section, the ability of the new reactor to LPG gas remediation and its transformation in H
2 and C
2 molecules was studied using gas chromatography. The LPG conversion seemed to be correlated with the number of filamentary shocks that were produced in the reactor, because the obtained conversion factors had similar behaviors that detected the current intensities and consumed power. This is logical because the LPG decomposition was occurring mainly in the contact of these micro-discharges with the gas, but other factors were affecting the H
2 formation and the dependence of this formation on the working conditions. As mentioned, the efficiency of the H
2 and subproduct C
2 formation depend on the reactions that produce these species inside the filament. If the electron density is enough high, the electron collisions are the main reactions responsible for C
4H
10/C
3H
8 dissociation. The temperature and density of electrons largely determine the kinetic in the plasma. In this section, a spectroscopic study of the plasma in the developed reactor was performed. This study picked the radiation emitted by the plasma and allowed us to obtain information about the species formed in the discharge. Additionally, the spectroscopic analysis of the detected lines gave information about the values of temperature and density of the electron and heavy particles. The spectroscopic setup recorded radiation from the brightest area of the plasma, which were the formed filament in the reactor. In fact, these spectroscopic measures are not representative of the local values in a filament, rather, they could be considered as apparent measures and averaged results about different filaments are given. For the integration time used in the spectroscopy setup, 500 ms, and considering the representative time of the micro-discharges to about 0.05 ms (See
Figure 2), the typical number of filaments detected in one measure was about 5000. But these measures permitted us to know the general behavior of the produced filamentary discharges and the relation between the plasma parameters and the H
2 production.
3.3.1. Detected Species in Plasma
In the plasma, the electron and heavy particles collision processes excite several plasma species to the upper states decaying and emitting photons with different wavelengths. Through recording of the emission spectra of the plasma discharge medium, these photons can be detected and analyzed. In this work, the OES technique was used to identify the different produced reactive species in the C4H10/C3H8 gas in the developed plasma reactor.
Figure 7 shows the recorded emission spectra for the spectral wavelength range of 200–1000 nm for the plasma reactor at atmospheric pressure with the C
4H
10/C
3H
8 gas mixture, a 14 kV AC applied voltage, a motor rotation frequency (power electrode) of 18,000 rpm, and a gas flow of 1 sLm. The identified lines have been highlighted in this figure and presented in
Table 2 together their main data.
The most recognized spectra in these figures are H
2, C
2, and CH bands that are directly produced by the dissociation of the propane and butane molecules by the following reactions [
13,
18,
19]:
The Balmer lines of hydrogen were also detected. It is obvious that the amount of H
2 produced in all the above reactions was higher than in the carbon one. The theoretical ratio between the H
2 and C
2 production was 9/3.5. by the stoichiometric relationship. For each C
3H
8 and C
4H
10 mol converted, 9 moles of H
2 and 3.5 moles of C
2 were formed. The hydrogen atoms play an important role in increasing the ionization processes, hence the ignition to an active filamentary mode. An increase in the concentration of H and subsequently H* atoms led to an increase in the secondary ionization processes [
13,
18]:
In this secondary ionization process, the hydrogen metastable state H*, which has a relatively long lifetime up to 12 s, had an important contribution [
2]. A scheme of the main mechanisms that produce the dissociation of C
4H
10/C
3H
8 molecules in a kinetic dominated by the electron collisions is presented in
Figure 8.
The detection of N
2, NH, CO
2, CO, and CN bands confirmed the existence of nitrogen and oxygen in the discharge tube. The reactions of the oxygen, hydrogen, and nitrogen of air with the carbon produced in the LPG dissociation explain the detected species [
16,
19]. These species could have been coming from the air entrance by the bottom part, impurities of the LPG gas and sputtering of the dielectric polyamide layer. The gas chromatography analysis of the exhaust gas showed that the concentration of these species was lower than 3% and did not have a big influence on the plasma kinetic.
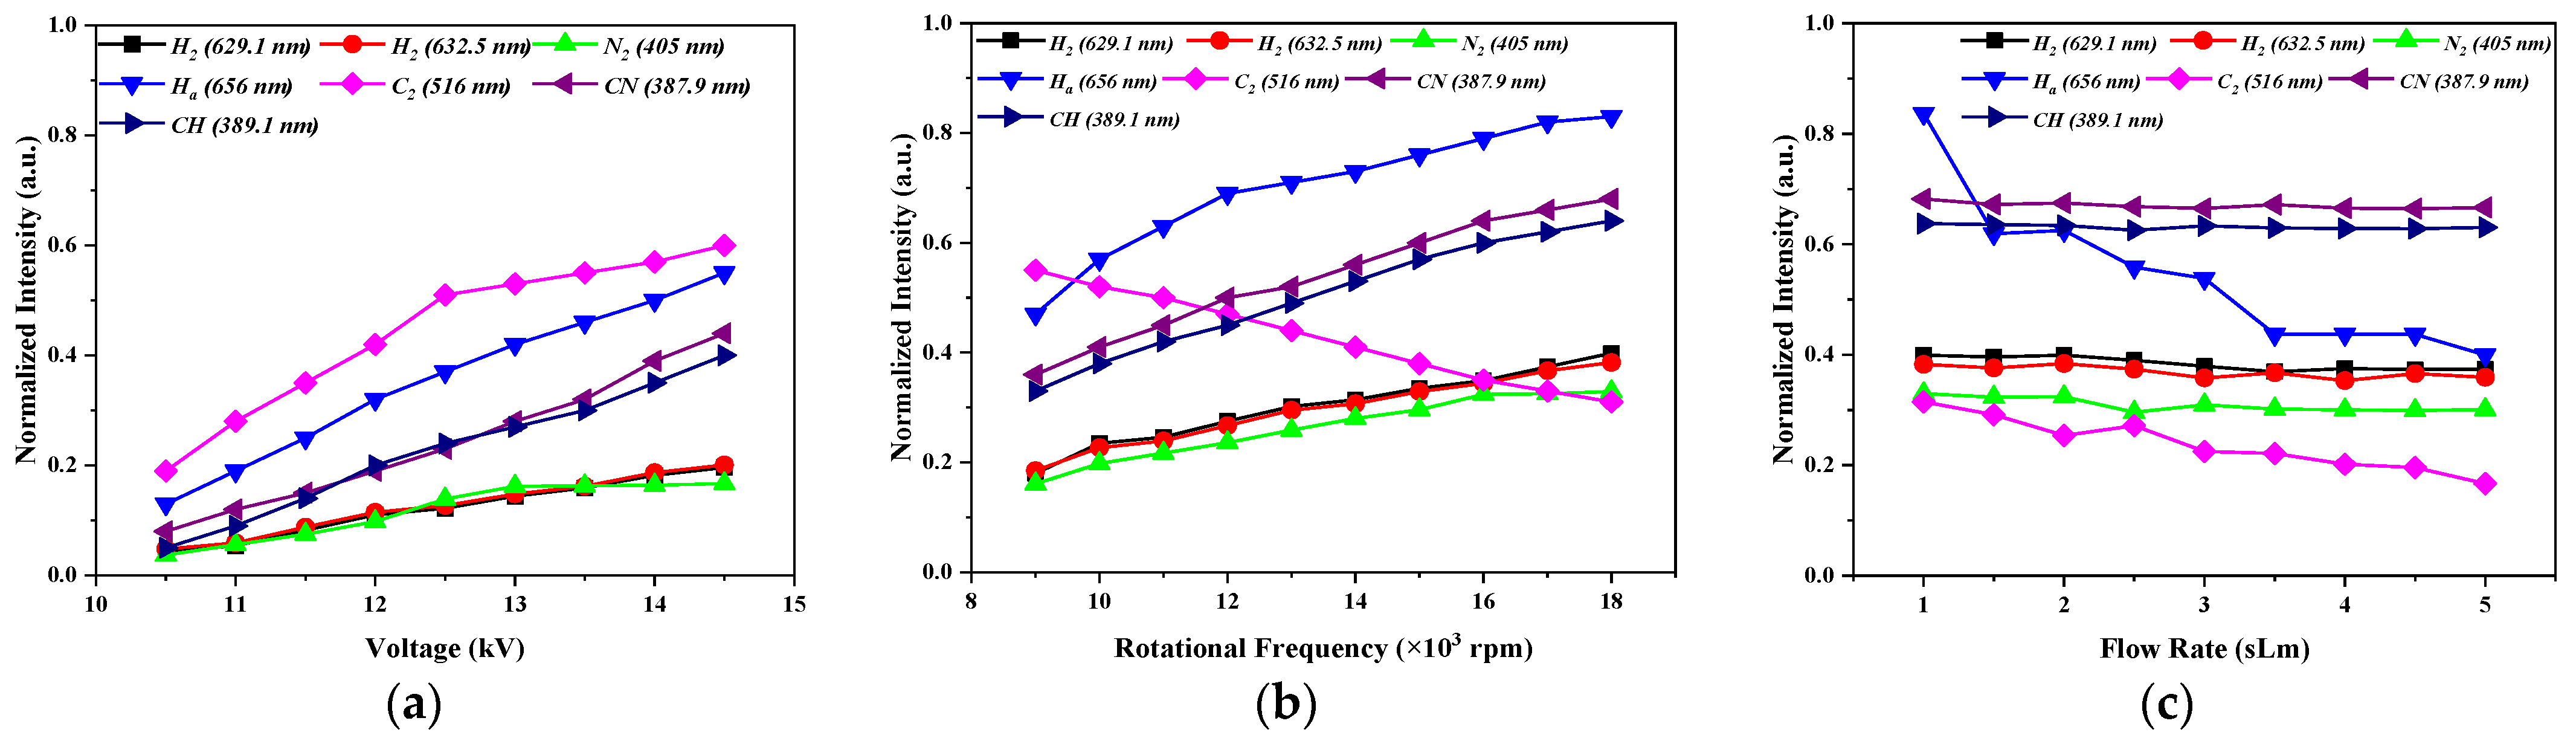
Figure 9 shows the normalized intensities of the band heads and the maximum of atomic lines obtained by the emission spectra of the plasma reactor with the C
4H
10/C
3H
8 gas mixture in two respective stages, namely, the stationary and rotating power electrodes. It must be noted that the presented results were at various voltages from 10.5 to 14.5 kV and the frequency of 50 Hz for the fixed power electrode with a 1 sLm gas flow rate, at different frequencies from 9000 to 18,000 rpm for the rotating power electrode with 14 kV and 50 Hz as long as at a 1 sLm gas flow rate, and at different gas flow rates for 14 kV and 50 Hz at 18,000 rpm in atmospheric pressure and a spectral wavelength range of 200–1000 nm. As can be seen from
Figure 9a, the intensities of all lines were increased with more voltage applied to the discharge medium. The growing voltage produced a rise in the electric field between the electrodes and the acceleration of electrons. The production of species by the reactions of Equation (5) and its excitation was also increased.
The intensity of the emission line of C
2 was reduced by increasing the rotation frequency of the power electrode, unlike the other intensities that were raised (see
Figure 9b). The growth of intensities was because the contact of the LPG gas with the filaments was higher when the electrode was rotating [
2]. The formed C
2 molecules were a stable species which recombine together to form carbon clusters. The formed carbon clusters diffused in all directions and then deposited on the electrodes and on the walls of the discharge tube [
18]. This process was enhanced with the higher rotation frequency of the electrode.
On the other hand, similarly to the consumed power, the intensity of emission lines of all species decreased with the gas flow rate (see
Figure 9c). The axial transport of energy by the gas flow produced a diminishment of the energy of electrons and heavy particles. Therefore, the formation and excitation of species in the plasma also dropped. It should be also mentioned that the dependence of the intensity of C
2 and H
2 bands with the conditions was similar to the H
2 and C
2 selectivities obtained by the GC of the exhaust gas, showing that we were observing the formation of these species inside the filament.
The OES permitted us also to characterize the plasma produced in this reactor. In our case, the lines corresponding to hydrogen and carbon were of enough intensity to determine the main plasma parameters, such as the electron density and temperatures of the electrons and heavy particles by different spectroscopic methods. The values of these parameters define the kinetic of the plasma and the transformation of LPG gas to H2 gas.
As a discharge dominated by the electron kinetic, where the dissociation reactions of Equation (5) are given by the collisions with electrons, the number of electrons given by the electron density determine the efficiency of the LPG conversion. The values of the electron density can be obtained by analyzing the Stark broadening of atomic lines. In this work, where intense lines of hydrogen atoms were detected, the broadening of the H
α line was used (
Section 3.3.4).
The kinetic of reactions in the plasma discharge (Equation (5)) depend also on the energy of these electrons, that is, the electron temperature. Electrons pick the energy directly from the electric field and share it with the rest of the particles by collisions, producing their excitation and ionization. Then, the population of excited states is given by the electron temperature. In the case of the equilibrium condition, the distribution function of excited states follow the distribution of Boltzmann with a temperature equal to the electron temperature. The intensities of the atomic emission lines, that depend on the populations of an upper excited state, can be used to determine the electron temperature. In this work, five lines of the Balmer series of hydrogen, H
ε, H
δ, H
γ, H
β, and H
α, were used for this purpose (
Section 3.3.3).
The gas temperature, or temperature of heavy particles, is another important parameter for the study of the application of this type of plasma discharge. The heavy particles acquire translational energy by collisions with energetic electrons. When the equilibrium among these species is reached, their temperatures are equal. In a non-homogenous plasma, like the filamentary discharge, the conditions are far from this equilibrium and the electron temperature is different to the gas temperature. It is called a 2-temperature plasma condition. In this sense, it should be mentioned that the LPG conversion to hydrogen is more effective when the difference between these temperatures is higher. This is due to a part of the energy of the electron being used for gas heating with a less efficient LPG conversion. The gas temperature is usually associated with the rotational temperature that gives the distribution of the vibro-rotational states of molecules in the discharge, because these are mainly populated by collision with heavy particles. The simulation of a vibro-rotational spectrum and its fitting to the experimental data was used to determine the rotational temperature. The C
2 band has enough intensity in all study conditions and was used for the determination of this temperature (
Section 3.3.2).
Table 3 presents a summary of the species and techniques used in this work for the determination of the different parameters.
3.3.2. Gas Temperature
The gas temperature (
Tg) in the plasma discharges is considered as close to the rotational temperature (
Tr) [
20]. This temperature describes the population of rotational states of the molecules. These states are mainly populated by collisions with the heavy particles. At the atmospheric pressures, the collision frequency is significantly high. Hence, prior to the instant photon emission, there is enough time to reach the equilibrium between the excited molecules and the gas particles.
The theoretical emission intensity of the transition
corresponding to the vibro-rotational bands is given by [
21]:
where
S is the oscillator strength,
k is the wavelength, and
kB is the Boltzmann constant.
Ep and
D0 are the energy of the rotational level
J′ and a coefficient that depends on the rotational partition function,
Qr, respectively, and can be calculated by:
where
C is a constant and
Bv depends on the vibrational state
v.
Equation (7) can be used for the simulation of the bands, introducing the broadening of lines. In our case, where the instrument broadening was the predominant, a value of 0.108 nm was considered. The best fitting of this simulated spectrum to the experimental measurements permits to estimate the values of
Trot. The SPECAIR [
22] software was used as the source of coefficients of Equation (7) and for this fitting.
Figure 10 shows an example of the fitting processes with the C
2 system to calculate the rotation temperatures for the C
4H
10/C
3H
8 gas mixture at a 14 kV applied voltage, 18,000 rpm rotation frequency of the power electrode, and a 1 sLm gas flow rate.
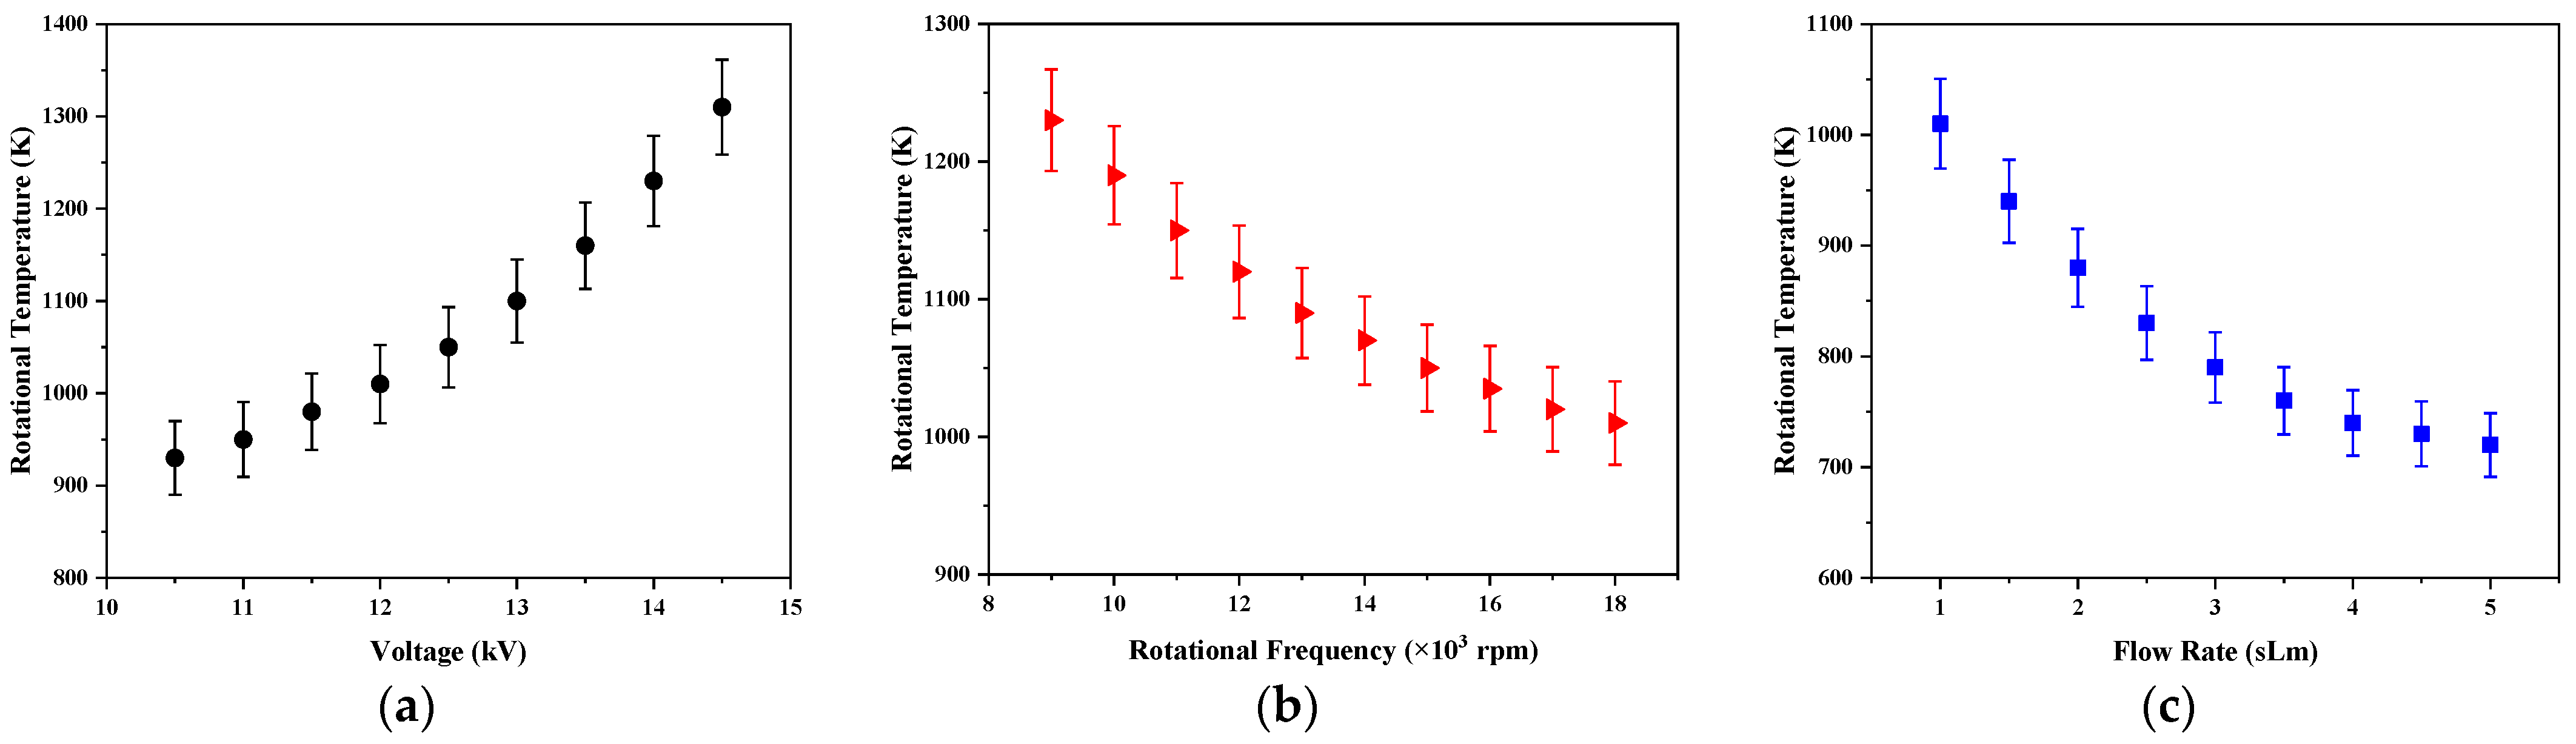
The variations of the rotational temperature as a function of the applied voltage, rotation frequency of the power electrode, and the gas flow rate are shown in
Figure 11. As seen, the rotational temperature for the developed plasma reactor changes between 700–1300 K. These values are a good estimation of the gas temperature when the population of the vibro-rotational levels follow the equilibrium (7). For separation of the equilibrium, these values could be overestimated.
The gas temperature in the plasma reactor was increased by raising the applied voltages due to more energy being fed to the discharge medium while it was reduced by growing the rotation frequency and gas flow. As presented in the next section, this was due to the decrease in the energy of electrons in these conditions, and consequently the transfer to heavy particles decreased.
3.3.3. Electron Temperature
The collisions of electrons with the atoms in the filamentary discharge produce the excitation and ionization of these species. The excited states with the highest excitation energy are in equilibrium with the ground state of ions. Their populations follow the Saha distribution:
where
n(
p) is the population of the excited level related to
p,
ne is the electron number density,
n+ is the density of positive ions,
me is the electron mass,
Eion is the ionization energy of the hydrogen (13.596 eV), and
Ep is the energy of the level [
23].
The measure of intensities
Iexp of different atomic lines allows us to obtain the relative populations of the upper levels by [
24]:
where
gp is the departure level degeneracy, and
Apq and
λ denote the transition probabilities and the wavelength of the lines, respectively.
A Boltzmann plot is a semi-log representation of these relative populations vs. the ionization energy, which shows a linear behavior with slope equal to 1/(kBTe) when they follow the Saha distribution of Equation (9), and this allows us to estimate the electron temperature. It should be mentioned that the results of the electron temperature obtained by this procedure could give incorrect values if the populations of the excited state are far from the equilibrium of the Saha distribution.
Torres et al. [
24] have shown that, in a pure hydrogen plasma, the separation of states corresponding to these transitions from the Saha distribution follow a
p−6 law, with
p as the principal quantum number of these levels, and they proposed a modified Boltzmann plot method to obtain more accurate electron temperatures in the plasma. They assumed that the atomic distribution function is given by:
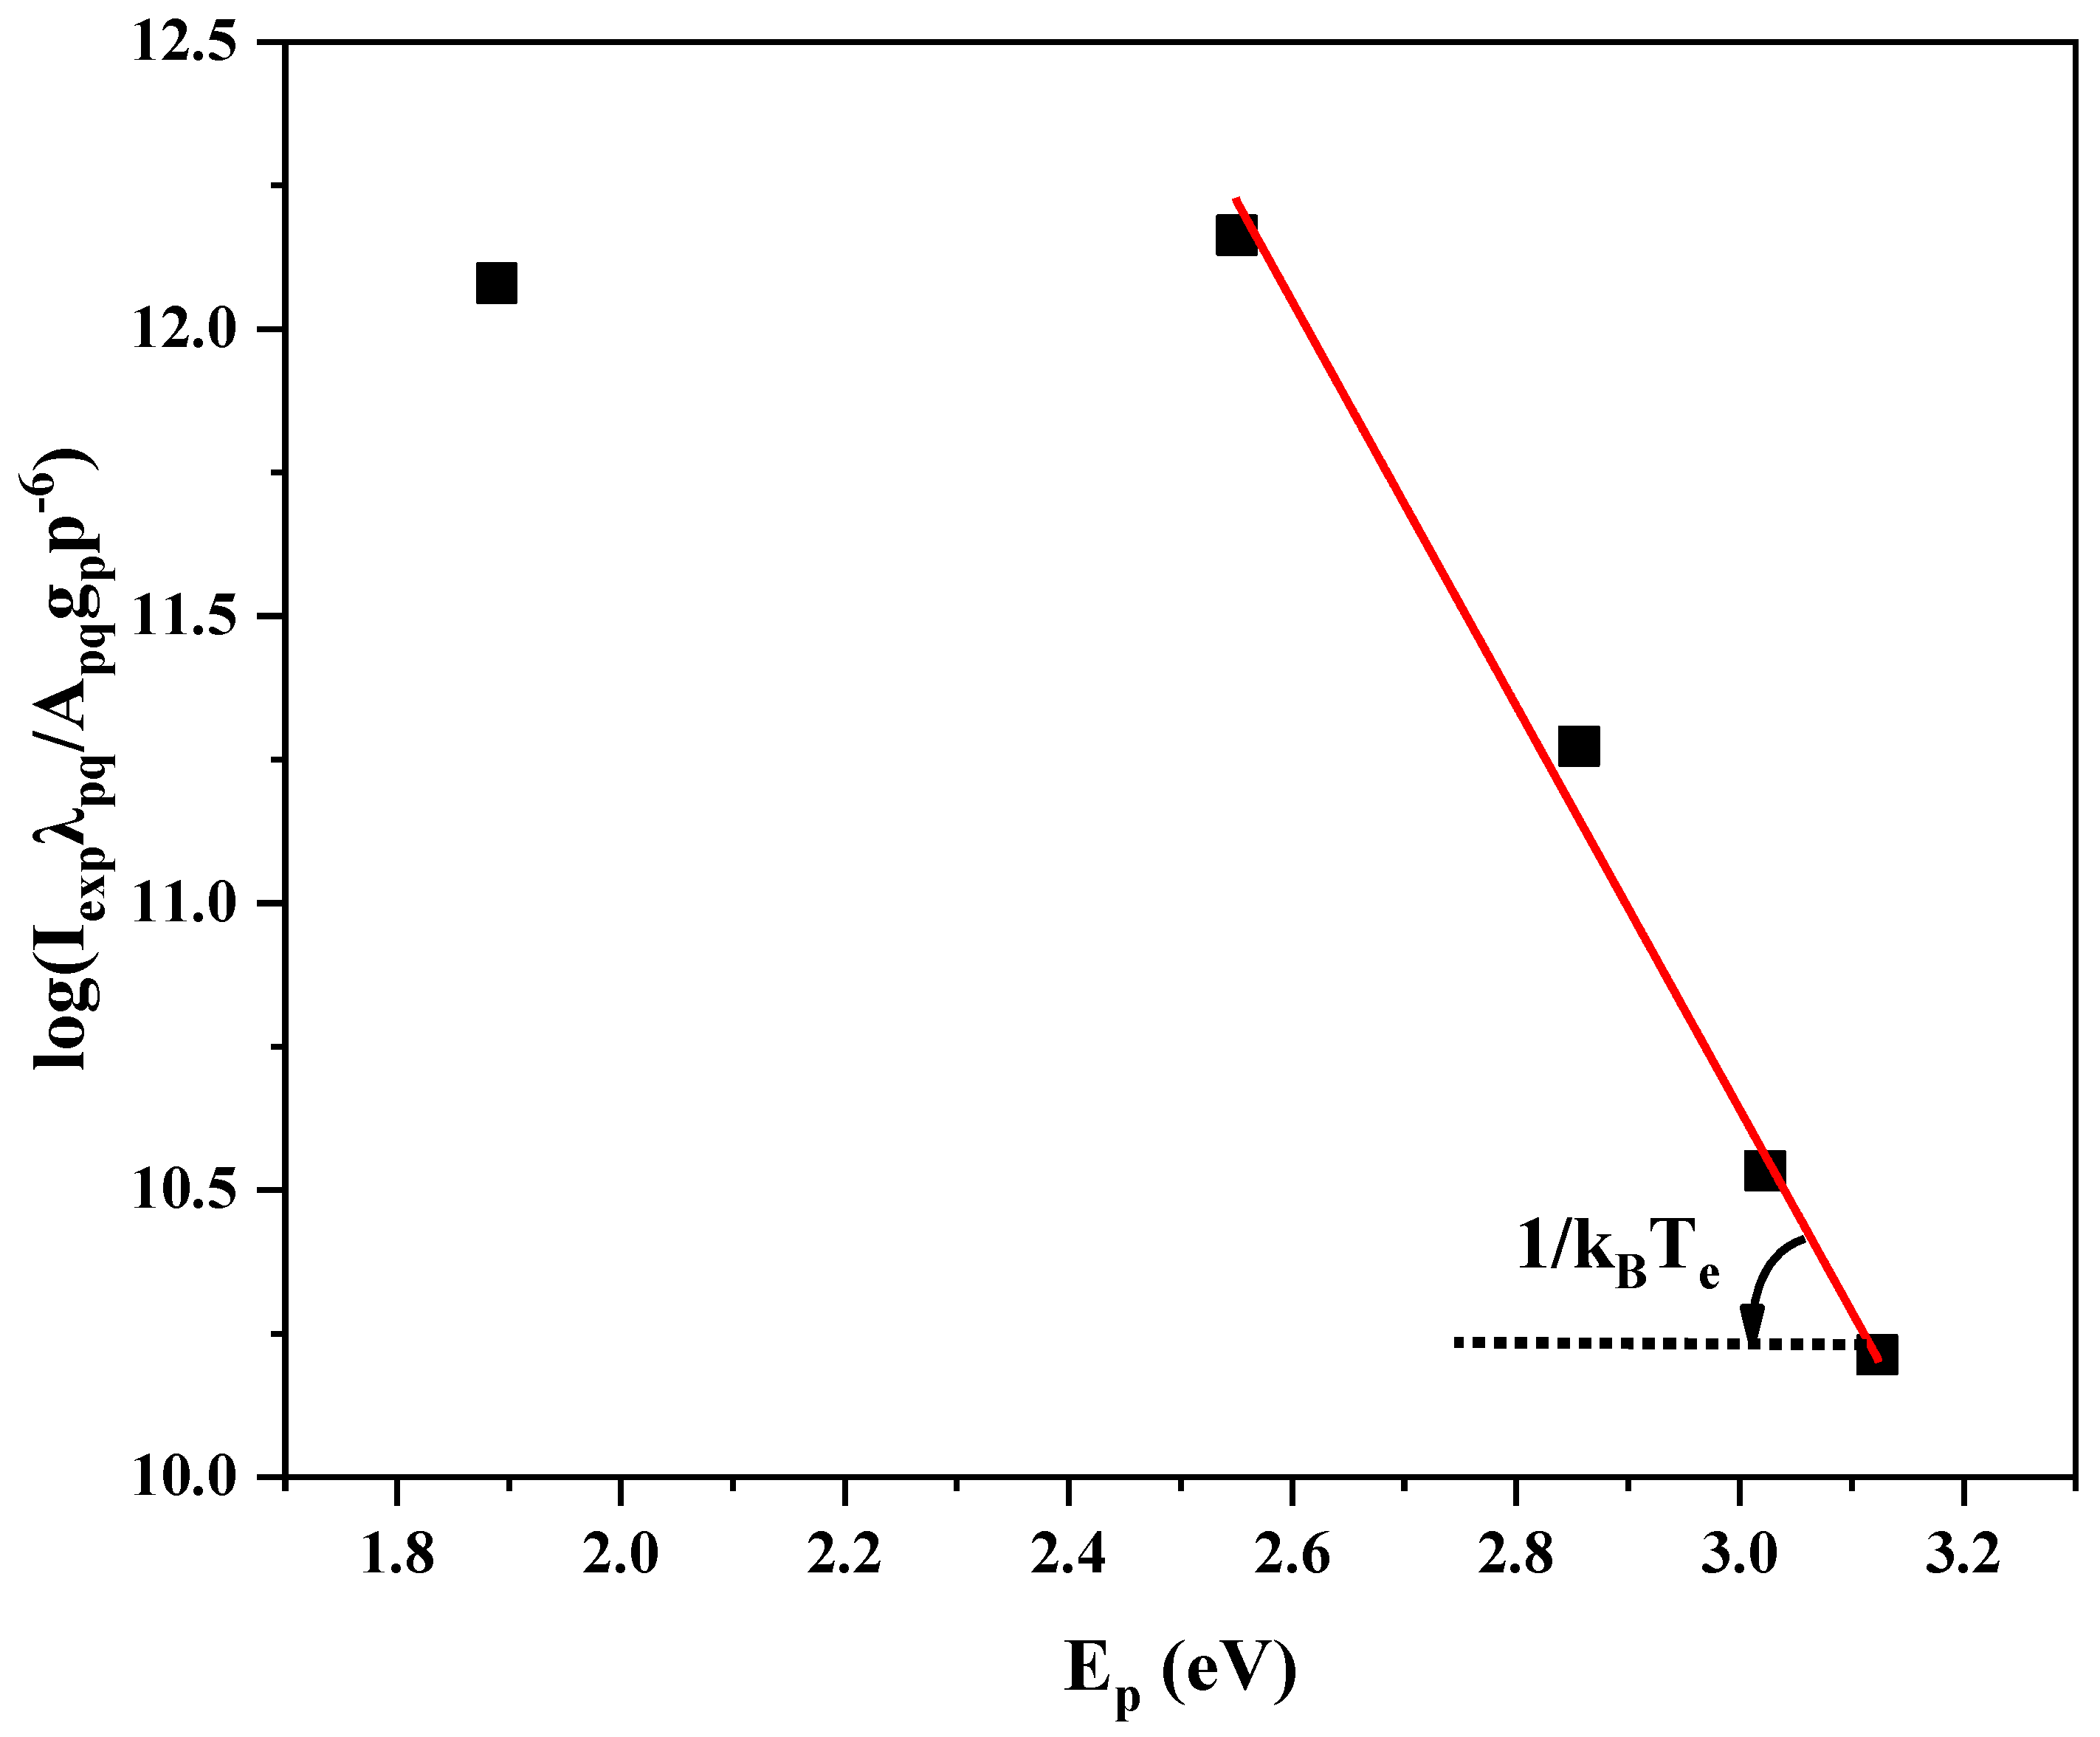
The modified Boltzmann plot was formed by plotting the
vs. the energy level. With this modification, the behavior was linear again and its slope allowed us to obtain the electron temperature (
Figure 12).
In this work, the first five lines of the hydrogen Balmer series were used in the calculation of electron temperature.
Table 4 presents the parameters needed for this calculation.
Figure 12 shows the modified Boltzmann plot of the emission lines of hydrogen atoms at the applied voltage of 14 kV, rotation frequency of the power electrode of 18,000 rpm, and gas flow rate of 1 sLm. By excepting the α-line in the Balmer series, which can present a self-absorption in its own discharge [
24], the populations due to each transition were linearly distributed. Therefore, by ignoring the H
α line in the fitting procedure, the electron temperature was determined from the calculation of the line slope (14,400 K for these conditions).
Figure 13 shows the variations of electron temperature as a function of applied voltage, rotation frequency of the power electrode, and the gas flow rate. It can be observed that the electron temperatures had a similar behavior to the gas temperatures with the changes of the experimental parameters. The temperature of electrons increased with the increase of applied voltage while their temperature decreased by increasing the rotation frequency of the power electrode and the gas flow rate. This shows the transfer of energy between electrons and heavy particles.
For all studied conditions, the rotational temperature was much lower than the electron one, due to no equilibrium condition in this plasma. It means that this discharge was not in equilibrium and was a 2-temperatures plasma, where the electron and gas temperatures are different. As mentioned, the electric field directly gives the energy to the electrons, which transfer this energy to heavy particles by elastic and inelastic collisions. If the equilibrium between particles is not reached, the translational energy of heavy particles is lower than one of the electrons:
Te >
Tg [
25,
26]. This difference of temperatures of both species justifies the high values of LPG conversion and H
2 formation. The energy of electrons is efficiently used in this conversion instead of the heating of heavy particles.
3.3.4. Electron Density
To understand the dissociation of molecules by electron impact in the formed plasma discharge media, the electron number density in the developed plasma reactor must be calculated. The Stark broadening analysis of the hydrogen Balmer series emission lines is one of the most usual spectroscopic methods to obtain the electron density of the plasma discharge [
27,
28,
29]. In this work, the Stark broadening of the α-series (H
α) at the wavelength of 656.3 nm was used.
Several mechanisms separate the emission line of its monochromatic behavior and produce a broadening in this line. The interaction of emitting particles with the charged particles produces a Stark broadening that depends on the density of these particles, i.e., electron density, by the following expression [
30]:
with the electron density
ne in cm
−3. If we can determine the value of this broadening, the Equation (12) can be used for the calculation of electron density. The other broadening mechanisms of the full width half maximum (FWHM) of the line must be identified and eliminated for this determination.
The pressure broadening occurs when the states of the emitters are disturbed by the neutral species collisions. There are two types of this broadening: resonant broadening, due to the dipole–dipole interactions of the emitter with the ground-state atoms of the same element, and van der Waals broadening, that is produced by collisions with other species. For the hydrogen lines in this discharge, the resonant broadening is neglected by the small concentration of the hydrogen atom. Van der Waals broadening can be estimated by [
30,
31]:
where
µ is the reduced mass of the colliding particles,
λ is the wavelength of the line (656.3 nm in our case),
α is the polarizability of the perturber species, 〈
R2〉 is the difference of the square radius of the upper and lower levels of emitting particles,
Tg is the gas temperature, and
P is the pressure (1 atm). In the discharge of this work, the main perturbers were the C
4H
10 and C
3H
8 gases that compounded the LPG gas. The van der Waals of the gas mixture can be calculated by:
where
and
are the van der Waals broadenings of the butane and propane gases, respectively, and
and
are the volume fractions of these gases. The parameters that are needed to calculate the van der Waals broadening of the C
4H
10 and C
3H
8 gases are given in
Table 5. For these calculations, the gas temperature of the
Section 3.3.2 was considered.
Both these mechanisms contribute with a Lorentzian profile whose FWHM is given by [
29]:
In addition to these both Lorentzian effects, there are other mechanisms that produce a Gaussian profile. The Doppler broadening, that it is produced by the movement of emitting particles in respect to the observer, and the instrumental one, given by the resolution of the optical system,
= 0.108 nm in this set-up. The Doppler broadening depends on the gas temperature by the following expression [
30,
31,
32]:
where
λ is the wavelength of line and
M is the atomic mass, 656.3 nm and 1 g/mol for H
α, respectively. The combination of both of these Gaussian broadenings is a Gaussian profile with a FWHM [
33,
34,
35,
36,
37]:
It must be noted that, the superposition of the Gaussian (Doppler + Instrumental broadenings) and Lorentzian (Stark + van der Waals broadening) profiles will result in the Voigt profile (see
Figure 14). Using the Origin software, the fitting procedure was performed and the FWHM of the Lorentz broadening was distinguished. Removing the van der Waals effect of this total Lorentz FWHM from Equation (15), the Stark broadening and, consequently, the plasma electron density could be calculated.
Figure 14 shows an example of this fitting for the case of an applied AC voltage kept at 14 kV with the C
4H
10/C
3H
8 gas mixture, an electrode rotation frequency of 18,000 rpm and a 1 sLm gas flow rate. The FWHMs of the Gaussian and Lorentzian profiles are equal to Δ
λG = 0.105 nm and Δ
λL = 0.093 nm, respectively.
Figure 15a shows the changes of the electron number density as a function of applied voltages. It is obvious that by increasing the applied voltage, the electron number density is raised. This is owing to the fact that, the electric field between the electrodes is strengthened by raising the voltage. On the other hand, the charged species is more accelerated in the electric field and the ionization collision will be higher. Hence, the electron density is increased.
The electron number density is also grown by raising the rotation frequency of the power electrode at the maximum applied voltage as shown in
Figure 15b. This growing of electron density is due to a secondary effect produced by hydrogen (see Equation (6)). As mentioned, the density of hydrogen atoms rises with the electrode rotation frequency. These hydrogen atoms produce more ionization and consequently a higher electron density. At the higher gas flow rates, the influences of ionizing collisions on the neutral particles will significantly decrease, as shown in
Figure 15c.
The results of the electron density agree with the H
2 formation detected by the GC. The hydrogen selectivities (see
Figure 6) had similar behaviors to the obtained ones for the electron density. This confirms that the mechanisms that lead to the hydrogen formation were governed by electron kinetic energy.
4. Conclusions
A new plasma reactor was designed for H2 formation from C4H10/C3H8 gas mixture (LPG) conversion. The plasma discharge was formed by an AC voltage applied to the developed plasma reactor at atmospheric pressure. The discharge was investigated in two phases, namely, the stationary and rotating power electrodes.
A filamentary mode was found in the plasma, where the electron current was due to high numbers of current discharges between the electrodes. The dissociation processes were attributed to two processes: the electron collision with propane and butane molecules and the dynamic of these filaments.
The present discharge produced the dissociation of C4H10/C3H8 molecules, and H2 and C2 formations under all the studied conditions. GC measurements permitted the estimation of the conversion factors for these species and the obtained values were 70% and 60%, respectively.
The energy efficiency of converted LPG in the designed reactor was also investigated and it was shown that the energy efficiency reduced by increasing the applied voltage and gas flow rate while it increased with an increase in the rotation frequency of the power electrode. The energy efficiency was equal to 1.17 mmol/kJ for the rotation frequency of 9000 rpm that increased to 1.35 mmol/kJ for the rotation frequency of 18,000 rpm, showing the efficiency of the rotating electrode design.
The dependence of conversion factors and energy efficiency on the experimental conditions was explained by the number of filaments formed in the reactor.
These good results of the LPG conversion were accompanied by an efficient formation of H2. The selectivity in this plasma reactor reached 98% for the highest electrode rotation frequency. The results are explained by the plasma condition in the filamentary discharge.
A spectroscopic study was performed to determine the species presented in the discharge and the values of the main parameter of this plasma.
Hydrogen atoms and molecules, C2 molecules and CN radicals were the predominant species detected using OES measurements. These species were the results of the dissociation of C4H10/C3H8 molecules by the electron collision processes and recombination with air contaminants in the discharge.
The high values obtained of the electron densities and temperatures confirm that the kinetic of the dissociation is governed by electron impact. The gas temperatures were obtained by a spectra simulation of the C2 band. Moreover, the first five lines of hydrogen atoms were used to calculate the electron temperature by a modified Boltzmann plot. By the comparison of these temperature values, a 2-temperatures non-equilibrium plasma was found, where the electron temperature was much higher than the translational heavy particles, about 15,000 K and 1200 K, respectively.
The electron density was found to grow with the rotating electrode, passing from 1.9 × 1015 cm−3 to 2.7 × 1015 cm−3. The secondary ionization processes of the H2 molecules, whose numbers were increased, can explain this behavior. Conversely, the gas and electron temperatures decreased with the electrode rotation frequency, therefore, it is obvious that the electric power is shared between a high number of particles, reducing their kinetic energy.
In conclusion, the rotating electrode stage permits the improvement of H2 production in comparison to the stationary stage with a reduction in the power and LPG gas consumption.
The soot accumulation in the reactor wall is also advantageous for H2 separation, as it avoids the posterior recombination of these two molecules in the hydrocarbon species.


 ,
, 


