1. Introduction
As a new type of spacecraft, CubeSats have become an important part of satellite systems. However, in space, CubeSats often fail due to electromagnetic interference, particle radiation, space collision, and so on. On-orbit inspection and maintenance are required to repair malfunctioning satellites. Among them, pose measurement and motion estimation are the primary links of satellite on-orbit servicing. The CubeSat target may have mechanical vibration or rotation alongside bulk translation, which causes great difficulties for the pose measurement and motion state estimation of space targets [
1,
2]. It is worth noting that when there is relative motion between the radar and the target, the carrier frequency of the return signal will be shifted. This phenomenon is known as the Doppler effect [
3]. The Doppler frequency shift is associated with the transmitting wavelength and the relative velocity between the radar and the target. The Doppler effect is capable of providing rich information about the target’s motion, and it has been widely utilized in various radar applications such as moving-target detection and cluster target resolution [
4,
5].
The target or any structure on the target may have mechanical vibration or rotation in addition to its bulk translation; for instance, the rotation of helicopter rotor blades, the swing of a walking person, or the precession of a cone-shaped target. These motions might induce frequency modulation of the returned signal, which generates sidebands about the target’s Doppler frequency shift. This is called the micro-Doppler (MD) effect [
6,
7,
8]. Previous studies have revealed that the micro-Doppler effect is relevant to the properties of the target and able to provide detailed information about the target [
9,
10,
11,
12,
13,
14,
15,
16,
17,
18,
19]. Specifically, parameters consisting of spin rate, precession rate, precession angle, and inertia ratio can be estimated based on micro-Doppler effect analysis. Accordingly, exploiting the micro-Doppler effect is significant for the application of target identification and parameter estimation.
In the field of micro-motion feature detection, the research of other scholars is mainly based on electromagnetic waves in the microwave frequency band [
20,
21,
22]. Note that for short-wavelength electromagnetic signals, even micro-vibrations with very low vibration rates can induce large phase changes. Therefore, micro-Doppler frequency modulation or phase change with time can be easily detected. A coherent laser radar operating at a shorter wavelength can achieve better velocity precision than that operating at a longer wavelength [
6]. As a consequence, a coherent laser radar operating at a short wavelength is needed to obtain high-precision motion estimation. However, micro-Doppler signals with area scattering modulation, rather than multiple scattering centers for microwave cases, will be encountered. For the microwave case, motion estimation can be carried out based on the periodic curves in the TF image [
17], while for short-wavelength cases, an appropriate method is required to extract parameters based on the structured broadband (see
Section 2) in the TF image caused by area scattering. Therefore, in this paper, a novel framework is proposed to estimate the parameters of CubeSats with micro-motion (i.e., spin motion) based on the micro-Doppler effect by a laser radar system. In particular, the spin rate is estimated based on the 2D Fourier transform of the time-frequency data. The attitude angle can be obtained effectively after threshold processing. The target size is identified through bistatic radar operations. Finally, the proposed method is verified by simulations and experiments. The scheme developed in this work may provide new technical means for the detection of non-cooperative targets and space debris in the future.
2. Modeling and the Proposed Method
As displayed in
Figure 1, the radar is stationary and located at the origin
Q of the radar coordinate system (
U,
V,
W). The target is depicted in a local coordinate system (
x,
y,
z) attached to it and has translations and rotations with respect to the radar coordinates. The origin
O of the local coordinates is at a distance
R0 from the radar. The azimuth and elevation angle of the target in the radar coordinates (
U,
V,
W) are
μ and
η, respectively. In this work, we choose
η = 0 to simplify the calculation, and thereby, the unit vector of the target along the line of sight (LOS) of the radar in the local coordinate system (
x,
y,
z) is given by
n = [0, sin
α, cos
α], where the attitude angle
α denotes the angle between the LOS of the radar and the
z-axis. In this work, we focus on the spin motion estimation of the target. Any point on the target depicted in the local coordinate system (
x,
y,
z) will move to a new position due to the rotation of the target. The new position can be obtained from its initial position vector multiplied by an initial rotation matrix determined by Euler angles (
ϕ,
θ,
φ), where the angle
ϕ rotates about the
z-axis, the angle
θ rotates about the
x-axis, and the angle
φ rotates about the
z-axis again. Viewed in the target local coordinate system, when a target rotates about
z-axes with an angular velocity
Ω. The rotation matrix is expressed as
The micro-Doppler effect caused by the micro-motion of a target or structures on the target can be derived from the theory of the electromagnetic back-scattering field. It can be mathematically formulated by extending the conventional Doppler effect analysis to utilize micro-motions. In this work, a spinning cube-shaped target is considered. When the radar transmits a sinusoidal waveform with a carrier frequency
f0, the baseband of the signal returned from one scattering point P on the cube surface is expressed as [
6].
Here,
ρ is the reflectivity function,
c is the speed of the electromagnetic wave propagation, and
rp(
t) the distance between the scattering point of the target and the detector at time
t. By taking the time derivative of phase
Φ = 2π
f0 [2
rp(
t)/
c], the Doppler frequency shift induced by the target’s motion is obtained as [
23].
In our model, the target consists of
K scattered points. Thereby, the returned superposition signal from the surface scattering of the laser light is
ρk and rk(t) represent the reflectivity function and distance of the k-th scattering point, respectively.
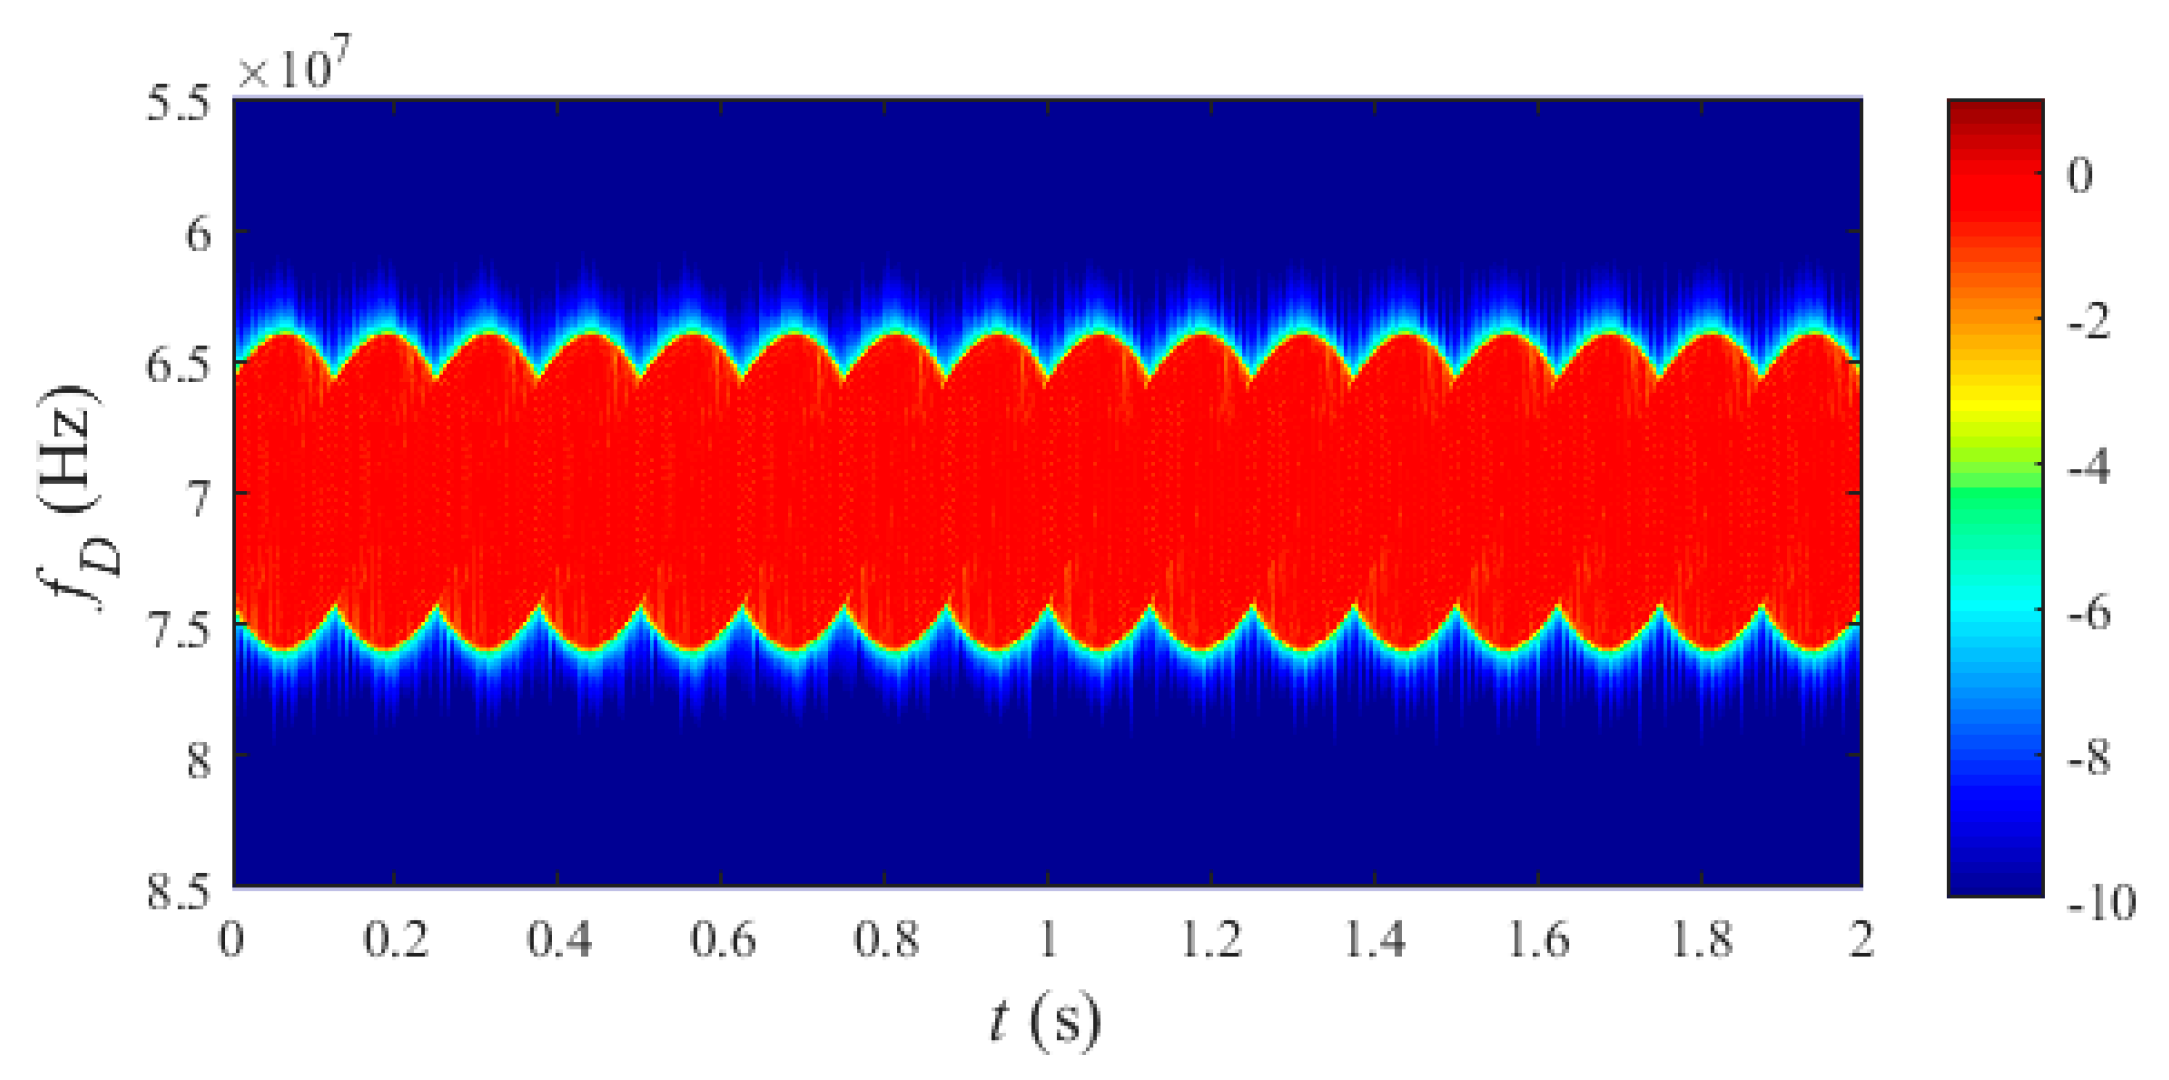
The time-frequency (TF) analysis that provides localized time-dependent frequency information is explored to analyze the micro-Doppler signal. In this work, the 2D TF image is obtained by using the short-time Fourier transform (STFT), which includes linear transforms [
6,
24]. After taking the logarithm of the intensity and performing Gaussian filtering of the frequency, low-frequency details can be reserved, the noise is effectively suppressed with edge-preserving, and a smooth TF image is eventually acquired.
Table 1 displays the simulation parameter selection for the 3 cm wavelength radar system, and
Figure 2 shows the corresponding TF images. In contrast,
Table 2 illustrates the simulation parameter selection for the 1064 nm wavelength radar system, and
Figure 3 shows the corresponding TF images.
When the size of the target is already known, the algorithm of the pose measurement and motion estimation of the targets is mainly divided into the following steps:
The received signal is collected by the laser radar.
The 2D TF image is obtained by using STFT.
Pretreatment of the 2D TF image is performed.
The micro-motion period is obtained by the 2D Fourier transform of the 2D TF image. Furthermore, the spin rate can be precisely acquired.
The pose measurement is obtained according to the relationship between attitude angle, maximum Doppler frequency shift, spin rate, size of the target, and the wavelength of the transmitted laser. The estimation of the pose feature depends on the precision of the maximum Doppler frequency shift and the spin rate.
When the size of the target is unknown, the algorithm of the pose measurement and motion estimation of the target is slightly different. In Step 5, the two pose measurements are performed by extracting the edges of the two TF images. Finally, the size of the target is acquired based on the relationship between the target size and the attitude angle.
2.1. Estimation of Spin Rate
In 2D, for TF signals
g(
t,
f) with N columns and M rows, the corresponding 2D discrete Fourier transform is given as
By computing the magnitude squared of the complex matrix
G(
u,
v), one has
Here,
R(
u,
v) and
I(
u,
v) are the real and imaginary parts of
G(
u,
v), respectively. Furthermore, the partial sum yields
Accordingly, one has a sequence
which consists of the features of the frequency spectrum.
It should be noticed that for the cube-shaped target, the spectrum is actually a superposition of TF curves corresponding to numerous scattering points. Based on the spectrum
obtained as mentioned above, the cycle of TF data can be easily determined. In particular, the corresponding frequency of the maximum value of
is just the characteristic frequency
ff. In this work, the cube rotates around the symmetric axis across the upper and lower bottom faces (see
Figure 1). Due to the equivalence of the four side faces, the characteristic period of TF data corresponds to a quarter of the spin cycle. Thus, one eventually has
Here, fs represents the period of spinning.
2.2. Estimation of Attitude Angle
In order to obtain the attitude angle, the edge in the 2D TF spectrum needs to be extracted. Before the edge detection, threshold processing is needed to reduce the error of extraction. The update of the threshold in this work is adaptive based on the least square method. In the first step, the parameters in this proposed algorithm need to be determined. To be specific, the maximum value of the 2D TF spectrum
gmax(
t,
f) at time
t corresponds to the Fourier transform of the echo signal. The Fourier transform of noise is relatively small. The mean value is denoted as
g(
t,
f). Accordingly, the threshold
χ is expressed as
Here,
J denotes the coefficient and ranges between 0 and 1. The initial value is set as
J = 0.1. During the iteration, the threshold is updated as
Here,
k denotes the slope,
n is the step,
b = 0.1 is the intercept. The optimization function is expressed as
Here, represents the estimated value of attitude angle, and α is the real value of attitude angle. N is the maximum number of iterations; that is, the threshold value χ is optimized by the least square between and α. According to the calculation, J = 0.5 is a suitable value.
2.2.1. The Size of the Target Is Known
For the cube-shaped target with size
L ×
L ×
L, the intersection of the axis of rotation and the upper surface of the cube is represented by
A. One vertex of the upper base surface is
B (see
Figure 1). The unit vector of LOS is expressed as
= [0, sin
α, cos
α]. The included angle between
and
is
γ.
R0 is the distance between the radar and the target. According to the cosine theorem, the distance between point
B and the radar is given by
Generally, the relation
is satisfied; namely, the distance between the radar and the target is much larger than the target size. So, Equation (14) can be further reduced to
where
. Point
B rotates around the rotation axes, and the variation of
with time is expressed as
The distance between points A and B is . Note that in the above derivation, the initial phase angle is set as 0.
Combined with the formula of the micro-Doppler effect, the Doppler frequency shift is now given by
One can see that
fD is a cosine function of time with the amplitude
When
fs is acquired, the attitude angle can be solved as
Equation (15) is associated with the scattering of the vertex. In the case of laser radar, the received signal is generated as a superposition of waves scattered from the countless scattering elements on the cube surface. As a result, the envelope of the 2D TF image corresponds to the scattering of the vertex. This means that once we obtain the envelope of the TF image by edge extraction and acquire the peak value of the envelope, we can then estimate the attitude angle according to Equation (17).
2.2.2. The Size of the Target Is Unknown
When the size of the target is unknown. It is known that
depends on the side of the cube, which means that
becomes an unknown as well. For synthetic aperture ladar (SAL), one can obtain two TF spectra under two different LOSs. By utilizing the two TF spectra together, the two unknown (
and
α) problems can be resolved. We call it the double edge ratio method (DERM), which is as follows: For a given LOS angle
α, one has the maximum Doppler frequency shift is
For another LOS angle (
α + Δ), the corresponding maximum of Doppler frequency is given by
Combining Equation (18) with Equation (19), one can easily obtain
By utilizing two TF spectra from different LOS angles and the double edge ratio method (DERM), we can obtain the attitude angle
α. According to the relationship between the attitude angle and the radius of gyration (see Equation (21)), the radius of gyration ρ can be acquired as
For the cube-shaped target, the lengths of the sides are equal. Thereby, we can furthermore obtain the length of the side as .
3. Simulation Results
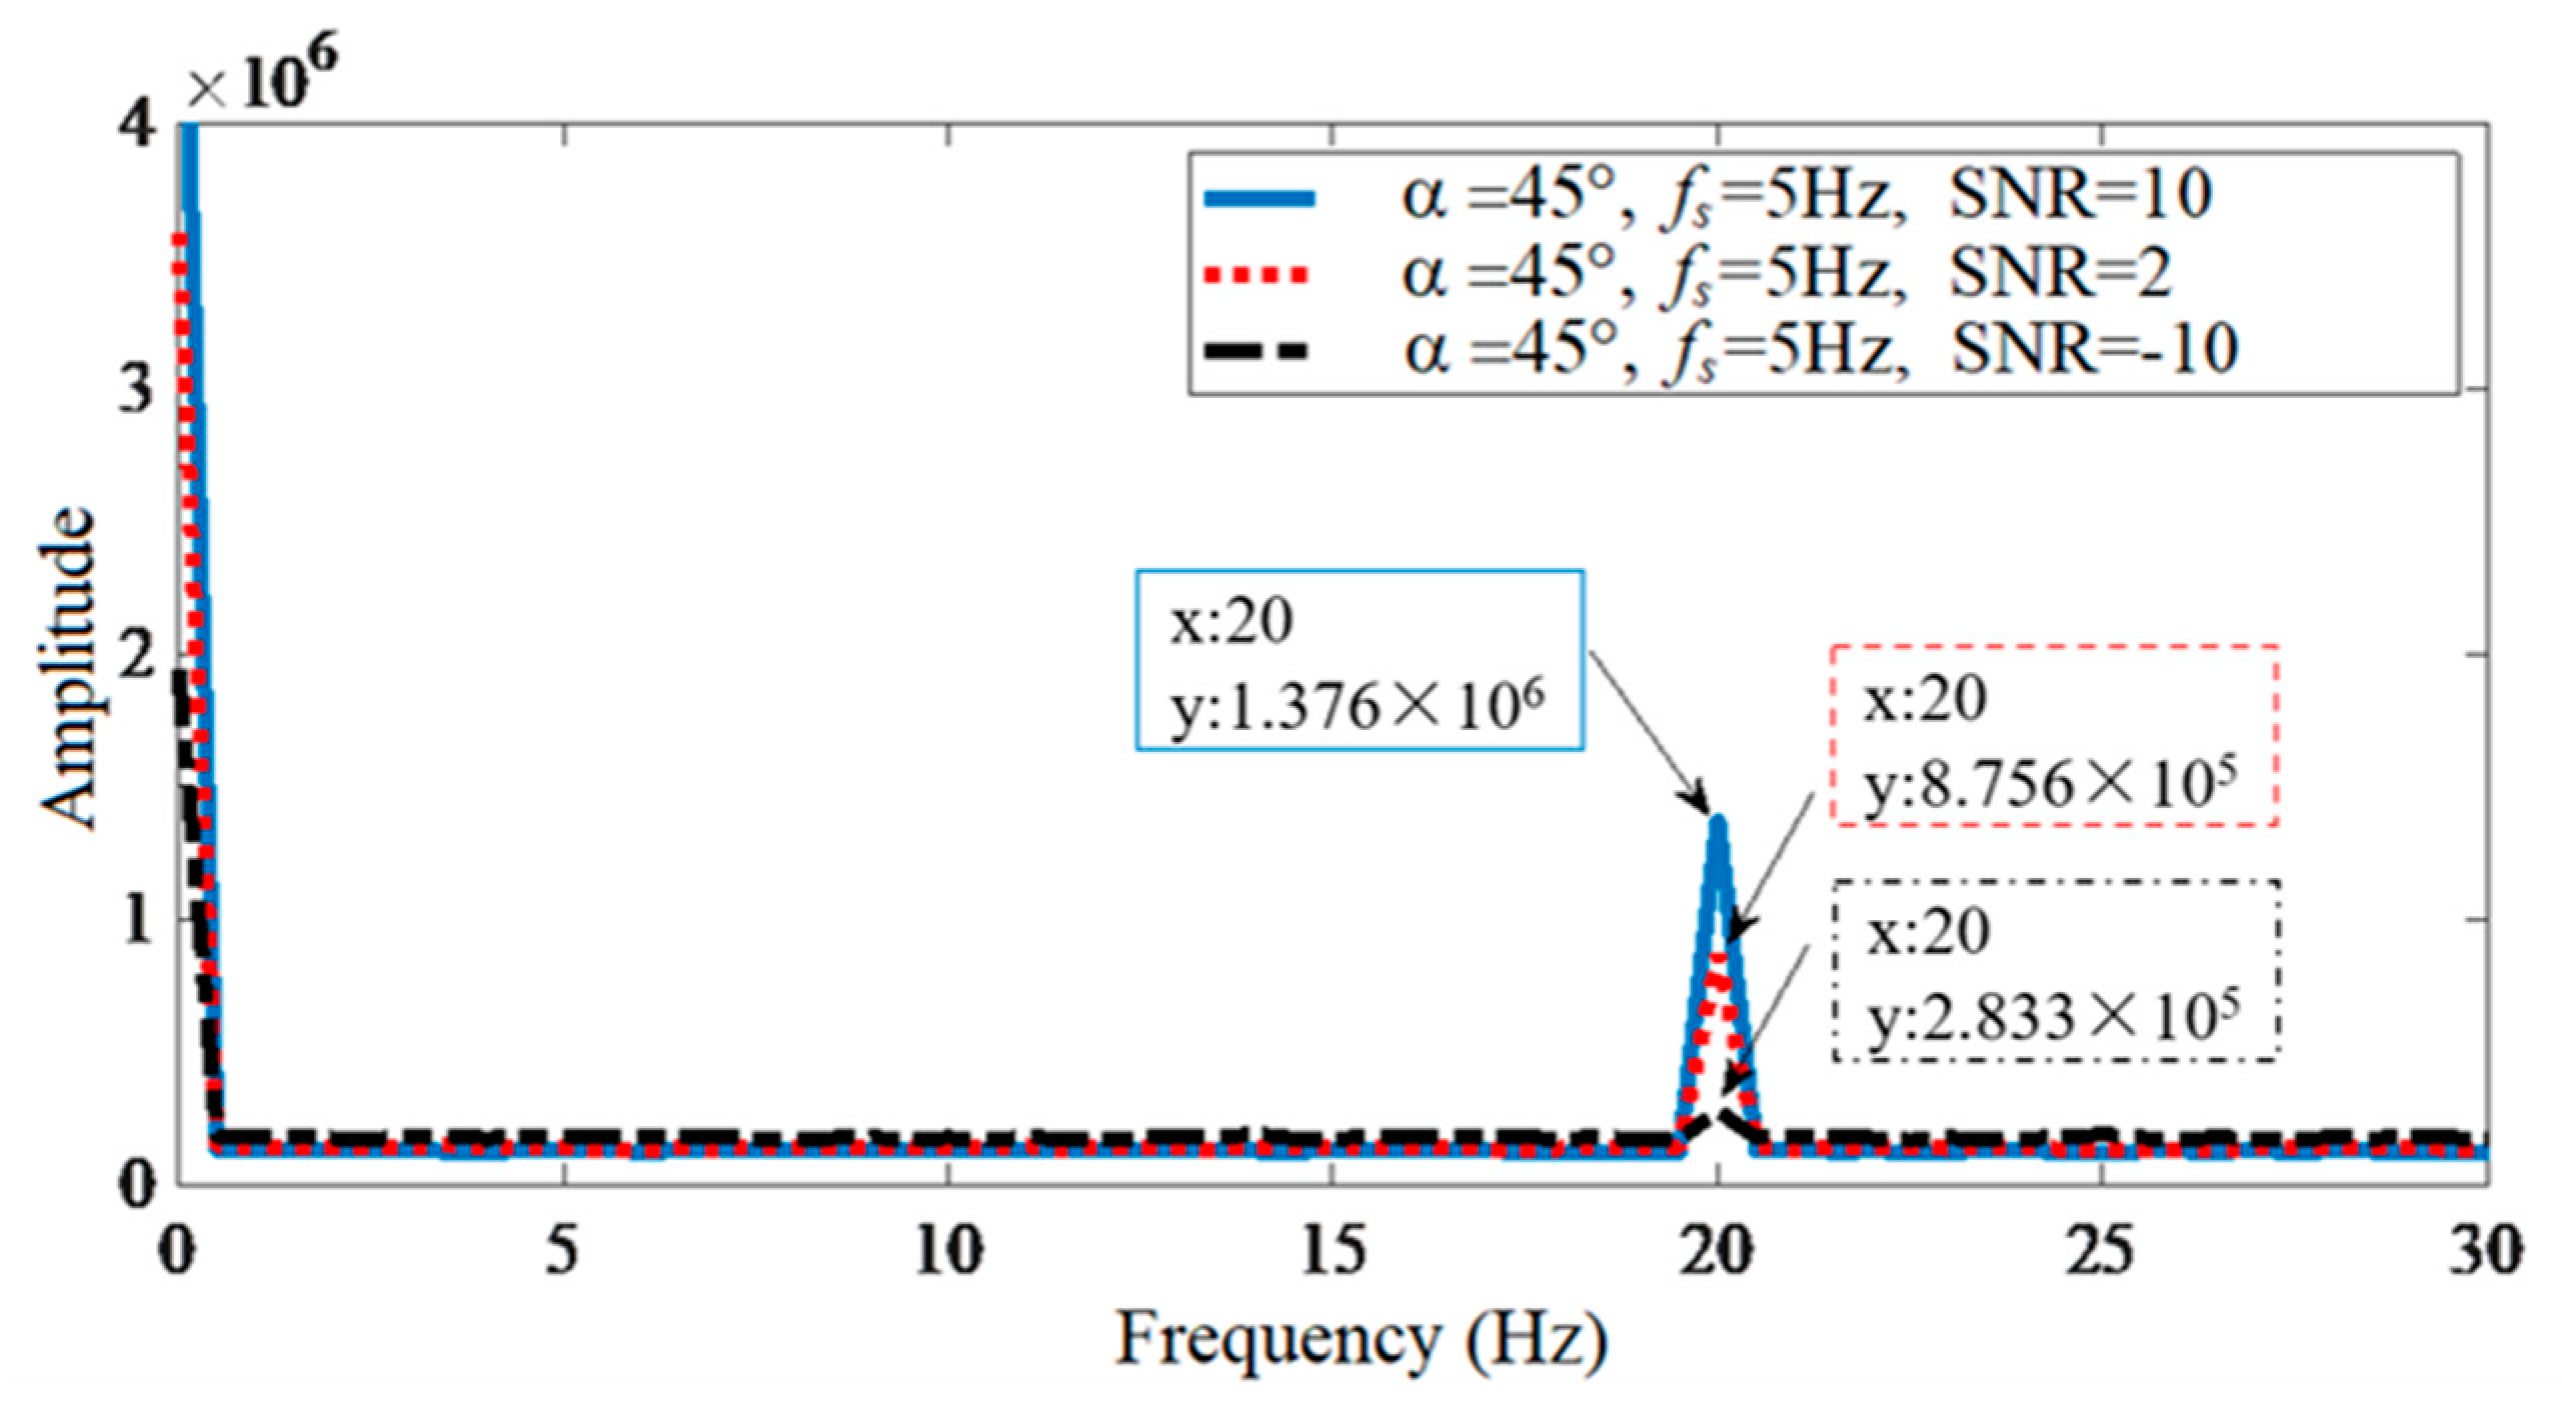
The simulation is performed to verify the algorithm mentioned above. In our simulation, the cube-shaped target with size 0.5 m × 0.5 m × 0.5 m is investigated. Firstly, the attitude angle is 45°, and the spin rate of the target is set at 5 Hz. According to the formula
(
Ps is the signal power,
Pn is the noise power), different laser emission powers are selected to set three different signal noise ratios (SNRs), i.e., SNR = 10 dB, 2 dB, and −10 dB, respectively. The estimation of spin rate from the simulation is illustrated in
Figure 4. As shown in this figure, the characteristic frequency
ff = 20 Hz can be acquired under different SNRs. However, the peak value of the 2D Fourier-transformed spectrum for the case of large noise is relatively lower. According to Equation (8), the spin rate can be obtained as
fs =
ff/4 = 5 Hz, which is consistent with the setting value in the simulation. In addition, the attitude angle
α = 15°, 30°, 45°, 60°, 75°, 90°, spin rate
fs = 0.5 Hz, 1 Hz, 2 Hz, 3.5 Hz, and 5 Hz are investigated as well. Our algorithm all gives accurate spin rates. To sum up, simulation results illustrate the validity of the proposed algorithm. It should be noted that large noise affects the peak value of the transformed spectrum. However, when the SNR is larger than −10 dB, the accurate spin rate can be extracted.
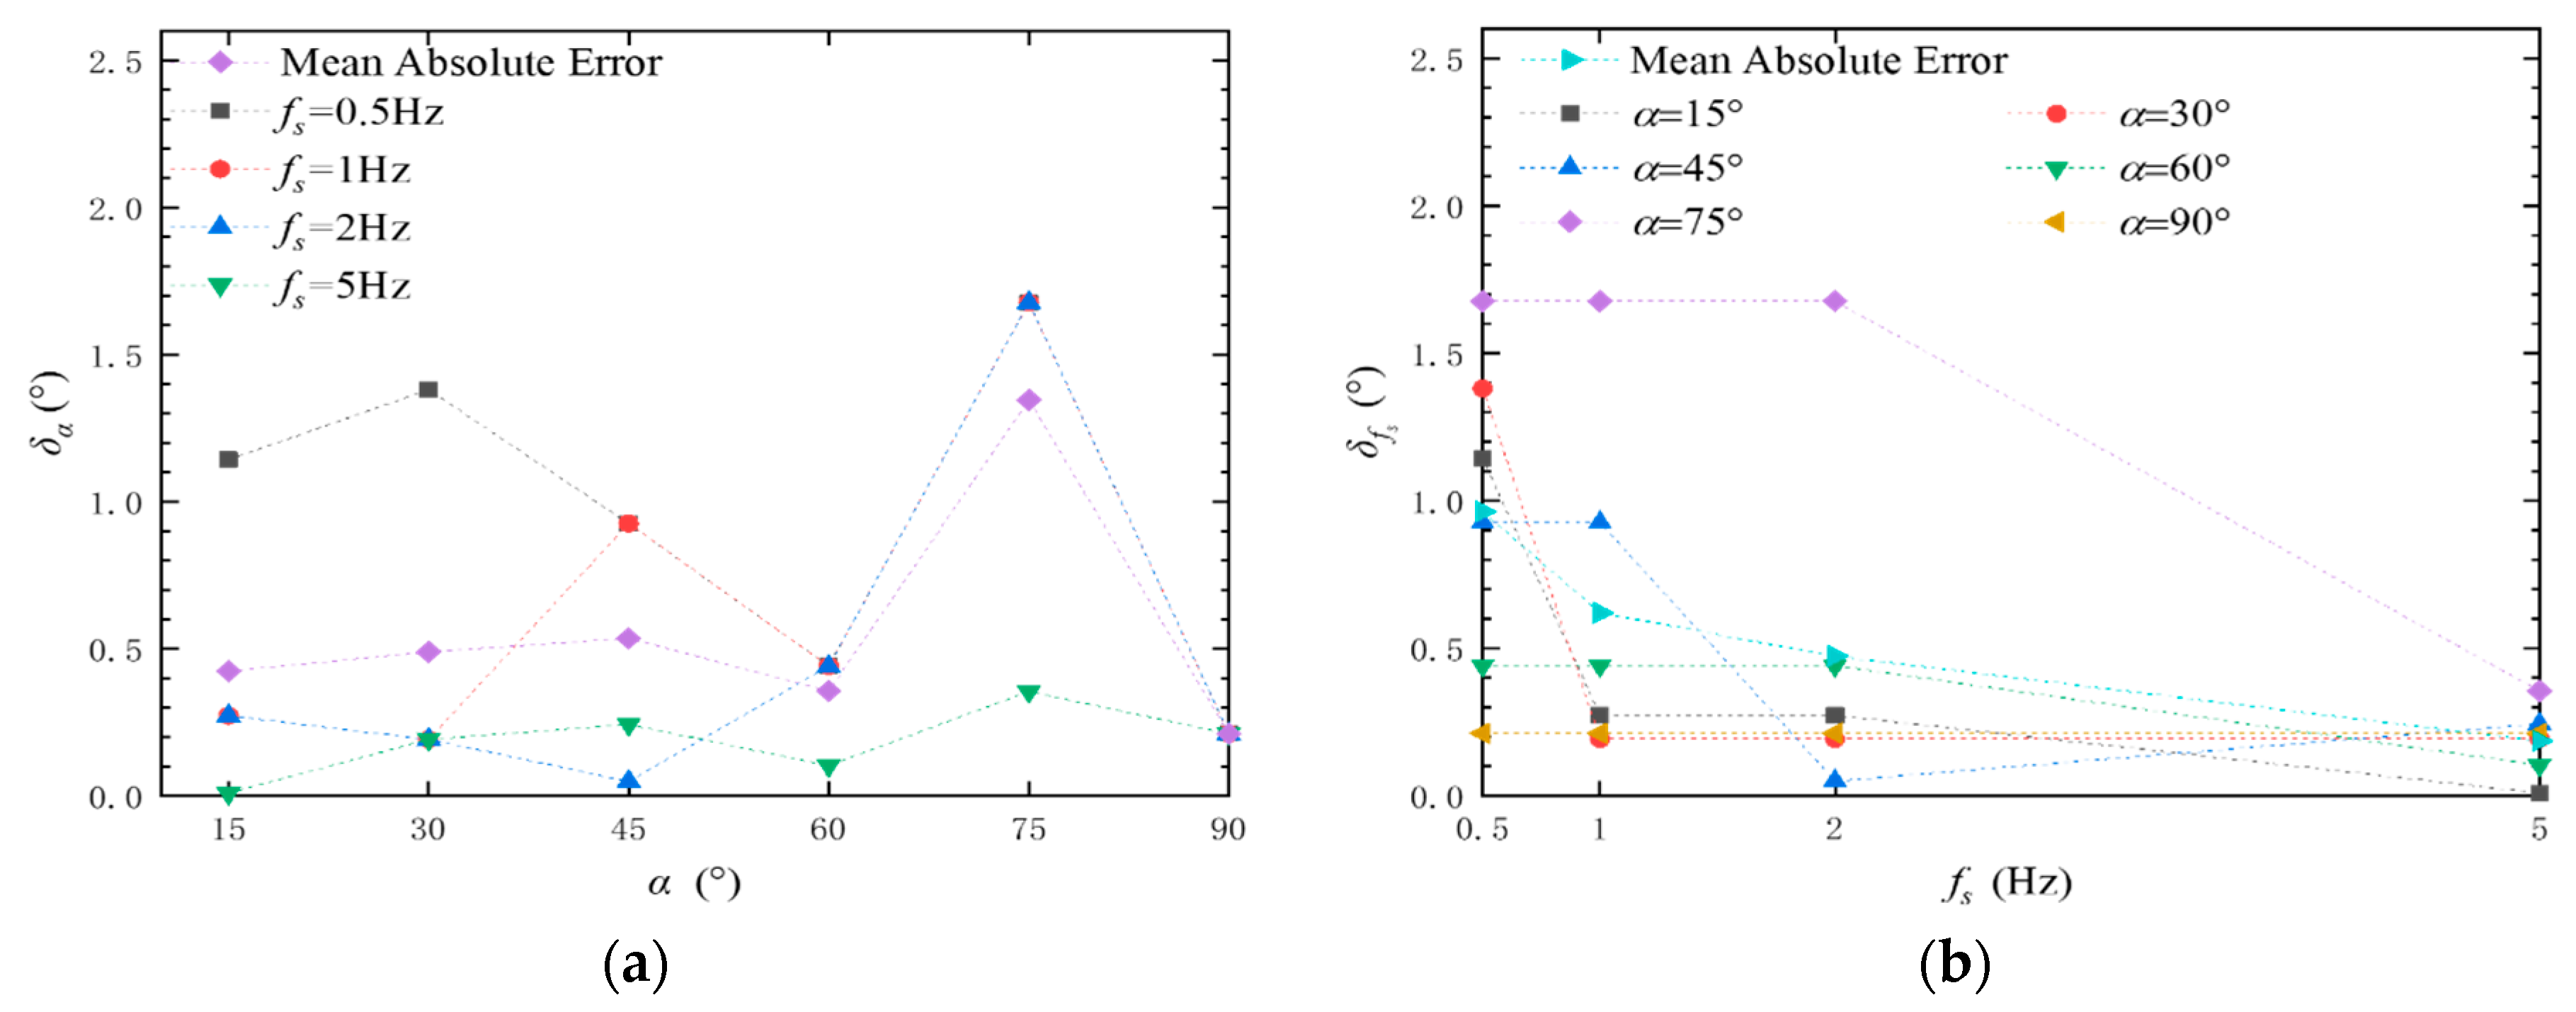
The absolute error
and
of the estimation results of the attitude angle in the simulation is shown in
Figure 5 for SNR = 10 dB with known target size. With the variation of the LOS angle and spin rate, one can see that the maximum absolute error is less than 2°, and the average absolute error is less than 1.5°. In particular, in a low-noise environment, our proposed approach is capable of estimating the attitude angle effectively. The accuracy control is within 2°, and the absolute error possesses its maximum at
α = 75° (see
Figure 5a). In addition, it is found that the absolute error for
α = 75° is significantly large, which implies that we should avoid the detection under this LOS angle. Instead, we need to select an LOS angle between 15° and 60°. This is called the best LOS angle window, in which the absolute error is less than 0.5°. It provides a scientific basis for arranging the optimal measurement strategy for high-precision satellite attitude angle measurement.
For an unknown target size, the estimation results for SNR = 10 dB and Δ = 15° are displayed in
Figure 6. With the variation of the LOS angle and spin rate, one can see that the maximum absolute error is less than 4.5°, and the average absolute error is less than 3°. The relatively larger error in the case of unknown target size stems from the twice edge extraction of TF spectra. It can be seen from
Figure 6a that when the LOS angle is between 15° and 60°, the mean absolute error is less than 2°. When the spin rate is low (0.5 Hz), the absolute error becomes larger. This is due to the smaller Doppler frequency shift induced by the slow spin.
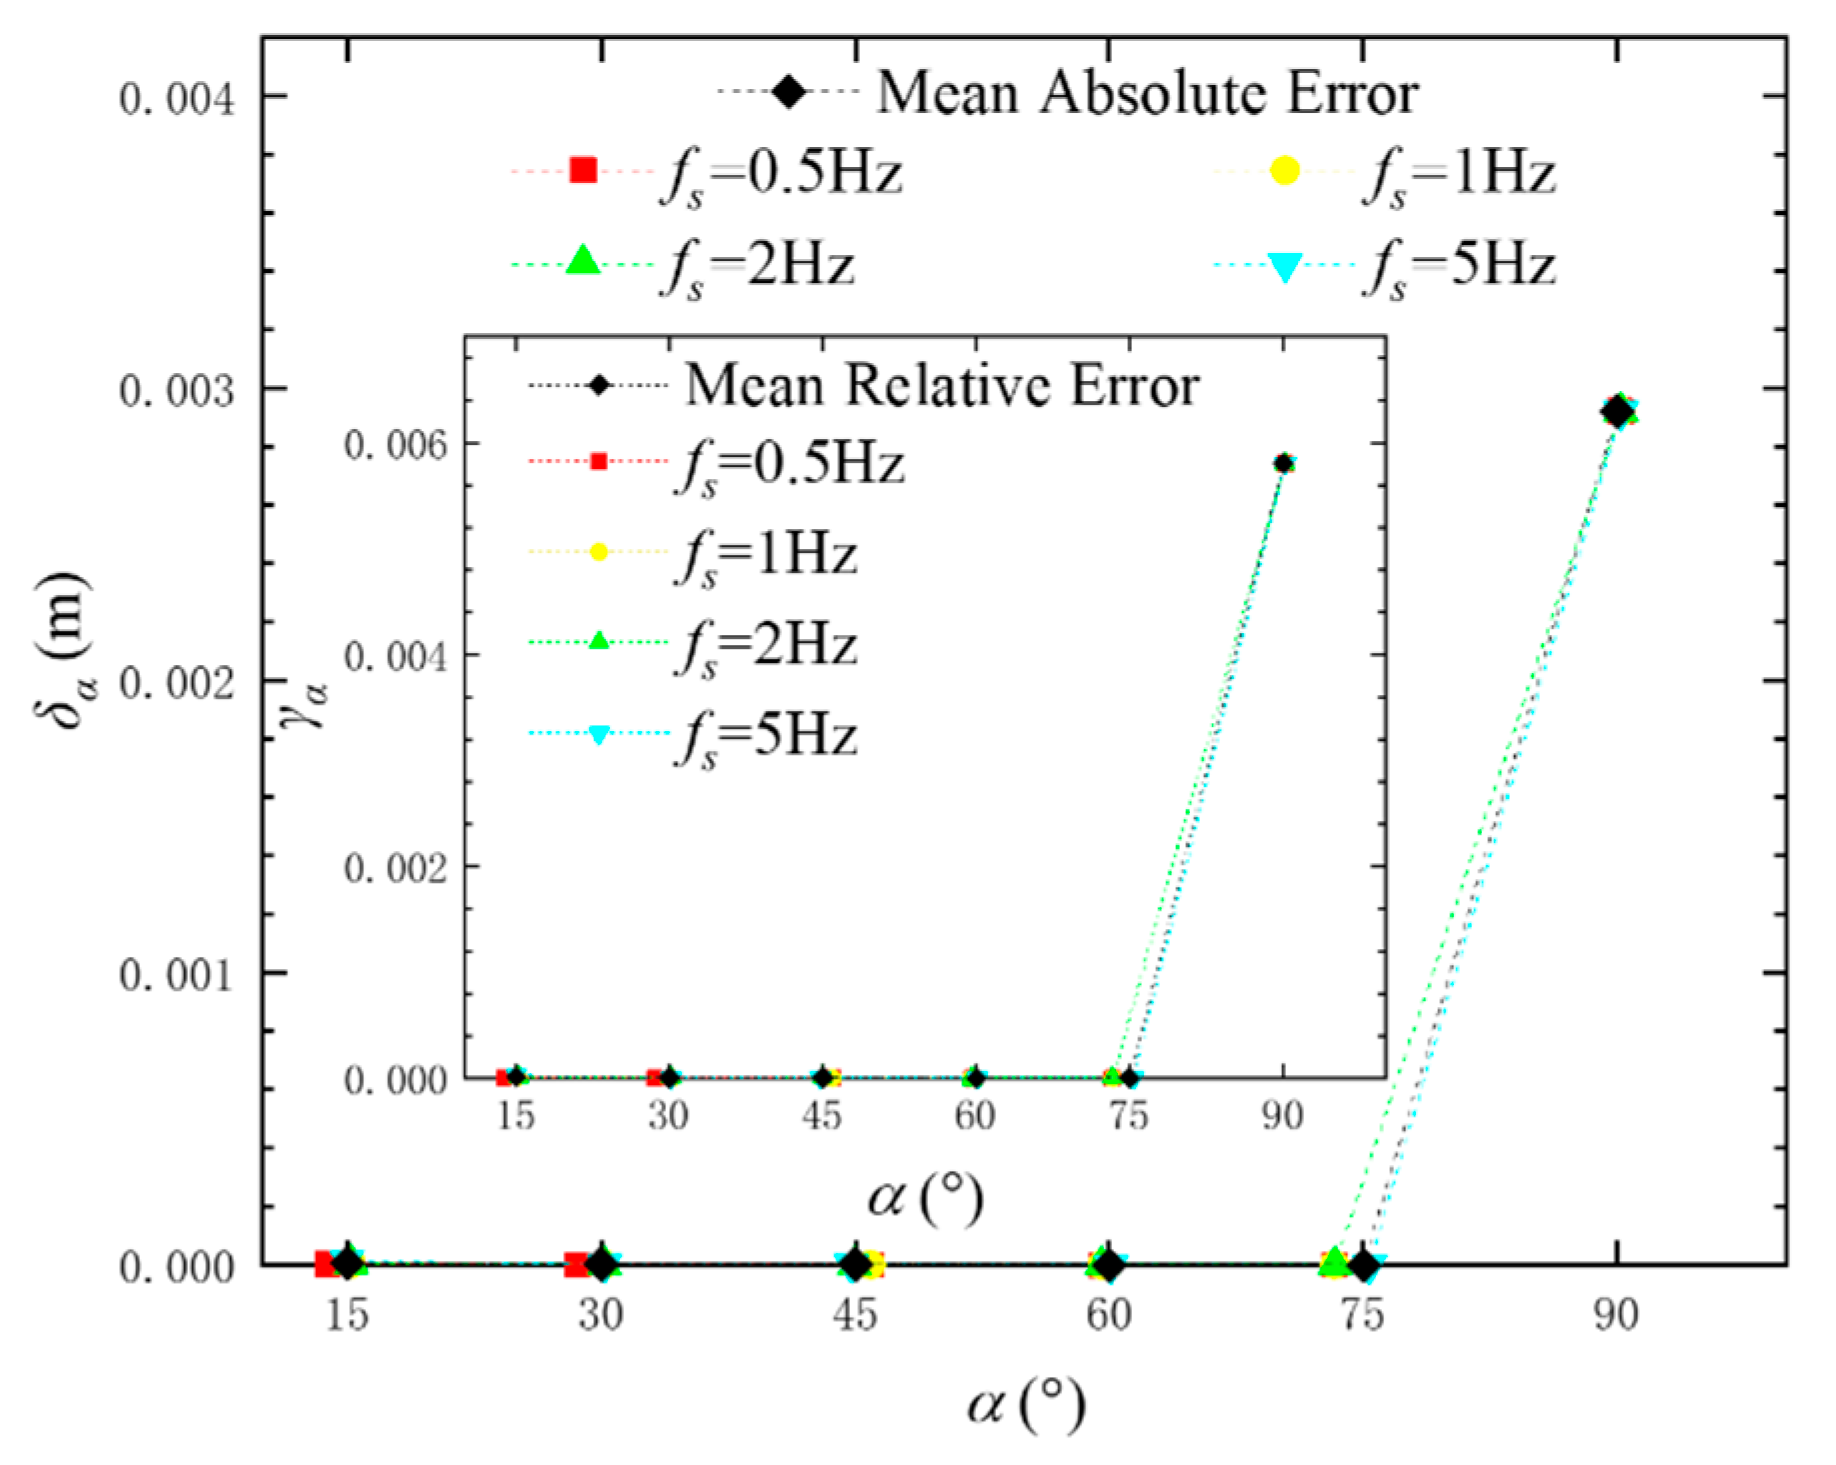
In addition,
Figure 7 displays simulation results of the side length estimation for
L = 0.5 m, and SNR = 10 dB. It can be seen from
Figure 7 that the maximum absolute error
of the estimated side length is less than 0.003 m. When the LOS angle is between 15° and 60°, the absolute error almost vanishes. In addition, the maximum relative error
of the estimated side length is no greater than 6% (see the inset of
Figure 7). In summary, one can obtain a high-precision estimation of the side length. This is because the estimation of
L is associated with the sine value of the attitude angle, which reduces the effect of attitude angle estimation on the error.
4. Experiment Results
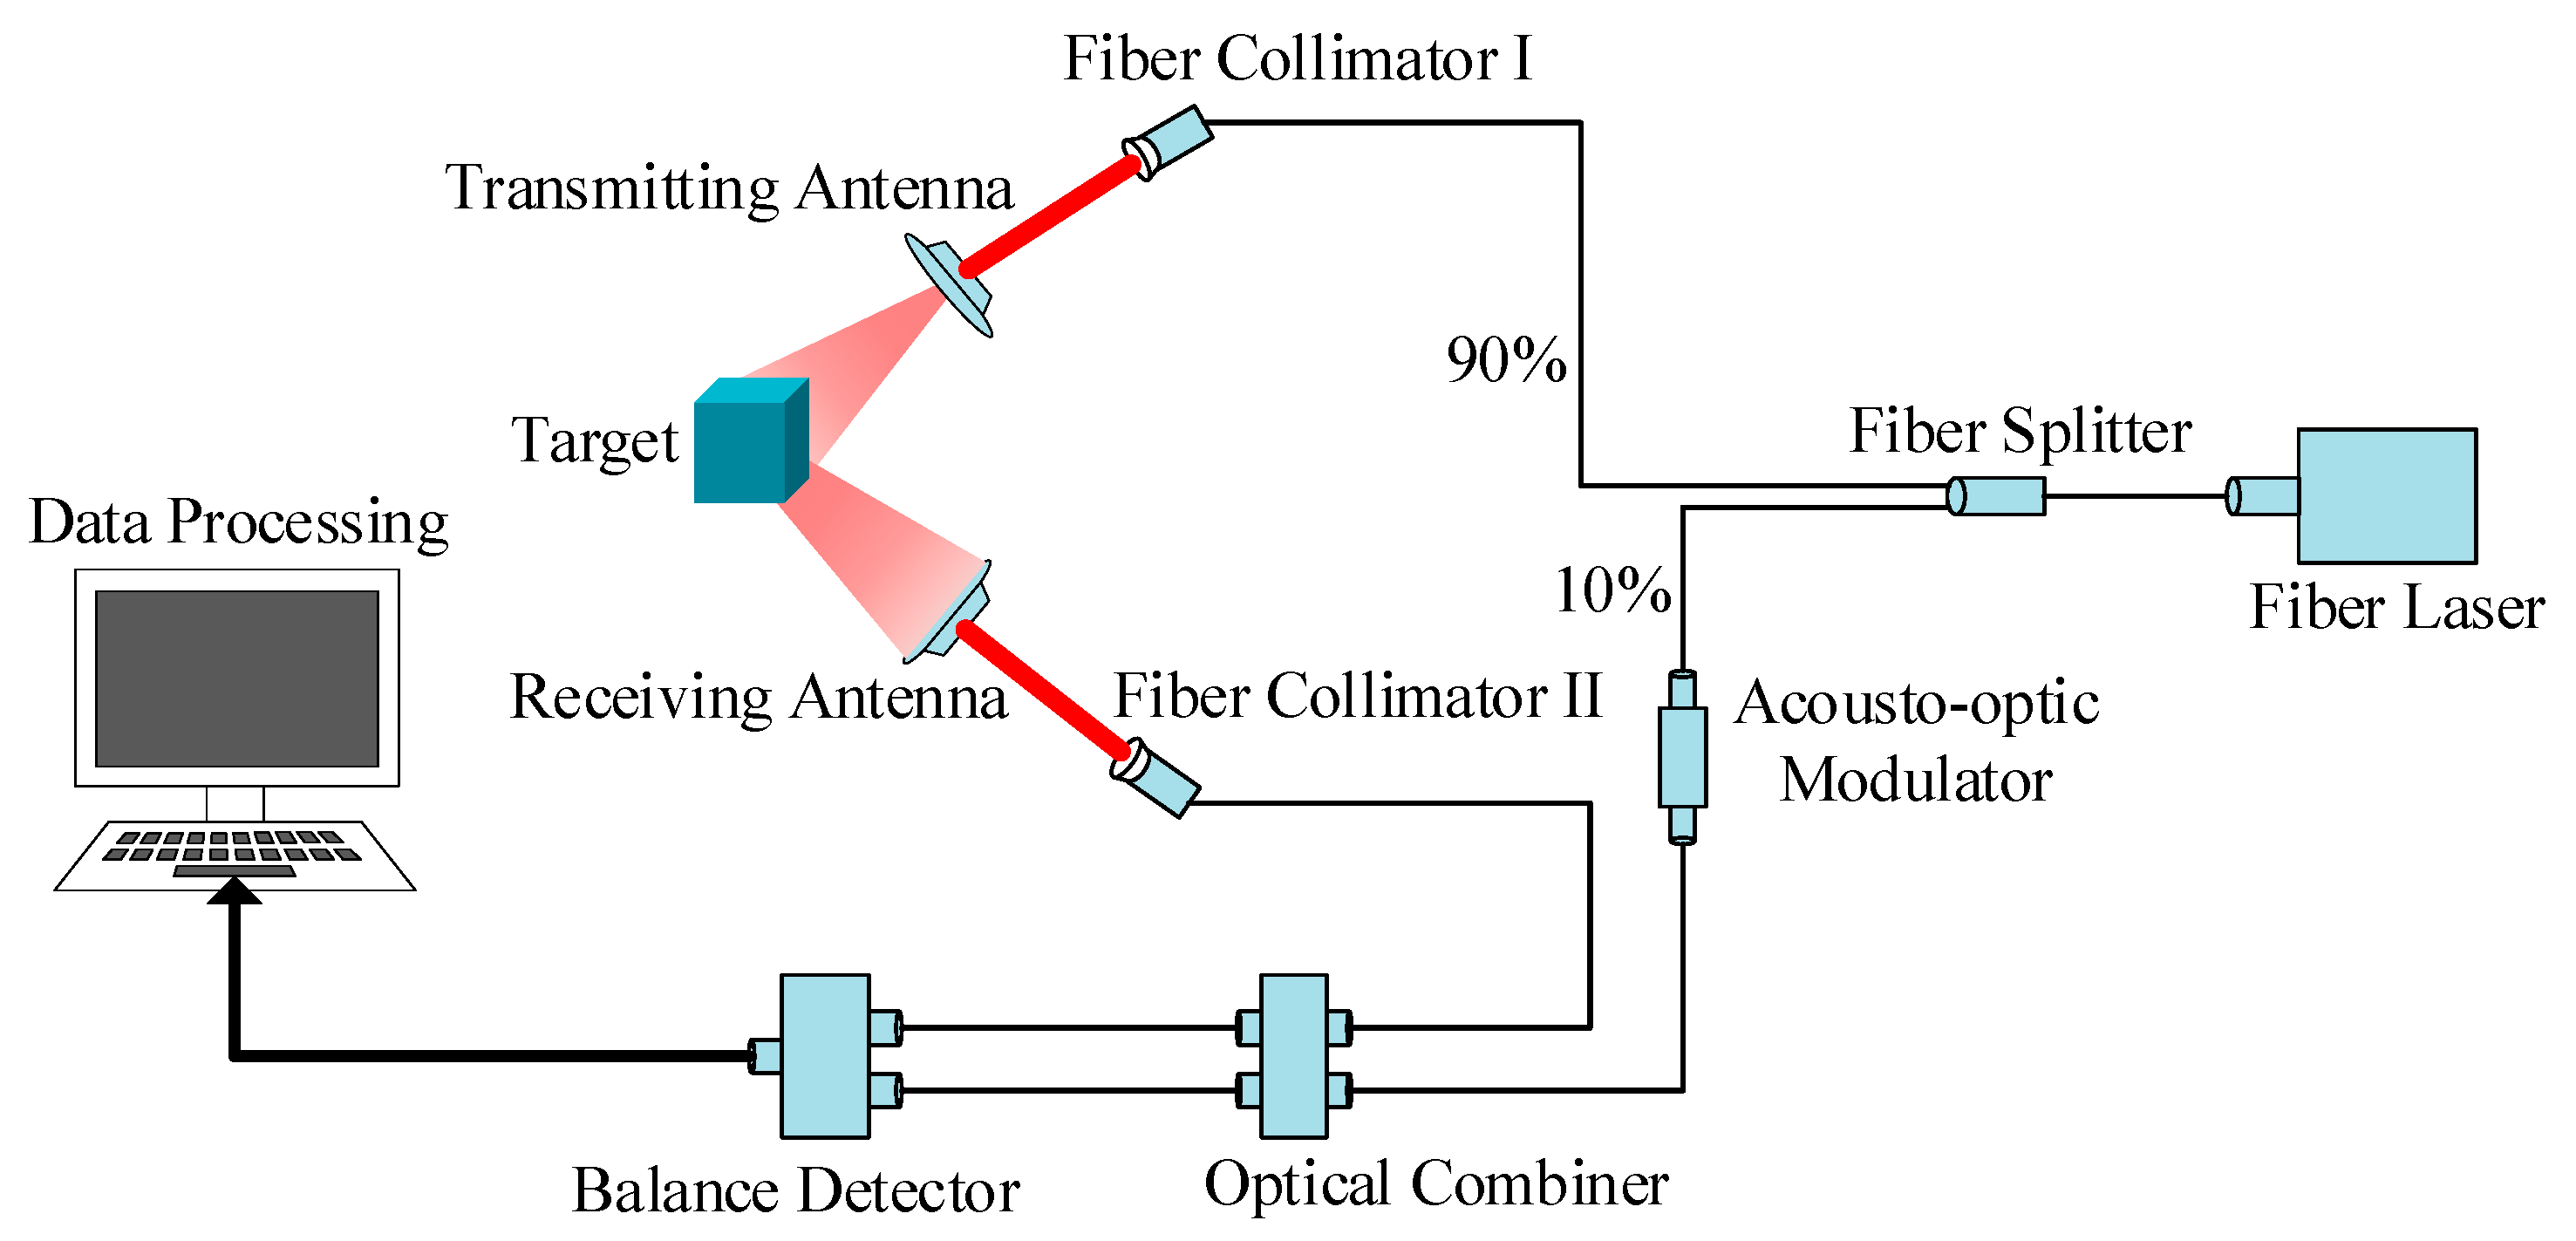
Besides the simulations, the relative experiments are performed as well to verify the proposed approach for pose estimation based on the laser radar system. The schematic diagram of the micro-Doppler detection system is displayed in
Figure 8. The system operates based on a coherent laser radar, and optical fibers are used throughout the system from the laser to fiber collimator I and from fiber collimator II to the photodetector. The output power of the optical source is 100 mW, and the laser wavelength is 1064 nm. The laser beam from the fiber laser is directed through a 10/90% fiber optic splitter. Then, the output of 90% laser beam is launched into fiber collimator I. The other output from the coupler is directed to the photodetector via an acoustic–optic modulator and optical combiner, where it is combined with the 10% end of the fiber optic splitter, and the final output serves as the reference light of interference. The diffused light from the dynamic target is collected by the light-collecting system and is coupled into fiber collimator II. The collecting diffused light, together with the reference light, generates the interference on the balanced detector, and then the output signals are transmitted to the digital storage oscilloscope. Through the GPIB interface, the oscilloscope is connected to the computer, and the data collection and final processing are operated by the computer.
In our experiment, a continuous current (DC) motor is employed as a tool to drive the rotating target and makes it perform a low-speed and uniform motion. Thereby, the experimental data consisting of rotational motion is obtained. In the coherent radar, the phase on the target’s return signal is sensitive to motion and micro-motion in the range. A half wavelength’s change in radial distance can induce a 360° phase change. Therefore, the Doppler frequency shift, which stems from the change in the phase function with time, can be utilized to detect vibrations or rotations of structures in the target by the return signal. In the experiment, as the target is spinning driven by the movement of the DC motor, the phase change with time results in the special Doppler frequency shift [
6,
15]. The interference caused by the joint modulation of the rotational motions translates into electrical signals via the photodetector, and the electrical signals are transmitted to the digital storage oscilloscope. Eventually, the data collection and final processing are managed by the computer.
In order to examine the feasibility of our method, the cube surface composed of different materials (i.e., resin, aluminum alloy, and fiber-reinforced polymer) is investigated. The target size is selected as 5 mm × 5 mm × 5 mm to match the size of the laser spot. The reduction of the target leads to a decrease in the Doppler frequency shift. To ensure the resolution ability in the time and frequency domain, the frequency resolution and temporal resolution are set as 2 kHz and 5 ms, respectively. In addition, other parameter settings are displayed in
Table 3.
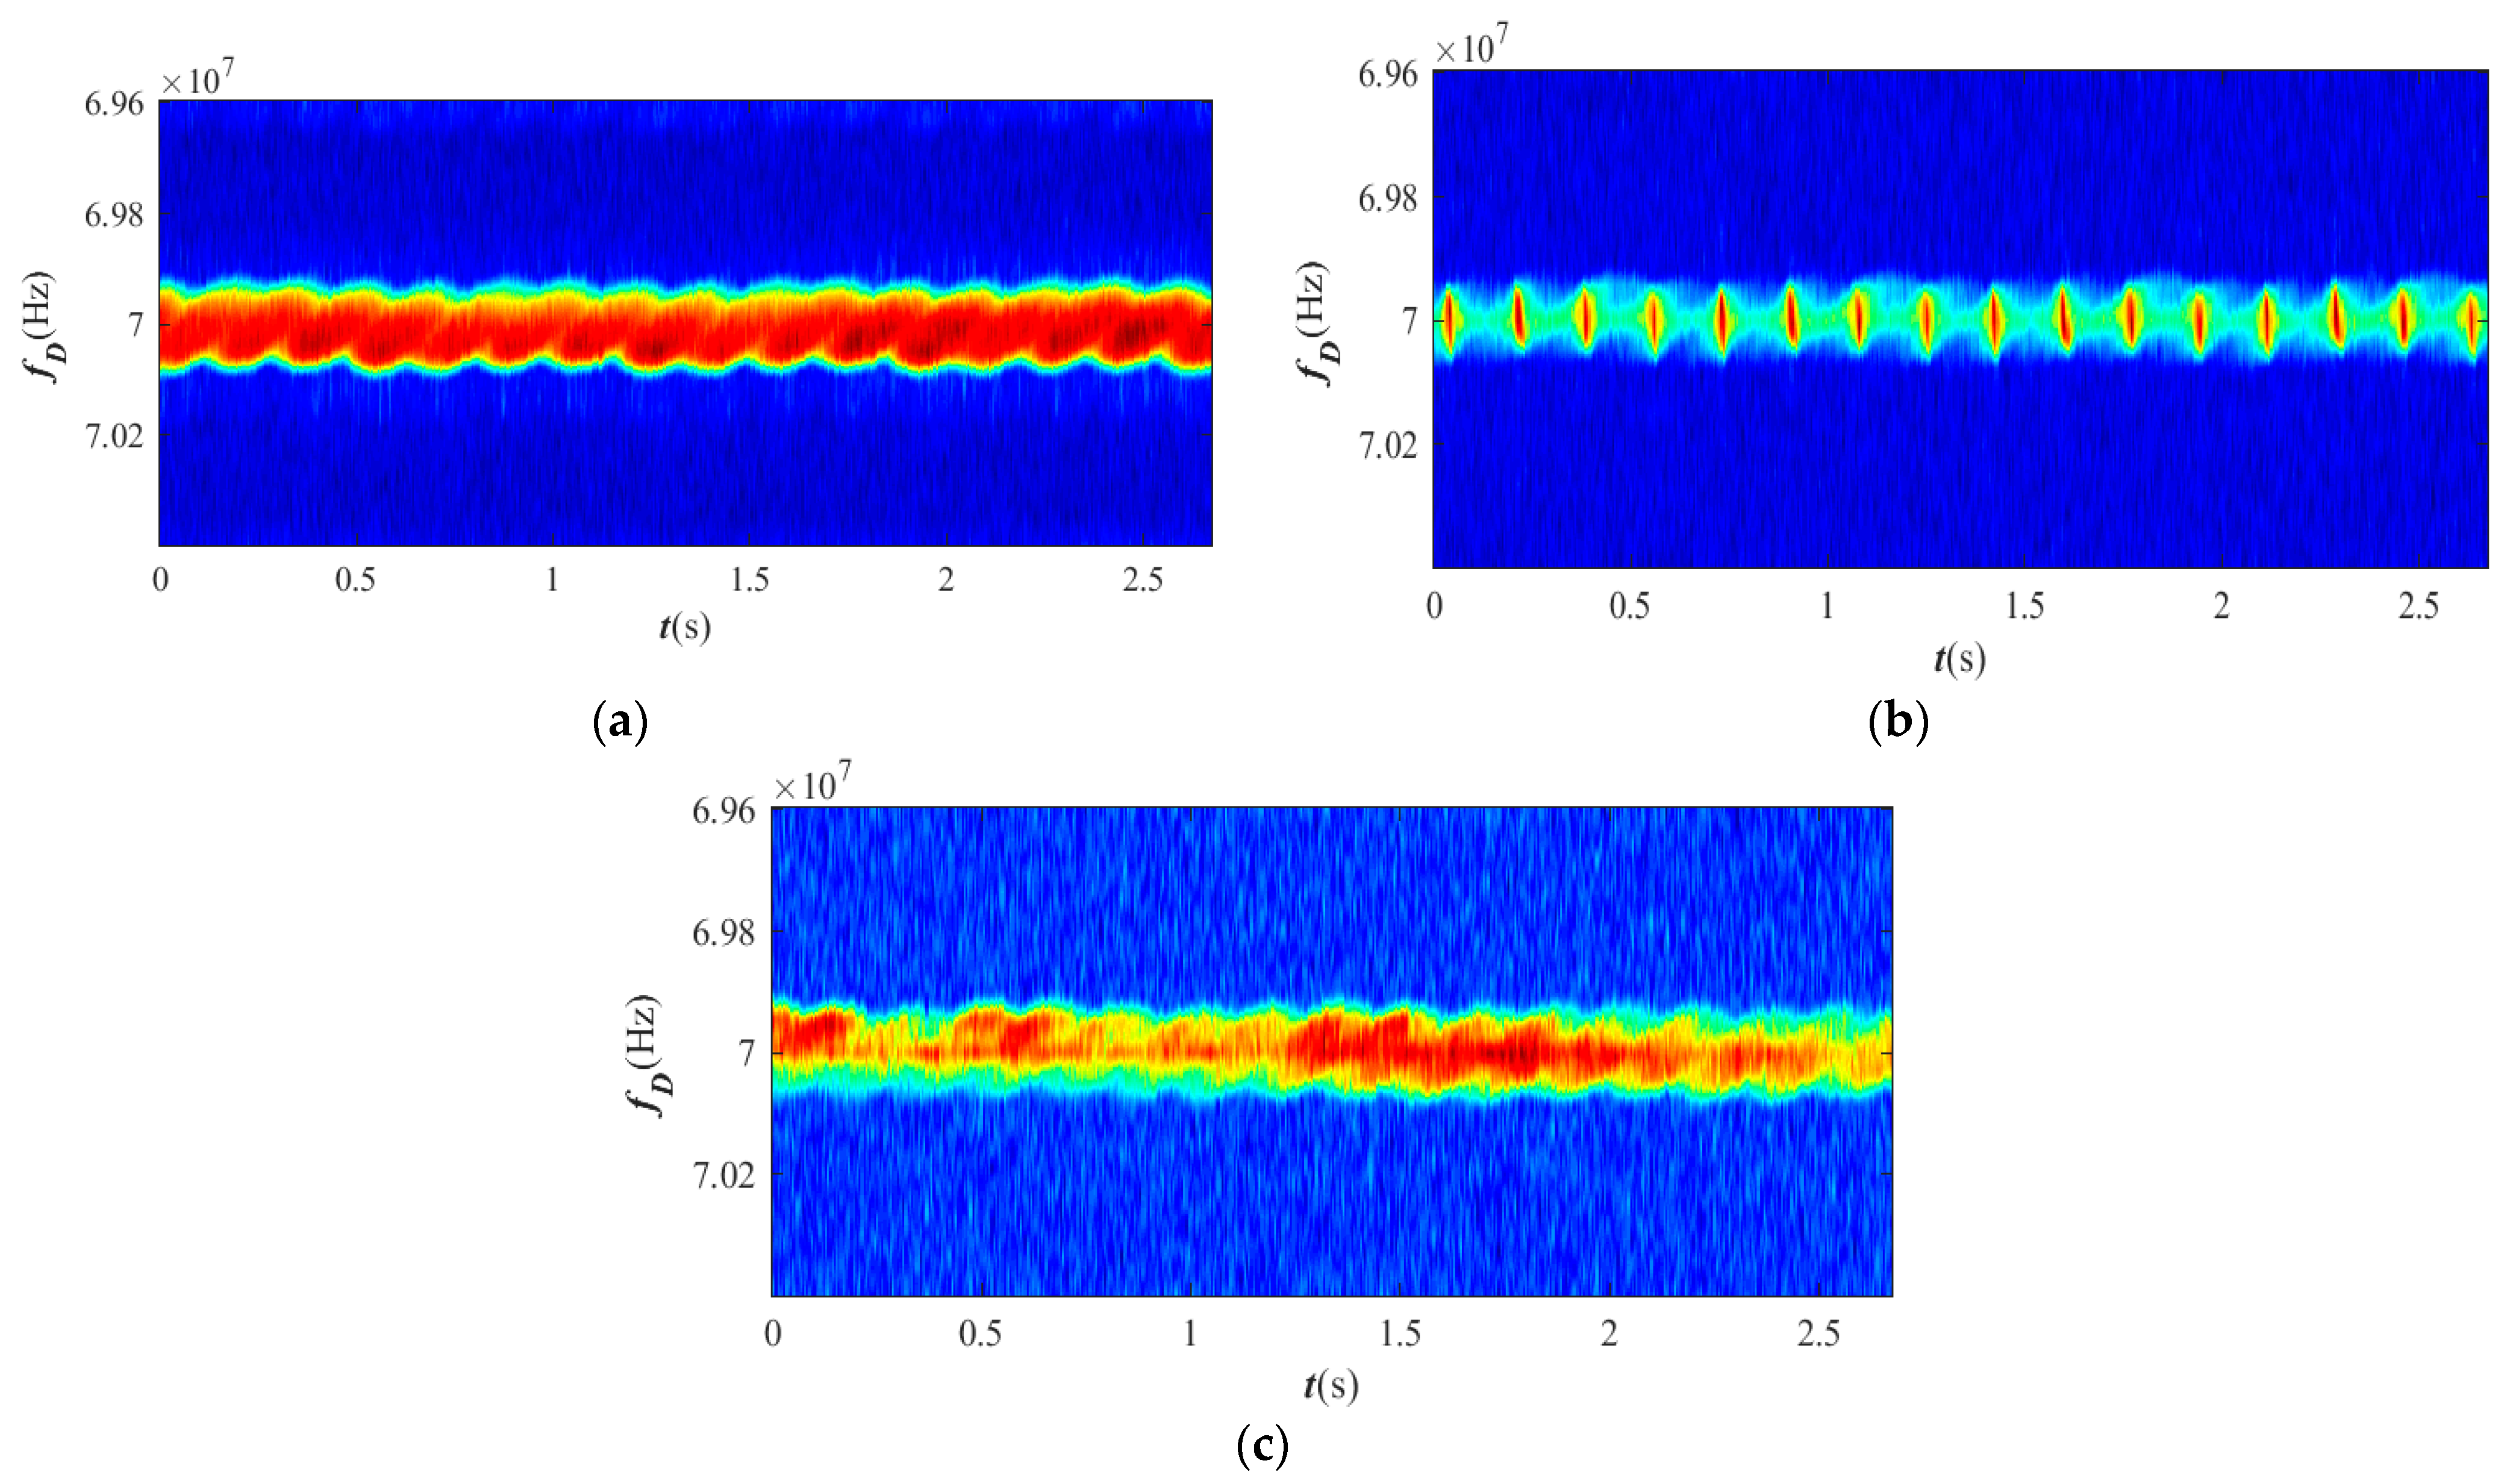
Figure 9 shows the TF diagrams of echo signals of the cube targets with the surface made of different materials for an attitude angle
α = 45° and a spin rate of 1.4 Hz. It can be seen that due to the different laser scattering properties of different materials, the color of the TF diagram is quite different. Among them, the vertical patterns periodically appeared in
Figure 9b stem from specular reflections caused by the surfaces of the aluminum alloy. It should be noted that the outlines of the three TF diagrams are not much different. In particular, there is almost no gap between the outlines of
Figure 9a,c. To sum up, the TF diagram with periodicity can be obtained for the targets made of different materials.
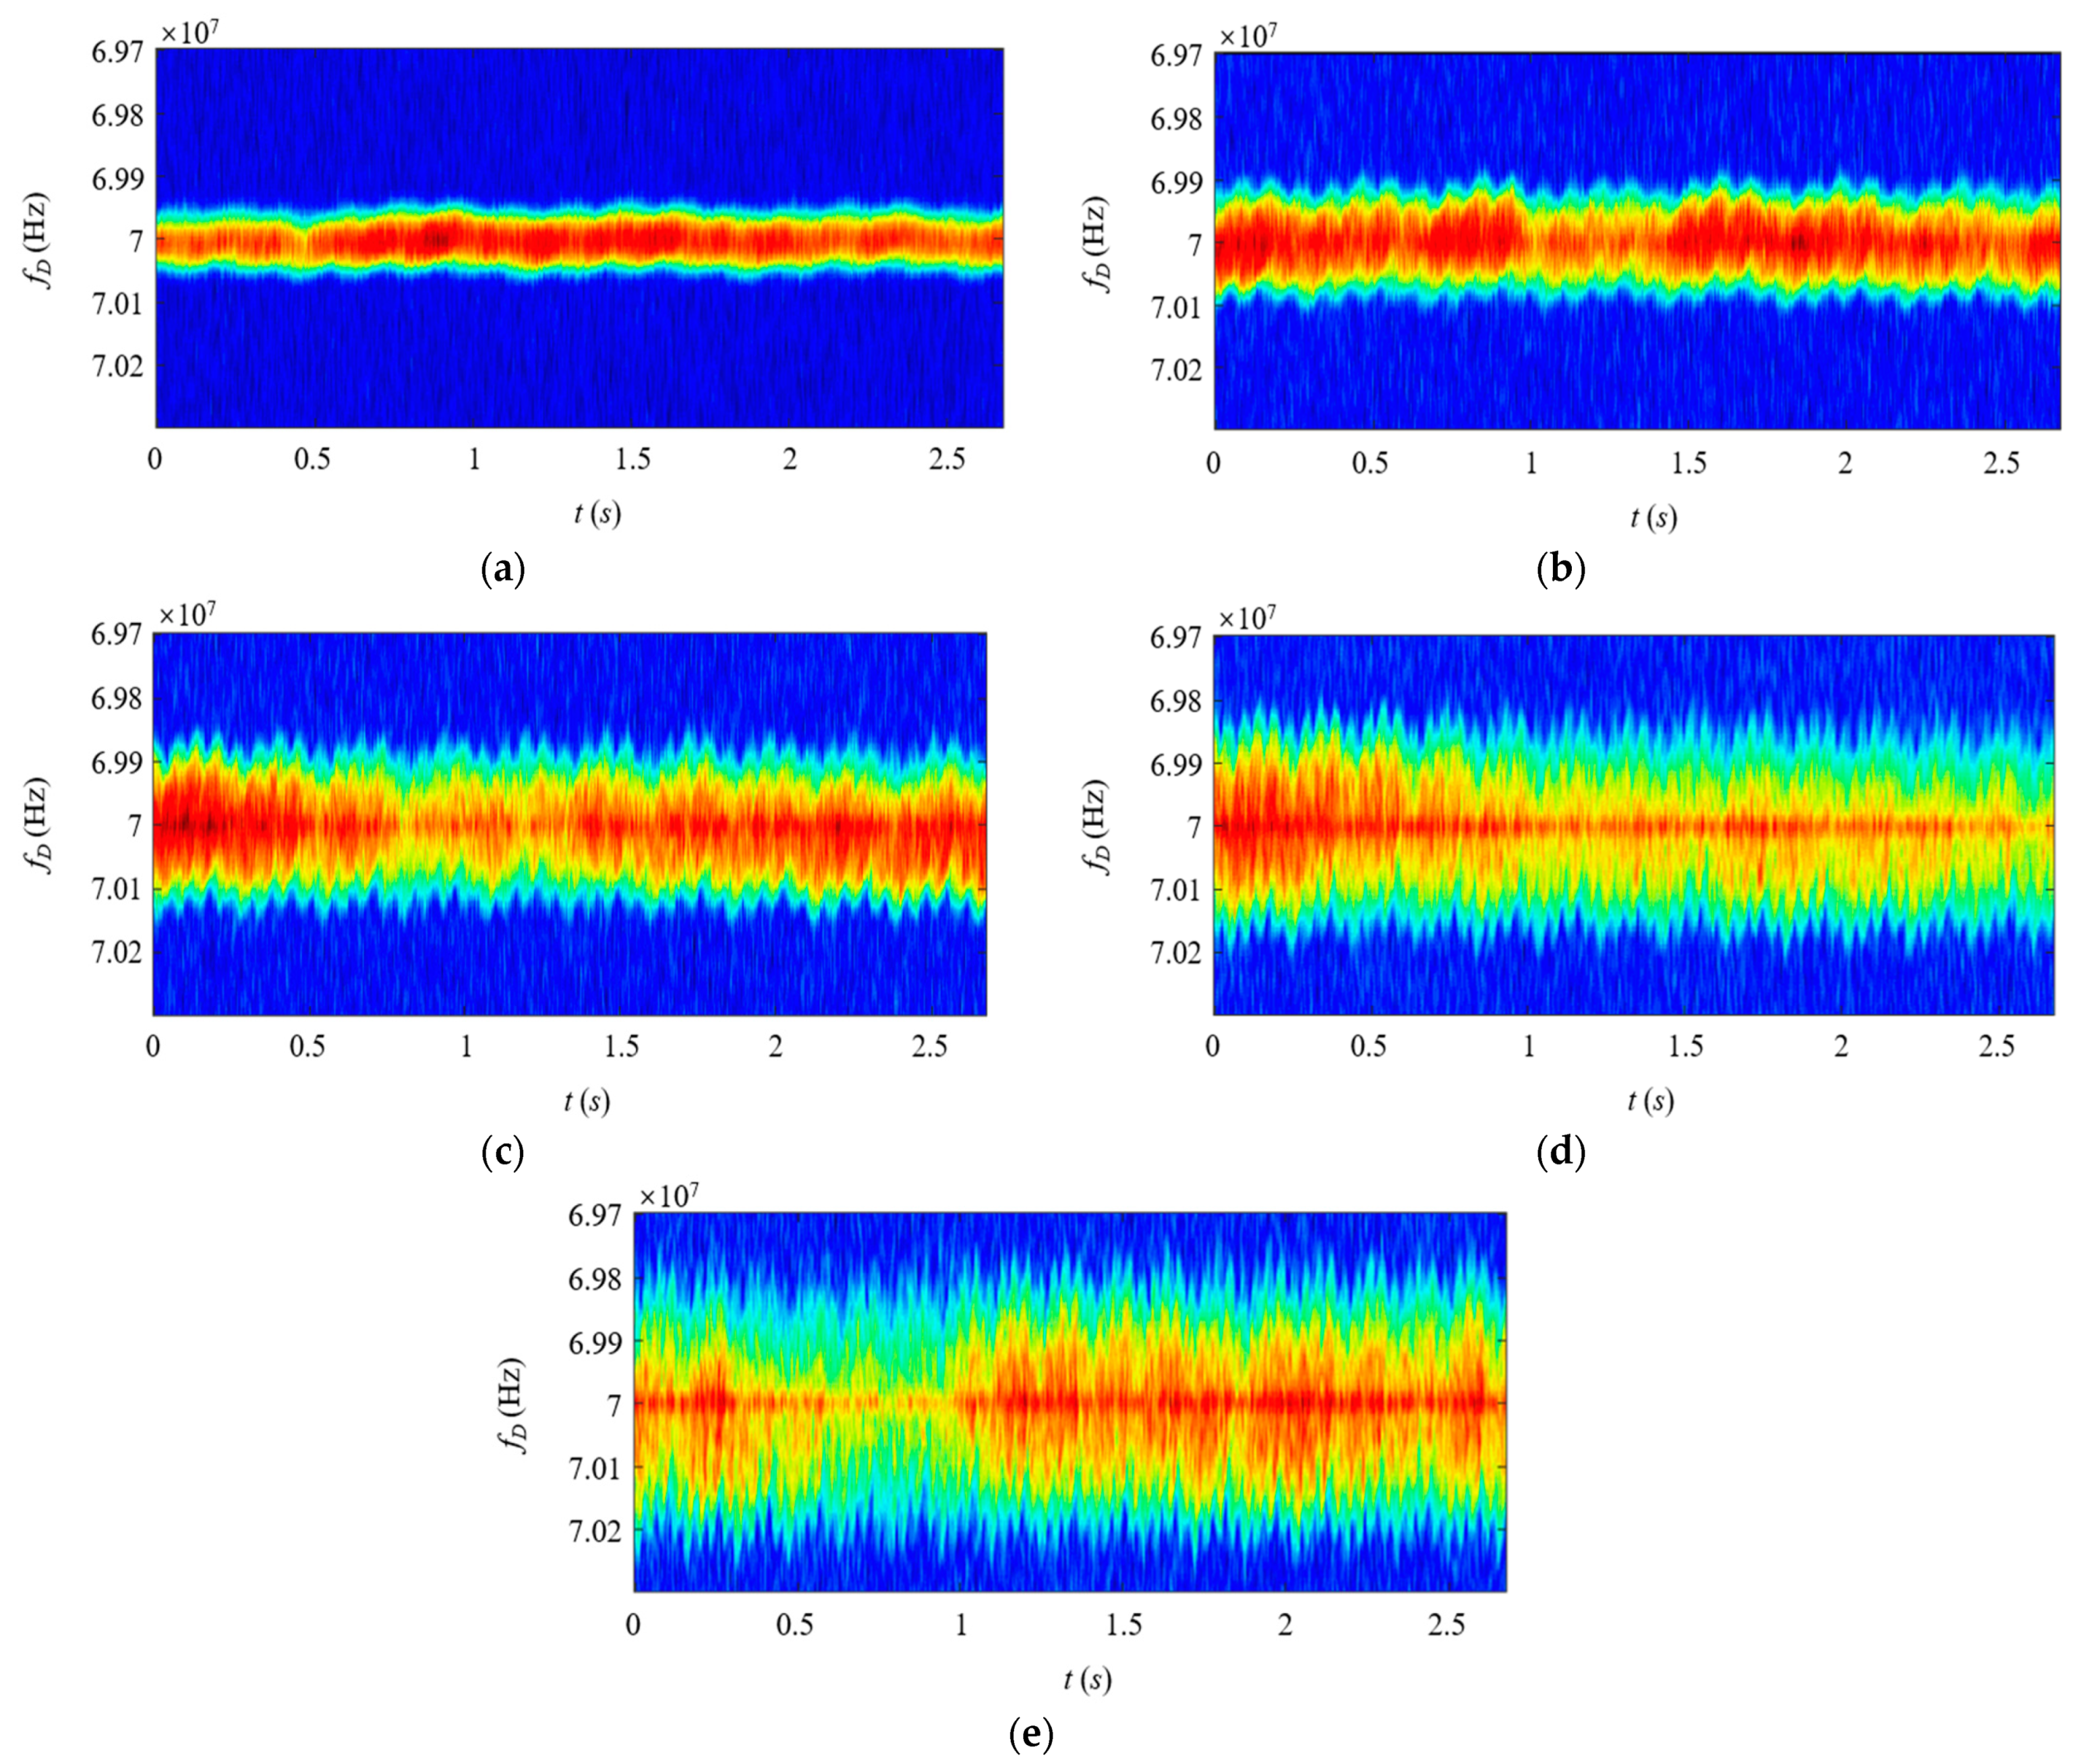
The influence of spin rate is displayed in
Figure 10, which illustrates the TF diagrams of the echo signals at different spin rates (1.4 Hz, 2.5 Hz, 3.8 Hz, 5.0 Hz, and 6.4 Hz, respectively) for attitude angle
α = 45°. Equation (15) indicates that larger spin rate results in a more significant Doppler frequency shift. As Equation (15) predicts, it can be observed that when the spin is slow (control voltage equals 6 V, and the spin rate is about 1.4 Hz), the TF feature is insignificant (see
Figure 10a). When the spin becomes faster, the periodicity can be clearly observed (see
Figure 10b,c). The edge in the TF image is explicated and smoothed, which implies that the laser spot covers the whole target, while in
Figure 10d,e, the appearance of the significant burs originates from the strong noise. The TF image becomes dim, which may be due to the reduction of the echo signal from each surface of the target. In our experiment, the spin rate of the target is controlled by the DC voltage. There exists a linear relation between spin rate and the control voltage. The estimation of spin rate according to our proposed approach is illustrated in
Table 4. The maximum absolute error for the extraction of spin rate is less than 0.2 Hz, and the maximum relative error is less than 7.0%.
In addition, the effect of the attitude angle is investigated. Here, the control voltage is set to 15 V. The attitude angles are given three values: 15°, 30°, and 45°, respectively. Other parameters are shown in
Table 3. Equation (15) shows that a larger attitude angle leads to a more significant micro-Doppler frequency shift. The TF diagrams obtained in the experiment are displayed in
Figure 11. It can be seen that for a given spin rate, the micro-Doppler frequency shift
fD grows with the increase in attitude angle
α, which agrees with the theoretical prediction. In addition, the time-frequency diagram also flattens out as the angle increases. The estimation of attitude angle is performed as well.
Table 5 presents the measurement results of
α. The maximum absolute error of the attitude angle estimate is not more than 3°, and the relative error is less than 6%. For the case of the unknown target size with the attitude angle
α = 15° and Δ = 15°, one has
f1 = 0.042 MHz and
f2 = 0.082 MHz, respectively. Furthermore, the estimated result of the attitude angle is obtained as 14.7015° according to Equation (21) with a relative error of 1.99%. Combined with Equation (22), the estimated result of the side length of the cube target is 5.1814 mm with a relative error of 3.63%.
5. Conclusions
The pose estimation of long-distance CubeSat is a difficult problem for autonomous rendezvous and track maintenance. In this paper, in order to achieve high-precision motion estimation, we propose an approach for the pose measurement and motion estimation of CubeSat based on the micro-Doppler effect by a laser radar system. Parameters such as spin rate and attitude angle can be estimated using data extracted from the echo signal. By utilizing adaptive threshold processing based on the least square method, edge extraction in the TF image can be achieved effectively. When the target size is unknown, the double edge ratio method (DERM) is proposed to obtain the attitude angle α. The simulation results show that when the noise is weak enough, the spin rate and the attitude angle can be acquired precisely. Our experiment results show that the accuracy of spin frequency measurement with a relative error of 2.41% and an attitude angle measurement accuracy with a relative error of 3.5% can be acquired. This means that the estimation of spin and pose by our approach can fulfill the demand in practice.
In the future, we will continue and focus on further work on non-cooperative targets such as tumbling satellites, space debris, or asteroids, which are central concerns of the national aerospace community. We hold a positive attitude towards the application of this technology in the field of space security control in the future.


 ,
, 


