1. Introduction
About two decades ago, it was hard to believe that a car can be self-driving; however, Tesla is in the mainstream of self-driving today. Compared to self-driving, the techniques used in unmanned stores are similar and will become popular in the near future.
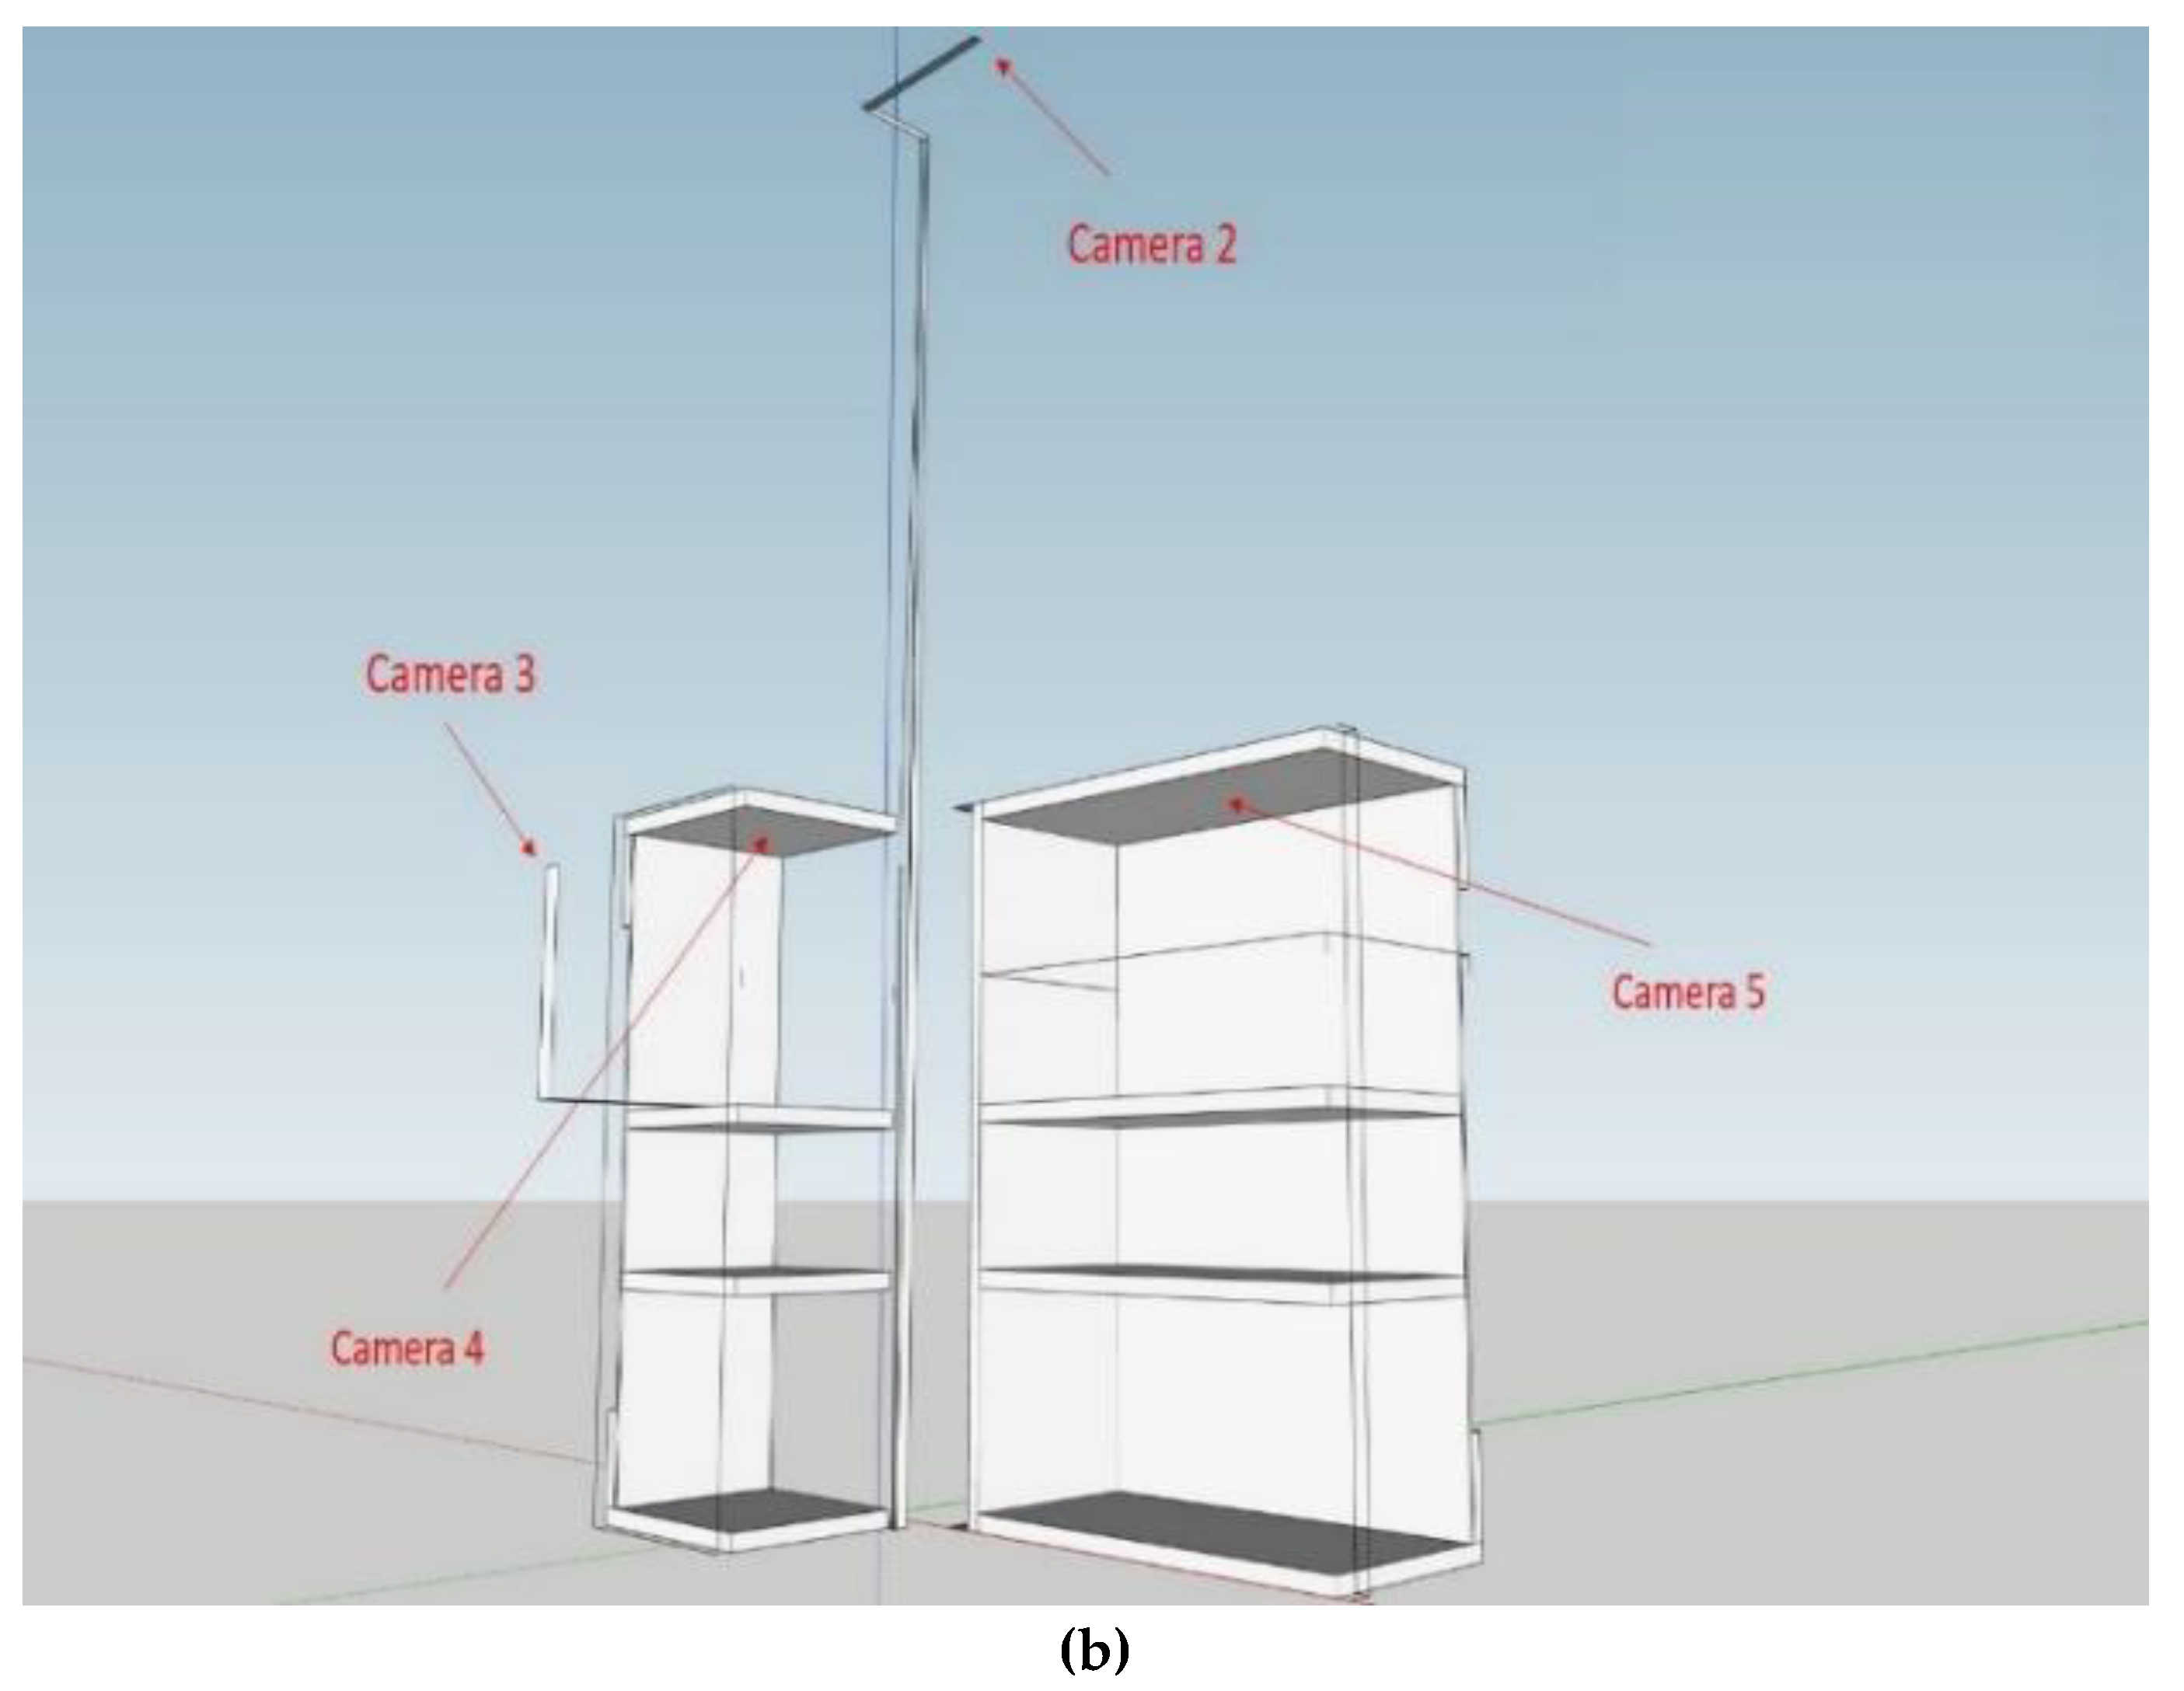
As for saving the labor, there are many chain stores that are going to invest in unmanned stores, including FamilyMart and 7ELEVEN in Taiwan, Amazon in the United States, Alibaba Group in China, Bingo Box, Xingli, Guoxiaomei, F5 Future Store, etc. A shortage of funds is not serious for e-commerce stores but is fatal to small startups. How to balance the cost and the profit will currently be the biggest challenge for unmanned stores. In this paper, we focus on the premise of low cost and high recognition accuracy of products to solve the problems faced in unmanned stores. As for reducing the number of sensors used in the store, we only used five cameras to solve the problems of product identification, theft detection, and stacked product identification, and finally, a stable and reliable unmanned store system was successfully constructed.
In the unmanned store, in order to recognize the behavior of the customer, we define the “event” as identification.
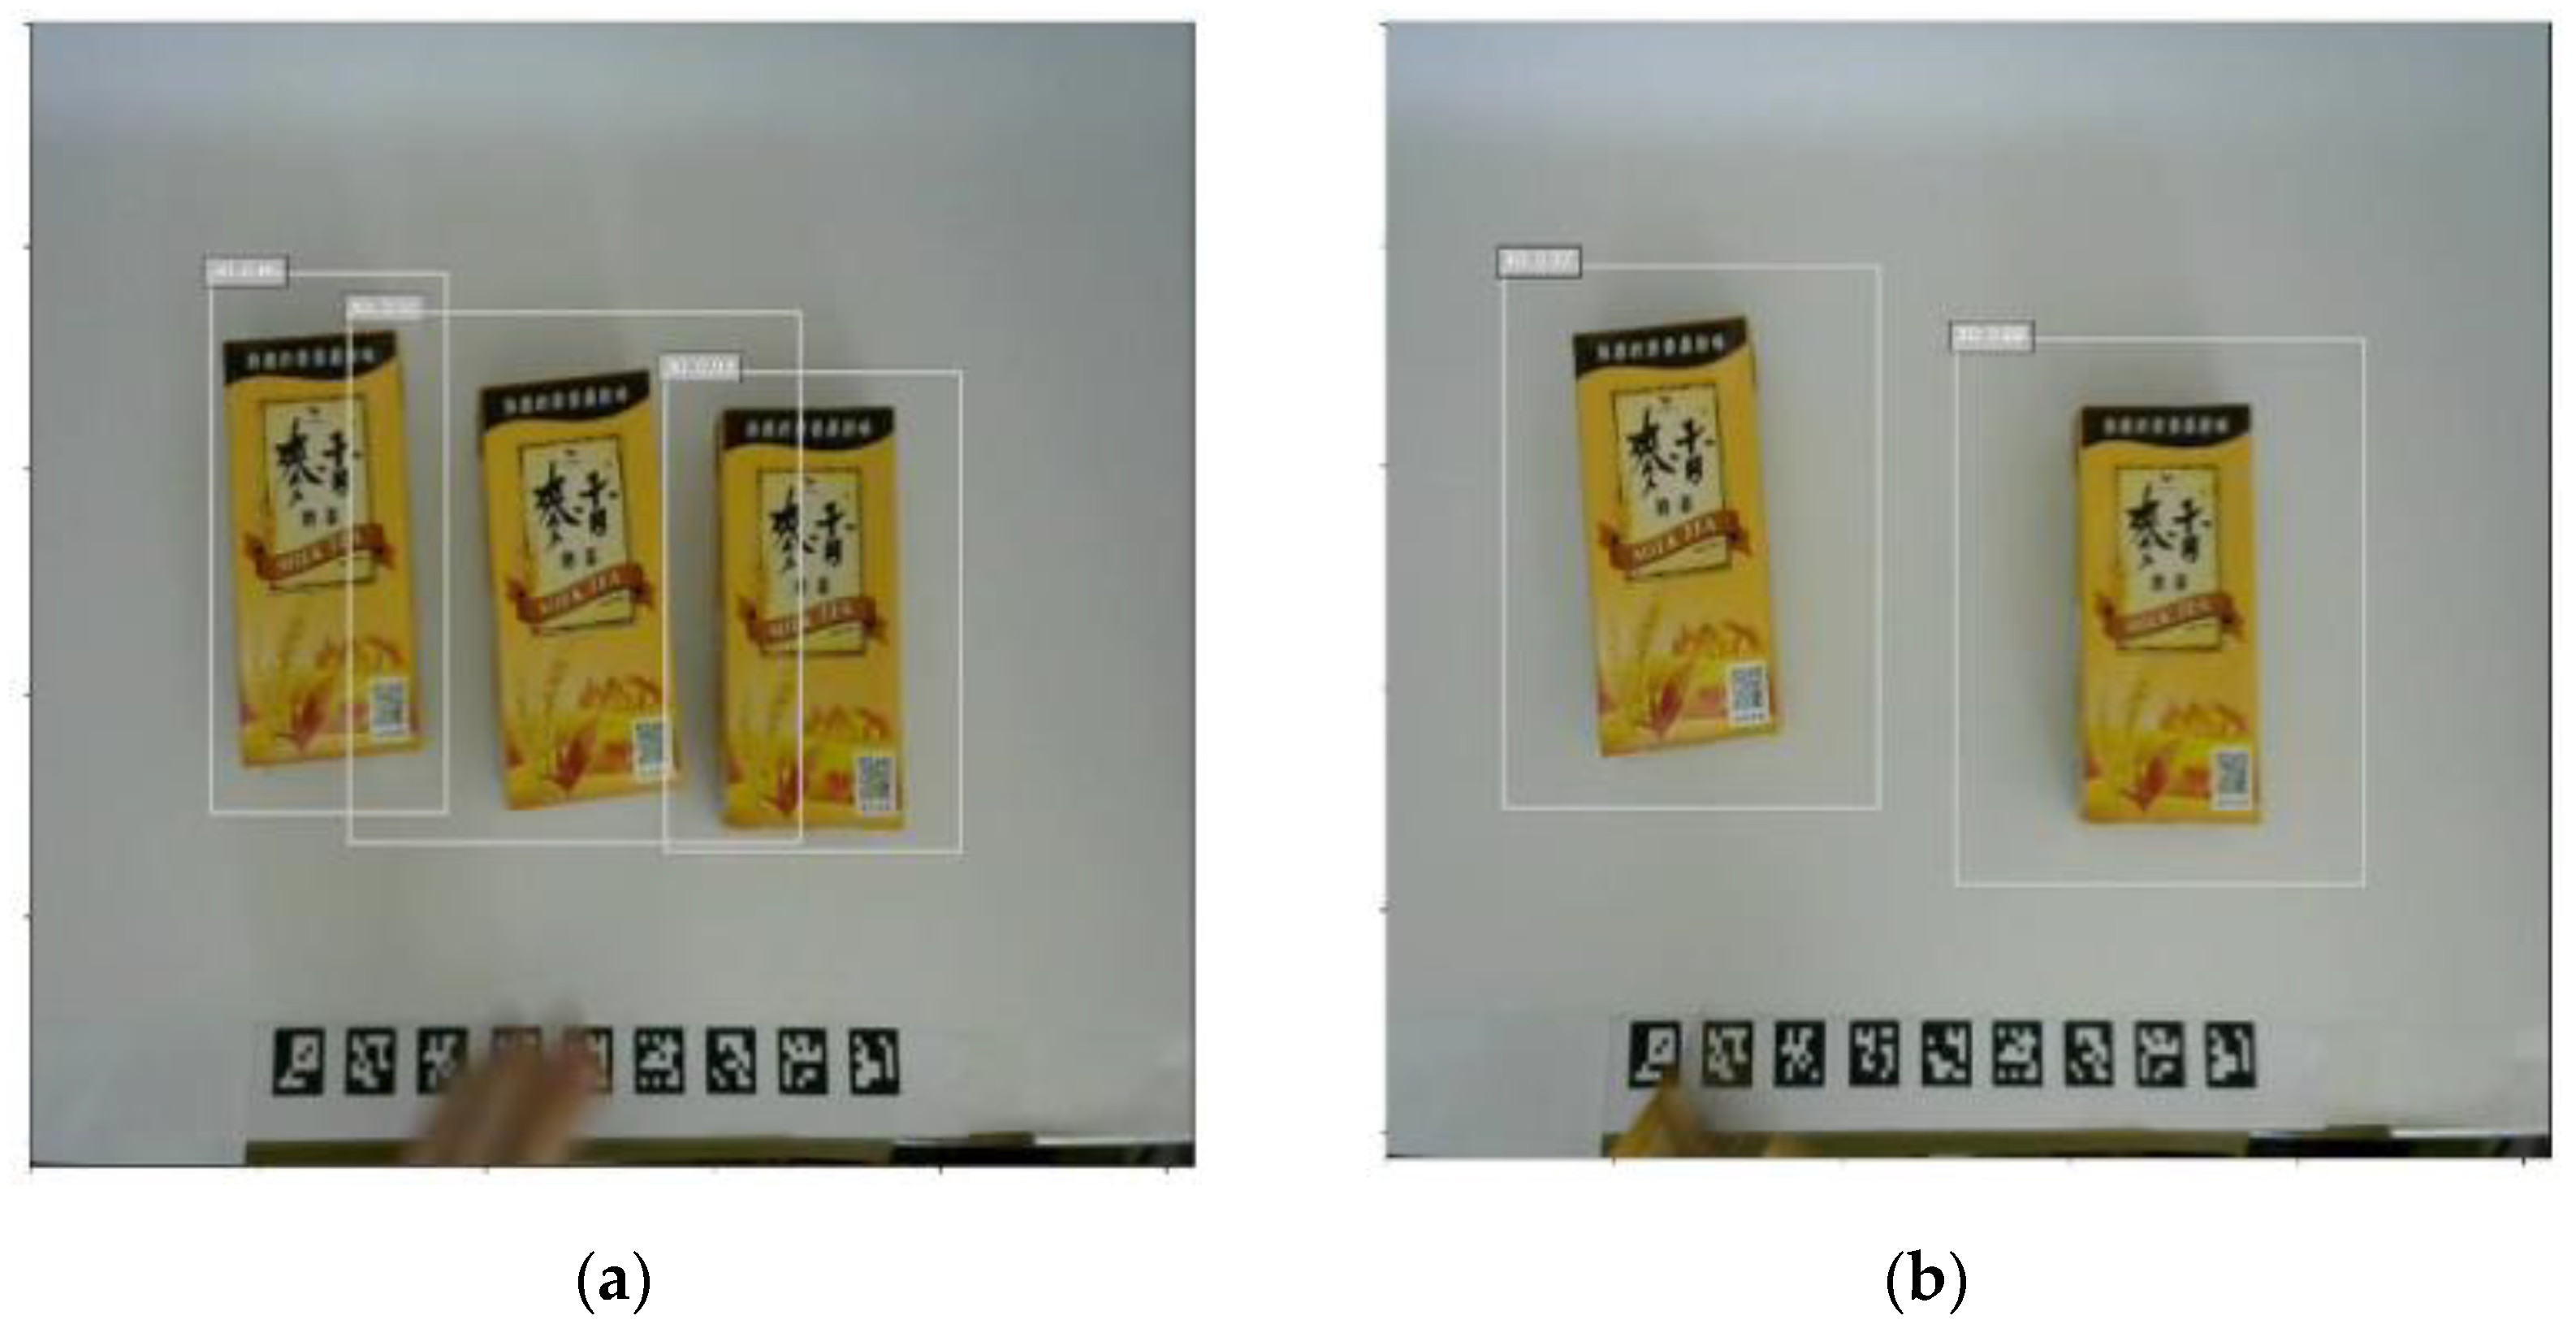
Figure 1 shows the images before the event and after the event. As can be observed, based on the images before the event and after the event, we can deduce how many products were taken out or put back by the customer through classification technique [
1]. Who triggered the event? The shopping car list of the one who triggered the event would be modified. How to recognize the customer by face recognition technique is another key point in the unmanned store [
2,
3].
The contributions of this paper are summarized in the following:
We built the most light-weighted unmanned store identification systems for the unmanned store. We combined multiple models in sync to create this system, which covers the integration of multiple deep learning models and computer vision technologies. This will create a high-accuracy, low-cost unmanned store, and solve the problems that stores often encounter.
Most stores encountered problems such as having to retrain the deep learning model once a new product had arrived, and were not able to calculate the total amount accurately once the products were being stacked. The YOLO’s model and the Siamese Network combined together can recognize new products without retraining the system.
Using two cameras, the system can calculate the total amount among the stacked products.
In terms of securing customer identification, we use the human posture estimation model to identify the shopping behavior of customers and to identify the customers. In addition, we have achieved the shopping scenario of taking the goods and leaving without a cashier.
All techniques used in this paper will be described in detail in the following sections.
2. Related Work
We all know that deep learning is a good technique in image classification, identification, and clustering, and all techniques developed previously could be used for the unmanned stores [
1,
2,
3]. In order to enhance the correctness used in unmanned stores, some companies such as Amazon Go used a lot of micro sensors, sound detectors, an echo positioner, and a face recognizer, in order to try to reduce errors to be as small as possible. However, sensors are quite expensive and very harmful for the construction of unmanned stores. Instead of using a large number of sensors, in this paper, we built unmanned stores with low cost and high accuracy.
A number of ways for object detection have been proposed [
4]. Tehsin et al. [
5] applied a particle swarm optimization of correlation filters for object recognition. Yousaf et al. [
6] applied a filter and morphological operation to enhance the edges of the image for object detection. Awan et al. [
7] proposed a difference of the Gaussian (DoG)-based logarithmically preprocessed EEMACH filter to manage multiple distortions in a single training instance and enhanced the recognition performance. Zhou et al. [
8] developed a Scale-Transferrable Detection Network (STDN) for detecting multi-scale objects in images. There are two major ways to recognize objects in deep learning models; one is the one-stage method and the other is the two-stage method. The former performs the positioning and classification directly, and the latter first extracts the candidate region of interest and then does the classification. Usually, the former runs faster than the latter but the latter has better accuracy than the former. The YOLO family, including YOLO [
9], YOLO v2 [
10], YOLO v3 [
11], YOLO v4 [
12], and SSD (Single Shot MultiBox Detection) [
13], are the representatives of the former, and the representatives of the latter are RCNN [
14], Fast RCNN [
15], and Faster RCNN [
16], respectively.
Traditionally, the deep learning neural models require a large number of samples to conduct learning during the training process; in practice, the lack of samples for training usually leads to poor performance. Koch [
17] proposed the Siamese network to conduct a better similarity checking for objects with a small number of samples. We can then use the Siamese network in unmanned stores for classification.
To recognize customer behavior more accurately, a posture prediction model developed by Cao et al. using OpenPose [
18] is used to assist in identifying the physical behavior of customers. It first captures the 2D image and then the key points of the body are detected and help the body tracking algorithm to identify each pose at different angles. These poses are useful in identifying the behavior of a customer.
4. Proposed Scheme
The shopping process is stated in Algorithm 1 and it consists of five major steps. In step one, while the customer enters into the unmanned store, a photo is taken, and the customer’s information is created and stored in the Gallery database using the YOLO v4 person detection model. In step two, the customer is shopping. When the customer puts his hand in the merchandise cabinet, the hand will be detected by the marker, and after the hand leaves the cabinet, the number of items taken or returned will be calculated by the YOLO item detection model. In step three, the customer may take some items that just arrived at the store, which have not yet been trained in the YOLO item detection model—these items can be identified by the Siamese Network. In step four, the customer who took the items will be identified by the OpenPose and PREID Network. In step five, step two to step four are repeated until the customer leaves the store and finishes the checkout. Instead of using the time complexity to demonstrate the performance, a practical execution time of each model taken in the unmanned store system is shown in
Table 1; it takes only 372 ms for the whole system.
| Algorithm 1: Shopping Process Algorithm |
Use YOLO v4 to identify the customer and put the customer’s information in the Gallery database while he/she enters the unmanned store. When the marker detects a hand entering the cabinet, a shopping event is started, and photos are taken during this period. When the marker detects a hand leaving the cabinet, the number of items are calculated by the YOLO item detection model as the shopping event ends. Use the Siamese Network to identify the items which were not trained in YOLO item detection model. Use OpenPose and the PREID Network to identify which customer took the items. Repeat step 2 to step 3 until the customer leaves the store and finishes checkout.
|
4.1. Analysis of Unmanned Store Events
When an event is triggered, we will receive three images and the location of the merchandise cabinet. The three images are: the store’s top view image, the product image when the event is triggered as shown in
Figure 1a, and the product image after the event is triggered, as shown in
Figure 1b. Through this information, we can judge which customer took which item in the store.
We use the images taken before and after, put them into the YOLO v4 model, and the model will respectively calculate the categories and quantities of these two images; the difference in quantity between the two images will be the quantity purchased (or put back) into the merchandise cabinet by the customer. From the top view image obtained directly above the store, the identity of the customer can be judged. First, we use the position of the trigger commodity cabinet in the image to find the closest customer frame as the event trigger through the shortest Euclidean distance or we use the OpenPose method, as shown in
Figure 6a,b, respectively. After obtaining the image of the trigger, it is compared to the images of all customers in the store one by one by using the Lightweight PRIED network to find out which customer triggered the event, and the purchased goods are placed into the shopping cart list corresponding to the customer found, as shown in
Figure 6c.
4.2. Customer Identification and Anti-Theft System Based on OpenPose, YOLOv4, and PREID Network
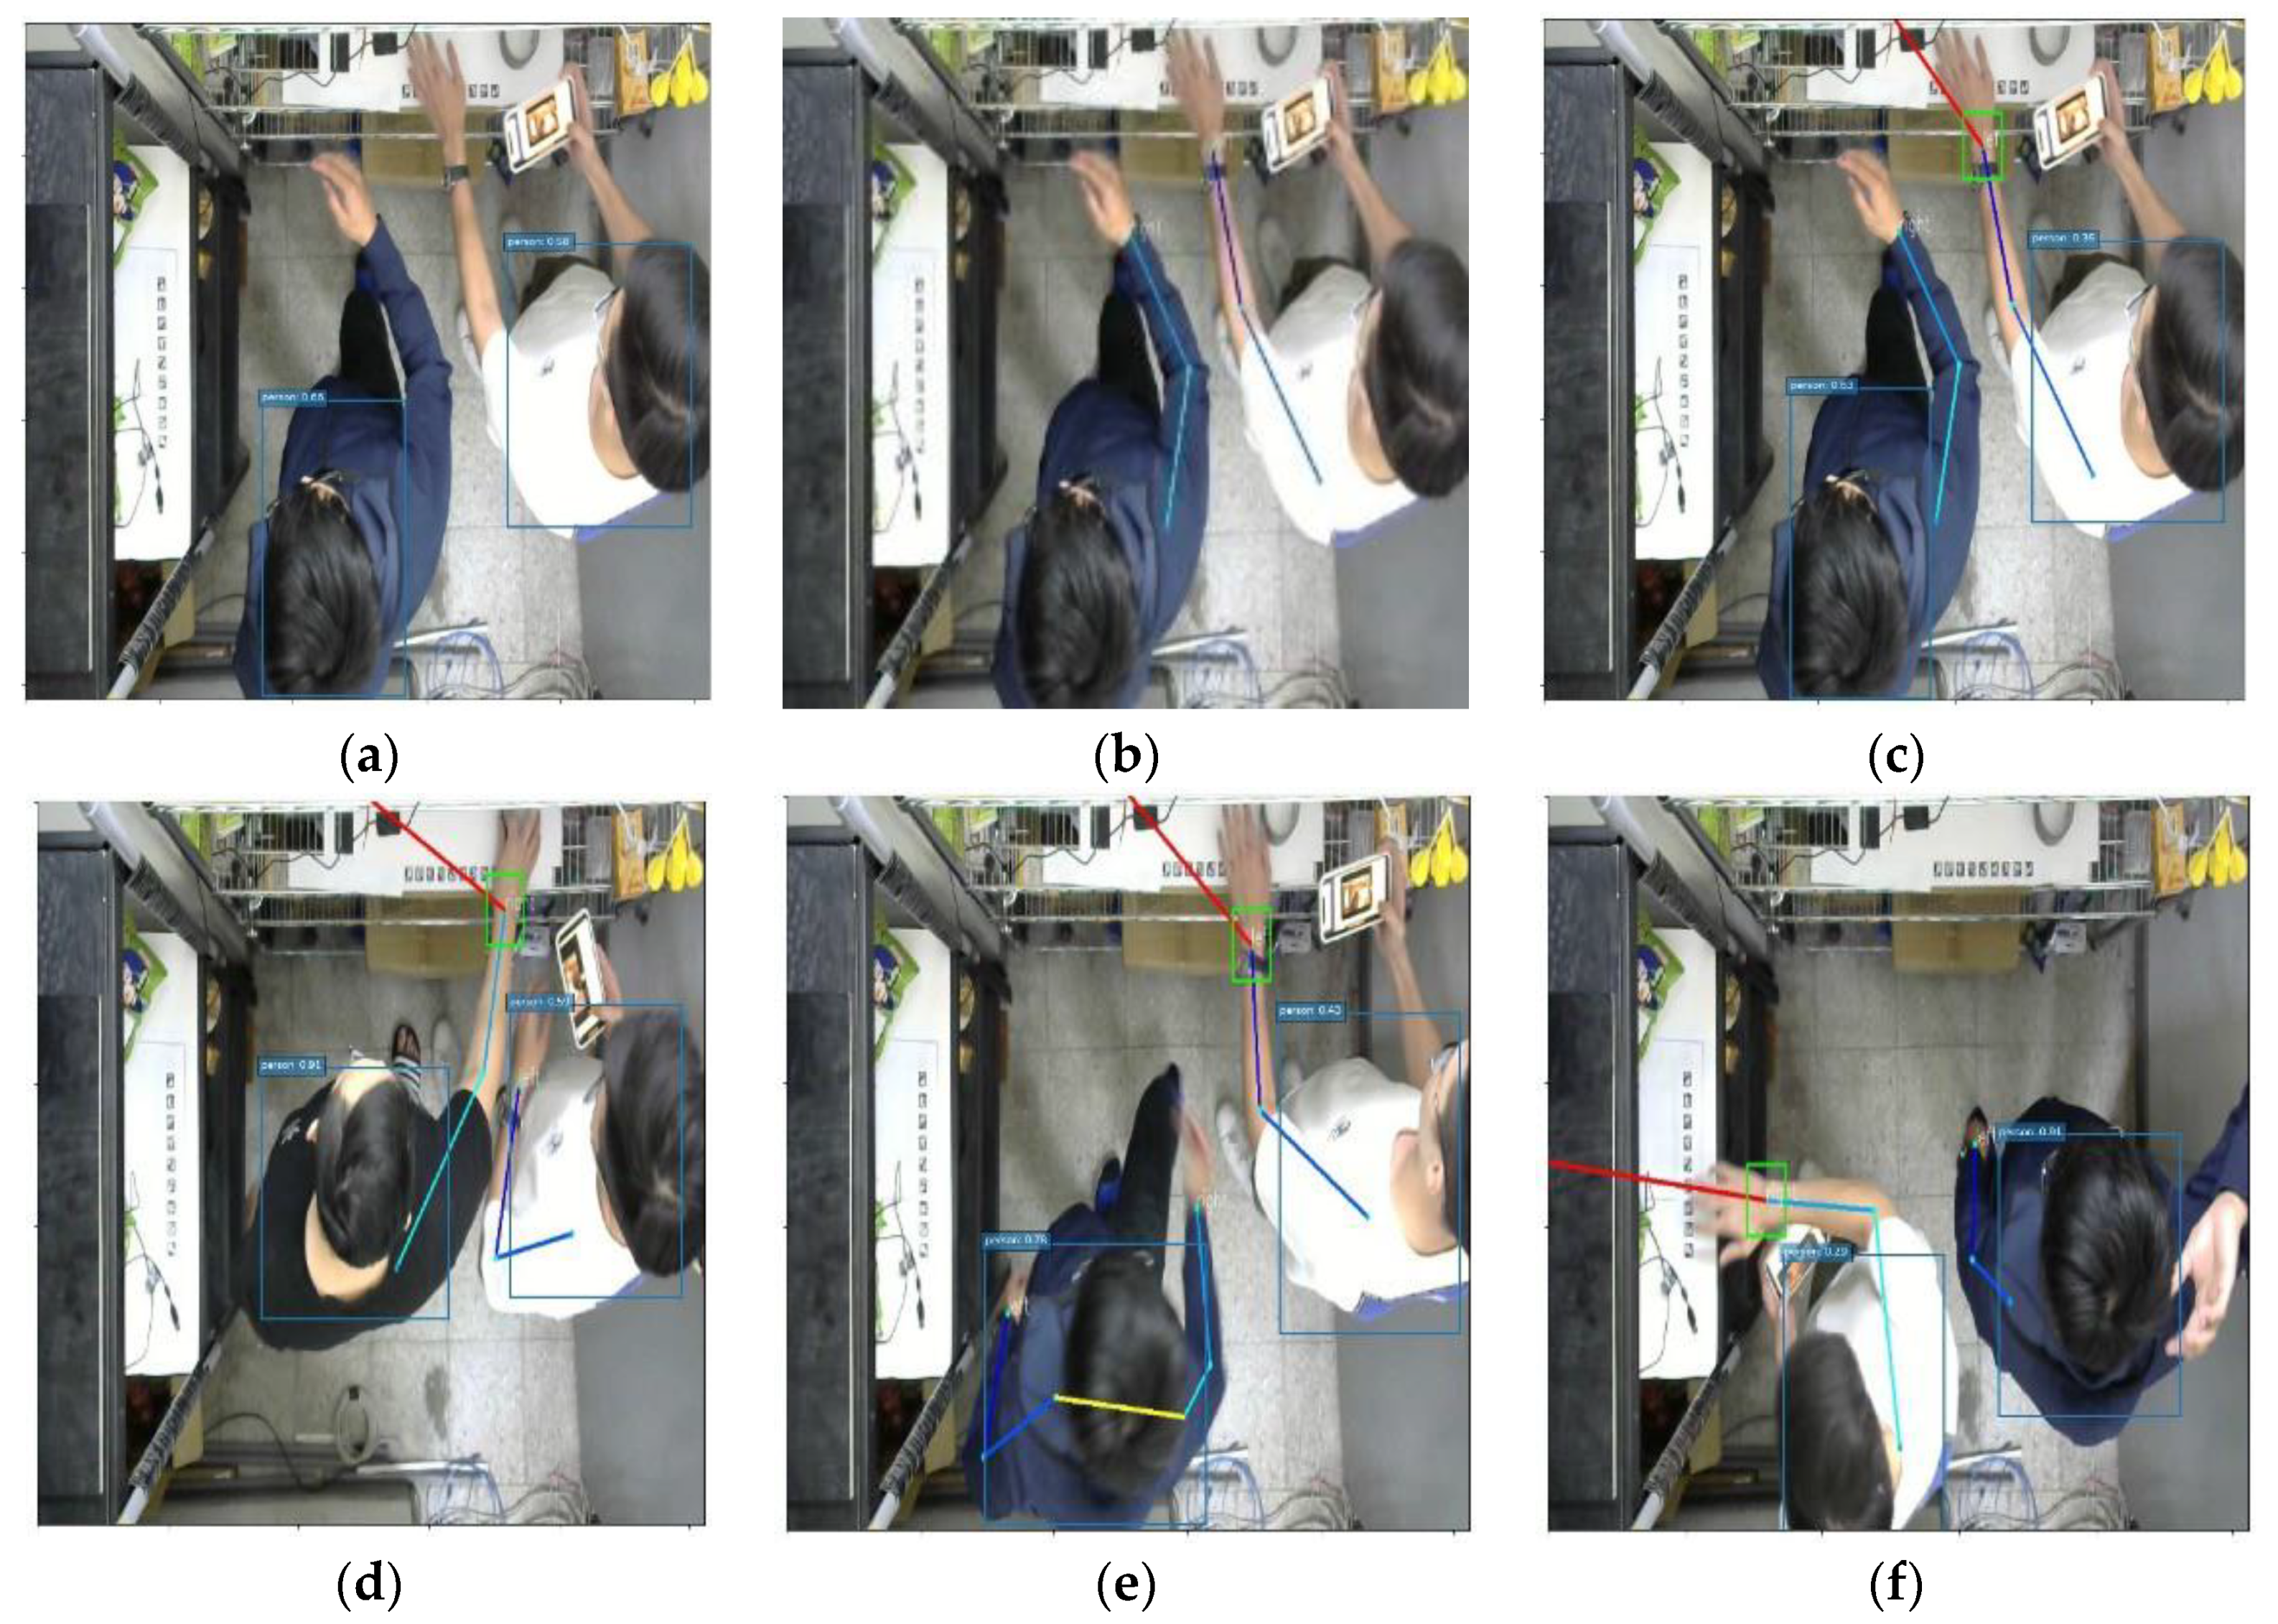
In order to correctly judge the identity of the customer, we used three models; the first model obtains the bounding box of people, which can return the customer location and the size of the bounding box, as shown in
Figure 7a; the second model is the OpenPose model, which uses the same input image as the first model, and the output is the key positions of each customer in the store (such as wrists, shoulders, knees, etc.). As the store only needs to recognize the arm as a condition for judging the customer’s image, it only needs to recognize six key points of the customer, the left wrist, left elbow, left shoulder, right wrist, right elbow, and right shoulder. For example, if there are currently two customers in the store, there will be four arms and 12 key points. In addition, the model will only detect one of the arms because the customer is partially obscured, such as the person on the left in
Figure 7b.
Next, we use the known position of the merchandise cabinet and the key points returned by OpenPose to find the key point of the wrist with the closest Euclidean distance; we use this wrist to find the key point of the person’s shoulder, and then use the position of the shoulder and the customer’s position in the image of the person detection model. The shortest Euclidean distance for the image position obtains the customer image that triggers the event, as shown in
Figure 7c.
OpenPose can identify many different situations in the store. For example, customers who are far away from the merchandise shelf reach out for items in the store. Through the links of key points, we can also find out the customers who triggered the event behind, as shown in
Figure 7d. Here are some normal shopping situations, as shown in
Figure 7e,f.
After we have the image of the person who triggered the event, we use the image as the input to Person REID, compare the similarity with all customer images in the store, and select the person with the highest similarity as the trigger of this event.
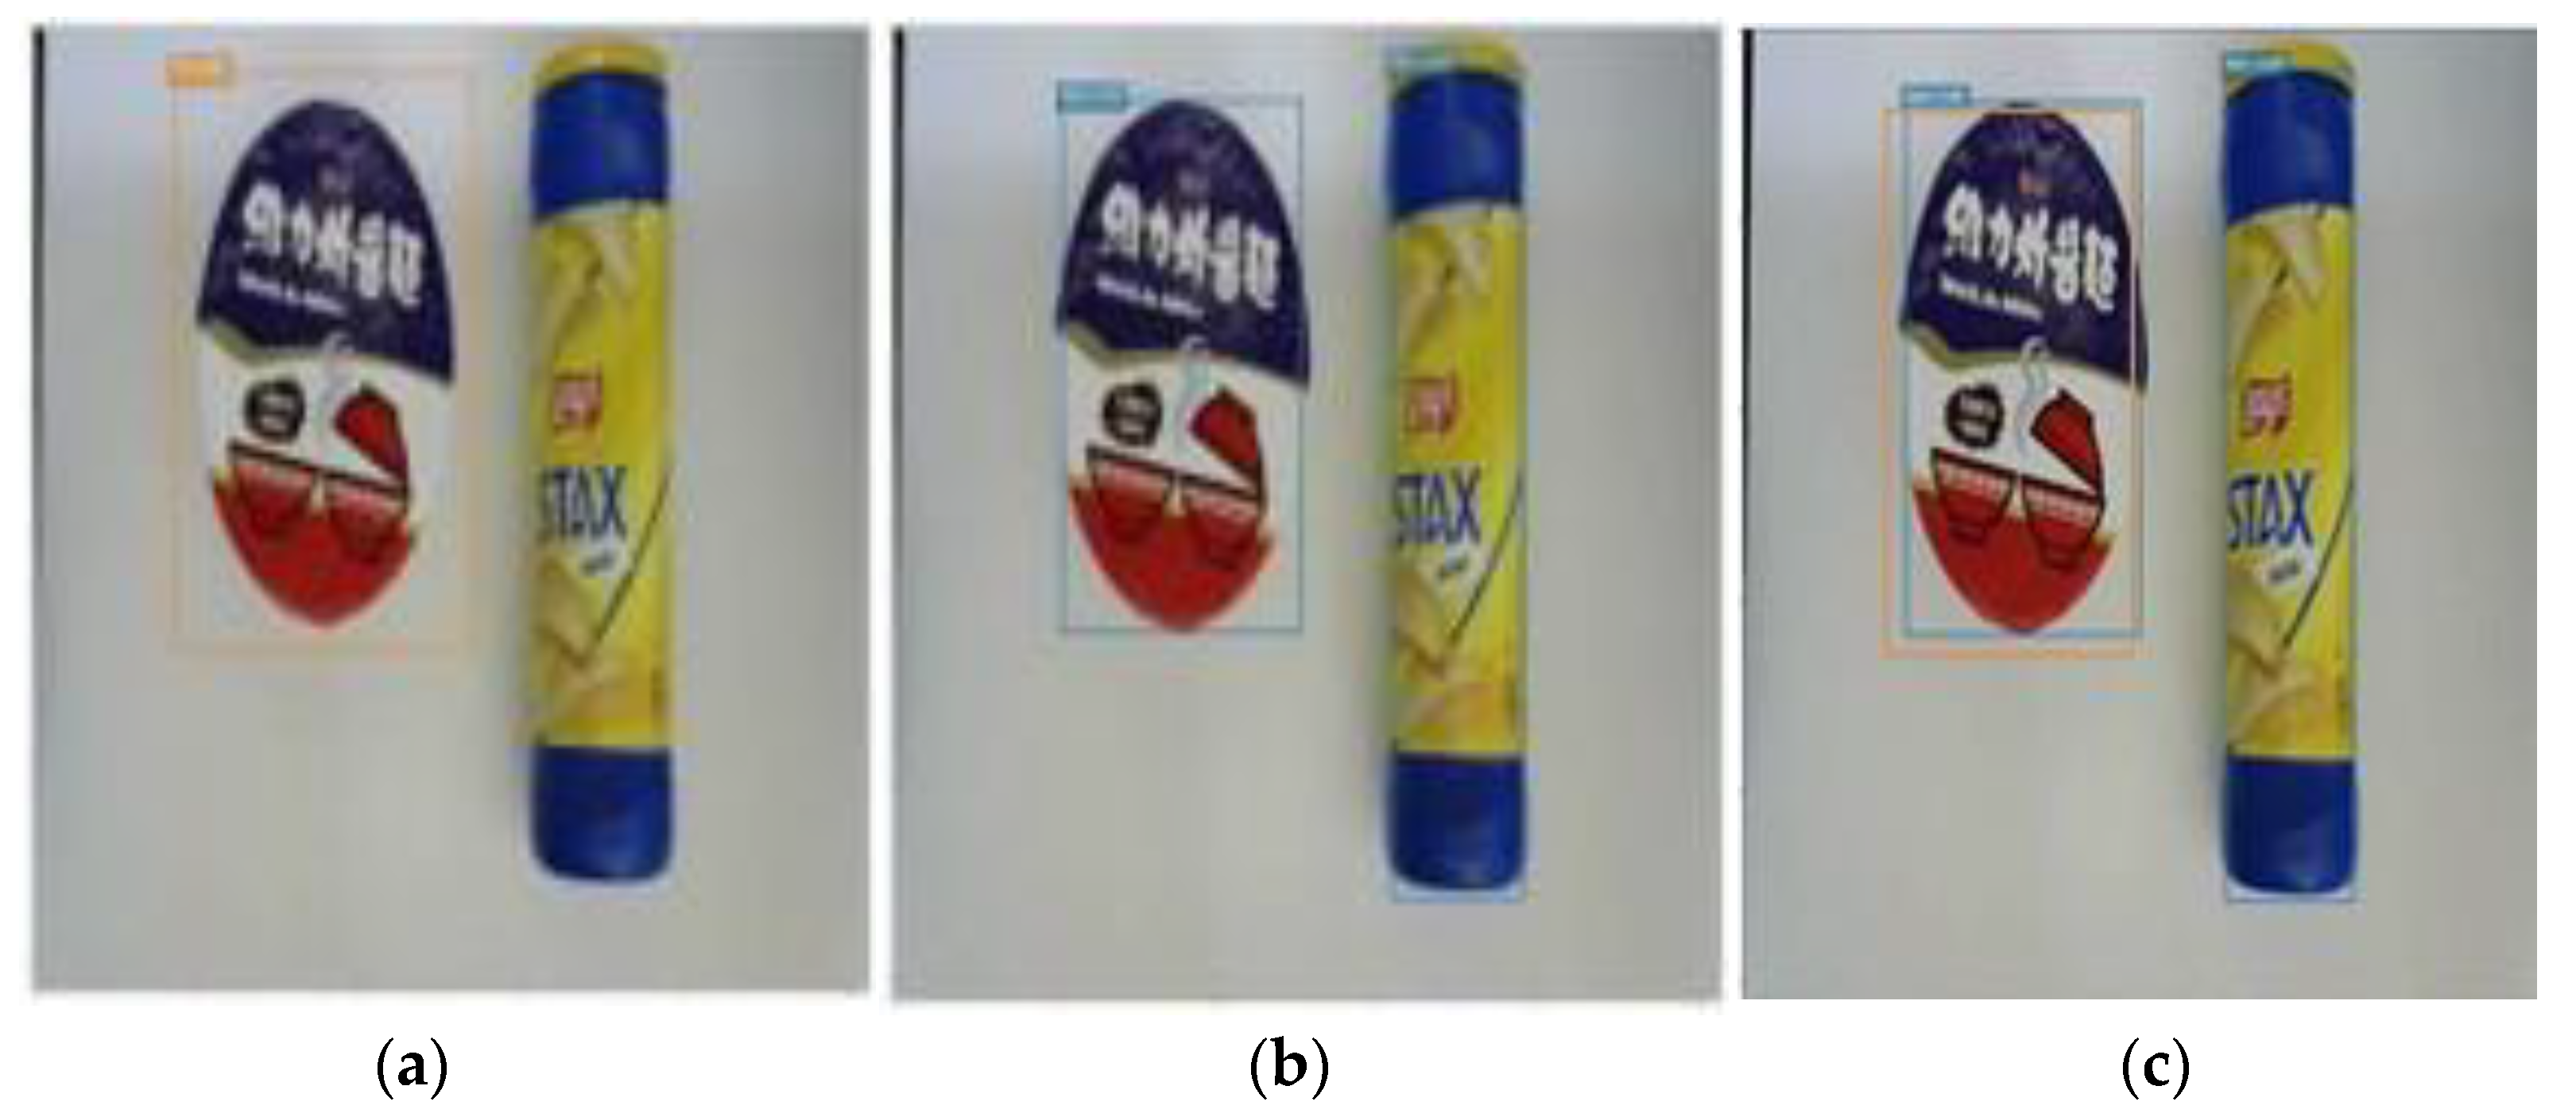
4.3. New Item Identification System Based on YOLO v4 and Siamese Network
In order to facilitate the explanation of the system architecture, we call products that have not appeared in the training set as new products, and products that have been trained as old products.
To be able to successfully identify whether a product is a new product, first we will use the second model to identify the existing 30 product categories, as shown in
Figure 8a. The second model is used to perform object detection; that is, it only detects the location and size of the object but does not classify the detected objects.
Figure 8b shows the object detection. Next, the intersection of all recognized frames of these two models is taken so that the frames recognized by the models will be put in one image, as shown in
Figure 8c.
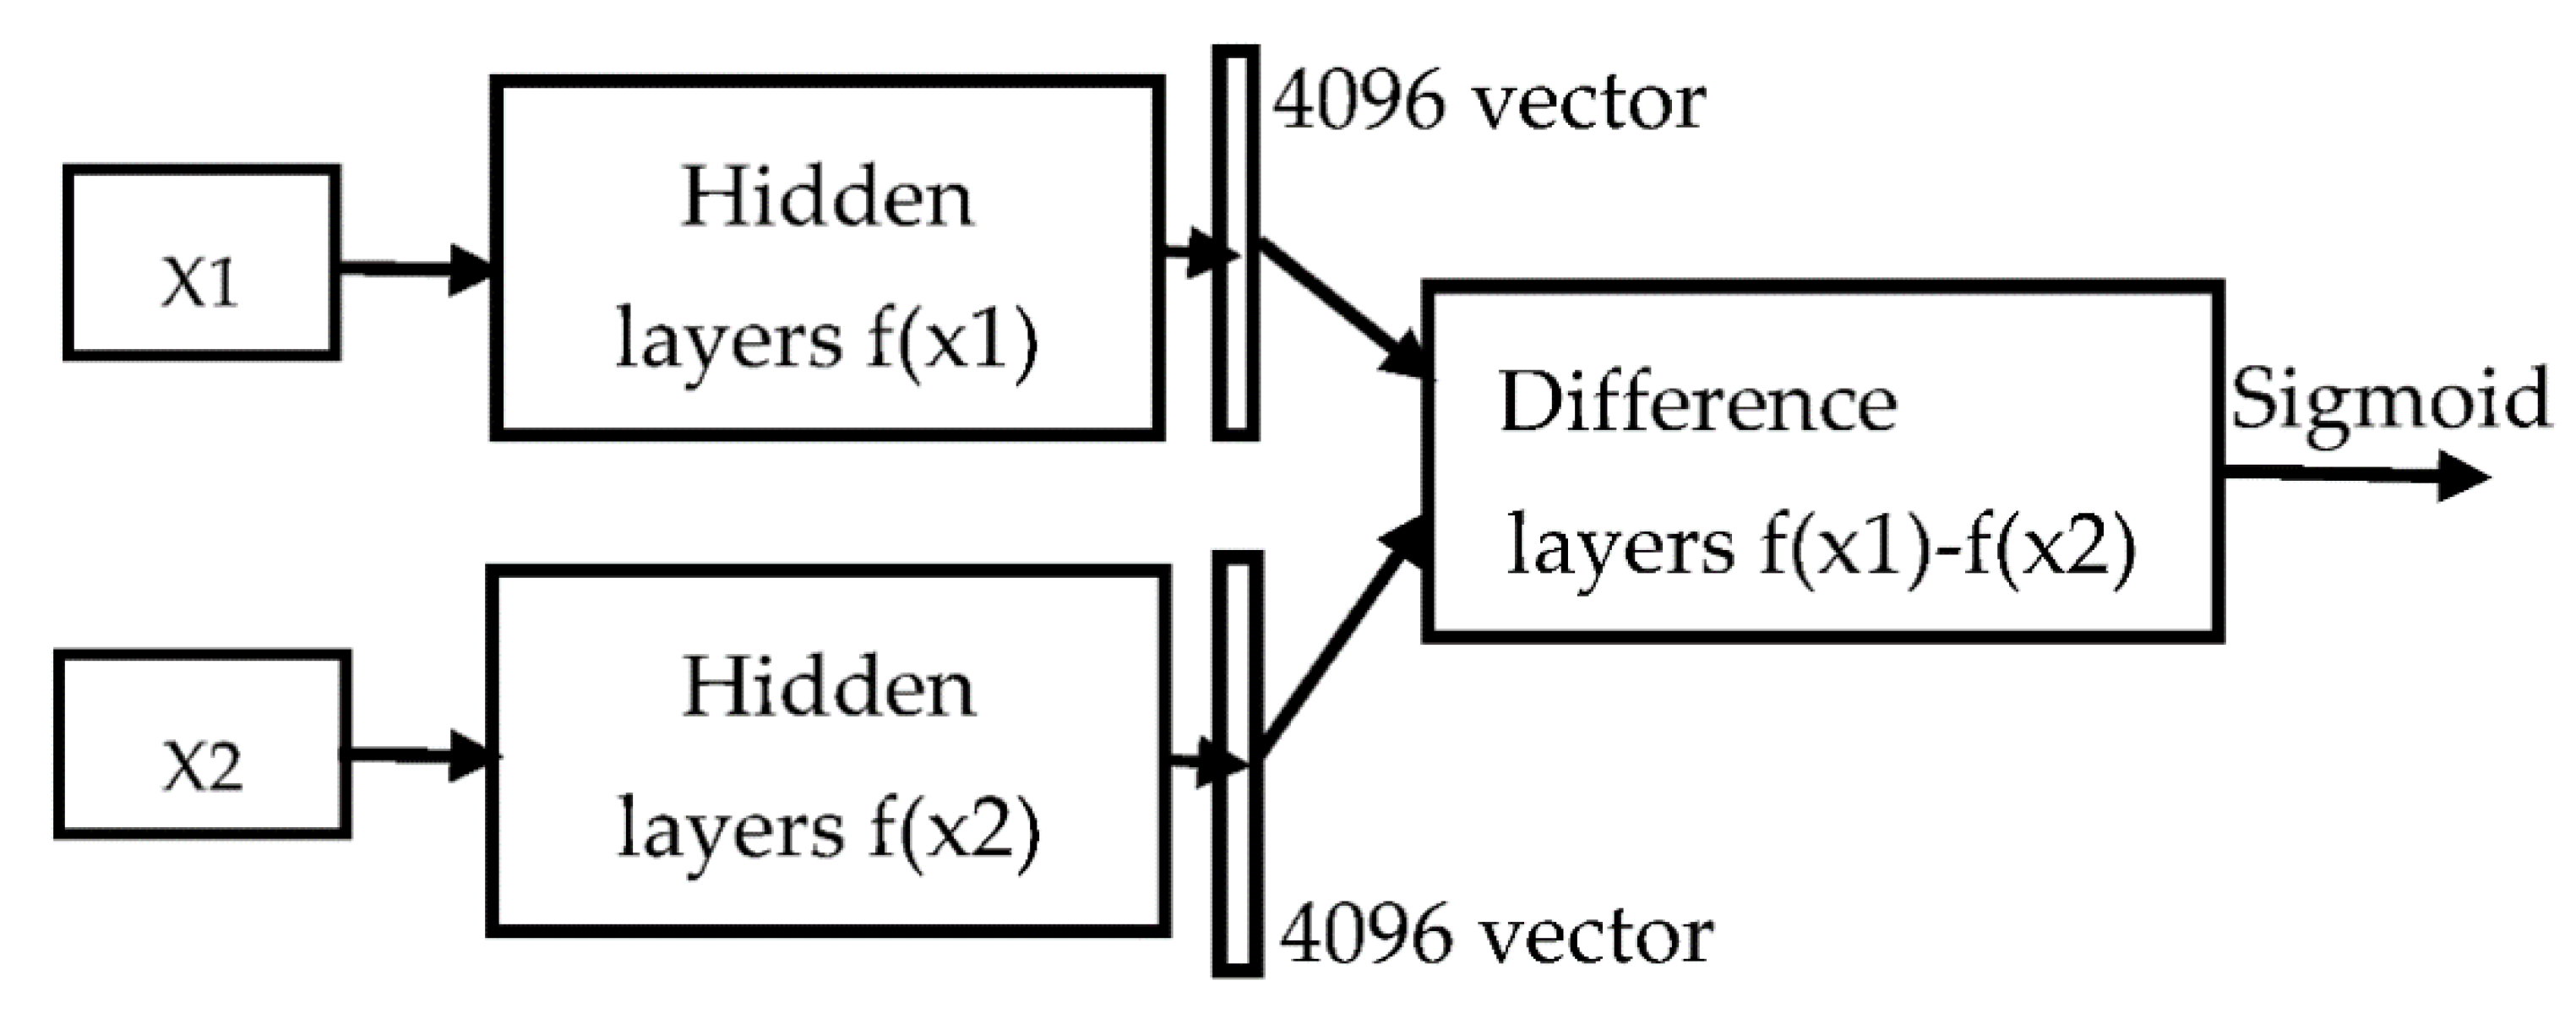
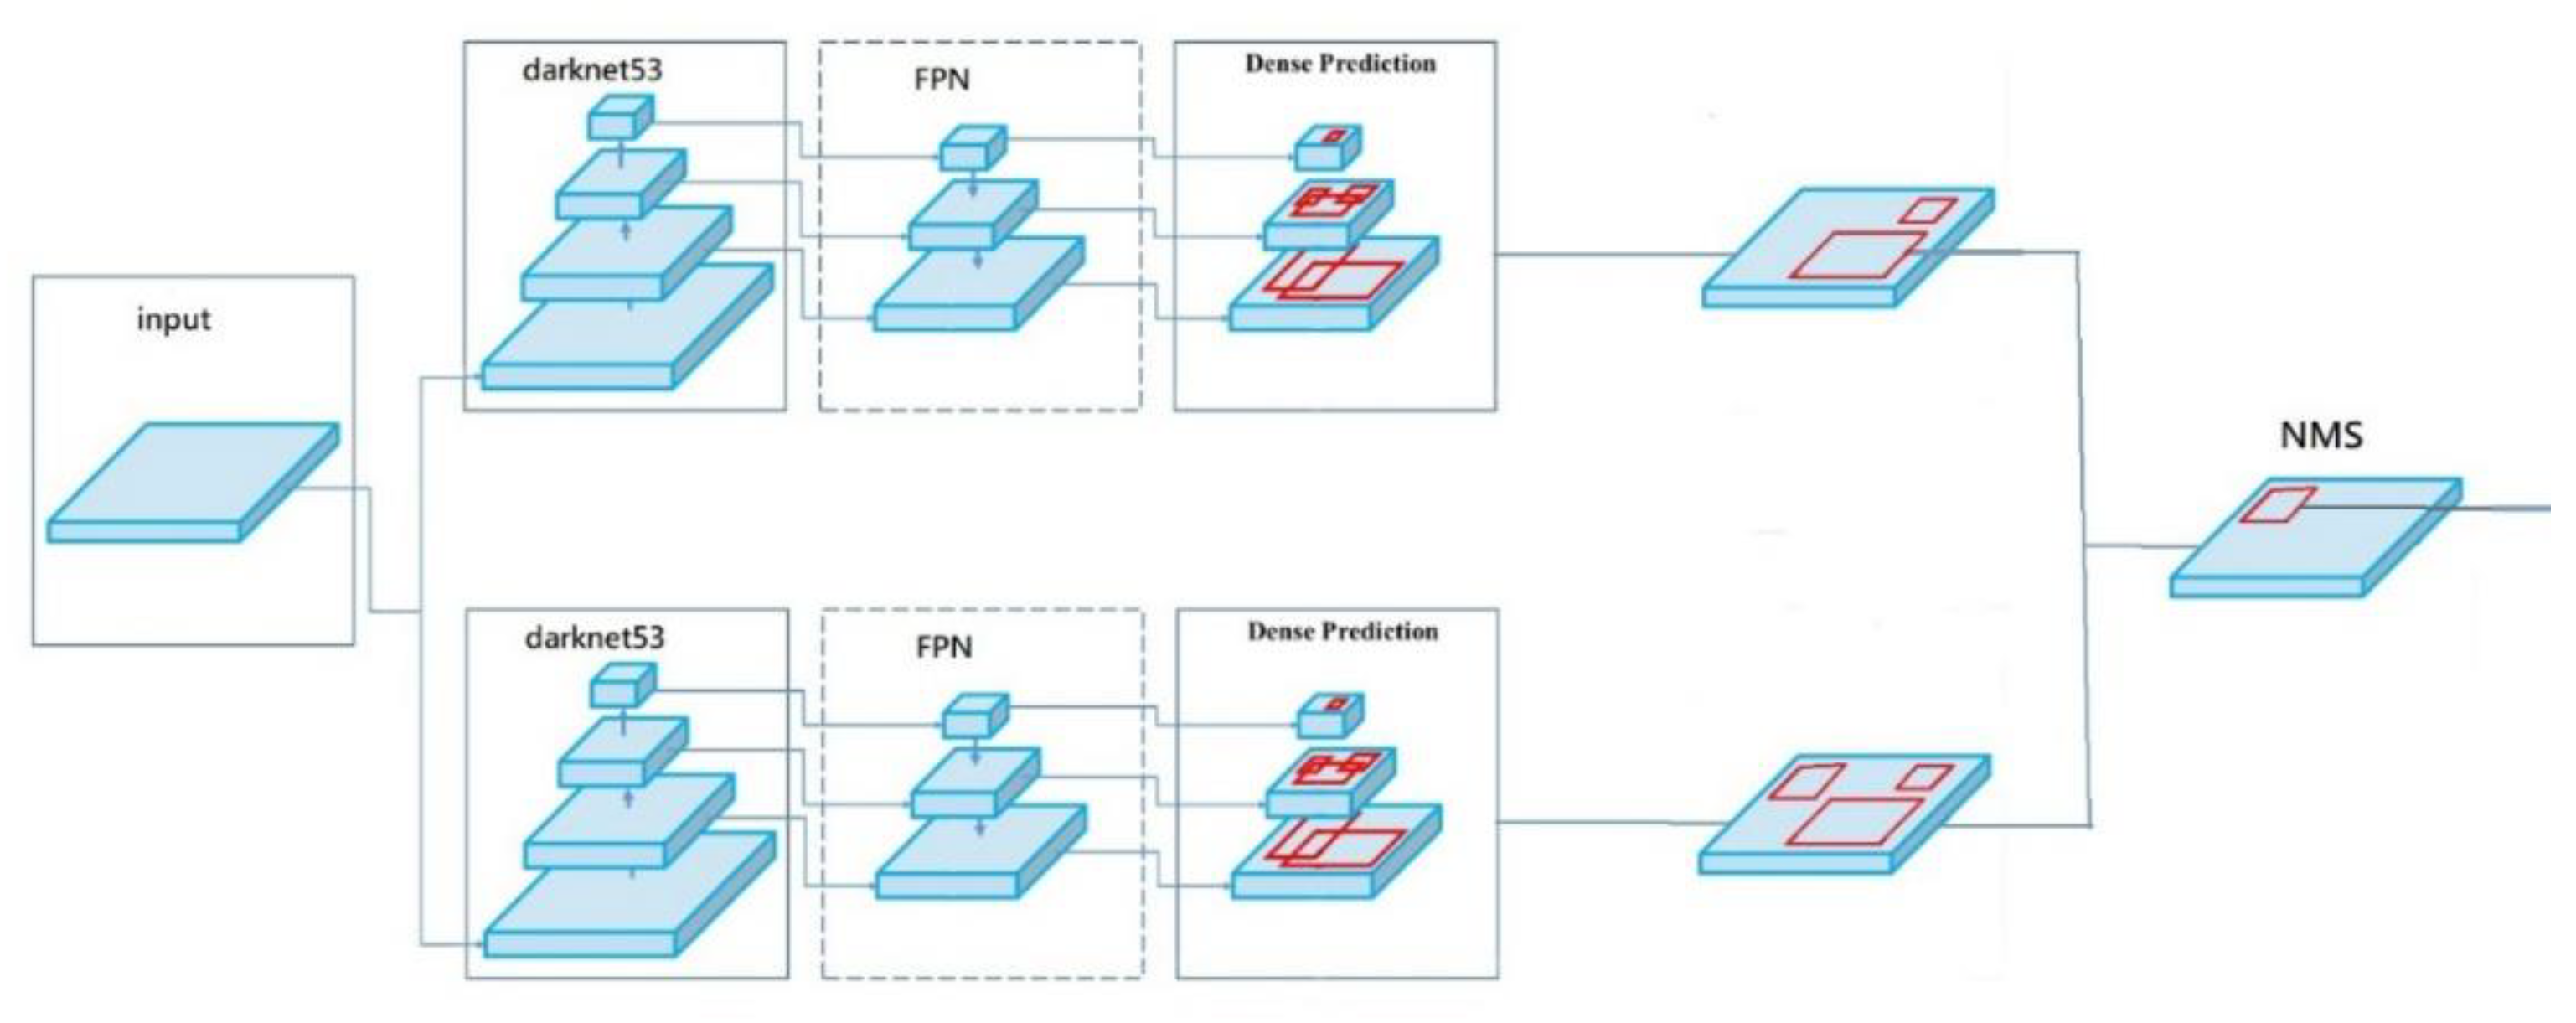
The two models predict with the same image; there will be many overlapping boxes, which are calculated as IoU (Intersection over Union). When IoU is greater than 0.7, the candidate box is removed and regarded as an old product; otherwise, it is regarded as a new product. Using this structure, as shown in
Figure 9, we can classify products. In
Figure 8c, the instant noodle on the left is judged as an old product, and the potato chip on the right is judged as a new product.
Suppose there is a new product; the product image is resized to 106*106, it is used as an input to the Siamese network, and the other input of the Siamese network is from the image of all new product categories. The two images will eventually generate two vectors. We can then calculate the similarity of these two generated vectors and select the highest one from new product categories as the category of the product. In this way, we can identify new products without retraining the model.
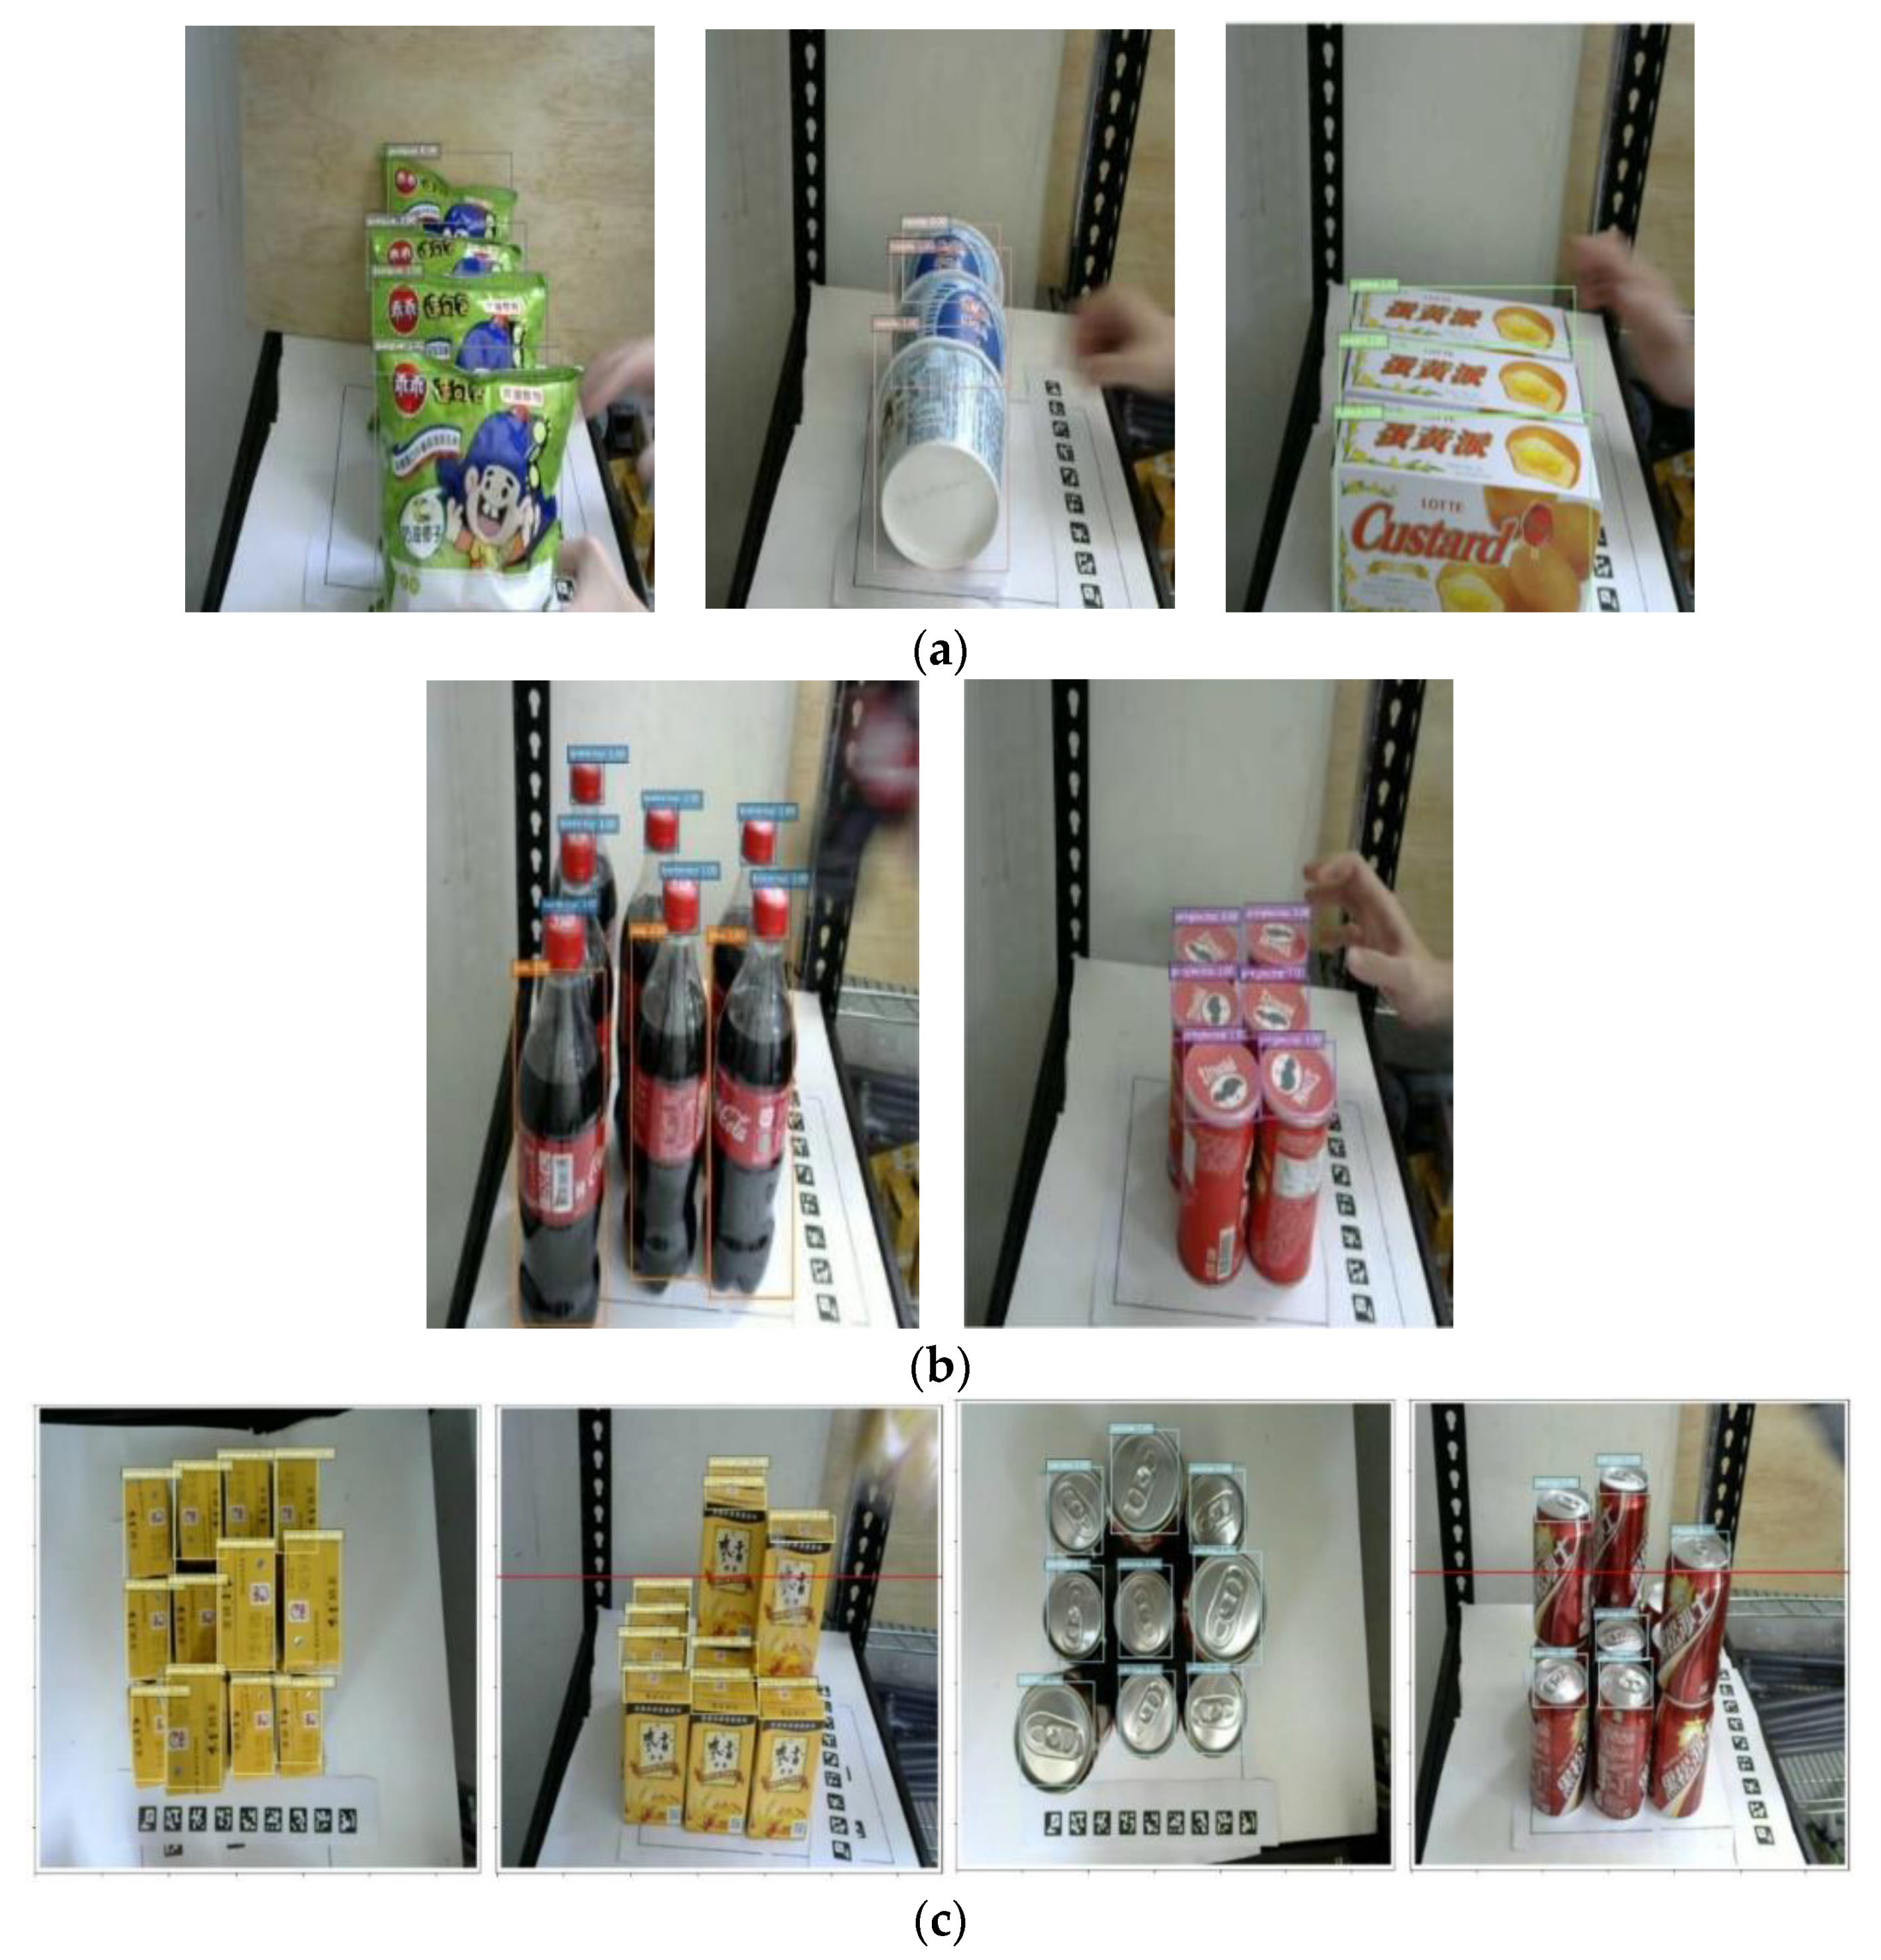
4.4. Product Identification System Based on YOLO v4 Stacking and Height Occlusion
For the deep learning model, the target object must appear completely in the image before the product can be identified. As long as the product is slightly obscured, the product may be identified incorrectly. Simple object identification cannot solve the problem of stacked products due to occlusion. We designed a set of methods that can solve the problems of stacked goods and height occlusion, which can effectively improve the utilization of space and can also greatly reduce the construction cost of unmanned stores.
First of all, we designed an identification model for stacking products and height occlusion; this model has six goods categories, but is extended into eight categories because of two added categories, “Top of Bottle” and “Top of Can”, which are used to solve the occlusion problem mentioned later, such as bottled Coca-Cola. Aluminum can tops, Pringles tops, bottled beverage tops, etc. are all products of this type. In this way, once the product itself is blocked, the number of top covers can still be used to calculate the number of products.
There are three calculation methods for commodity appearance, as shown in
Table 2. The first calculation method can be directly identified through the YOLO model. As the training sample contains many occlusions and stacking situations, after a large amount of data enhancement and training, a model that can identify more than half of the occluded products is formed, as shown in
Figure 10a.
The second calculation method is because some products have long and narrow shapes, only the top can be identified when they are densely arranged. Therefore, the calculation method is to calculate the number of recognized top caps, such as bottled beverages and canned snacks. In this way, there are several top covers which are equivalent to the quantity of several commodities, as shown in
Figure 10b.
The third calculation method requires two cameras to identify stacked products, which are iron cans and aluminum foil packages, as shown in
Figure 10c. First, the top of the product is regarded as a category, referred to as “top covers”, using two cameras. From top views, the number of products is calculated from the top angle, but it is impossible to determine whether the products are stacked. The side view image can be used to judge whether the product is on the first layer or stacked on the second layer. The number of “top covers” is discovered by looking down on the top-view camera, and then using the side camera to adjust the camera angle to find the stacked products.
5. Results
According to human beings, when an object undergoes a certain deformation, it is still recognizable by human eyes and brain perception; for machine learning, it may not be that easy. Therefore, data augmentation is an important thing in order to improve the performance and robustness of the model. The following are the data augmentation methods used in this paper. Rotation is used to generate a new image from the original training sample every 15 degrees, thus one photo will generate 24 additional rotated images, as shown in
Figure 11a. Images of different hues are randomly generated, because products often appear similar in characteristics but different colors. For example, the appearance characteristics of Maixiang milk tea and Maixiang black tea are almost the same except for the color hue. If the color range is adjusted to be too large, it may be mistakenly judged as the same product. To solve this problem, we should adjust the hue to plus or minus 2.5%, and images with different hues would be generated from the products.
Therefore, the hue is adjusted to plus or minus 2.5%; images with different hues will be randomly generated from the original product image, as shown in
Figure 11b. The saturation is set to plus or minus 10%, and images with different saturations are randomly generated in this interval, as shown in
Figure 11c. The exposures are set to plus or minus 10%, and by randomly generating the exposures, the product can be more easily identified when the light is reflected, as shown in
Figure 11d. The image sizes are randomly enlarged or reduced by 30%, so that the product can be identified when it is far or near.
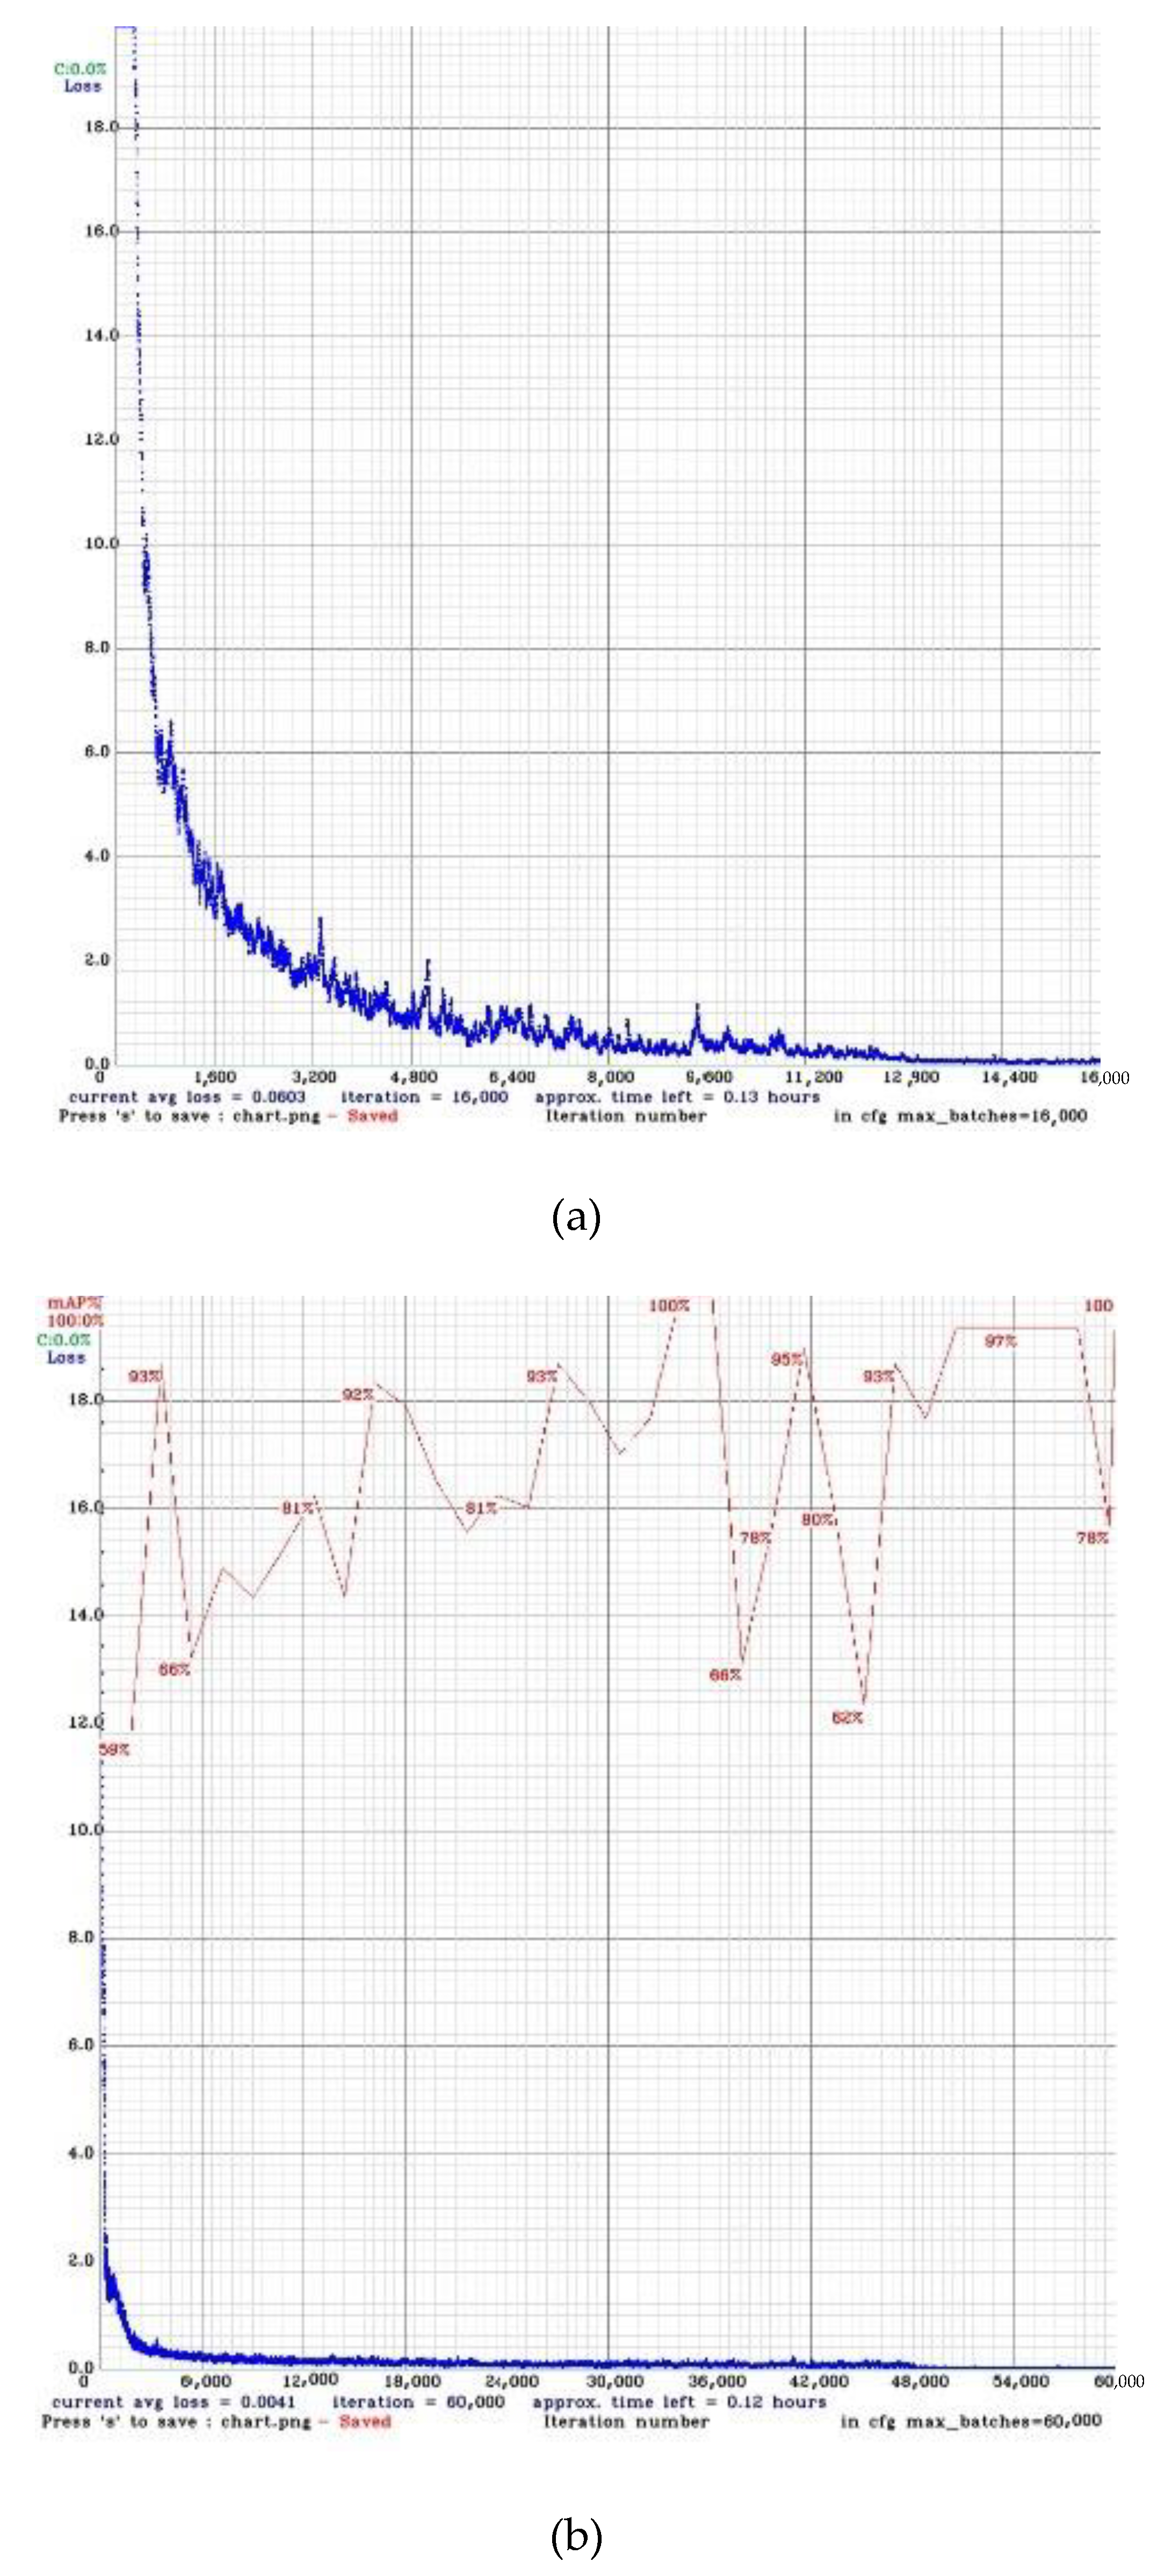
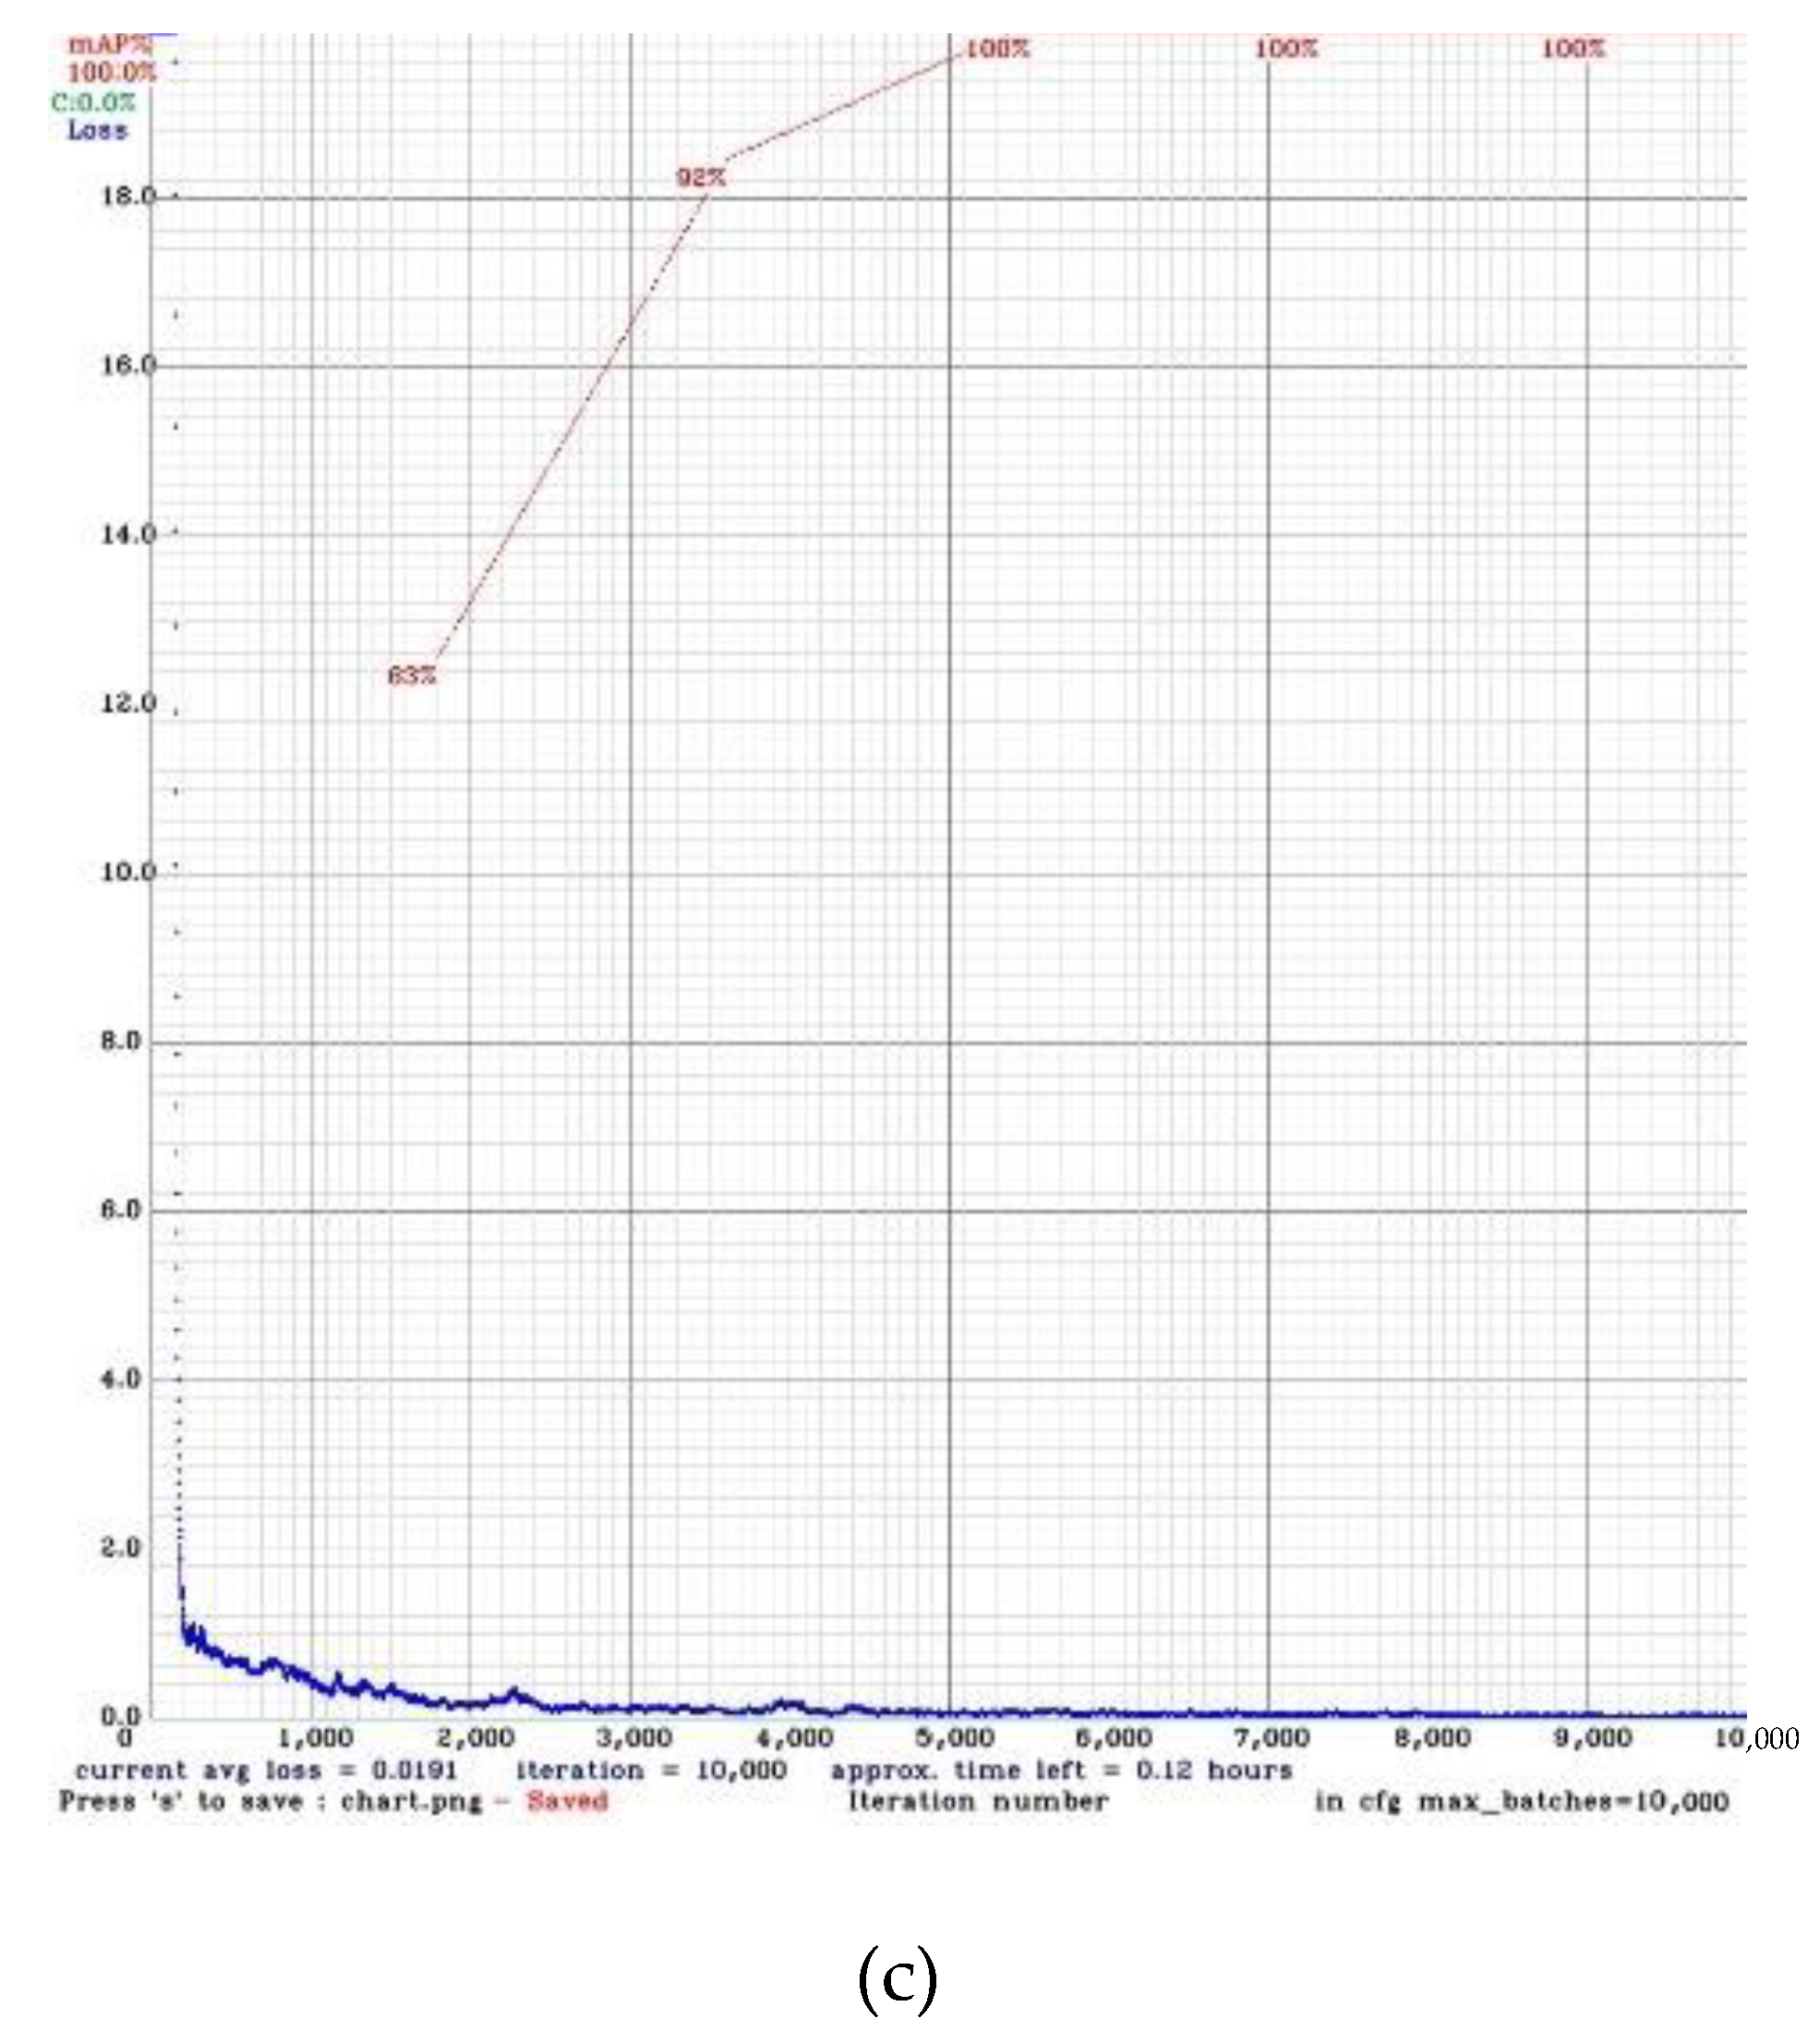
The training process in YOLO v4 is shown in
Figure 12.
Figure 12a is for the person detection model,
Figure 12b is for the 30 items detection model, and
Figure 12c is for the stacking and height occlusion items detection model. The number of iterations is depicted in the horizontal axis, the vertical axis is the training loss, and every 1000 iterations will be calculated once with the value of mAP. During the training, we set the learning rate to 0.0001, and data augmentation and the dropout layer [
23] are used to prevent over-fitting. There are several tests for each of the three YOLO v4 models in the store. The results are shown in
Table 3:
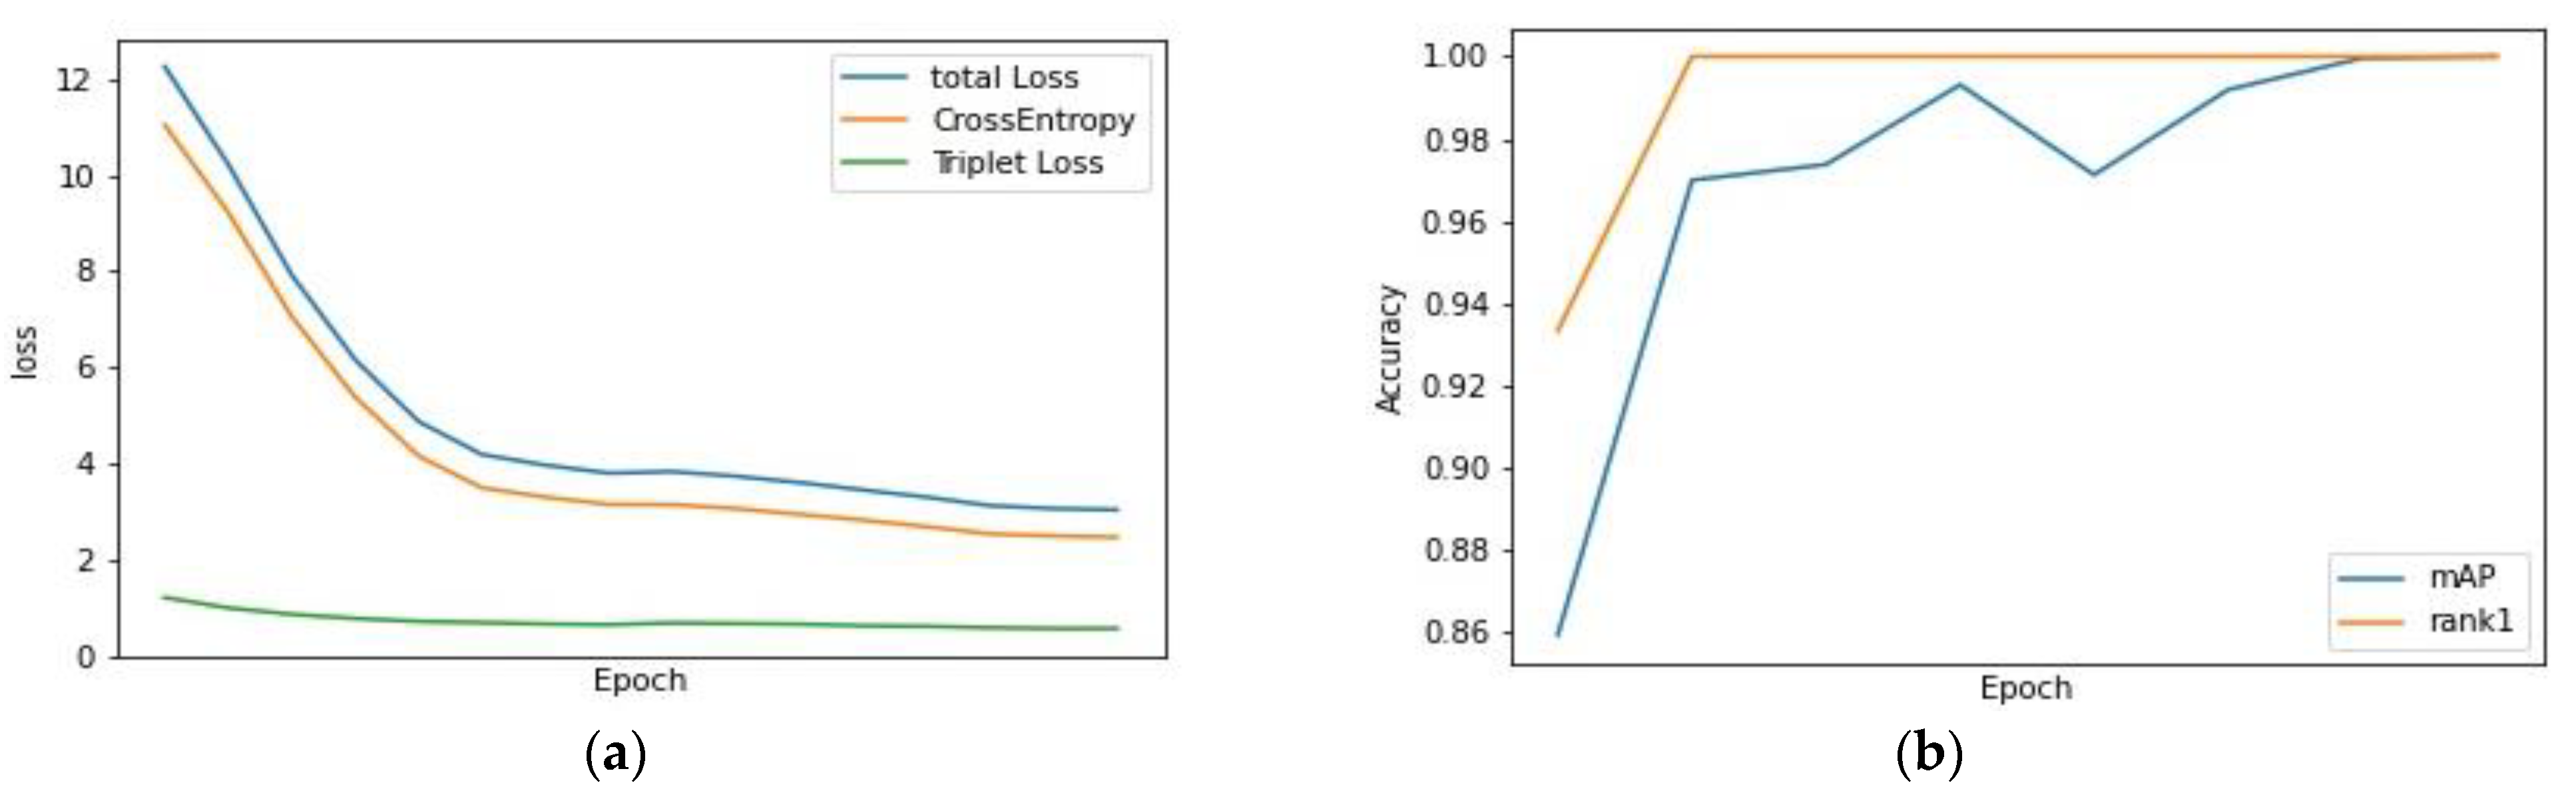
To train the PREID model, we used 2066 different images acquired from 27 people in total. The marked data are manually processed. The same image of the same person is placed in the same folder, and any two data are randomly selected, and the similarity is compared and calculated. Triplet loss [
24] and cross entropy (CE) loss [
25] are the two loss functions used. We set the learning rate to 0.0006 and use Adam [
26] as the optimizer, where the batch size is set to 16, and the training result is shown in
Figure 13a.
In PREID, we often use the first hit (rank-1) to measure. If the query corresponding to the gallery has the highest similarity, the query meets the first hit, and we can also use rank-n as the measurement standard.
Figure 13b shows the rank-1 and mAP performance of the validation set during the training process. For the testing set, we use the maximum storage capacity of six people as the test target and test 36 images. The rank-1 is 0.9722.
Table 4 shows the result.
We also test the stability of the entire system based on actual shopping. We asked customers to enter the store to simulate the actual picking/returning to the shelf. With one shopping event as a unit, we tested 600 events. An event is correct when one puts the correct product category and quantity into one’s shopping cart with one’s correct customer ID. We divide incorrect cases into two kinds, object-detection error and person-identification error, and the total accuracy is 94.5%. The results are shown in
Table 5:
In order to prove that adding the OpenPose anti-theft system does make the store’s theft rate lower, it is compared to the method using the minimum Euclidean distance metric using the same 100 image test, including interlaced shopping, stolen goods, normal shopping, etc. In this case, adding OpenPose can cope with more complicated situations and improve accuracy. The results are shown in
Table 6.
Compared to Amazon Go [
27], our system uses less hardware cost, but with a compatible accuracy. All unmanned stores have a camera sensor; in addition, Amazon Go has other sensors, including infrared sensors, volume displacement sensors, light curtains, and weight sensors. 7ELEVEN and FamilyMart use less sensors then Amazon GO. With less equipment, we can achieve a scenario of cost reduction. Indeed, if other sensors, such as the weight sensor, are added to the system in the future, the accuracy can be further improved.
Table 7 shows the comparison.
6. Conclusions
This paper proposes an unmanned store system, combined with the architecture of multiple deep learning models with limited resources, to solve the problems that existing in unmanned stores. The combination of YOLO v4 and the Siamese network is the core of this paper. The whole system can recognize customers, products, and quantities correctly during shopping and achieve the goal of “take it and go”.
Compared to Amazon Go [
27], our system uses less hardware cost but with a compatible accuracy. Indeed, if other sensors, such as the weight sensor, are added to the system, the accuracy can be further improved. All customers’ buying records are recorded and the popularity of a product can be instantly mined and shown. Some unpopular products can be used for promotion. Hence, the system can help reduce the stock of unpopular products and reduce inventory.


