
Current Trajectories and New Challenges for Visual Comfort Assessment in Building Design and Operation: A Critical Review

 ,
,  ,
,  ,
,  ,
,  and
and 
Abstract
1. Introduction
2. Literature Collection Criteria
3. Motivation for Occupant-Centered Assessment
3.1. Effect of Occupant Interactions on Building Performance
3.2. Occupant-Building Interaction Asymmetry
3.3. Magnitude of Occupant Variability
4. Evaluating the Indoor Luminous Environment and Visual Comfort Perception
- luminance of the glare source;
- illuminance on the eye-plane;
- adaptation level;
- contrast effect;
- size of the glare source;
- position of the glare source.
- saturation effect;
- light resulting spectrum;
- light colour temperature.
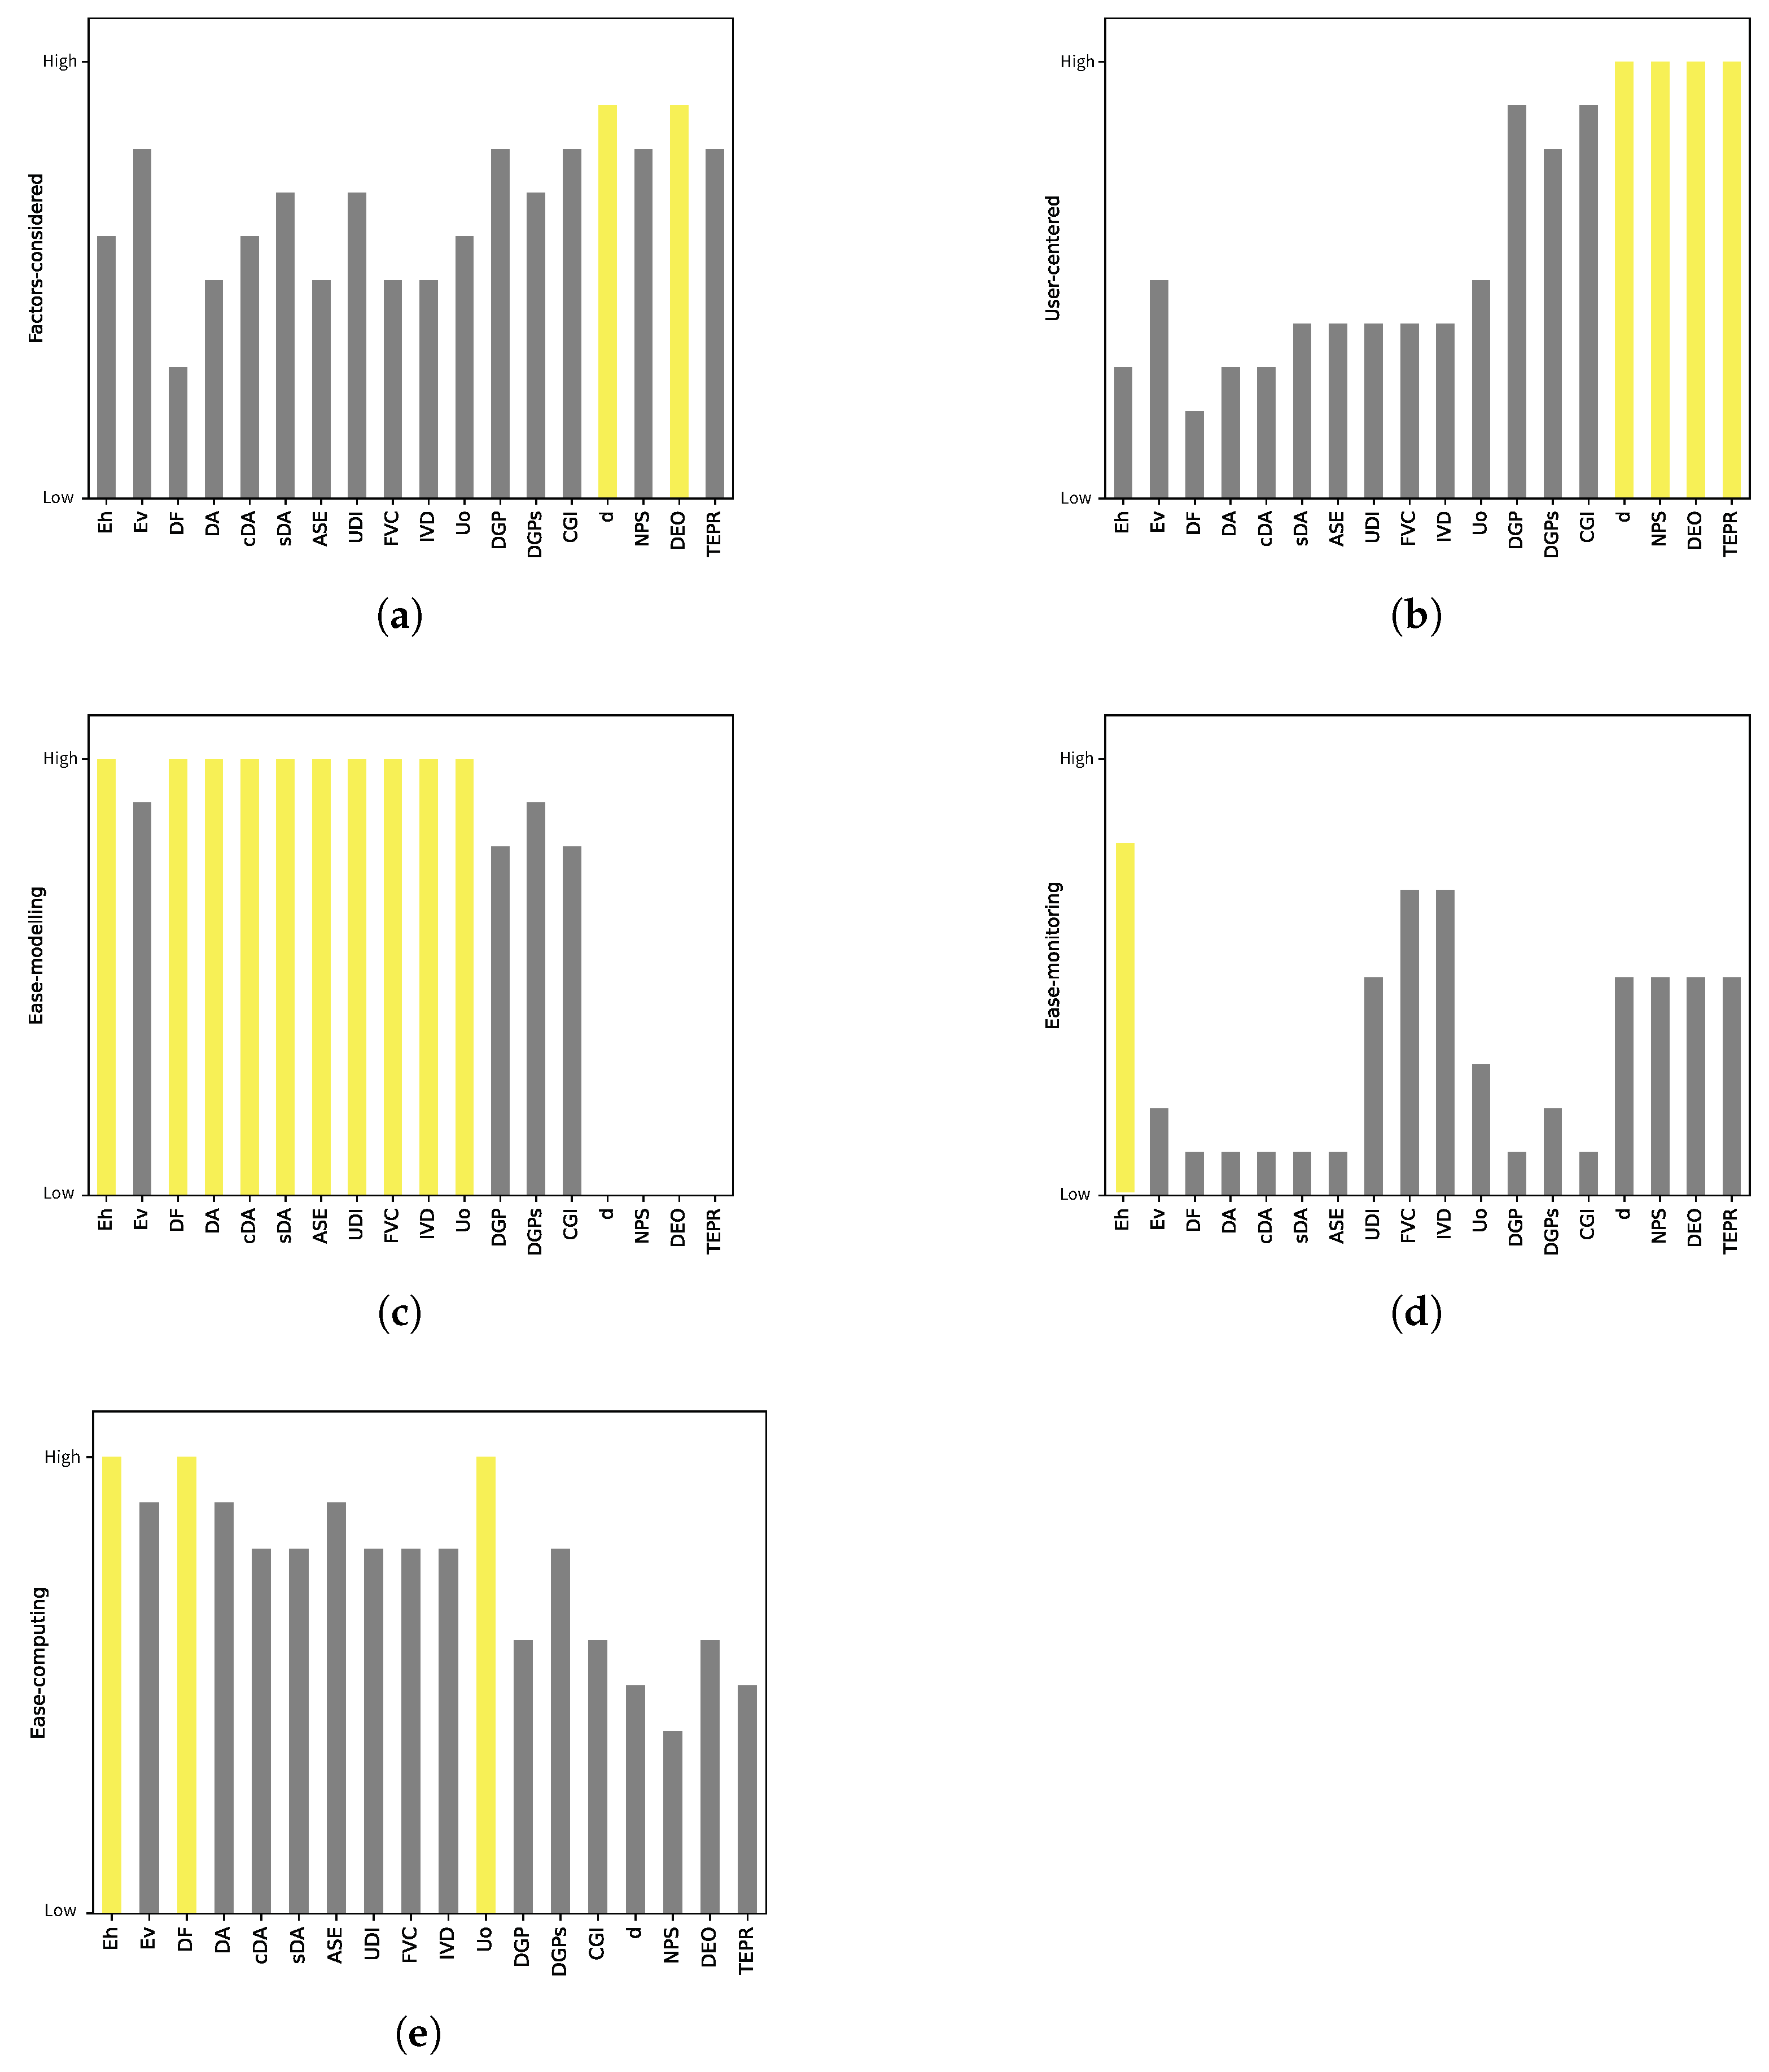
4.1. Visual Comfort Evaluation Metrics
4.1.1. Quantity and Uniformity of Light
- Daylight Factor (DF): compares the amount of light inside with the exterior during an overcast sky condition [55], the average across the analyzed surfaces of the building is typically requested to be greater or equal to 2% [56]. Alternatively, the appropriate value can be defined concerning the specified target illuminance and geographic location, following the method proposed in EN 17037 [57].
- Daylight Autonomy (DA): represents the percentage of occupied time in which a point within the analysis grid is over a defined minimum illuminance (discrete values only, e.g., complies or not). Additionally, the percentage can also include partial values when the conditions are below the established minimum threshold (ratio between obtained and minimum threshold), and are expressed as continuous () [58].
- SpatialDA(sDA): gives a notion on how much area is over the minimum illuminance for more than a certain portion of the occupied time, typically 300 lux is used for basic reading and writing activities, and these values shall be met for at least 50% of the analysis grid area [59].
- Useful Daylight Illuminance (UDI): calculates the percentage of the analysed time in which the illuminance in a point falls in a certain established range (normally between 300 and 3000 lux) [60]. Subcategories are also used to communicate the time in which the illuminance values falls below (underlit) or above the suggested ranges (over lit). Specifying the over lit areas can also suggest direct light discomfort risk.
- Frequency of Visual Comfort (FVC): percentage of time within the analysis period during which appropriate values of average illuminance are accomplished [61]. Similar to UDI, proposes 3 ranges: Comfort, Under and Over.where:
- : minimum/maximum illuminance threshold
- : computed/measured illuminance value
- t: analysis period
- Intensity of Visual Discomfort (IVD): time integral of the difference between the spatial average of the current daylight illuminance and the upper limit of visual comfort or the lower limit of visual comfort [61].
- IVD
- IVD
where:- E: minimum/maximum illuminance threshold
- E: obtained illuminance value
- t: analysis period
- Daylight Uniformity (Uo): ratio in a given moment, or time frame, between the minimum value of illuminance on the analysis area () and a reference value (e.g., maximum or average) [62].
4.1.2. Direct Light Discomfort
- Directly with Daylight Glare Probability (DGP): which represents the percentage of people that would be disturbed by the level of vertical illuminance () at eye level and the contrast of luminance sources within the occupants’ field of view (defined by [63]). However, it is not valid for values below 0.2 or 380 lux; thus, to extend its usability range, an s-curve corrective factor was introduced to compute the glare probability when varies between 0 and 300 lux () [63].can also be computed using validated simplified procedures:
- –
- Using direct correlation with on a vertical plane corresponding to the occupant’s eyes height, lo location and orientation, neglecting the contribution of local quantities as presented by [64,65]. In Equation (3), the probability was re-calibrated with the vertical illuminance values only estimated from rendered images [64], while Equation (4) validated in a virtual environment a simplified definition computing illuminance values only using ray-tracing methods (contribution of contrast is neglected).
- –
- Glare can also be directly computed using the CIE Glare Index (CGI): born as a correction of the British Glare Index (), presented by Einhorn [67]; and then upgraded into the Unified Glare Rating (UGR). It is a short-term, local and one-tailed glare index based on the split contribution of the direct and diffuse .
- Finally, glare can also be addressed indirectly by identifying the areas of a building which are subjected to levels over certain threshold, that is either:
- –
- Over an upper E comfort threshold (>2000 ÷ 3000 lux is typically used), which can be described using the overlit portion of ;
- –
- Over a maximum E comfort threshold, but sustained for a determined number of hours, as the defined in the case of Annual Sun Exposure (ASE), indicates the possibility of glare occurrence (>1000 lux over 250 h per year, is often used) [59].
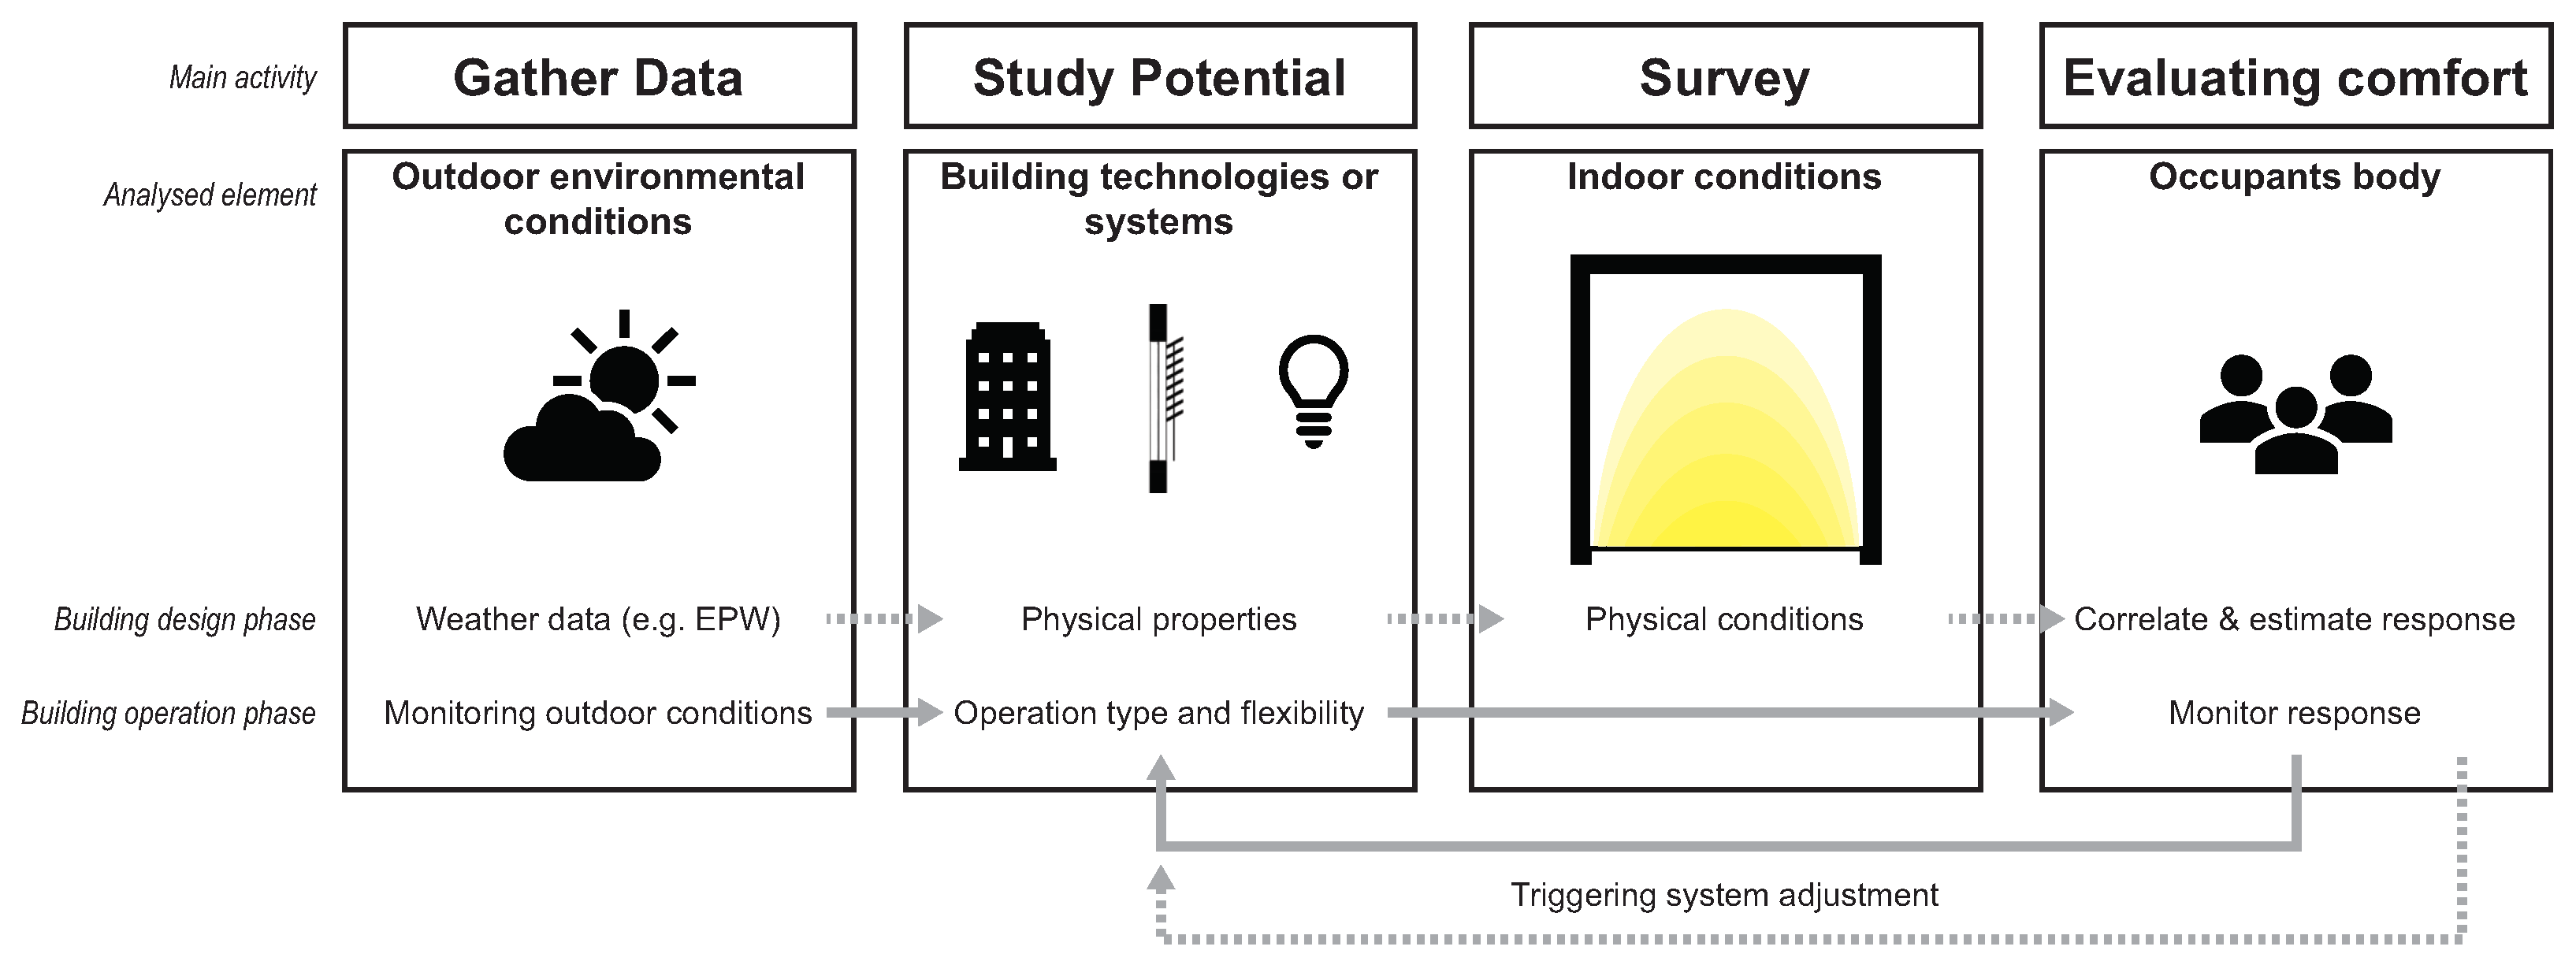
4.2. Current Lighting Design Assessment Strategies
4.2.1. Assessment Methods under High Building Design LOD
- is monitored at the task area of each occupant or the most probable occupied area.
- the variability of the light intensity at the task area is compared for each occupant or the most probable occupied area.
- is monitored at the eye level of each occupant position, resembling illuminance at the pupil (), for one prevalent line of view or more than one direction.
- is monitored at each occupant position or glare-risk locations, for the most critical moment of the year (based on designer’s criteria) or on the location where and point-in-time when higher illuminance intensity was identified (either through or ).
- monitored at each occupant position, computed from estimated values.
4.2.2. Assessment Methods under Low Building Design LOD
- A modification of the process to rapidly estimate yearly point-in-time glare with from rendered HDR images was presented by Liu et al. [70]. It entails yearly predicted HDR images using deep neural networks from rendering only 5% of the analysis period for every line of view. This methodology showed decent accuracy compared to the results produced by Radiance - rpict function, enabling faster yearly calculations of image-based metrics (e.g., ).
- To spatially cover the visual experience and map the daylight glare class in the room on an annual basis, Giovannini et al. [71] proposed setting lower, intermediate and higher threshold limits of that would rate glare as imperceptible, perceptible and disturbing. These threshold limits are meant to be specific, as they are extracted after identifying the worst condition in the analysed room. The latter is mainly imposed as an occupant located close to the window and with a line of view perpendicular to the window surface plane (few initial point-in-time and image-based simulations are expected).
- To reduce computer simulation time while performing point-in-time and spatial analysis, optimized simulation workflows have been proposed and validated. These optimizations comprise the use of cloud computing services and the integration of graphics processing units (GPUs) [72]. For instance, Ladybug tools [73] has created a new simulation platform service based on cloud computing (i.e., Pollination [74]) able to speed up the simulation process. In particular, when a large number of design options should be tested by running them all in parallel. Jones and Reinhart [75] have developed a suite of GPU-enabled tools that implement ray-tracing functionality that speed-up both Radiance and DAYSIM process by one order of magnitude.
- To avoid extensive computer simulations for monitoring glare and lighting sufficiency, more efficient simulation workflows have been proposed. These have managed to supersede the use of rendered images. For instance, Jones [72] presented a method to fast-compute glare (133,000 times faster) based on the calculation of view factors to a discretized sky dome for estimating direct lighting. Alternatively, cubic illuminance can be computed and re-elaborated [76]. Using and to determine lighting sufficiency and computing , does not require image-based-point-in-time simulations. A cube-grid-based illuminance simulations with the centre on the hypothetical location of the occupant. It will be directional if ray-tracing engines are used (e.g., Radiance). It can be run on an annual basis and, from this, by specifying a direction of view, eye illuminance (i.e., or ) and work-plane illuminance can be directly computed (). Thus, a room can be spatially populated with cubes for mapping all conditions within a room, and posterior data post-processing by exploring multiple view directions can be carried out. This procedure can be carried out more quickly by using a practical approach presented by Cuttle [77]. Otherwise, a much simpler procedure was proposed by Raynham [78] by employing the mean indirect cubic illuminance (MICI).
5. Challenging Methods to Include Occupants Visual Comfort Perception Variance
- gender and optical correction influence to be most certainly null;
- age, self-glare assessment, iris pigmentation impact to be yet inconclusive;
- culture, somewhat likely;
- macular pigment optical density (age-dependent), cortical hyperexcitability and contrast sensitivity influence have been considered likely.
- monitoring pupil response when exposed to different lighting and work task type [86];
- screening the degree of eye opening [79];
- monitoring the view direction distribution and history under certain lighting provision [87];
- combining blinking, gaze direction, and pupil size variations records under a certain lighting environment [88]; and,
- analysing the frequency and extent of the facial muscles movement when exposed to expected discomfort glare [89].
5.1. Eye Response to Light Variations
- Pupil diameter (d): studied and condensed satisfactorily by De Groot and Gebhard [82]. An index is calculated based on the relationship between the pupil size and the luminance emitted towards it. It is grounded on a compendium of studies performed on human subjects for the medical research field of optometry. Equation (5) presents the most simplified form. Meanwhile, Equation (6) presented a greater correlation accuracy, especially when the corrected form of retinal illuminance () is used (Equation (7)) instead of the non-adjusted one (Equation (8)).where:
- : retinal illuminance [trolands]
- d: pupil diameter [mm]
- r: pupil radius [mm]
- L: luminance of the visual field [miliamberts]
- Normalized pupil size (NPS): Choi and Zhu [85] presented an analysis on how using a normalized pupil size value correlated to qualitative visual sensation communicated by the tested human subjects. The pupil size was obtained using a dedicated pupilometer, and the was computed using Equation (7).where:
- : pupil size at the current state [mm]
- : pupil size at a neutral lighting state [mm]
- Task-evoked Pupillary Response (TEPR): Klinger et al. [86] studied the pupil diameter variations when different task and lighting conditions were imposed to the human subjects, measured by head-mounted eye trackers and remote eye trackers using image processing (i.e., counting the pixels composing the pupil).
- Pupil diameter-unified formula (DU): Watson and Yellott [91] presented a review on the previous research carried out to correlate the pupil response to lighting stimulus, highlighting the equation’s accuracy, and their potential adjustments. Moreover, it proposed to combine different effects that tend to deviate the pupils’ diameter calculation (i.e., L, age, field size and the monocular effect) to construct Equation (10) (applicable for occupants aged between 20–83).where:
- L: luminance [cd/m2]
- a: area [deg2]
- y: age of the human subject
- : minimum/reference/benchmark age
- Degree of Eye Opening (DEO): Yamin Garreton et al. [79] presented an analysis on how to use a normalized eye (or eyelid) height value. The pupil size was obtained using an analysis of images recording the state of the eyelid in correspondence with the maximum eye height (Equation (11)).where:
- : eye/eyelid height [mm] or [pixels]
- : maximum eye/eyelid height [mm] or [pixels]
6. Emerging Occupant-Centred Visual Comfort Methods for Operating Building Lighting-Related Components
6.1. Monitoring Occupants’ Work Plane
- Jia et al. [100] presented a platform-based design framework for BMS considering data acquired from a camera, illuminance, temperature, CO2, relative humidity (RH) and passive infra-red (PIR) sensors, and occupants’ requests via mobile applications; managing decisions throughout the use of fuzzy logic to run HVAC and lighting appliances.
- Konstantakopoulos et al. [101] proposed the automation of shared lighting appliances through game theory for processing the building occupants’ vote on lighting preferences.
- Reinhart [102] presented an approach of a light-switching and blind-operation model within a two occupants office, in which using simulation methods approach resulted in a 20% lighting energy reduction achieved by monitoring at every desk: occupants presence, light and radiation intensity, light appliances condition (ON/OFF) and predicting the possibility of turning them ON upon arrival [103], or during the day [22], and of turning them OFF [104].
- Gunay et al. [105] tested and studied the work-plane illuminance set-points of a control strategy for light-switching and blind operation on single office space through simulations with EnergyPlus with dynamically updated operation thresholds (modified by the probability models of user-interaction [22,103,104]). As a result, energy use reductions between 25–35% were achieved.
- Cheng et al. [106] studied the personal occupant visual comfort in parallel with energy savings (weighting cooling vs. lighting energy needs) and slat inclination angles of venetian blinds, monitoring lighting conditions with illuminance sensors on the desk and occupants interactions within a recreated office space facing east. The acquired datas was used to train and adjust the thresholds through a Q-learning process, leading to an energy saving potential up to 10%.
- Van De Meugheuvel et al. [107] proposed a different approach by studying ceiling-mounted sensor configuration through simulations in DIALux [108]. Using multiple intelligent dimmable luminaries equipped with occupancy and light sensors. These were calibrated at night to reach = 500 lux, to maintain desired lighting conditions working as stand-alone systems or as an integrated system network (for optimized luminaries activation also see Rubinstein et al., Caicedo and Pandharipande [109,110]).
- Jin et al. [111] studied the Indoor Environmental Quality (IEQ) by continuously monitoring an office area by a moving punctual reading (mounting sensors on a robot, including ). Doing so, it is possible to interpolate and map the total area conditions with decent accuracy, given the surveyed values obtained while moving the robot throughout a predefined path.
6.2. Monitoring Occupants’ Field of View
- Image-based—Although these methods demand higher computation time, they are the ones capable of capturing different aspects that, as discussed previously, can alter the perception of the surrounding luminous environment.
- –
- Guerry et al. [112] proposed an innovative image-based methodology on the evaluation of contrast able to take into consideration visual impairments in health. The proposed method screens the produced images, identifying disturbing surfaces or elements within the field of view, based on a set threshold of contrast of luminance between two juxtaposed surfaces.
- –
- Based on the work of Glenn et al. [113] for the automotive sector, aiming to reduce night accidents due to wrong street lighting disposition and intensity; Zatari et al. [114] studied the possibility of automatizing this methodology for estimating glare risk, L and in real-time by employing Charge Coupled Device (CCD) cameras mounted on a vehicle.
- –
- Based on the results obtained by Wienold and Christoffersen [63], Konis [115] presented an actual office space survey on 14 participants, coupling HDR images analysis (captured with CCD cameras oriented to the most frequent occupants’ field of view) with polling station results on visual comfort rating; in order to test the accuracy in terms of glare rating estimation, with horizontal and based computations.
- –
- Using CCD cameras as a data acquisition system, it is possible to make, calibrate, and compute and L from HDR images. These can be later used to monitor the interior conditions of an environment, as done by Parsae et al. [116] and Inanici [117]. The latter proposed the calculation by using the RGB values of an image and the reference illuminant, which after the proper calibrations, and accounting for the camera settings (e.g., exposure, focal length), obtained errors below 8% when testing the methodology under different light sources. On the other hand, Moeck [118] proposed a geometrical-based procedure to understand the illuminance value coming from a certain surface using CCD cameras and HDR images, acknowledging not only the camera settings, but also the distance between the objects and the camera. Under controlled conditions, the error obtained was below 5%.
- –
- Goovaerts et al. [119] tested the computation of from HDR images created from low-resolution camera pictures while monitoring , to establish a venetian and roller blind control algorithm aiming to avoid the occurrence of visual discomfort. The was initially calculated, and then the strategy was tested on those users which interacted with the shading systems to increase daylight influx indoors. However, the was found to be underestimating the light intensity adaptation, and the to be overestimating the glare risk rating.
- –
- Motamed et al. [120] used two HDR ceiling vision sensors for monitoring work-plane illuminance (ceiling mounted) and (oriented towards occupants’ visual display terminal (VDT)). This was done to lay down an advanced control algorithm for external roller blinds, which could in real-time, through fuzzy logic use, review the task illuminance compliance and glare risk from DGP values. By using this control logic to operate the external blinds confronted with a reference Eh at work-plane control, although all 30 subjects reported only slight variations on visual perception between control logics, energy needs from electrical appliances were reduced up to 31% compared to operate the roller blinds from monitored at the work plane.
- Wearable—The use of wearable devices for indoor monitoring was initially proposed by researchers assessing thermal comfort, later embraced by the research stream in visual comfort. They have resulted in very useful input for the building management systems as they communicate a more localized and personalized measurement of environmental conditions. However, from the literature analysis, the collected strategies hereby presented are only applicable for assessing buildings during operation.
- –
- Similar to the methodology employed by Sarey Khanie et al. [92] to define , Schneider et al. [121] developed a prototype of a head-mounted camera, for studying human gaze-behaviour. Using a video-oculography device (VOG) and a camera motion device, synchronously measure binocular eye positions at up to 600 Hz, it is possible to acknowledge where and what the user is seeing or looking at. These could ease any gaze driven analysis for visual comfort, but the degree of intrusiveness is yet too high to consider it for continuous monitoring.
- –
- Yamin Garreton et al. [79] proposed Equation (11) for computing glare risk rating as . Using an eye-tracker, they computed this metric and tested it on 20 subjects within a recreated office space. Based on the eye-lid position, it displayed a decent correlation with and , under a wide range of lighting conditions (both low intensity/diffuse and high intensity/clear sky conditions). However, it still represents a highly intrusive method for continuous monitoring of the indoor environment lighting conditions and occupant perception.
- –
- Choi and Zhu [85] investigated the potential of tracking the human pupil size to estimate visual sensation in office workplace environments. Profiting from its physiological capacity, as it reacts instantly with the visual environment variations. The tests were carried out on 20 subjects within a recreated office space, under different artificial lighting conditions and constant RH (avoiding dry-eye irritation effect). Pupil behaviour was monitored with a mobile pupilometer and the light intensity at the work-plane () with an illuminance meter. Although the intrusiveness is lower than in previously exposed studies, it is yet too restrictive to be applied as monitored visual comfort metric in operating buildings (requires users to wear the pupilometer constantly), and no shading effect from the eyelids was considered.
7. Discussion
Limitations
8. Conclusions and Further Developments
- In the instance of existing buildings for monitoring:
- –
- Transferring and integrating novel and growing technologies such as computer vision, image processing, scene understanding, and deep learning can further enable monitoring and operation strategies. They can help identify occupancy type (including occupant characteristics) that can be feed to the BMS for operational profiling. They can potentially decrease the level of intrusiveness for monitoring body response. Or, making components responsive, with data-training models able to capture occupant interactions and predict occupant needs [123].
- –
- Lean sensorial network and internet of things implementation have great potential to better interpret and communicate occupancy, overall indoor conditions and personalized task area conditions [124,125]. If these are fully integrated into a flexible plant system, personalized or localized building responses can be activated for providing, overall, better indoor environmental quality.
- –
- Alternatively, qualitative surveys and post occupancy evaluations can be utilized in real-time for requesting to the building specific operation adjustments. Comparable to the upgrade of a traditional manual control enhanced by digital technologies [126].
- In the instance of both existing and new buildings for design:
- –
- Data acquired in occupancy studies could serve better for understanding building occupant preferences in tendency in occupation, lighting appliances and blinds activation schedules, and space occupation (complementing missing information according to the specific LOD) (i.e., occupant modelling) [10]. Then, these data can be used for a more accurate simulation output with realistic occupant behaviour [127].
- –
- Diversified post-occupancy surveys on perception of the luminous environment (or visual comfort rating) could be used for training algorithms and defining prediction models resulting in average virtual occupant typology. Or, with such databases, occupants’ preferences profiling can be carried out to adjust traditional or new visual comfort performance metrics [128].
- –
- Furthermore, utilizing personalized and complex visual comfort performance metrics would yield the analysis more complete. These could include demographics and spatial dependent factors by fine-tuning the correlating between body response (in this case the eye for visual comfort, using d and/or ) with environmental parameters (i.e., , or , and ).
- –
- To assure that such calculations are done within applicable computational time, annual and spatial simulations could be: (i) performed using daylight coefficients, or cubic illuminance, instead of rendered-image-based analysis [72]; (ii) they can be structured in a way that these can be parametric so they can be run in parallel through cloud computing services [74]; (iii) Or, as a mid-term solution, simulations can be decomposed in such a way that many smaller and more specialized cores can be used to process the computational task (delivering higher computational performance) in GPUs [75].
Author Contributions
Funding
Institutional Review Board Statement
Informed Consent Statement
Data Availability Statement
Conflicts of Interest
Abbreviations
| Annual Sun Exposure | |
| BEM | building energy modelling |
| British Glare Index | |
| BMS | Building Management System |
| CCD | Charge Coupled Device |
| continuous Daylight Autonomy | |
| International Commission on Illumination Glare Index | |
| Pupil diameter unified formula | |
| Daylight Autonomy | |
| Degree of Eye Opening | |
| Daylight Factor | |
| Daylight Glare Probability | |
| simplified Daylight Glare Probability | |
| E | Illuminance |
| Horizontal illuminance | |
| Pupil illuminance | |
| Retinal illuminance | |
| Vertical illuminance | |
| Gaze driven illuminance | |
| EN | European Committee for Standardization (CEN) standard |
| Frequency of Visual Comfort | |
| HDR | High Dynamic Range |
| HVAC | Heating, Ventilation and Air Conditioning |
| IEQ | Indoor Air Quality |
| Intensity of Visual Discomfort | |
| KPI | Key Performance Indicator |
| L | Luminance |
| Normalized pupil size | |
| RGB | Red, Blue and Green colour space |
| RH | Relative humidity |
| spatial DA | |
| Task-evoked Pupillary Response | |
| Daylight Uniformity | |
| Useful Daylight Illuminance | |
| VDT | Video Display Terminal |
References
- Matz, C.J.; Stieb, D.M.; Davis, K.; Egyed, M.; Rose, A.; Chou, B.; Brion, O. Effects of Age, Season, Gender and Urban-Rural Status on Time-Activity: Canadian Human Activity Pattern Survey 2 (CHAPS 2). Int. J. Environ. Res. Public Health 2014, 11, 2108–2124. [Google Scholar] [CrossRef] [PubMed]
- Klepeis, N.E.; Nelson, W.C.; Ott, W.R.; Robinson, J.P.; Tsang, A.M.; Switzer, P.; Behar, J.V.; Hern, S.C.; Engelmann, W.H. The National Human Activity Pattern Survey (NHAPS): A resource for assessing exposure to environmental pollutants. J. Expo. Sci. Environ. Epidemiol. 2001, 11, 231–252. [Google Scholar] [CrossRef] [PubMed]
- ANSI; ASHRAE. ANSI/ASHRAE Standard 55–2017: Thermal Environmental Conditions for Human Occupancy; Technical Report; ANSI: New York, NY, USA; ASHRAE: Atlanta, GA, USA, 2017. [Google Scholar]
- ISO 7730:2005; Ergonomics of the Thermal Environment—Analytical Determination and Interpretation of Thermal Comfort Using Calculation of the PMV and PPD Indices and Local Thermal Comfort Criteria. ISO: Bristol, UK, 2005.
- UN Environment Programme. SDG11:Sustainable Cities and Communities Make Cities and Human Settlements Inclusive, Safe, Resilient and Sustainable. Available online: https://www.unenvironment.org/explore-topics/sustainable-development-goals/why-do-sustainable-development-goals-matter/goal-11 (accessed on 7 March 2018).
- Directive EPBD Recast. Directive 2010/31/EU of the European Parliament and of the Council of 19 May 2010 on the energy performance of buildings (recast). Off. J. Eur. Union 2010, 18, 2010. [Google Scholar]
- Directive EE. Directive 2012/27/EU of the European Parliament and of the Council of 25 October 2012 on energy efficiency, amending Directives 2009/125/EC and 2010/30/EU and repealing Directives 2004/8/EC and 2006/32. Off. J. Eur. Union 2012, 315, 1–56. [Google Scholar]
- Erhorn, H.; Erhorn-Kluttig, H. Terms and definitions for high performance buildings. In Detailed Report for the Concerted Action, Energy Performance of Buildings; European Union: Luxembourg, 2011. [Google Scholar]
- Masoso, O.T.; Grobler, L.J. The dark side of occupants’ behaviour on building energy use. Energy Build. 2010, 42, 173–177. [Google Scholar] [CrossRef]
- Happle, G.; Fonseca, J.A.; Schlueter, A. Impacts of diversity in commercial building occupancy profiles on district energy demand and supply. Appl. Energy 2020, 277, 115594. [Google Scholar] [CrossRef]
- Hong, T.; Yan, D.; D’Oca, S.; Chen, C.F. Ten questions concerning occupant behavior in buildings: The big picture. Build. Environ. 2016, 114, 518–530. [Google Scholar] [CrossRef]
- Arens, E.; Humphreys, M.A.; de Dear, R.; Zhang, H. Are ‘class A’ temperature requirements realistic or desirable? Build. Environ. 2010, 45, 4–10. [Google Scholar] [CrossRef]
- Boerstra, A.; Beuker, T.; Loomans, M.; Hensen, J. Impact of available and perceived control on comfort and health in European offices. Archit. Sci. Rev. 2013, 56, 30–41. [Google Scholar] [CrossRef]
- Frontczak, M.; Wargocki, P. Literature survey on how different factors influence human comfort in indoor environments. Build. Environ. 2011, 46, 922–937. [Google Scholar] [CrossRef]
- Kamaruzzaman, S.; Egbu, C.; Zawawi, E.; Ali, A.; Che-Ani, A. The effect of indoor environmental quality on occupants’ perception of performance: A case study of refurbished historic buildings in Malaysia. Energy Build. 2011, 43, 407–413. [Google Scholar] [CrossRef]
- Dogbeh, A.; Jomaas, G.; Bjarlov, S.P.; Toftum, J. Field study of the indoor environment in a Danish prison. Build. Environ. 2014, 88, 20–26. [Google Scholar] [CrossRef]
- Mirrahimi, S.; Mohamed, M.F.; Haw, L.C.; Ibrahim, N.L.N.; Yusoff, W.F.M.; Aflaki, A. The effect of building envelope on the thermal comfort and energy saving for high-rise buildings in hot-humid climate. Renew. Sustain. Energy Rev. 2016, 53, 1508–1519. [Google Scholar] [CrossRef]
- Suratkon, A.; Chan, C.M.; Jusoh, S. Indicators for measuring satisfaction towards design quality of buildings. Int. J. Geomate 2016, 11, 2348–2355. [Google Scholar] [CrossRef]
- Konstantoglou, M.; Tsangrassoulis, A. Dynamic operation of daylighting and shading systems: A literature review. Renew. Sustain. Energy Rev. 2016, 60, 268–283. [Google Scholar] [CrossRef]
- Da Silva, P.C.; Leal, V.; Andersen, M. Influence of shading control patterns on the energy assessment of office spaces. Energy Build. 2012, 50, 35–48. [Google Scholar] [CrossRef]
- Gunay, H.B.; O’Brien, W.; Beausoleil-Morrison, I.; Gilani, S. Development and implementation of an adaptive lighting and blinds control algorithm. Build. Environ. 2017, 113, 185–199. [Google Scholar] [CrossRef]
- Reinhart, C.F.; Voss, K. Monitoring manual control of electric lighting and blinds. Light. Res. Technol. 2003, 35, 258–259. [Google Scholar] [CrossRef]
- Bourgeois, D.; Reinhart, C.; Macdonald, I. Adding advanced behavioural models in whole building energy simulation: A study on the total energy impact of manual and automated lighting control. Energy Build. 2006, 38, 814–823. [Google Scholar] [CrossRef]
- Escuyer, S.; Fontoynont, M. Lighting controls: A field study of office workers’ reactions. Light. Res. Technol. 2001, 33, 77–94. [Google Scholar] [CrossRef]
- Wang, S.; Chen, B.; Suo, J.; Zhao, J.R. Impact of building morphology and outdoor environment on light and thermal environment in campus buildings in cold region during winter. Build. Environ. 2021, 204, 108074. [Google Scholar] [CrossRef]
- Mahmoudzadeh, P.; Afacan, Y.; Adi, M.N. Analyzing occupants’ control over lighting systems in office settings using immersive virtual environments. Build. Environ. 2021, 196, 107823. [Google Scholar] [CrossRef]
- Da Silva, P.C.; Leal, V.; Andersen, M. Occupants interaction with electric lighting and shading systems in real single-occupied offices: Results from a monitoring campaign. Build. Environ. 2013, 64, 152–168. [Google Scholar] [CrossRef]
- Yun, G.Y.; Kim, H.; Kim, J.T. Effects of occupancy and lighting use patterns on lighting energy consumption. Energy Build. 2012, 46, 152–158. [Google Scholar] [CrossRef]
- Rea, M.; Dillon, R.; Levy, A. The effectiveness of light switch reminders in reducing light usage. Light. Res. Technol. 1987, 19, 81–85. [Google Scholar] [CrossRef]
- Azar, E.; Menassa, C.C. Agent-Based Modeling of Occupants and Their Impact on Energy Use in Commercial Buildings. J. Comput. Civ. Eng. 2012, 26, 506–518. [Google Scholar] [CrossRef]
- Panda, S. Circadian physiology of metabolism. Science 2016, 354, 1008–1015. [Google Scholar] [CrossRef] [PubMed]
- Turner, P.L.; Mainster, M.A. Circadian photoreception: Ageing and the eye’s important role in systemic health. Br. J. Ophthalmol. 2008, 92, 1439–1444. [Google Scholar] [CrossRef] [PubMed]
- Winn, B.; Whitaker, D.; Elliott, D.B.; Phillips, N.J. Factors affecting light-adapted pupil size in normal human subjects. Investig. Ophthalmol. Vis. Sci. 1994, 35, 1132–1137. [Google Scholar]
- Bitsios, P.; Prettyman, R.; Szabadi, E. Changes in Autonomic Function with Age: A Study of Pupillary Kinetics in Healthy Young and Old People. Age Ageing 1996, 25, 432–438. [Google Scholar] [CrossRef] [PubMed]
- Kumnick, L.S. Aging and the efficiency of the pupillary mechanism. J. Gerontol. 1956, 11, 160–164. [Google Scholar] [CrossRef] [PubMed]
- Pierson, C.; Wienold, J.; Bodart, M. Review of Factors Influencing Discomfort Glare Perception from Daylight. Leukos 2018, 14, 111–148. [Google Scholar] [CrossRef]
- Tsushima, S.; ichi Tanabe, S.; Utsumi, K. Workers’ awareness and indoor environmental quality in electricity-saving offices. Build. Environ. 2015, 88, 10–19. [Google Scholar] [CrossRef]
- Ahmadi-Karvigh, S.; Ghahramani, A.; Becerik-Gerber, B.; Soibelman, L. One size does not fit all: Understanding user preferences for building automation systems. Energy Build. 2017, 145, 163–173. [Google Scholar] [CrossRef]
- Liang, X.; Hong, T.; Shen, G.Q. Occupancy data analytics and prediction: A case study. Build. Environ. 2016, 102, 179–192. [Google Scholar] [CrossRef]
- Wilke, U.; Haldi, F.; Scartezzini, J.L.; Robinson, D. A bottom-up stochastic model to predict building occupants’ time-dependent activities. Build. Environ. 2013, 60, 254–264. [Google Scholar] [CrossRef]
- Adamopoulou, A.A.; Tryferidis, A.M.; Tzovaras, D.K. A context-aware method for building occupancy prediction. Energy Build. 2016, 110, 229–244. [Google Scholar] [CrossRef]
- Mahdavi, A.; Tahmasebi, F. Predicting people’s presence in buildings: An empirically based model performance analysis. Energy Build. 2015, 86, 349–355. [Google Scholar] [CrossRef]
- D’Oca, S.; Hong, T. Occupancy schedules learning process through a data mining framework. Energy Build. 2015, 88, 395–408. [Google Scholar] [CrossRef]
- Yang, J.; Santamouris, M.; Lee, S.E.; Deb, C. Energy performance model development and occupancy number identification of institutional buildings. Energy Build. 2016, 123, 192–204. [Google Scholar] [CrossRef]
- Stoppel, C.M.; Leite, F. Integrating probabilistic methods for describing occupant presence with building energy simulation models. Energy Build. 2014, 68, 99–107. [Google Scholar] [CrossRef]
- Langevin, J.; Gurian, P.L.; Wen, J. Tracking the human–building interaction: A longitudinal field study of occupant behavior in air-conditioned offices. J. Environ. Psychol. 2015, 42, 94–115. [Google Scholar] [CrossRef]
- Yan, D.; Hong, T.; Dong, B.; Mahdavi, A.; D’Oca, S.; Gaetani, I.; Feng, X. IEA EBC Annex 66: Definition and simulation of occupant behavior in buildings. Energy Build. 2017, 156, 258–270. [Google Scholar] [CrossRef]
- Wagner, A.; O’Brien, L. Occupant Behaviour-Centric building Design and Operation EBC Annex 79 (Draft); Technical Report May; International Energy Agency: Paris, France, 2018. [Google Scholar]
- Andrews, C.J.; Yi, D.; Krogmann, U.; Senick, J.A.; Wener, R.E. Designing buildings for real occupants: An agent-based approach. IEEE Trans. Syst. Man Cybern. Part A Syst. Hum. 2011, 41, 1077–1091. [Google Scholar] [CrossRef]
- CIE. Lighting Needs for the Partially Sighted; Technical Report; International Comission on Illumination (CIE): Vienna, Austria, 1997. [Google Scholar]
- Al Horr, Y.; Arif, M.; Kaushik, A.; Mazroei, A.; Katafygiotou, M.; Elsarrag, E. Occupant Product. Off. A Indoor Environ. Qual. Rev. Lit. 2016, 105, 369–389. [Google Scholar] [CrossRef]
- EN ISO 8996; Ergonomics of the Thermal Environment—Determination of Metabolic Rate. ISO: Bristol, UK, 2004.
- Bourne, R.R.; Flaxman, S.R.; Braithwaite, T.; Cicinelli, M.V.; Das, A.; Jonas, J.B.; Keeffe, J.; Kempen, J.; Leasher, J.; Limburg, H.; et al. Magnitude, temporal trends, and projections of the global prevalence of blindness and distance and near vision impairment: A systematic review and meta-analysis. Lancet Glob. Health 2017, 5, e888–e897. [Google Scholar] [CrossRef]
- Ko, W.H.; Kent, M.G.; Schiavon, S.; Levitt, B.; Betti, G. A Window View Quality Assessment Framework. Leukos 2021, 1–26. [Google Scholar] [CrossRef]
- Walsh, J.W.T. The Early Years of Illuminating Engineering in Great Britain. Light. Res. Technol. 1951, 16, 49–60. [Google Scholar] [CrossRef]
- BS 8206-2; Lighting for Buildings—Part 2: Code of Practice for Daylighting. British Standard Institution (BSI): London, UK, 2008.
- European Standard EN 17037; Daylight in Buildings. British Standard Institution (BSI): London, UK, 2018.
- Reinhart, C.F.; Walkenhorst, O. Validation of dynamic RADIANCE-based daylight simulations for a test office with external blinds. Energy Build. 2001, 33, 683–697. [Google Scholar] [CrossRef]
- IES LM-83-12; Approved Method: IES Spatial Daylight Autonomy (sDA) and Annual Sunlight Exposure (ASE). IES: Tokyo, Japan, 2012.
- Nabil, A.; Mardaljevic, J. Useful daylight illuminances: A replacement for daylight factors. Energy Build. 2006, 38, 905–913. [Google Scholar] [CrossRef]
- Sicurella, F.; Evola, G.; Wurtz, E. A statistical approach for the evaluation of thermal and visual comfort in free-running buildings. Energy Build. 2012, 47, 402–410. [Google Scholar] [CrossRef]
- EN 12464-1; Light and Lighting—Lighting of Work Places Part 1: Indoor Work Places. International Standard Organization: Geneva, Switzerland, 2011; pp. 1–57.
- Wienold, J.; Christoffersen, J. Evaluation methods and development of a new glare prediction model for daylight environments with the use of CCD cameras. Energy Build. 2006, 38, 743–757. [Google Scholar] [CrossRef]
- Wienold, J. Dynamic simulation of blind control strategies for visual comfort and energy balance analysis. In Building Simulation; IBPSA: Beijing, China, 2007; pp. 1197–1204. [Google Scholar]
- Hviid, C.A.; Nielsen, T.R.; Svendsen, S. Simple tool to evaluate the impact of daylight on building energy consumption. Sol. Energy 2008, 82, 787–798. [Google Scholar] [CrossRef]
- Ward, G.; Shakespeare, R. Rendering with Radiance: The Art and Science of Lighting Visualization; SciX Open Publishing: San Francisco, CA, USA, 1998. [Google Scholar]
- Einhorn, H. Discomfort glare: A formula to bridge differences. Light. Res. Technol. 1979, 11, 90–94. [Google Scholar] [CrossRef]
- Kirimtat, A.; Koyunbaba, B.K.; Chatzikonstantinou, I.; Sariyildiz, S. Review of simulation modeling for shading devices in buildings. Renew. Sustain. Energy Rev. 2016, 53, 23–49. [Google Scholar] [CrossRef]
- Directive EE. Commission Delegated Regulation (EU) 2020/2155 of 14 October 2020 supplementing Directive (EU) 2010/31/EU of the European Parliament and of the Council by establishing an optional common European Union scheme for rating the smart readiness of buildings. Off. J. Eur. Union 2020, 431, 9–24. [Google Scholar]
- Liu, Y.; Colburn, A.; Inanici, M. Computing long-term daylighting simulations from high dynamic range imagery using deep neural networks. In Building Performance Analysis Conference and SimBuild; Zillow Group, University of Washington: Seattle, WA, USA, 2018; pp. 119–126. [Google Scholar]
- Giovannini, L.; Favoino, F.; Lo Verso, V.; Pellegrino, A.; Serra, V. A Simplified Approach for the Annual and Spatial Evaluation of the Comfort Classes of Daylight Glare Using Vertical Illuminances. Buildings 2018, 8, 171. [Google Scholar] [CrossRef]
- Jones, N.L.; Reinhart, C.F. Fast daylight coefficient calculation using graphics hardware. In Proceedings of the BS2015: 14th International Conference of the International Building Performance Simulation Association, Hyderabad, India, 7–9 December 2015; pp. 1237–1244. [Google Scholar]
- Ladybug-Tools. Cross-Platform Python Libraries and Plugins for Grasshopper and Dynamo. Available online: https://www.ladybug.tools/ (accessed on 9 March 2022).
- Ladybug-Tools. Pollination—Platform for Environmental Simulation. Available online: https://www.pollination.cloud/ (accessed on 9 March 2022).
- Jones, N.L.; Reinhart, C.F. Physically based global illumination calculation using graphics hardware. In Proceedings of the eSim 2014: The Canadian Conference on Building Simulation, Ottawa, ON, Canada, 7–10 May 2014; pp. 474–487. [Google Scholar]
- Cuttle, C. Cubic illumination. Int. J. Light. Res. Technol. 1997, 29, 1–14. [Google Scholar] [CrossRef]
- Cuttle, C. Research note: A practical approach to cubic illuminance measurement. Light. Res. Technol. 2014, 46, 31–34. [Google Scholar] [CrossRef]
- Raynham, P.; Unwin, J.; Guan, L. A new metric to predict perceived adequacy of illumination. Light. Res. Technol. 2019, 51, 642–648. [Google Scholar] [CrossRef]
- Yamin Garretón, J.; Rodriguez, R.; Ruiz, A.; Pattini, A. Degree of eye opening: A new discomfort glare indicator. Build. Environ. 2015, 88, 142–150. [Google Scholar] [CrossRef]
- Goncharov, A.V.; Dainty, C. Wide-field schematic eye models with gradient-index lens. J. Opt. Soc. Am. A 2007, 24, 2157. [Google Scholar] [CrossRef] [PubMed]
- Reinhart, C.F. Daylighting Handbook I: Fundamentals, Designing with the Sun; Christoph Reinhart: Cambridge, MA, USA, 2014. [Google Scholar] [CrossRef]
- De Groot, S.G.; Gebhard, J.W. Pupil size as determined by adapting luminance. J. Opt. Soc. Am. 1952, 42, 492–495. [Google Scholar] [CrossRef] [PubMed]
- Fugate, J.M.; Fry, G.A. Relation of changes in pupil size to visual discomfort. Illum. Eng. 1956, 51, 537. [Google Scholar]
- Fry, G.A.; King, V.M. The Pupillary Response and Discomfort Glare. J. Illum. Eng. Soc. 1975, 4, 307–324. [Google Scholar] [CrossRef]
- Choi, J.H.; Zhu, R. Investigation of the potential use of human eye pupil sizes to estimate visual sensations in the workplace environment. Build. Environ. 2015, 88, 73–81. [Google Scholar] [CrossRef]
- Klingner, J.; Kumar, R.; Hanrahan, P. Measuring the task-evoked pupillary response with a remote eye tracker. In Proceedings of the 2008 Symposium on Eye Tracking Research & Applications-ETRA ’08, Savannah, GA, USA, 26–28 March 2008; ACM Press: New York, NY, USA, 2008; Volume 1, p. 69. [Google Scholar] [CrossRef]
- Sarey, K.M.; Andersen, M.; Hart, B.M.; Stoll, J.; Einhäuser, W. Integration of Eye-Tracking Methods in Visual Comfort Assessments; CISBAT 11; EPFL: Lausanne, Switzerland, 2011; pp. 14–15. [Google Scholar]
- Hamedani, Z.; Solgi, E.; Hine, T.; Skates, H. Revealing the relationships between luminous environment characteristics and physiological, ocular and performance measures: An experimental study. Build. Environ. 2020, 172, 106702. [Google Scholar] [CrossRef]
- Berman, S.; Bullimore, M.; Jacobs, R.; Bailey, I.; Gandhi, N. An Objective Measure of Discomfort Glare. J. Illum. Eng. Soc. 1994, 23, 40–49. [Google Scholar] [CrossRef]
- Al horr, Y.; Arif, M.; Katafygiotou, M.; Mazroei, A.; Kaushik, A.; Elsarrag, E. Impact of indoor environmental quality on occupant well-being and comfort: A review of the literature. Int. J. Sustain. Built Environ. 2016, 5, 1–11. [Google Scholar] [CrossRef]
- Watson, A.B.; Yellott, J.I. A unified formula for light-adapted pupil size. J. Vis. 2012, 12, 12. [Google Scholar] [CrossRef] [PubMed]
- Sarey Khanie, M.; Stoll, J.; Einhäuser, W.; Wienold, J.; Andersen, M. Gaze and discomfort glare, Part 1: Development of a gaze-driven photometry. Light. Res. Technol. 2017, 49, 845–865. [Google Scholar] [CrossRef]
- Kadlec, P.; Gabrys, B.; Strandt, S. Data-driven Soft Sensors in the process industry. Comput. Chem. Eng. 2009, 33, 795–814. [Google Scholar] [CrossRef]
- Lee, J.; Kao, H.A.; Yang, S. Service innovation and smart analytics for Industry 4.0 and big data environment. Procedia CIRP 2014, 16, 3–8. [Google Scholar] [CrossRef]
- Wu, S.; Clements-Croome, D. Understanding the indoor environment through mining sensory data—A case study. Energy Build. 2007, 39, 1183–1191. [Google Scholar] [CrossRef]
- Poli, T.; Mainini, A.G.; Speroni, A.; Cadena, J.D.B.; Moretti, N. The Effect of Real-Time Sensing of a Window on Energy Efficiency, Comfort, Health and User Behavior. In Digital Transformation of the Design, Construction and Management Processes of the Built Environment; Springer: Berlin/Heidelberg, Germany, 2020; pp. 291–296. [Google Scholar]
- Rinaldi, S.; Bellagente, P.; Ciribini, A.L.C.; Tagliabue, L.C.; Poli, T.; Mainini, A.G.; Speroni, A.; Blanco Cadena, J.D.; Lupica Spagnolo, S. A Cognitive-Driven Building Renovation for Improving Energy Efficiency: The Experience of the ELISIR Project. Electronics 2020, 9, 666. [Google Scholar] [CrossRef]
- Karjalainen, S. Should we design buildings that are less sensitive to occupant behaviour? A simulation study of effects of behaviour and design on office energy consumption. Energy Effic. 2016, 9, 1257–1270. [Google Scholar] [CrossRef]
- O’Brien, W.; Gaetani, I.; Carlucci, S.; Hoes, P.J.; Hensen, J.L. On occupant-centric building performance metrics. Build. Environ. 2017, 122, 373–385. [Google Scholar] [CrossRef]
- Jia, R.; Jin, B.; Jin, M.; Zhou, Y.; Konstantakopoulos, I.C.; Zou, H.; Kim, J.; Li, D.; Gu, W.; Arghandeh, R.; et al. Design Automation for Smart Building Systems. Proc. IEEE 2018, 106, 1680–1699. [Google Scholar] [CrossRef]
- Konstantakopoulos, I.C.; Ratliff, L.J.; Jin, M.; Sastry, S.S.; Spanos, C.J. A Robust Utility Learning Framework via Inverse Optimization. IEEE Trans. Control Syst. Technol. 2018, 26, 954–970. [Google Scholar] [CrossRef]
- Reinhart, C.F. Lightswitch-2002: A model for manual and automated control of electric lighting and blinds. Sol. Energy 2004, 77, 15–28. [Google Scholar] [CrossRef]
- Hunt, D. Predicting artificial lighting use—A method based upon observed patterns of behaviour. Light. Res. Technol. 1980, 12, 7–14. [Google Scholar] [CrossRef]
- Pigg, S.; Eilers, M.; Reed, J. Behavioral aspects of lighting and occupancy sensors in private offices: A case study of a university office building. In ACEEE 1996 Summer Study on Energy Efficiency in Buildings; American Council for an Energy Efficient Economy (ACEEE): Asilomar, CA, USA, 1996; pp. 161–170. [Google Scholar]
- Gunay, H.B.; O’Brien, W.; Beausoleil-Morrison, I.; Huchuk, B. On adaptive occupant-learning window blind and lighting controls. Build. Res. Inf. 2014, 42, 739–756. [Google Scholar] [CrossRef]
- Cheng, Z.; Zhao, Q.; Wang, F.; Jiang, Y.; Xia, L.; Ding, J. Satisfaction based Q-learning for integrated lighting and blind control. Energy Build. 2016, 127, 43–55. [Google Scholar] [CrossRef]
- Van De Meugheuvel, N.; Pandharipande, A.; Caicedo, D.; Van Den Hof, P.P.J. Distributed lighting control with daylight and occupancy adaptation. Energy Build. 2014, 75, 321–329. [Google Scholar] [CrossRef]
- Fakra, A.H.; Boyer, H.; Maamari, F. Experimental validation for software DIALUX: Application in CIE test Cases for building daylighting simulation. In International Conference on Building Energy and Environment (COBEE 2008); HAL: Bengaluru, India, 2008. [Google Scholar]
- Rubinstein, F. Photoelectric control of equi-illumination lighting systems. Energy Build. 1984, 6, 141–150. [Google Scholar] [CrossRef][Green Version]
- Caicedo, D.; Pandharipande, A. Distributed Illumination Control With Local Sensing and Actuation in Networked Lighting Systems. IEEE Sens. J. 2013, 13, 1092–1104. [Google Scholar] [CrossRef]
- Jin, M.; Liu, S.; Schiavon, S.; Spanos, C. Automated mobile sensing: Towards high-granularity agile indoor environmental quality monitoring. Build. Environ. 2017, 127, 268–276. [Google Scholar] [CrossRef]
- Guerry, E.; Gălățanu, C.D.; Canale, L.; Zissis, G. Luminance contrast assessment for elderly visual comfort using imaging measurements. Procedia Manuf. 2019, 32, 474–479. [Google Scholar] [CrossRef]
- Glenn, J.; Dodds, G.; Robinson, R. Calibration and use of camera-based systems for road lighting assessment. Light. Res. Technol. 2000, 32, 33–40. [Google Scholar] [CrossRef]
- Zatari, A.; Dodds, G.; McMenemy, K.; Robinson, R. Glare, luminance, and illuminance measurements of road lighting using vehicle mounted CCD cameras. LEUKOS J. Illum. Eng. Soc. N. Am. 2004, 1, 85–106. [Google Scholar] [CrossRef]
- Konis, K. Predicting visual comfort in side-lit open-plan core zones: Results of a field study pairing high dynamic range images with subjective responses. Energy Build. 2014, 77, 67–79. [Google Scholar] [CrossRef]
- Parsaee, M.; Demers, C.M.; Potvin, A.; Lalonde, J.F.; Inanici, M.; Hébert, M. Biophilic photobiological adaptive envelopes for sub-Arctic buildings: Exploring impacts of window sizes and shading panels’ color, reflectance, and configuration. Sol. Energy 2021, 220, 802–827. [Google Scholar] [CrossRef]
- Inanici, M. Evaluation of high dynamic range photography as a luminance data acquisition system. Light. Res. Technol. 2006, 38, 123–136. [Google Scholar] [CrossRef]
- Moeck, M.; Anaokar, S. Illuminance analysis from high dynamic range images. LEUKOS J. Illum. Eng. Soc. N. Am. 2006, 2, 211–228. [Google Scholar] [CrossRef]
- Goovaerts, C.; Descamps, F.; Jacobs, V.A. Shading control strategy to avoid visual discomfort by using a low-cost camera: A field study of two cases. Build. Environ. 2017, 125, 26–38. [Google Scholar] [CrossRef]
- Motamed, A.; Deschamps, L.; Scartezzini, J.L. On-site monitoring and subjective comfort assessment of a sun shadings and electric lighting controller based on novel High Dynamic Range vision sensors. Energy Build. 2017, 149, 58–72. [Google Scholar] [CrossRef]
- Schneider, E.; Villgrattner, T.; Vockeroth, J.; Bartl, K.; Kohlbecher, S.; Bardins, S.; Ulbrich, H.; Brandt, T. EyeSeeCam: An Eye Movement-Driven Head Camera for the Examination of Natural Visual Exploration. Ann. N. Y. Acad. Sci. 2009, 1164, 461–467. [Google Scholar] [CrossRef]
- BS EN ISO 28803; Ergonomics of the Physical Environment—Application of International Standards to People with Special Requirements. ISO: Geneva, Switzerland, 2012.
- Blanco Cadena, J.D. Human Eye Kinematics for Adaptable Visual Comfort Assessment. Personalized Responsive Control Strategies to Integrate Building Envelope and Artificial Lighting. Ph.D. Thesis, Politecnico di Milano, Milan, Italy, 30 March 2020. [Google Scholar]
- Amayri, M.; Arora, A.; Ploix, S.; Bandhyopadyay, S.; Ngo, Q.D.; Badarla, V.R. Estimating occupancy in heterogeneous sensor environment. Energy Build. 2016, 129, 46–58. [Google Scholar] [CrossRef]
- Gilani, S.; O’Brien, W. Review of current methods, opportunities, and challenges for in-situ monitoring to support occupant modelling in office spaces. J. Build. Perform. Simul. 2016, 1493, 1–27. [Google Scholar] [CrossRef]
- Luna-Navarro, A.; Allen, M.; Meizoso, M.; Overend, M. BIT—Building Impulse Toolkit: A novel digital toolkit for productive, healthy and resource efficient buildings. J. Phys. Conf. Ser. 2019, 1343, 012139. [Google Scholar] [CrossRef]
- Hong, T.; Sun, H.; Chen, Y.; Taylor-Lange, S.C.; Yan, D. An occupant behavior modeling tool for co-simulation. Energy Build. 2016, 117, 272–281. [Google Scholar] [CrossRef]
- Imperadori, M.; Poli, T.; Cadena, J.D.B.; Brunone, F.; Mainini, A.G. Comparison of Comfort Performance Criteria and Sensing Approach in Office Space: Analysis of the Impact on Shading Devices’ Efficiency. In Regeneration of the Built Environment from a Circular Economy Perspective; Springer: Berlin/Heidelberg, Germany, 2020; p. 381. [Google Scholar]


| Interaction Type | Effect | Description | References |
|---|---|---|---|
| Blind operation | + | Occupants tend to open blinds to favor brighter indoor environments without glare risk. Which often leads to lower energy use, when solar radiation is not too intense. A manual control over lights and blinds could produce annual reductions in lighting loads up to 80% compared to a constant lighting activation. | [22,23] |
| + | Occupants tend to close blinds in instances of incident outdoor illuminance above 50 klux or to avoid direct sunlight above 50 W/m2. Protecting from both excessive light and radiation influx. | [22] | |
| +/− | Occupants tend to open blinds to favor brighter indoor environment without glare risk. Having a larger glare tolerance, or avoiding glare by different means, could lead to higher cooling (or lower heating) loads compared to estimated performance. | [22] | |
| − | Occupants tend not to open the blinds to increase daylight influx when sufficient outdoor illuminance is present. Which often leads to larger energy use to compensate for the lack of adequate illuminance levels. | [15,21,24] | |
| − | Occupants tend to close the blinds upon arrival regardless of the outdoor illuminance intensity, even when proper or insufficient for indoor lighting. This often leads to larger energy use of lighting appliances. | [21] | |
| − | Glare control measures can negatively affect the illuminance level and illuminance uniformity in an office. | [25] | |
| Light appliances use | + | Automatic daylight linked dimming of lights is acceptable to occupants. Although, manual dimming results in higher occupant satisfaction levels. Moreover, these systems motivate occupants to use more daylight. | [24,26] |
| + | Active automated lighting control (ON/OFF light switching with ideal photocell-based dimming and occupancy-sensing OFF switching) could lead to an annual reduction in lighting loads up to 90% if compared to a constant lighting activation scenario. | [23] | |
| + | For most users the decision to turn lights on when arriving depends on the daylight level in the room at that moment since, on average, occupants switch electric lights on more frequently in the case of low daylight induced illuminances. | [27,28] | |
| + | Manual control over lights and blinds could lead to an annual reduction in lighting loads up to 80% if compared to a constant lighting activation scenario. | [23] | |
| + | Passive reminders (i.e., stickers installed by the light switches) substantially increase the occupants’ turning off activity. Avoiding energy waste | [29] | |
| − | Forgetting lighting appliances on, when not needed can lead to an excess up to 50% of energy use. Indeed, up to 90% of manual controls occur just after the occupant enters the room or just before they left. | [9,27] |
| Metric | Guidelines | Advantages | Disadvantages |
|---|---|---|---|
| LEED, BREEAM, WELL, EN12464-1, EN17037 | Easy to monitor, measure and model; spatial lighting conditions provided. | Point in time dependent, analysis grid selection ambiguous, no human adaptation, light intensity at eye uncertain. | |
| WELL | Easy to measure and model, light intensity at eye known. | Point in time dependent, analysis grid location ambiguous, no human adaptation, complex to measure with occupancy, no contrast effect considered. | |
| BREEAM, BS8206-2, DGNB, DIN5034-1, EN17037 | Fast and easy assessment; spatial conditions provided. | Unique low light intensity condition evaluation, no directionality assessed. | |
| n/a | Annual and spatial analysis, easy to model. | Dichotomous variable (1 or 0), No high light intensity risk considered, light intensity at eye uncertain, biased by the limits set. | |
| n/a | Annual and spatial analysis, easy to model. Ordinal variable (from 0 to 1). | No high light intensity risk considered, light intensity at eye uncertain, biased by the limits set. | |
| LEED | Annual and spatial unitary index, easy to model. | No high light intensity risk considered, light at eye uncertain, no information on problematic areas, biased by the limits set. | |
| n/a | Annual, grid-based and spatial index, easy to model, hint on under-lit, day-lit and over-lit areas. | Light at eye uncertain, no directionality assessed, biased by the limits set. | |
| n/a | Annual and grid-based unitary index based on , easy to model, information on the amount of time at discomfort and comfort. | Light at eye unknown, spatial distribution not known, human adaptation or variability not assessed, biased by the limits selected. | |
| n/a | Annual and grid-based unitary index based on , easy to model, information on the intensity of discomfort. | Light at eye unknown, spatial distribution not known, human adaptation or variability not assessed, biased by the limits selected. | |
| AS1680, DIN5035, NSVV, CIBSE, EN12464-1, CIE29.2, BS8206-2, WELL | Information on lighting distribution contrast. | Biased by extreme values, no other information on light, has to be coupled with another metric. |
| Metric | Guidelines | Advantages | Disadvantages |
|---|---|---|---|
| EN17037 | Robust and reliable, considers both light intensity and contrast, accounts for directionality, gives rating and sensation information, light at eye known. | Complex and lengthy to model, not reliable under low illuminance conditions and less reliable with large contrast, unique moment in time and position, no human adaptation considered. | |
| EN17037 | Still robust and reliable, accounts for directionality, gives rating and sensation information, easy to model and compute, can be computed annually. | No contrast considered, less reliable under low illuminance conditions, analysis grid selection ambiguous, no human adaptation considered. | |
| CIE177, EN12464-1 | Accounts for light intensity, contrast and directionality, gives rating and sensation information, direct and diffuse light at eye known. | Unique moment in time and position, no human adaptation considered, not reliable when the sun is within the field of view. | |
| LEED | Annual and spatial unitary index, easy to model, hint on high intensity problematic areas. | Light at eye uncertain, no directionality assessed, biased by the limits set. |
| Metric | Advantages | Disadvantages |
|---|---|---|
| d | Accounts for directionality and human adaptation, highly responsive and reliable, light at eye known. | There is no established correlation with the occurrence of glare, no human variability, only one location, hard to measure and model. |
| Accounts for directionality and human adaptation, refers to the saturation level of adaptability. | There is no established correlation with the occurrence of glare nor illuminance, only one location, hard to measure (especially for neutral condition) and model. | |
| Measures pupil kinematics with high precision. | Highly intrusive measurement, no correlation with lighting environment performed, only pupil response recorded. | |
| Accounts for directionality, human adaptation and variability. Highly responsive and reliable. Light at eye known. | There is no established correlation with the occurrence of glare, only referred to one location and occupant, not applicable for young occupants, hard to monitor and model. | |
| Accounts for directionality and human adaptation, refers to saturation level of adaptability (not only pupil), correlation with . | Scaling issues, only actions for eye-lid kinematics considered, no human variability considered, intrusive measurement, one location, hard to model. | |
| Accounts for directionality and human adaptation, indirectly refers to adaptability (not only pupil), correlation with . Light at eye known. | No human variability considered, intrusive measurement, one location, hard to model (requires known gaze behaviour). |
Publisher’s Note: MDPI stays neutral with regard to jurisdictional claims in published maps and institutional affiliations. |
© 2022 by the authors. Licensee MDPI, Basel, Switzerland. This article is an open access article distributed under the terms and conditions of the Creative Commons Attribution (CC BY) license (https://creativecommons.org/licenses/by/4.0/).
Share and Cite
Blanco Cadena, J.D.; Poli, T.; Košir, M.; Lobaccaro, G.; Mainini, A.G.; Speroni, A. Current Trajectories and New Challenges for Visual Comfort Assessment in Building Design and Operation: A Critical Review. Appl. Sci. 2022, 12, 3018. https://doi.org/10.3390/app12063018
Blanco Cadena JD, Poli T, Košir M, Lobaccaro G, Mainini AG, Speroni A. Current Trajectories and New Challenges for Visual Comfort Assessment in Building Design and Operation: A Critical Review. Applied Sciences. 2022; 12(6):3018. https://doi.org/10.3390/app12063018
Chicago/Turabian StyleBlanco Cadena, Juan Diego, Tiziana Poli, Mitja Košir, Gabriele Lobaccaro, Andrea Giovanni Mainini, and Alberto Speroni. 2022. "Current Trajectories and New Challenges for Visual Comfort Assessment in Building Design and Operation: A Critical Review" Applied Sciences 12, no. 6: 3018. https://doi.org/10.3390/app12063018
APA StyleBlanco Cadena, J. D., Poli, T., Košir, M., Lobaccaro, G., Mainini, A. G., & Speroni, A. (2022). Current Trajectories and New Challenges for Visual Comfort Assessment in Building Design and Operation: A Critical Review. Applied Sciences, 12(6), 3018. https://doi.org/10.3390/app12063018