Article

A Multi-Disciplinary Optimization Approach to Eco-Friendly Design Using the Response Surface Method

1
Program in Interdisciplinary Studies, National Sun Yat-sen University, Kaohsiung 80424, Taiwan
2
Outfitting Design Section of Design Department, China Ship Building Corporation, Kaohsiung 81234, Taiwan
3
Department of Mechanical Engineering, National Cheng Kung University, Tainan 70101, Taiwan
*
Author to whom correspondence should be addressed.
Appl. Sci. 2022, 12(6), 3002; https://doi.org/10.3390/app12063002
Submission received: 18 February 2022 / Revised: 10 March 2022 / Accepted: 14 March 2022 / Published: 15 March 2022

Abstract

:
From a life-cycle perspective, the design stage is the key to controlling the environmental impacts of a product because at this stage, all the different parameters can be optimized to realize the required functions while ensuring that the product is environmentally friendly. Here, it is proposed that the optimization of an eco-design should be completed during the concept design stage to strike a balance between the environmental impacts and mechanical property requirements of the product. In this study, experimental data for these two parameters were first obtained via life-cycle assessments and von Mises stress analyses, respectively. Next, the response surface method was adopted to acquire the approximation functions. Finally, a genetic algorithm was employed for multi-objective optimization to realize the eco-design of the product. The proposed methodology was illustrated and evaluated by taking a liquid crystal display monitor design as an example. The results show that material thickness of the mirror is a key parameter that affects both objectives of the product. Although the mechanical properties of ABS are slightly worse than that of PS, it is the best choice for multi-objective optimization while considering the environmental impact at the same time.

1. Introduction

Product innovation improves our living environment and enables high-tech developments. Yet, linear product design has led to critical environmental impacts, which, in turn, have remarkably affected the safety of property and life. This is best reflected by the increasingly frequent and intense extreme weather events. Hence, environmentally friendly eco-designs are becoming increasingly popular. They aim to alleviate environmental impacts and enhance the benefits to the entire ecosystem. Eco-designs consider both product functions and the effects of their life cycles on the environment. In order to minimize the environmental impacts due to processing, Slama et al. [1] combined computer-aided design (CAD) and life-cycle assessment (LCA) to estimate the environmental impacts of a sample part caused by different processing procedures. In this way, the procedures with the least environmental impacts could be selected. Meanwhile, Jiang et al. [2] adopted energy-based life-cycle assessment (Em-LCA) to compare the use of laser additive manufacturing and that of computer numerical control (CNC) machining for processing AISI 4140 spur gears and propose sustainable manufacturing strategies. For product assembly, Suhariyanto et al. [3] used LCA to verify that the introduction of the design for assembly (DFA) method for an electronic safety product could reduce the environmental impacts. Similarly, for product recycling, Aguiar et al. [4] chose a portable cassette and CD player for possessing signs that included information at the product obsolescence stage during design. They utilized EeoLCI assessments to reduce the environmental impacts of the recycling processes. In addition, LCA can be used to compare products in the same category. Hischier [5] and Bhakar et al. [6] performed LCAs to determine the environmental impacts of a field emission display (FED) television.
By integrating LCA and optimization, an optimized design that considers the environmental impacts can be obtained. Ng et al. [7] combined LCA and ant colony optimization to enhance the green decision-making efficiency of an oven during product design. Ferdosian and Camões [8] applied the response surface method (RSM) and Design Expert to develop eco-efficient concrete. Zhanga et al. [9] established a life-cycle simulation (LCS) model for an EV battery pack to give design schemes with the smallest environmental loads. In the meantime, Taha et al. [10] adopted CAD, LCA, and life-cycle inventory (LCI) in three different machine rod backets to identify the processing scheme with the least waste generated. Zhu et al. [11] combined LCA and artificial neural network (ANN) models to predict the green chemicals that could be used as alternatives. Hafeez et al. [12] used RSM and the neural network method to obtain the optimal energy efficiency of shell-and-tube heat exchangers during their production. With the help of the RSM and genetic algorithm (GA), Nam et al. [13] achieved the green goals of nanofluid MQL micro-drilling processing. Khalid [14] utilized the Taguchi method to identify the additive manufacturing process parameters that meet the sustainability requirements. Sivaiah and Chakradhar [15] performed response surface analyses to find the optimal value of surface roughness on 17-4 precipitated hardened stainless steel (PH SS) material to achieve the longest service lives for the processing tools. In another study [16], these two authors employed the Taguchi method to obtain the maximum number of processing times for special stainless steel materials to achieve the longest service lives for the processing tools. From the aforementioned literature, it is clear that optimization can, at the design stage, effectively reduce the consequential environmental impacts.
Although enhancing the eco-efficiency is one of the emphases of eco-design, this target should be aligned with other existing design goals, such as those related to the production cost, mechanical properties, and material selection. Thus, numerous studies on multi-objective optimization (MOO) to balance multiple targets have been carried out. For example, Zhou et al. [17] used an ANN and a GA to optimize the material selection of drink containers and achieved multi-objective decision making in four aspects, including the material selection, mechanical performance, production cost, and environmental impact. For the CNC machining of cam disks, Gonzales [18] integrated an LCA and a GA for optimization to obtain the optimal scheme with the smallest environmental impact, lowest cost, and simplest assembly. Similarly, Zhai et al. [19] adopted EnergyPlus for windows design and carried out MOO for the energy consumption, as well as the thermal energy and visual performance, based on a GA. Finally, the authors compared the optimal solutions with the help of Plato’s method. Wang et al. [20] employed a second-order RSM and GA for the MOO of the baffle configuration of a heat exchanger. Bin et al. [21] took eddy current separators for recycling waste as an example to improve the separation efficiency of the machine through optimization that combined the finite element method, the RSM, a GA, and Plato’s method. In addition, Lim et al. [22] investigated the water reuse systems in factories and proposed optimization strategies that considered the eco-efficiency, production efficiency, and production cost at the same time. Deng et al. [23] focused on diesel engines and acquired an optimal design based on multi-objective methods, LCA, and LCC. Furthermore, Kluczek [24] obtained an energy sustainability index (IESUS) through an all-in-one optimization module and input the data into the DMU system to acquire the optimal decision considering both eco-efficiency and investment. In the meantime, Baptistaa et al. [25] introduced the Lean Design-for-X approach to optimize structures and eco-designs by disassembling a machine tool (press-brake) into modules. Chiang and Che [26] suggested the use of back propagation neural networks (BPNNs), LCAs of components, and a multi-objective genetic algorithm (MOGA) to attain the solution with the shortest design time and lowest carbon emission for an MP3 player. Moreover, Taghdisian et al. [27] performed a multi-objective design based on CO2 efficiency and realized the production of environmentally friendly methanol through an optimization model (GA + Pareto set). Last, but not least, Mele and Campana [28] took different additive manufacturing, i.e., stereolithography (SL), inkjet (IJ), and fused deposition modeling (FDM), and conducted MOO with the help of an LCA parameter model. In this way, the cheapest and most environmentally friendly component assembly method could be found.
From a life-cycle perspective, the design stage is the key to controlling the environmental impacts of a product. At this stage, all the parameters can be optimized to realize the required functions while ensuring that the product is environmentally friendly. This paper proposes an assessment method to achieve an eco-design during the product concept design stage so that both the associated environmental impacts and mechanical properties are considered. In this study, experimental data for these two design goals were obtained via an LCA and a von Mises stress analysis, respectively. After that, the RSM was applied to attain the approximation functions. Finally, a GA was introduced as a multi-disciplinary and MOO approach to realize the eco-design of the product.
This paper is organized as follows. The next section, Material and Methodology, illustrates the LCA, RSM, GA, and MOO methods. The third section explains the experimental setup and analyzes the results. It shows how the proposed multi-disciplinary and MOO method were validated based on the design of an LCD screen frame. The fourth section discusses the experimental results to explore the significance and application of the proposed method in eco-design. In the last section, based on the research results, conclusions are drawn regarding the effectiveness of multi-disciplinary and MOO methods during the product concept design stage to achieve an eco-design.

2. Materials and Methods

This study utilized CAD software to obtain information about the components of LCD frames with the same specifications as shown in Figure 1. This information can be used to obtain the weight of the components by setting the material properties so that the environmental impact value can be obtained through the subsequent life-cycle assessment given in Figure 2. Stress analyses obtained the value of von Mises stress, which is a value used to determine if a material will yield or fracture; this value is used for mechanical characteristics. An introduction of LCA analysis, RSM, GA, and MMO is given as the chapter continues.

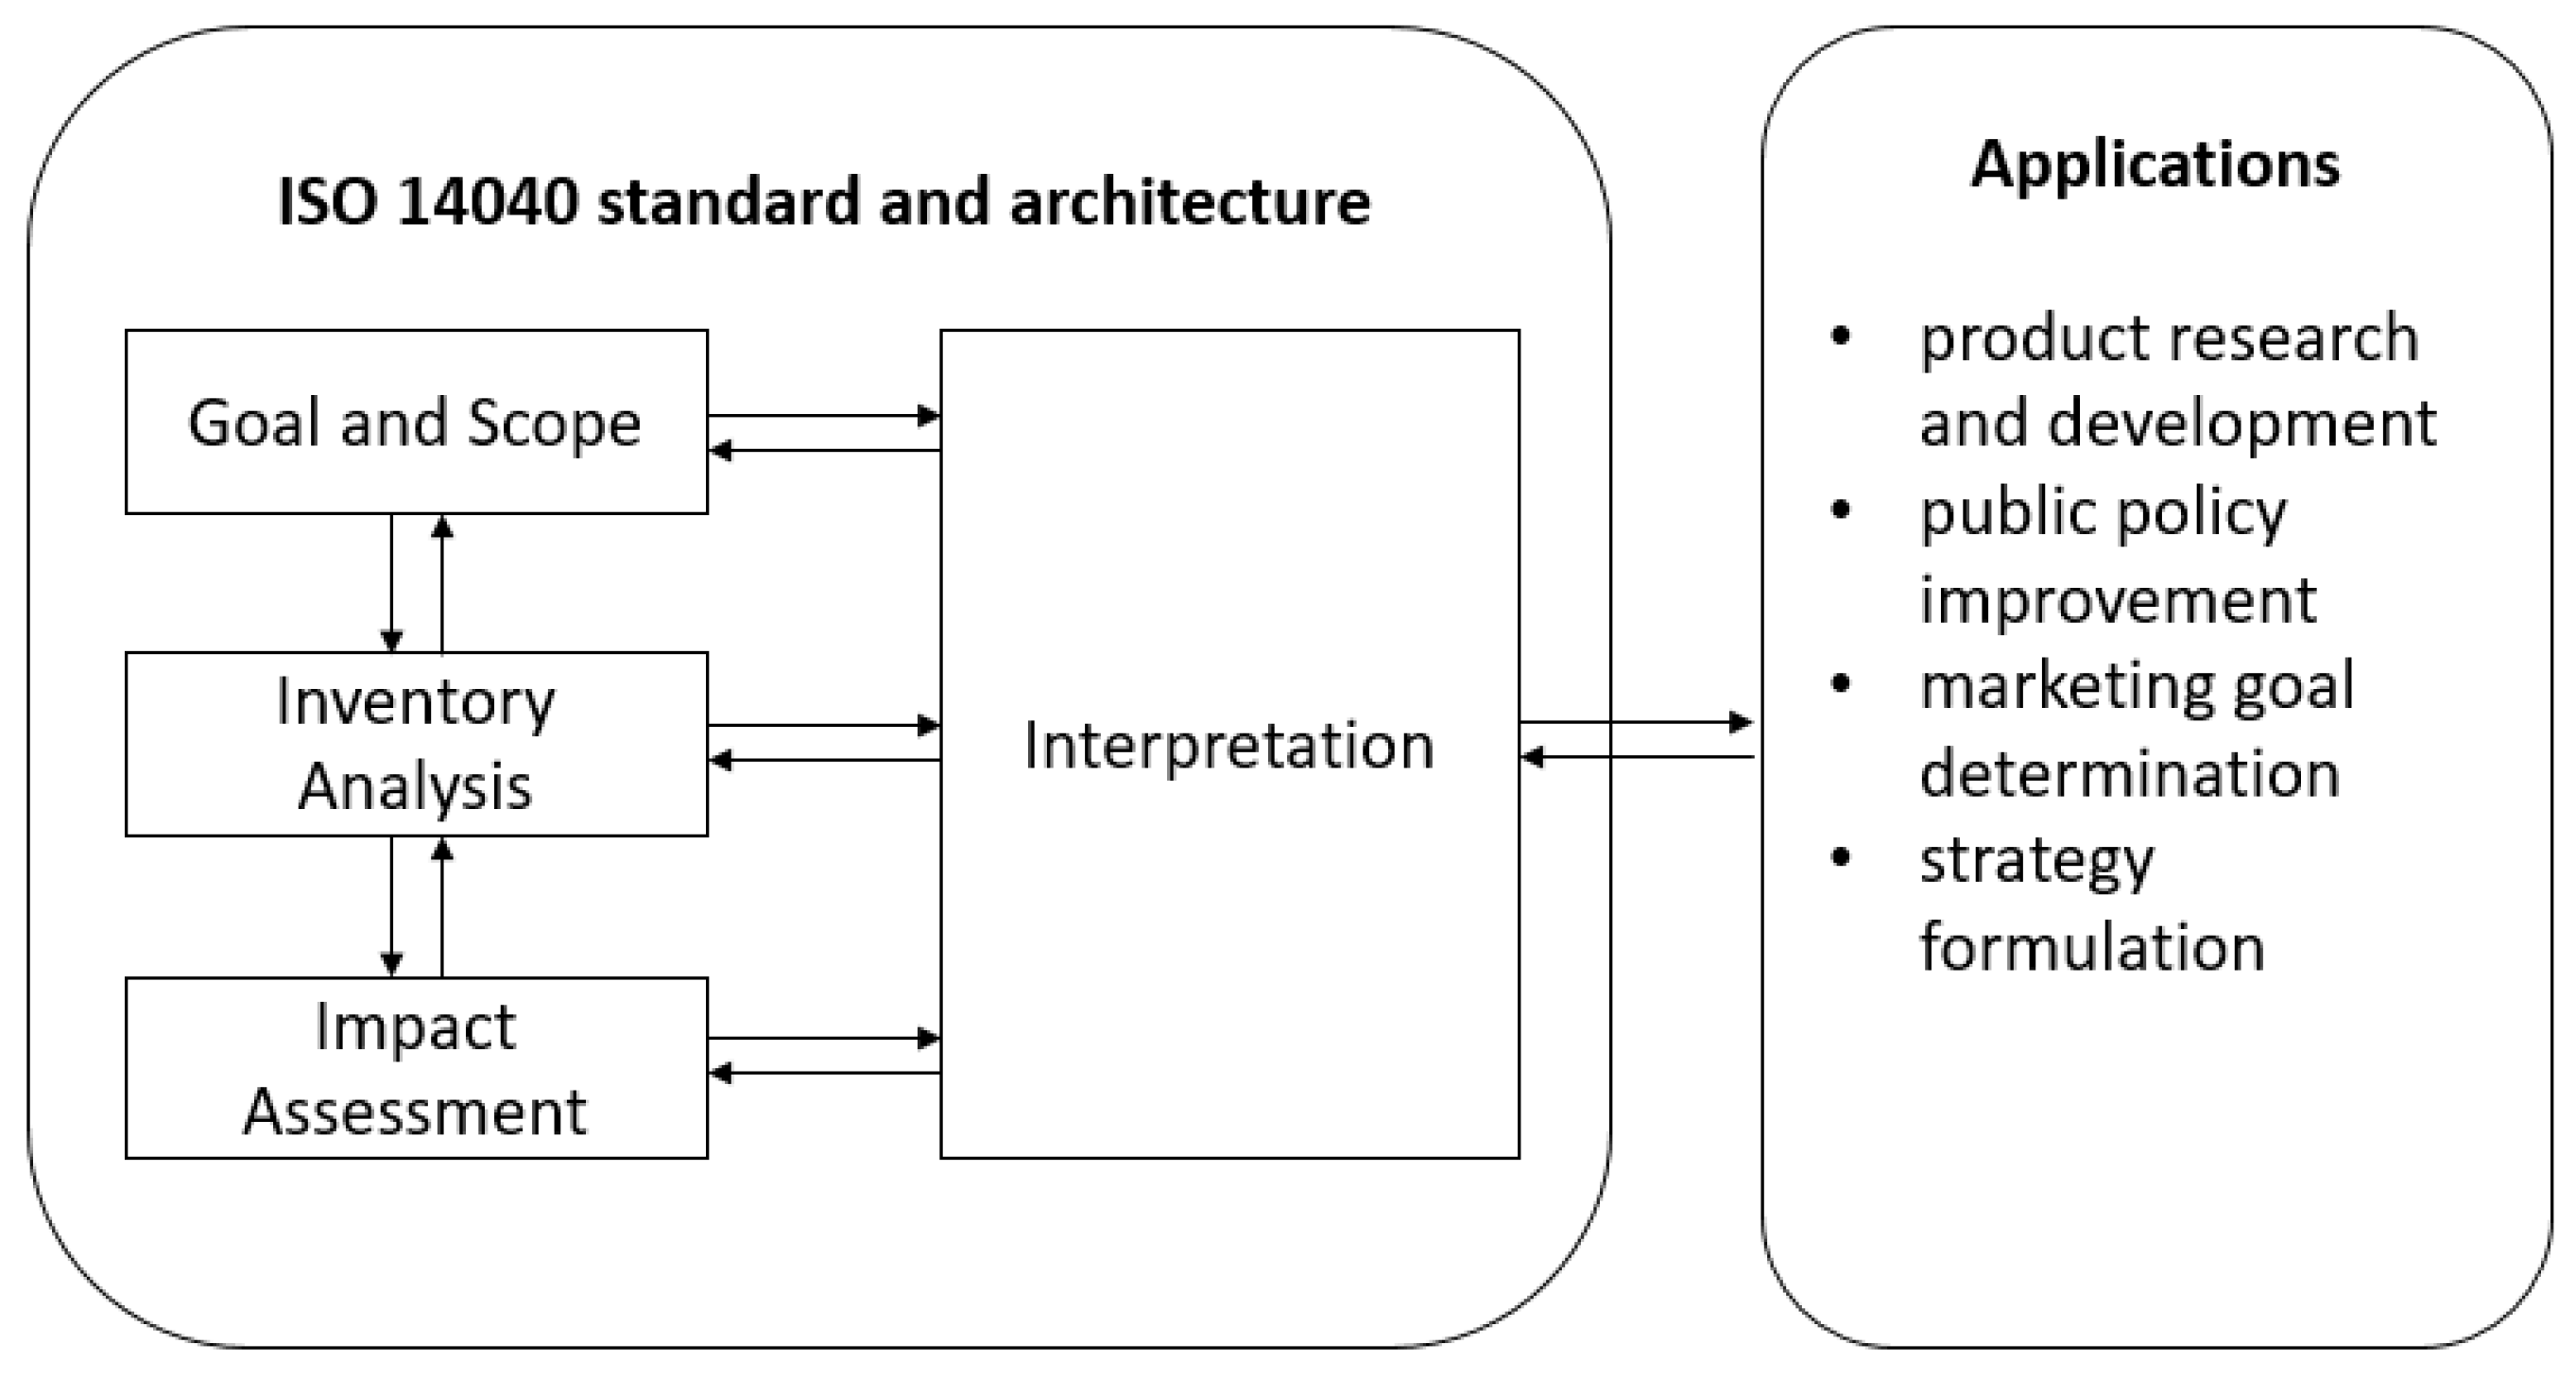
2.1. Life-Cycle Assessment

The complete life cycle of a product includes raw material acquisition, manufacturing and processing, packaging and transportation, consumer use, and, lastly, disposal (Figure 3), whereas LCA consists of four stages, namely the target and scope definition, LCI analysis, impact assessment, and improvement analysis [29]. LCA quantitatively measures the environmental impacts of a product. In the meantime, an environmental impact assessment first classifies different types of pollution into their corresponding impact items and then converts these impact items into values with the same unit through generalization. Finally, appropriate weights are given to the items according to their levels of importance to give an integrated impact index. This index can be used to optimize the product or to formulate better business strategies. In general, compared to single-item indices, an integrated impact index can better reflect the environmental impacts of a product in different aspects. For example, this research adopted Eco-Indicator 99(E) [30]. It calculates the pollution emissions generated in the processes of raw material extraction and resource use. It covers a total of 11 items, and is represented by the environmental impact index score, Point (PT).

2.2. Response Surface Method

The RSM statistically determines the relationships of multiple independent variables in an unknown function jointly to a response variable through experiments and regression analyses. First, the product quality is taken as the dependent variable. Next, the quality factors influencing the product quality, i.e., the independent variables, are identified experimentally. Obviously, reasonable experimental design is the key to the RSM. An effective experimental methodology has to be established with the least required number of experiments, while appropriate analytical techniques should be applied to the desired system knowledge. The experimental data should enable the construction of a regression model that correctly expresses the relationships between the quality factors and the product quality, and can subsequently be adopted for parameter optimization. According to the regression coefficients, regression models can be divided into three types: first-order models, interactive first-order models, and second-order models. Generally speaking, relatively complex regression models have more adjustable regression coefficients, so their error rates are lower. In this study, all three types of regression models were obtained, and the one with the smallest error rate was employed for design optimization.

2.3. Genetic Algorithm

A GA is an adaptive global optimization probability search algorithm that simulates the genetic and evolutionary processes of organisms in nature [31]. According to Darwin, the survival rate of an organism is proportional to the fitness of the individual, and this determines the chance of each individual in the current population to successfully pass on its genes to the next generation. This method first performs selection based on the fitness of each individual and then randomly pairs two individuals in the population. Next, the chromosomes of the chosen pair are partially swapped at a certain crossover rate. Finally, the genes at some locus or loci are modified at a certain mutation rate. The execution of the GA is rather direct, and it requires only repetitive iterations. However, four parameter conditions and values, namely the population size, upper limit of evolutionary iterations, crossover rate, and mutation rate, have to be defined in advance.

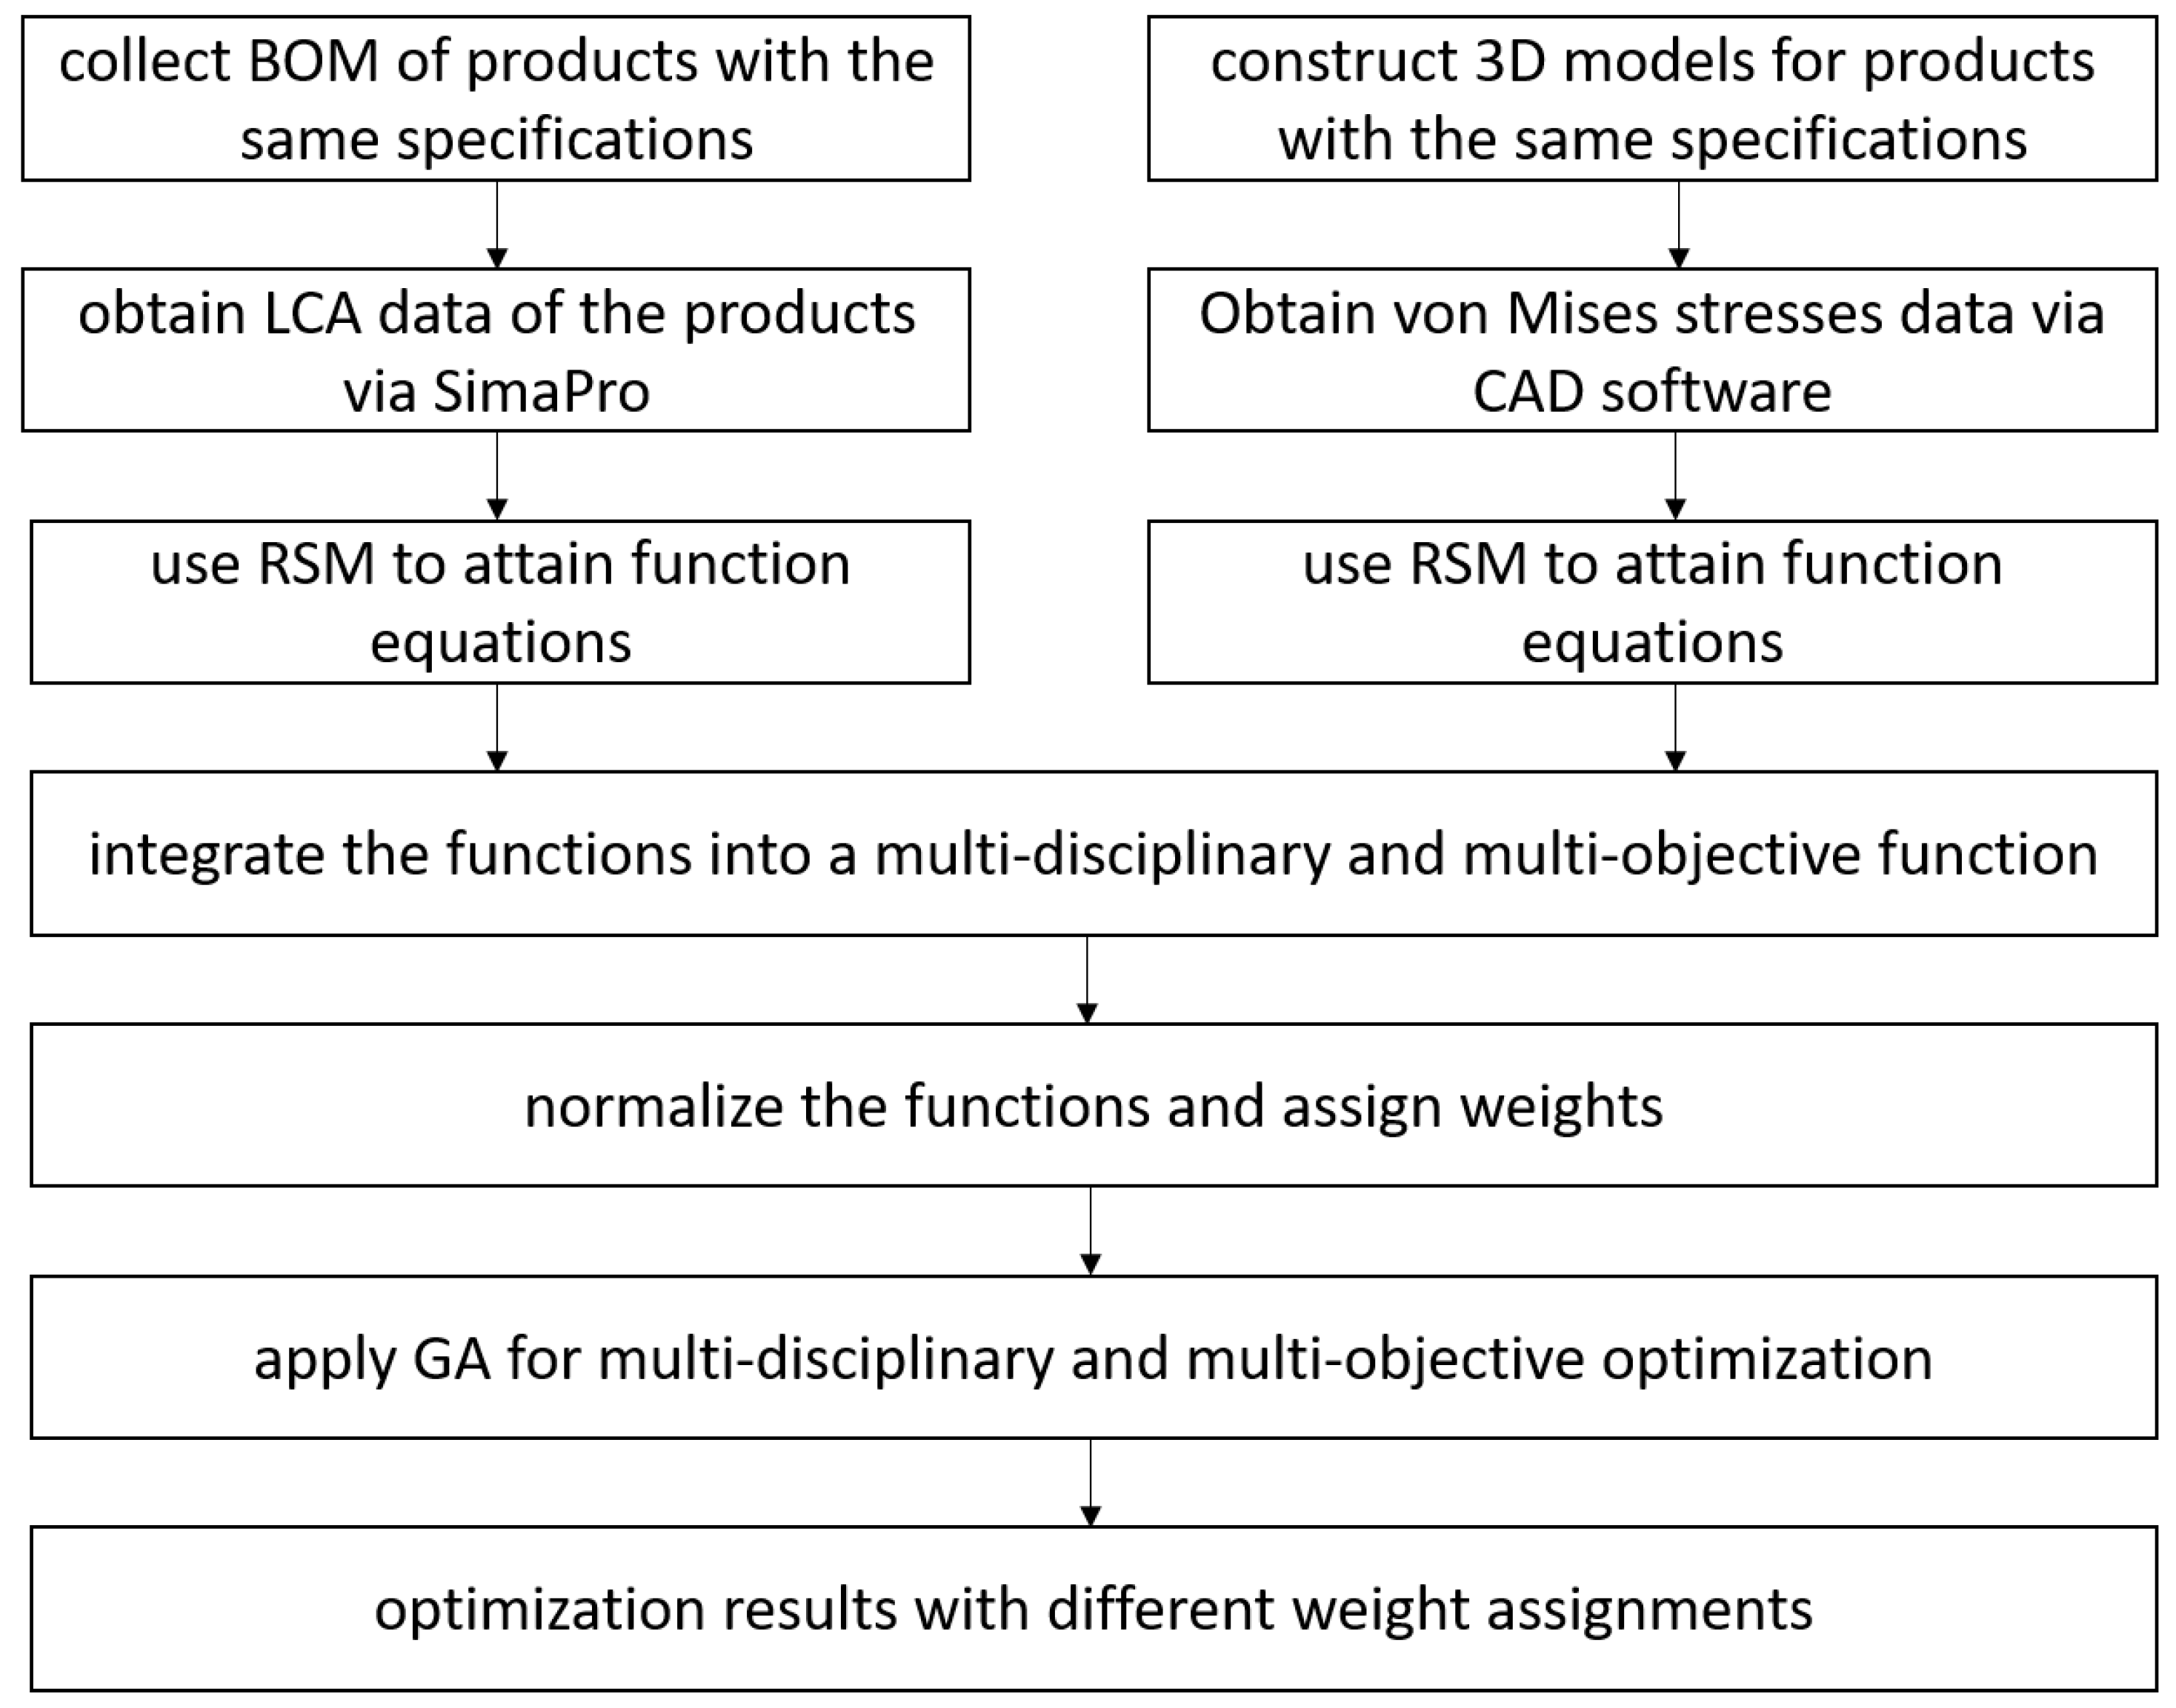
2.4. Multi-Disciplinary Optimization Method

In this research, the estimated environmental impacts and mechanical strength of the product of interest were used to construct the required response surface models. Multi-disciplinary and MOO were performed after combining these models. The calculation results would allow designers to collect design information about the product’s environmental impacts and mechanical strength simultaneously. The optimization flowchart is shown in Figure 4, and the procedures are explained as follows:
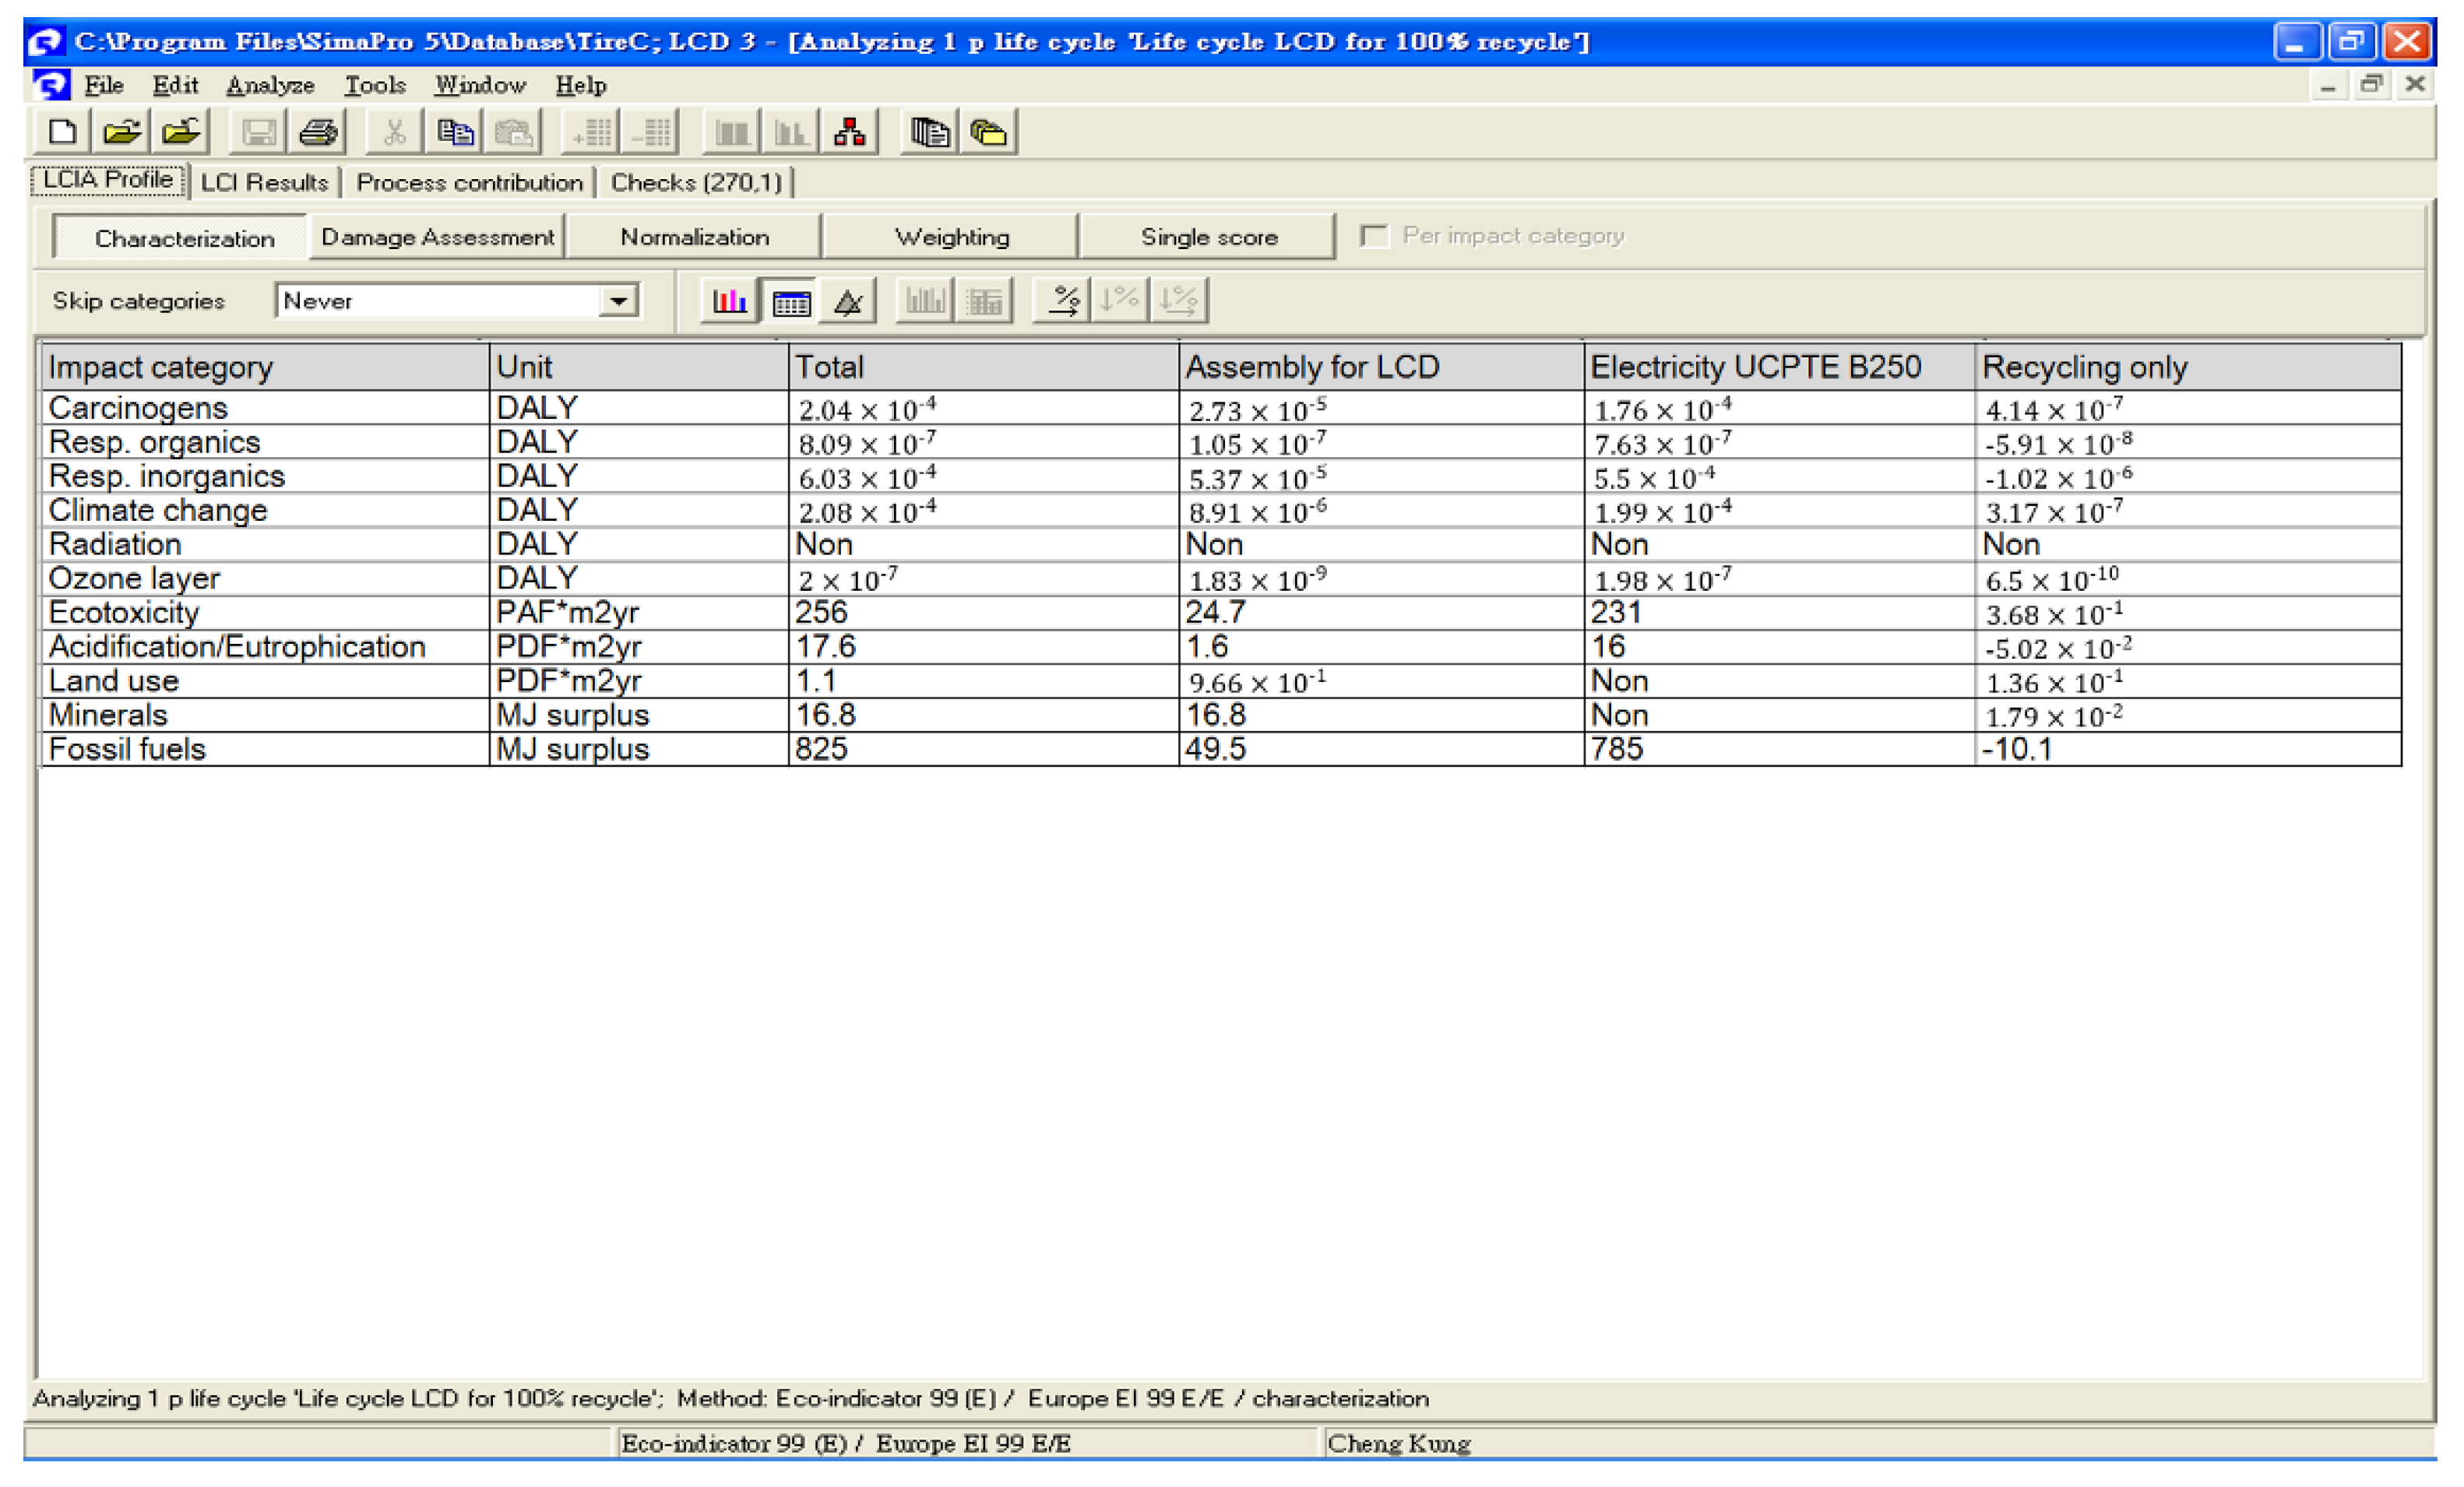
  • For the environmental impacts, assessment data for products with the same specifications are obtained through the bill of material (BOM) and then LCA software is used for the environmental impact evaluation;
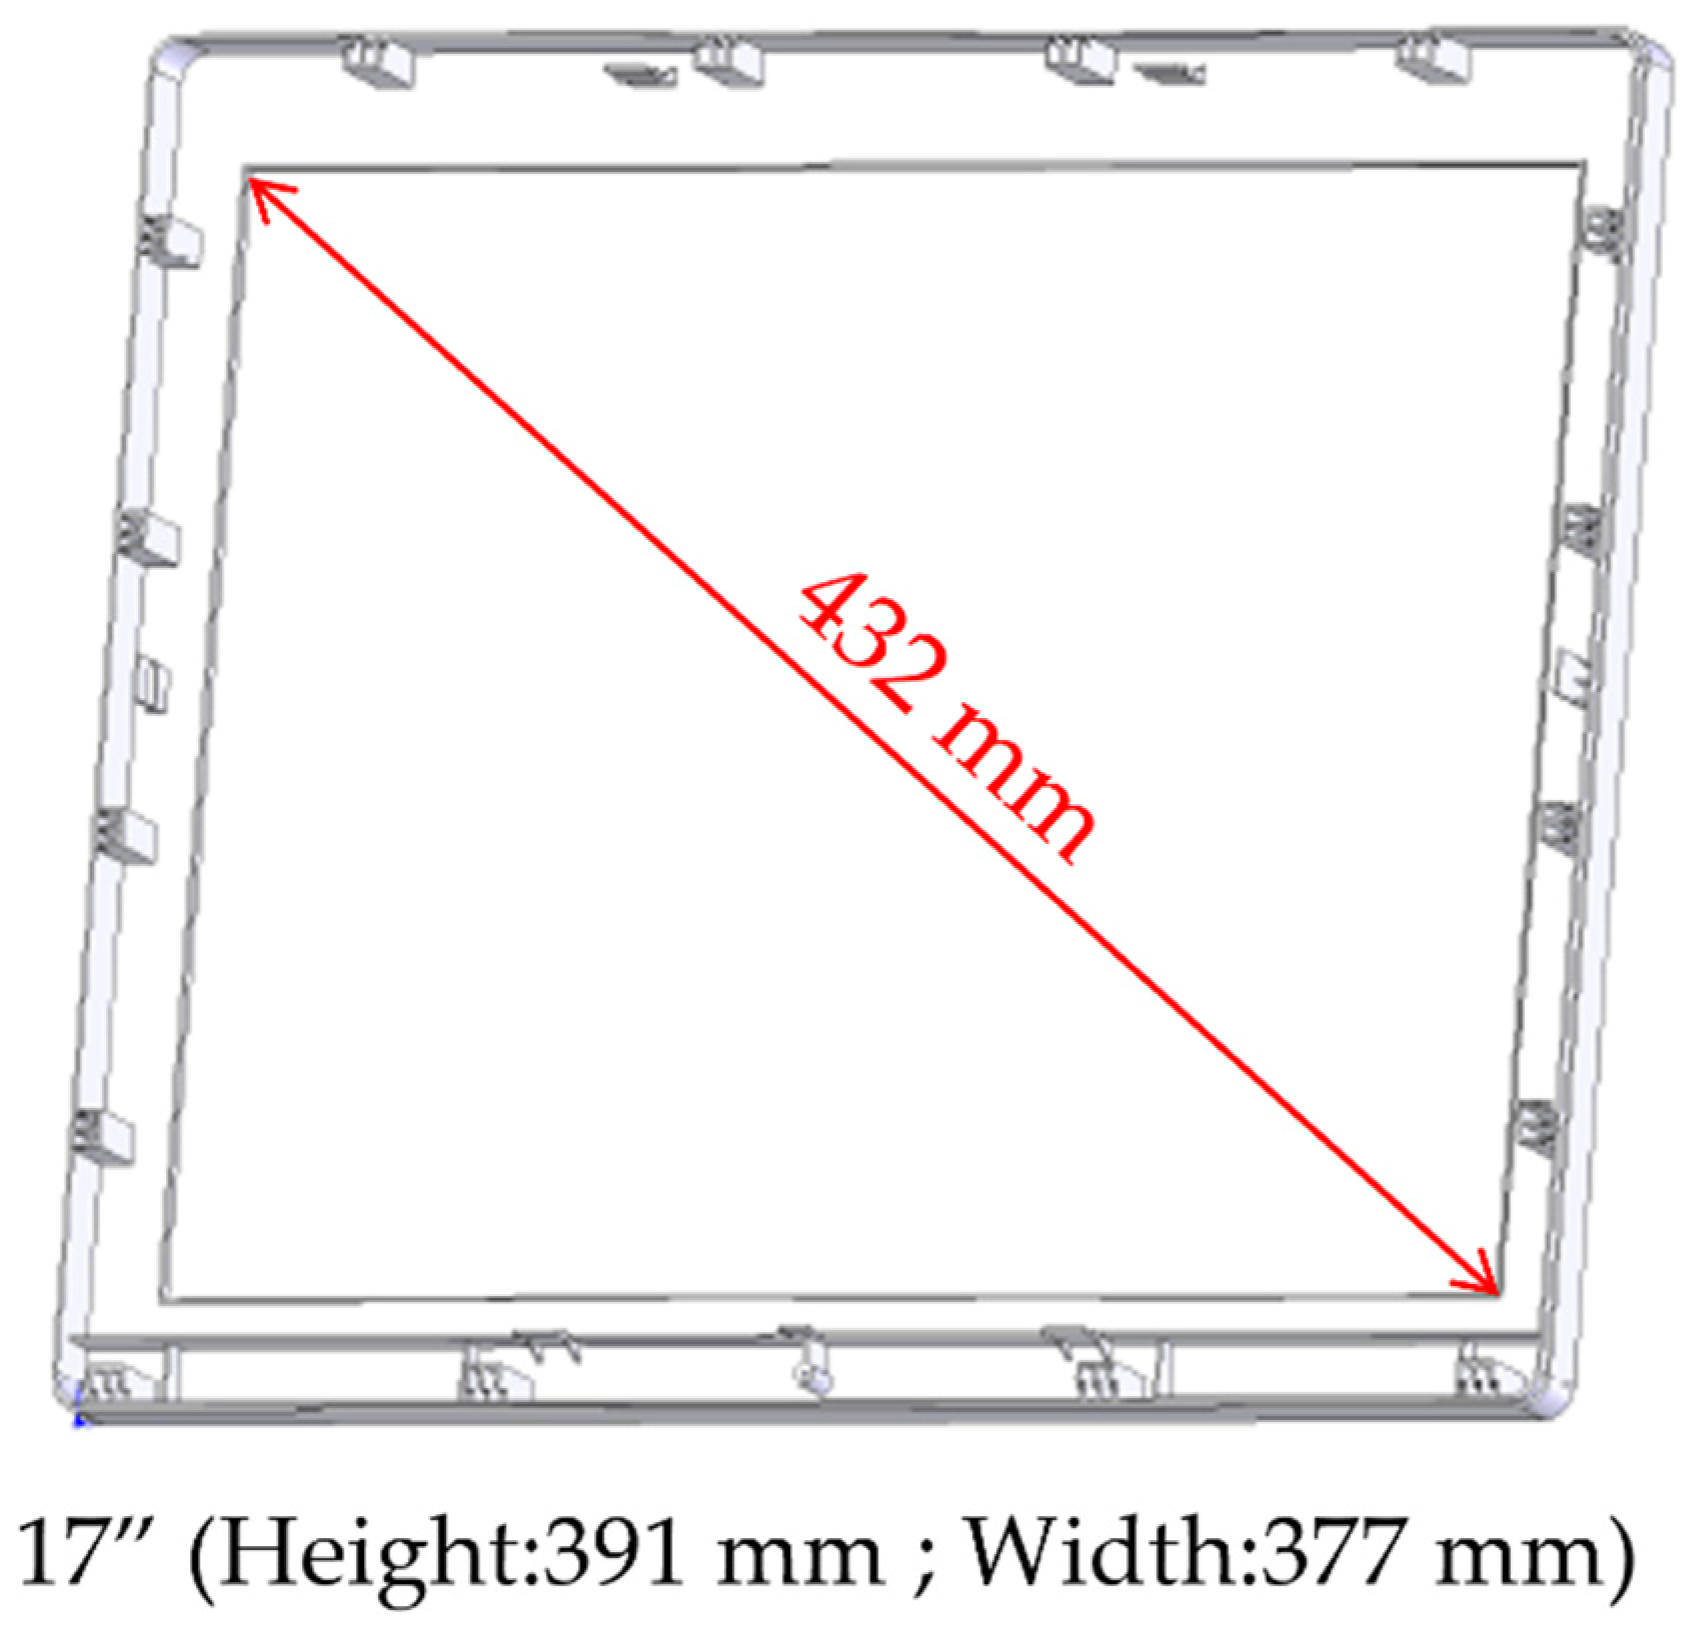
  • To determine the mechanical strength, the mechanical properties are analyzed using CAD software. The corresponding von Mises stress data from step 1 are adopted as the references for the mechanical strength calculation;
  • With the help of the RSM, the data acquired in steps 1 and 2 are used to construct two models, namely the environmental impact function ( V 1 ( x ) ) and mechanical strength function ( V 2 ( x ) ). As previously mentioned, regression models can be classified into three types. Therefore, it is necessary to derive and compare models of all three types to select the one with the lowest error rate for the subsequent multi-disciplinary and MOO;
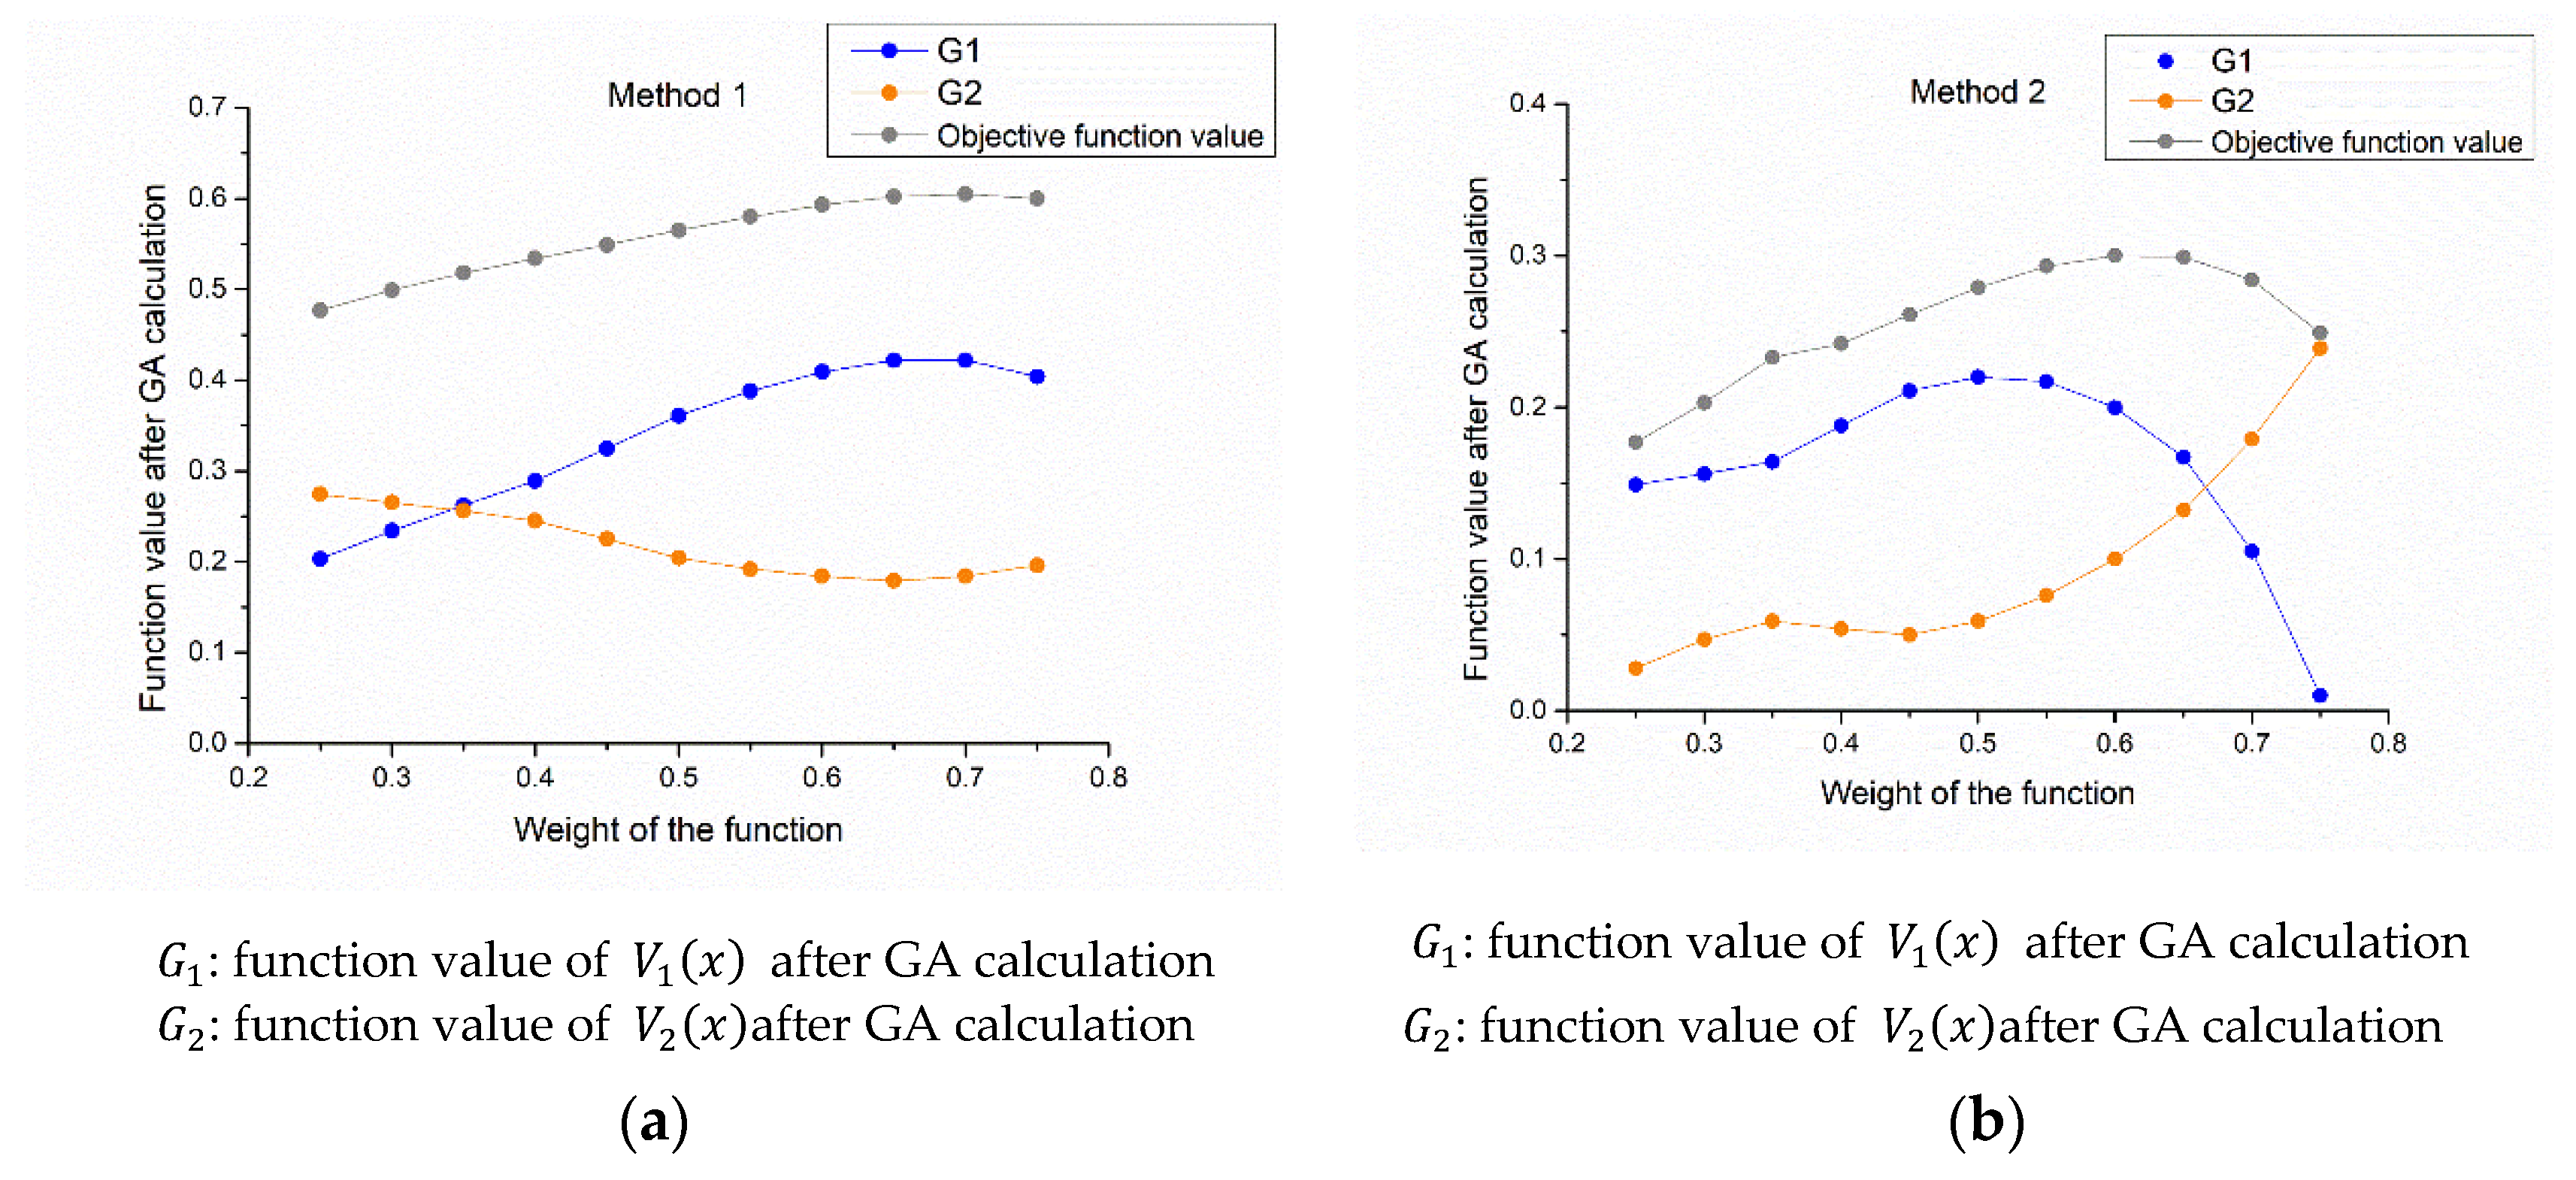
  • First, V 1 ( x ) and V 2 ( x ) are combined into a multi-objective function, V ( x ) . Next, the GA is applied for numerical optimization. Yet, because the two functions are different in nature and show opposite trends, normalization is needed before the optimization, as illustrated in Equations (1) and (2). The first equation divides each objective function by its maximum value. In the meantime, Equation (2) first computes the absolute value of the difference between each function and its minimum value and then divides the absolute value by the difference between the maximum and the minimum. After normalization, V 1 ( x ) and V 2 ( x ) are assigned different weights for optimization. The objective functions are given as Equations (3) and (4), which are weighted equations of Equations (1) and (2), respectively.
V i ( X ) V i ( m a x ) ,   i = 1 , 2
V i ( X ) V i ( m i n ) V i ( m a x ) V i ( m i n ) ,   i = 1 , 2
V ( X ) = w 1 · V 1 ( X ) V 1 ( m a x ) + w 2 · V 2 ( X ) V 2 ( m a x ) ,   w 1 + w 2 = 1
V ( X ) = w 1 · | V 1 ( X ) V 1 ( m i n ) | | V 1 ( m a x ) V 1 ( m i n ) | + w 2 · | V 2 ( X ) V 2 ( m i n ) | | V 2 ( m a x ) V 2 ( m i n ) | ,   w 1 + w 2 = 1

3. Results

The independent variables in the design included the display surface thickness, outer layer thickness, and frame material. Both the display surface and outer layer were 0.2–0.4 mm thick, where the thickness of each was changed in 0.05 mm steps. The frames were made of acrylonitrile butadiene styrene (ABS) and polystyrene (PS). ABS provides favorable mechanical properties such as impact resistance, toughness, and rigidity. PS is clear, hard, brittle, and inexpensive. In total, there were 50 different combinations of these three design variables. The environmental impacts of these 50 combinations could be obtained using the LCA software, and they were assessed using Eco-Indicator 99€. More specifically, the use of fossil fuels was used as an evaluation indicator because fossil fuels produce the most significant pollution. The detailed data are listed in Supplementary Table S1. The RSM parameters were defined as listed in Table 1. The display surface thickness, outer layer thickness, and frame material were defined as the independent variables, whereas the environmental impacts were considered to be the dependent variables.
In order to reduce the error rates of the regression models, the three types of models were obtained and compared to select the one with the smallest error rates for multi-disciplinary and MOO. First, the 50 sets of data in Supplementary Table S1 were divided into validation and training sets. The former consisted of the 7th, 14th, 21st, 28th, 32nd, 39th, and 46th sets, while the remaining 43 sets were taken as the training sets. All the data of the training sets were used for the calculations to attain the required regression coefficients (Supplementary Tables S2–S4) and the regression equations shown as Equations (5)–(7). The error rates of the training and validation sets were compared, as illustrated in Supplementary Tables S5–S7.
V 1 ( X ) = 0.155 + 2.981 X 1 + 1.665 X 2 + 0.236 X 3
V 1 ( X ) = 0.188 + 2.25 X 1 + 1.217 X 2 + 0.01396 X 3 + 0.113 X 1 X 2 + 0.464 X 1 X 3 + 0.276 X 2 X 3
V 1 ( X ) = 0.193 + 2.293 X 1 + 1.205 X 2 + 0.122 X 1 X 2 + 0.464 X 1 X 3 + 0.276 X 2 X 3 0.07762 X 1 X 1 + 0.0164 X 2 X 2 + 0.004652 X 3 X 3
Similar to the environmental impact evaluation, the mechanical strength assessment took the material, display surface thickness, and outer layer thickness as the adjustable independent parameters. In the meantime, the locations and numbers of the internal locking holes of the frames were kept constant. It was assumed that a user would apply a force of 4 N under normal operation conditions. The 50 sets of von Mises stress data for the components are listed in Supplementary Table S8. The RSM parameters were defined as listed in Table 2. The display surface thickness, outer layer thickness, and frame material were the independent variables, whereas the mechanical strength was the dependent variable.
Next, similar to the procedures in the environmental impact evaluation, three types of regression models were computed, and the one with the smallest error rate was chosen for the multi-disciplinary and MOO. The training and validation sets were defined in the same way as those adopted for the environmental impact evaluation. The calculated regression coefficients are given in Supplementary Tables S9–S11, and the regression equations are listed as Equations (8)–(10). The error rates of the training and validation sets are compared in Supplementary Tables S12–S14. According to the errors of the six equations, for both the environmental impacts and mechanical strength, the first-order models generated the greatest errors, so they were discarded. In contrast, the interactive first-order model for the environmental impacts outperformed its second-order counterpart, while the performance of the interactive first-order model for the mechanical strength fell considerably behind that of the second-order model. Therefore, the second-order models, i.e., Equations (7) and (10), were chosen.
V 2 ( X ) = 683,365.192 199,420.3 X 1 196,287.756 X 2 133.136 X 3
V 2 ( X ) = 81,415.101 1,648,210.1 X 1 618,513.711 X 2 554.836 X 3 + 1,444,079.254 X 1 X 2 5.31 X 1 X 3 + 1389.877 X 2 X 3
V 2 ( X ) = 1,095,087.928 3,586,671.207 X 1 685,783.288 X 2 + 915,672.330 X 1 X 2 5.310 X 1 X 3 + 1389.877 X 2 X 3 + 3,542,698.597 X 1 X 1 + 330,058.479 X 2 X 2 184.945 X 3 X 3
Since V 1 ( x ) and V 2 ( x ) in the multi-objective function are parameters from two completely different fields, normalization is necessary before the function can be treated as a single-objective function for optimization. In this study, two normalization methods were applied, and V 1 ( x ) and V 2 ( x ) were assigned different weights, w, for optimization. The first normalization (Method 1) divided the objective function by its maximum value (Equation (11)), whereas the second method (Method 2) first computed the difference between the function and its minimum value and then divided the absolute difference by the difference between the maximum and the minimum (Equation (12)). The weighted normalized objective functions are given as Equations (13) and (14).
( V i ( X ) V i ( m a x ) ,     i = 1 ,   2 ,     V 1 ( m a x ) = 2.21 ,     V 2 ( m a x ) = 432,188 )
( V i ( X ) V i ( m i n ) V i ( m a x ) V i ( m i n ) ,     i = 1 ,   2 , V 1 ( m a x ) = 2.21 ,     V 1 ( m i n ) = 1.05 ,     V 2 ( m a x ) = 432,188 ,     V 2 ( m i n ) = 151,248 )
V ( X ) = w 1 × V 1 ( X ) V 1 ( m a x ) + w 2 × V 2 ( X ) V 2 ( m a x ) ,     w 1 + w 2 = 1
V ( X ) = w 1 × | V 1 ( X ) V 1 ( m i n ) | | V 1 ( m a x ) V 1 ( m i n ) | + w 2 × | V 2 ( X ) V 2 ( m i n ) | | V 2 ( m a x ) V 2 ( m i n ) | ,     w 1 + w 2 = 1
The multi-objective function equation is denoted as V ( X ) . For the GA, the length of the gene code of a single individual was set as 12, and the total number of populations equaled 20. X 1 to X 3 were defined as the gene codes of individuals in the GA. The ultimate goal was to obtain the minimum value of V ( X ) . Thus, the fitness function was defined as 1.0/ V ( X ) , given that 1.0/ V ( X ) > 0. The ranges of X 1 to X 3 are listed in Table 3. The crossover rate, P c , was set as 0.8, while the mutation rate, P m , was 1/12. The calculation ended when the number of evolutionary iterations reached 1000.
The weights for the environmental impacts and mechanical strength were in the range of 0.25–0.75, and they were varied in 0.05 steps to identify the optimal values. The results demonstrated that the objective functions obtained by Methods 1 and 2 gave very similar trends, and their peak values were located at similar values of X 1 , X 2 , and X 3 (Figure 5a,b). The peak values found by Method 1 were at approximately X 1 = 0.303,   X 2 = 0.200, and X 3 = 1, while those found by Method 2 were at approximately X 1 = 0.342,   X 2 = 0.200, and X 3 = 1. For both methods, X 3 = 1, indicating that the material used should be ABS. Although the performance of ABS was slightly inferior to that of PS, the difference was not very remarkable. Nevertheless, the environmental impacts of ABS were much smaller than those of PS. Thus, the numerical simulation results were still acceptable. Last, a comparison of X 1 and X 2 revealed that X 1 could more effectively influence the environment impacts and mechanical strength. It should be considered to be a relatively important parameter when designing the frame dimension. In contrast, the function values started to change only when the weight of X 2 exceeded 0.6. Thus, it had less importance. The optimization results are illustrated in Figure 6a,b, and the detailed data are listed in Table 4.

4. Discussion

According to LCA, the geometric design of various components can significantly influence the optimization of each of the following product properties: the environmental impacts, production cost, safety, and mechanical properties. In addition, it is very important in the simultaneous optimization of multiple product properties. The results of this study suggest that the optimization of multiple product properties is more complicated than that of individual product properties, especially when the goals are contradictory. For the geometric design of LCD display frames, although a lightweight design requires fewer raw materials and a lower production cost, along with bringing about smaller environmental impacts, there will be safety concerns. This agrees well with the literature [21]. To strike a balance between different product properties, a Pareto set can be adopted to obtain the optimal solutions for different design parameters and their corresponding weights. Undoubtedly, another direct way is to select other materials to resolve the safety issues. However, materials with better mechanical performances may lead to more adverse environmental impacts. This was revealed by the study by Zhou et al. [17] on common beverage packaging materials. Hence, a multi-disciplinary and multi-objective design optimization exploring the effects of the geometry and materials of different components on the environmental impacts and safety of a product must seek the solution that gives the maximum overall benefit. In this research, a Pareto set was used to optimize LCD display frames. It was discovered that a compromise had to be made in the material selection. Although PC is mechanically stronger than ABS, the overall performance of the frame was better when ABS was used. Similar findings have also been noted in the literature [26]. Moreover, the RSM could be applied at the design stage to determine the key factors affecting the environmental impacts and mechanical strength of an LCD display frame. This method also reflects the relationship between these key factors and the product quality. This enables engineers to quickly obtain the corresponding environmental impacts and von Mises stresses after modifying the geometric dimensions. Bin et al. [21] adopted this approach to realize the eco-design of Halbach magnetic rollers. Finally, according to the literature [18,19], a GA is suitable for handling design problems where continuous and discontinuous variables co-exist. After a reasonable number of iterations, multi-disciplinary and MOO results can be obtained. This was also true for the LCD display frame design investigated. The design parameters included continuous (geometric dimensions) and discontinuous (materials) variables. After 1000 iterations, the MOO results improved the environmental impacts and mechanical strength.

5. Conclusions

This research proposed that objectives in two completely different fields, i.e., the environmental impacts and mechanical strength, could be combined and considered simultaneously to optimize product design as early as the product concept design stage. This idea was validated using a case study, and the following conclusions were drawn: (1) the environmental impacts and von Mises stresses estimated by considering different product components were converted into functions. Next, their response surface models were constructed. In the future, when engineers are designing products with the same specifications, relevant parameters can be input to the response surface functions to quickly obtain the corresponding environmental impacts and von Mises stresses. These values can be utilized as references for the design; (2) the response surface error rates of the second-order models were between 1% and 4%, confirming the applicability of the proposed methodology; (3) for function optimization, because there were continuous and discontinuous design variables, a GA was selected; and (4) in multi-objective function optimization, the weight selection depends on the specific needs of the designers. In this study, different conditions where the weights varied from 0.25 to 0.75 were considered, and the corresponding results were provided. It was found that the mirror thickness was a relatively essential parameter influencing the von Mises stress of the frame. As a result, if the target is to reduce the environmental impacts of product components, objective functions with greater weights for environmental impacts should be selected, and the corresponding results should be adopted. Otherwise, objective functions with higher weights for the von Mises stress should be adopted for the design.
In future research, the mechanical properties of the product components can be evaluated based on the tenon position, beam position and thickness, and screw position and quantity. In the meantime, the environmental impact assessment can cover the effects of geometric and structural changes on the assembly and disassembly procedures. Finally, optimization methods can be compared for their effectiveness, and the advantages of each method can be summarized.

Supplementary Materials

The following supporting information can be downloaded at: https://www.mdpi.com/article/10.3390/app12063002/s1, Table S1: The environmental impact of the 50 combinations in fossil fuels; Table S2: Regression coefficients of first-order model of the environmental impact in fossil fuels; Table S3: Regression coefficients of first-order model with interaction for the environmental impact in fossil fuels; Table S4: Regression coefficients of second-order model for the environmental impact in fossil fuels; Table S5: The error rate of the training and validation set for the first-order model; Table S6: The error rate of the training and validation set for the first-order model with interaction; Table S7: The error rate of the training and validation set for the second-order model; Table S8: The von Mises stress of the 50 combinations; Table S9: Regression coefficients of the first-order model for the von Mises stress; Table S10: Regression coefficients of the first-order model with interaction for the von Mises stress; Table S11: Regression coefficients of the second-order model for the von Mises stress; Table S12: The error rate of the training and validation set for the first-order model; Table S13: The error rate of the training and validation set for the first-order model with interaction; Table S14: The error rate of the training and validation set for the second-order model.

Author Contributions

Conceptualization, C.-J.Y. and J.L.C.; methodology, J.L.C.; software, C.-J.Y.; validation, C.-J.Y., M.J.L. and J.L.C.; formal analysis, C.-J.Y.; investigation, M.J.L.; resources, J.L.C.; data curation, C.-J.Y.; writing—original draft preparation, C.-J.Y. and M.J.L.; writing—review and editing, C.-J.Y.; visualization, M.J.L.; supervision, J.L.C.; project administration, J.L.C.; funding acquisition, J.L.C. All authors have read and agreed to the published version of the manuscript.

Funding

The authors would like to thank the Ministry of Science and Technology, R.O.C., for financial support (MOST 108-2622-E-110-016-CC3 and MOST 110-2622-E-027-029).

Institutional Review Board Statement

Not applicable.

Informed Consent Statement

Not applicable.

Data Availability Statement

Not applicable.

Conflicts of Interest

The authors declare no conflict of interest.

Abbreviations

CADComputer-Aided Design
LCALife-Cycle Assessment
Em-LCAEnergy-based Life-Cycle Assessment
CNCComputer Numerical Control
DFADesign For Assembly
EoLClEnd-of-Life Contamination Index
LCILife-Cycle Inventory
GAGenetic Algorithm
MOOMulti-Objective Optimization
RSMResponse Surface Method
MOGAMulti-Objective Genetic Algorithm
BPNNsBack Propagation Neural networks
PTPoint
BOMBill Of Material
ABSAcrylonitrile Butadiene Styrene
PSPolystyrene
LCDLiquid-Crystal Display

References

  1. Slama, H.B.; Gaha, R.; Benamara, A. Proposal of new eco-manufacturing feature interaction-based methodology in CAD phase. Int. J. Adv. Manuf. Technol. 2020, 106, 1057–1068. [Google Scholar] [CrossRef]
  2. Jiang, Q.; Liu, Z.C.; Li, T.; Cong, W.; Zhang, H.C. Emergy-based life-cycle assessment (Em-LCA) for sustainability assessment: A case study of laser additive manufacturing versus CNC machining. Int. J. Adv. Manuf. Technol. 2019, 102, 4109–4120. [Google Scholar] [CrossRef]
  3. Suhariyanto, T.T.; Wahab, D.A.; Rahman, M.N.A. Product Design Evaluation Using Life Cycle Assessment and Design for Assembly: A Case Study of a Water Leakage Alarm. Sustainability 2018, 10, 2821. [Google Scholar] [CrossRef] [Green Version]
  4. Aguiar, J.D.; Oliveira, L.D.; Silva, J.O.D.; Bond, D.; Scalice, R.K.; Becker, D. A design tool to diagnose product recyclability during product design phase. J. Clean. Prod. 2017, 141, 219–229. [Google Scholar] [CrossRef]
  5. Hischier, R. Life cycle assessment study of a field emission display television device. Int. J. Life Cycle Assess. 2015, 20, 61–73. [Google Scholar] [CrossRef]
  6. Bhakar, V.; Agur, A.; Digalwar, A.K.; Sangwan, K.S. Life Cycle Assessment of CRT, LCD and LED Monitors. Procedia CIRP 2015, 29, 432–437. [Google Scholar] [CrossRef]
  7. Ng, C.Y.; Lam, S.S.; Choi, S.P.M.; Law, K. Optimizing green design using ant colony-based approach. Int. J. Life Cycle Assess. 2020, 25, 600–610. [Google Scholar] [CrossRef]
  8. Ferdosian, I.; Camões, A. Eco-efficient ultra-high performance concrete development by means of response surface methodology. Cem. Concr. Compos. 2017, 84, 146–156. [Google Scholar] [CrossRef]
  9. Zhang, C.; Liu, Y.; Qian, Y.H. An optimization framework of electric vehicle (EV) batteries for product eco-design. Procedia CIRP 2020, 90, 366–371. [Google Scholar] [CrossRef]
  10. Taha, Z.; Gonzales, J.; Novita, S.; Ariffin, R.; Ghazila, R.; Rashid, S.A. Optimization of Product Design to Reduce Environmental Impact of Machining. Ind. Eng. Manag. Syst. 2011, 10, 128–133. [Google Scholar] [CrossRef] [Green Version]
  11. Zhu, X.; Ho, C.H.; Wang, X. Application of Life Cycle Assessment and Machine Learning for High-Throughput Screening of Green Chemical Substitutes. ACS Sustain. Chem. Eng. 2020, 8, 11141–11151. [Google Scholar] [CrossRef]
  12. Hafeez, A.; Taqvi, S.A.A.; Fazal, T.; Javed, F.; Khan, Z.; Amjad, U.S.; Bokhari, A.; Shehzad, N.; Rashid, N.; Rehman, S.; et al. Optimization on cleaner intensification of ozone production using Artificial Neural Network and Response Surface Methodology: Parametric and comparative study. J. Clean. Prod. 2020, 252, 119833. [Google Scholar] [CrossRef]
  13. Li, C.J.; Fang, Y.C.; Cheng, M.C. Study of optimization of an LCD light guide plate with neural network and genetic algorithm. Opt. Express 2009, 17, 1017–10188. [Google Scholar] [CrossRef]
  14. Khalid, M. Investigation of Additive Manufacturing Process Parameters for Sustainability to Optimize Energy and Material Consumption. Master’s Thesis, University of Manitoba, Winnipeg, MB, Canada, 2020. [Google Scholar]
  15. Sivaiah, P.; Chakradhar, D. Analysis and Modeling of Cryogenic Turning Operation Using Response Surface Methodology. Silicon 2018, 10, 2751–2768. [Google Scholar] [CrossRef]
  16. Sivaiah, P.; Chakradhar, D. Modeling and optimization of sustainable manufacturing process in machining of 17-4 PH stainless steel. Measurement 2019, 134, 142–152. [Google Scholar] [CrossRef]
  17. Zhou, C.C.; Yin, G.F.; Hu, X.B. Multi-objective optimization of material selection for sustainable products: Artificial neural networks and genetic algorithm approach. Mater. Des. 2009, 30, 1209–1215. [Google Scholar] [CrossRef]
  18. Julirose, G. Genetic Algorithm Optimization of Product Design for Environmental Impact Reduction. Ph.D. Thesis, University of Malaya, Kuala Lumpur, Malaysia, 2018. [Google Scholar]
  19. Zhai, Y.; Wang, Y.; Huang, Y.; Meng, X. A multi-objective optimization methodology for window design considering energy consumption, thermal environment and visual performance. Renew. Energy 2019, 134, 1190–1199. [Google Scholar] [CrossRef]
  20. Wang, S.; Xiao, J.; Wang, J.; Jian, G.; Wen, J.; Zhang, Z. Application of response surface method and multi-objective genetic algorithm to configuration optimization of Shell-and-tube heat exchanger with fold helical baffles. Appl. Therm. Eng. 2018, 129, 512–520. [Google Scholar] [CrossRef]
  21. Cao, B.; Yuan, Y.; Arman, Y.; Feng, L.; Zhou, Z.; Wang, T.; Wang, Q. Optimization of Halbach magnetic roller for eddy current separation based on the response surface method and multi-objective genetic algorithm. J. Clean. Prod. 2021, 278, 123531. [Google Scholar]
  22. Lim, S.R.; Kim, Y.R.; Woo, S.H.; Park, D.; Park, J.M. System optimization for eco-design by using monetization of environmental impacts: A strategy to convert bi-objective to single-objective problems. J. Clean. Prod. 2013, 39, 303–311. [Google Scholar] [CrossRef]
  23. Deng, C.; Wu, J.; Shao, X. Research on eco-balance with LCA and LCC for mechanical product design. Int. J. Adv. Manuf. Technol. 2016, 87, 1217–1228. [Google Scholar] [CrossRef]
  24. Kluczek, A. An energy-led sustainability assessment of production systems—An approach for improving energy efficiency performance. Int. J. Prod. Econ. 2019, 216, 190–203. [Google Scholar] [CrossRef]
  25. Baptista, A.J.; Peixoto, D.; Ferreira, A.D.; Pereira, J.P. Lean Design-for-X Methodology: Integrating Modular Design, Structural Optimization and Ecodesign in a Machine Tool Case Study. Procedia CIRP 2018, 69, 722–727. [Google Scholar] [CrossRef]
  26. Chiang, T.A.; Che, Z.H. A decision-making methodology for low-carbon electronic product design. Decis. Support Syst. 2015, 71, 1–13. [Google Scholar] [CrossRef]
  27. Taghdisian, H.; Pishvaie, M.R.; Farhadi, F. Multi-objective optimization approach for green design of methanol plant based on CO2-efficeincy indicator. J. Clean. Prod. 2015, 103, 640–650. [Google Scholar] [CrossRef]
  28. Mele, M.; Campana, G. Sustainability-driven multi-objective evolutionary orienting in additive manufacturing. Sustain. Prod. Consum. 2020, 23, 138–147. [Google Scholar] [CrossRef]
  29. ISO 14040:2006; Environmental Management—Life Cycle Assessment—Principles and Framework. Available online: https://www.iso.org/standard/37456.html (accessed on 17 February 2022).
  30. Goedkoop, M.J. The Eco-Indicator 99 a Damage Oriented Method for Life Cycle Impact Assessment Methodology Report; Pre Concultants: Amersfoort, The Netherlands, 1999. [Google Scholar]
  31. Goldberg, D.E. Genetic Algorithms in Search, Optimization and Machine Learning; Addison-Wesley: Boston, MA, USA, 1989. [Google Scholar]
Figure 1. Three-dimensional drawing of an LCD frame.
Applsci 12 03002 g001
Figure 2. Environmental impact analysis of an LCD frame.
Applsci 12 03002 g002
Figure 3. Life-cycle architecture.
Applsci 12 03002 g003
Figure 4. Multi-disciplinary and multi-objective optimization flowchart.
Applsci 12 03002 g004
Figure 5. Multi-disciplinary objective function values based on (a) Method 1 and (b) Method 2.
Applsci 12 03002 g005
Figure 6. Multi-disciplinary and multi-objective optimization results based on (a) Method 1 and (b) Method 2.
Applsci 12 03002 g006
Table 1. Definition of RSM parameters for the environmental impact model.
IDParameterValue
X 1 display surface thickness0.2 mm, 0.25 mm, 0.3 mm, 0.35 mm, 0.4 mm
X 2 outer layer thickness of the frame0.2 mm, 0.25 mm, 0.3 mm, 0.35 mm, 0.4 mm
X 3 material1 (ABS), 2 (PS)
Y 1 use of fossil fuels1.05 mpt~2.21 mpt
Table 2. Definitions of RSM parameters for the mechanical strength model.
IDParameterValue
X 1 display surface thickness0.2 mm, 0.25 mm, 0.3 mm, 0.35 mm, 0.4 mm
X 2 outer layer thickness of the frame0.2 mm, 0.25 mm, 0.3 mm, 0.35 mm, 0.4 mm
X 3 material1 (ABS), 2 (PS)
Y 2 von Mises stress 151,248   ( N / m 2 ) ~ 432,188   ( N / m 2 )
Table 3. Ranges of optimization parameters.
Gene Code IDGene Code LengthActual Range
X 1 50.2 mm~0.4 mm
X 2 50.2 mm~0.4 mm
X 3 21, 2
Table 4. Multi-disciplinary and multi-objective optimization results based on Method 1 and Method 2.
Method W 1 W 2 G 1 G 2 Objective Function Value X 1   ( mm ) X 2   ( mm ) X 3 Environmental Impact (mpt) von   Mises   Stress   ( N / m 2 )
10.250.750.2030.2740.4770.4000.32911.79311.5813 × 105
10.30.70.2340.2650.4990.4000.28411.72381.6334 × 105
10.350.650.2620.2560.5180.4000.23911.65461.6989 × 105
10.40.60.2890.2450.5340.4000.20011.59461.7664 × 105
10.450.550.3250.2250.5490.4000.20011.59461.7664 × 105
10.50.50.3610.2040.5650.4000.20011.59461.7664 × 105
10.550.450.3880.1920.5800.3870.20011.55931.8464 × 105
10.60.40.4090.1840.5930.3680.20011.50761.9849 × 105
10.650.350.4220.1790.6020.3420.20011.43672.2158 × 105
10.70.30.4220.1840.6050.3030.20011.33012.6521 × 105
10.750.250.4040.1960.6000.2520.20011.19053.3851 × 105
20.250.750.1490.0280.1770.4000.29711.74381.6170 × 105
20.30.70.1560.0470.2030.4000.23911.65461.6989 × 105
20.350.650.1640.0590.2330.4000.20011.59461.7664 × 105
20.40.60.1880.0540.2420.4000.20011.59461.7664 × 105
20.450.550.2110.050.2610.4000.20011.59461.7664 × 105
20.50.50.2200.0590.2790.3870.20011.55931.8464 × 105
20.550.450.2170.0760.2930.3680.20011.50761.9849 × 105
20.60.40.2000.1000.3000.3420.20011.43672.2158 × 105
20.650.350.1670.1320.2990.3100.20011.34932.5658 × 105
20.70.30.1050.1790.2840.2650.20011.22613.1807 × 105
20.750.250.010.2390.2490.2060.20011.06424.2043 × 105
Notation: X 1 , display surface thickness; X 2 , outer layer thickness; X 3 , material; W 1 , weight of the environmental impact function V 1 ( X ) ; W 2 , weight of the von Mises stress function V 2 ( X ) ; G 1 , function value of V 1 ( X ) after GA calculation; G 2 , function value of V 2 ( X ) after GA calculation.
Publisher’s Note: MDPI stays neutral with regard to jurisdictional claims in published maps and institutional affiliations.

