Article

Finite Element Analysis and Support Vector Regression-Based Optimal Design to Minimize Deformation of Indoor Bicycle Handle Frame Equipped with Monitor

1
Department of Future Convergence Engineering, Kongju National University, Cheonan 31080, Korea
2
Department of Future Automotive Engineering, Kongju National University, Cheonan 31080, Korea
*
Author to whom correspondence should be addressed.
Appl. Sci. 2022, 12(6), 2999; https://doi.org/10.3390/app12062999
Submission received: 27 January 2022 / Revised: 28 February 2022 / Accepted: 11 March 2022 / Published: 15 March 2022
(This article belongs to the Section Mechanical Engineering)

Abstract

:
Exercise has been gaining importance, as well as people’s interest. Nowadays, exercise bikes and similar home training devices usually feature a monitor to provide visual information and increase people’s convenience. With the increasing size of the mounted monitor frame, it is imperative to consider the monitor weight while designing the handle for an indoor exercise bike equipped with a monitor. In this study, optimal design based on finite element (FE) analysis was applied to increase the safety and robustness of the handle of an indoor bicycle equipped with a monitor. Considering the load that may be imposed on the handle, and its location, four FE analysis cases were performed. Loading conditions that contributed the largest von Mises stress (out of the four cases) were applied. Five design variables were chosen to minimize the effective stress. Moreover, the factor arrangement method using five factors and two levels required the run of 25 = 32 design cases. The resulting Pareto chart and sensitivity analysis confirmed the relationship between the effective stress and the chosen design variables. To obtain a predictive model using support vector regression (SVR), we subsequently increased the data range to five factors and three levels. The SVR prediction model was trained using a polynomial kernel to find the kernel parameters that provided the highest accuracy. Based on the coefficient of determination, the accuracy of the SVR prediction model was found to be superior to the conventional regression-based optimal design method. Additionally, the value of the design variable with the minimum effective stress was obtained using the SVR prediction model. Furthermore, upon redesigning the handle of the bicycle with the optimized design variable values, we found that the maximum effective stress was reduced by 80% compared with the initial model. Finally, the effective stress predicted by the SVR model was similar to that from the FE analysis, which confirmed the reliability of the predictive model.

1. Introduction

With an increase in health consciousness and awareness in modern people, the use of indoor exercise equipment has been increasing. Consequently, various types of exercise equipment are being developed. Exercise equipment, such as treadmills and indoor bicycles, include very simplistic and repeating movements that induce boredom in users. Therefore, exercise equipment with fitted monitors or cell phone mounting devices are being developed to provide features such as listening to music and watching TV. As shown in Figure 1, indoor bicycles and treadmills equipped with Peloton’s monitors enable users to simultaneously watch content while exercising, measure the amount of exercise, and recognize diverse exercise-related information. This ultimately increases the users’ convenience. Furthermore, the equipment that combines three-dimensional (3D) virtual reality, wherein the users feel like they are exercising outdoors, is progressively being designed [1]. The increase in the diversification of functionalities and the usage of monitor-fixed exercise equipment has led to the gradual widening of the monitor frame. Among the indoor bicycles currently in the market, Peloton’s monitor is the largest (22 inches). As the frame expands, the total weight also increases, which can lead to separation or sagging due to the load of the monitor. Although the monitors are gradually becoming thinner and lighter in weight, the resulting impact of damage and sagging cannot be ignored. Therefore, considering these factors, a structural analysis of the monitor frame must be conducted. Particularly, for indoor bicycles, the pedal and saddle experience the greatest force. Additionally, as the force can be concentrated on the handle for balancing and support, it is generally necessary to check the behavior and effect of the monitor mounted on the handle frame. The majority of the existing studies discuss methodologies to confirm the safety and high rigidity of the bicycle frames. These investigations are mainly based on finite element analysis (FEA) for calculating the forces applied to the saddle or pedal, which generally distribute most of the body weight [2,3]. Devaiah et al. [4] secured reliability in comparison to theoretical results by conducting FEA to reduce the weight of the bicycle while maintaining its rigidity and strength. Likewise, Covil et al. [5] conducted a study to analyze the bicycle frame and its corresponding structural characteristics through FEA. Furthermore, they analyzed the influence of design variables. In existing literature, studies on bicycle frames are dominant; moreover, optimization methods for bicycle handles are being studied [6].
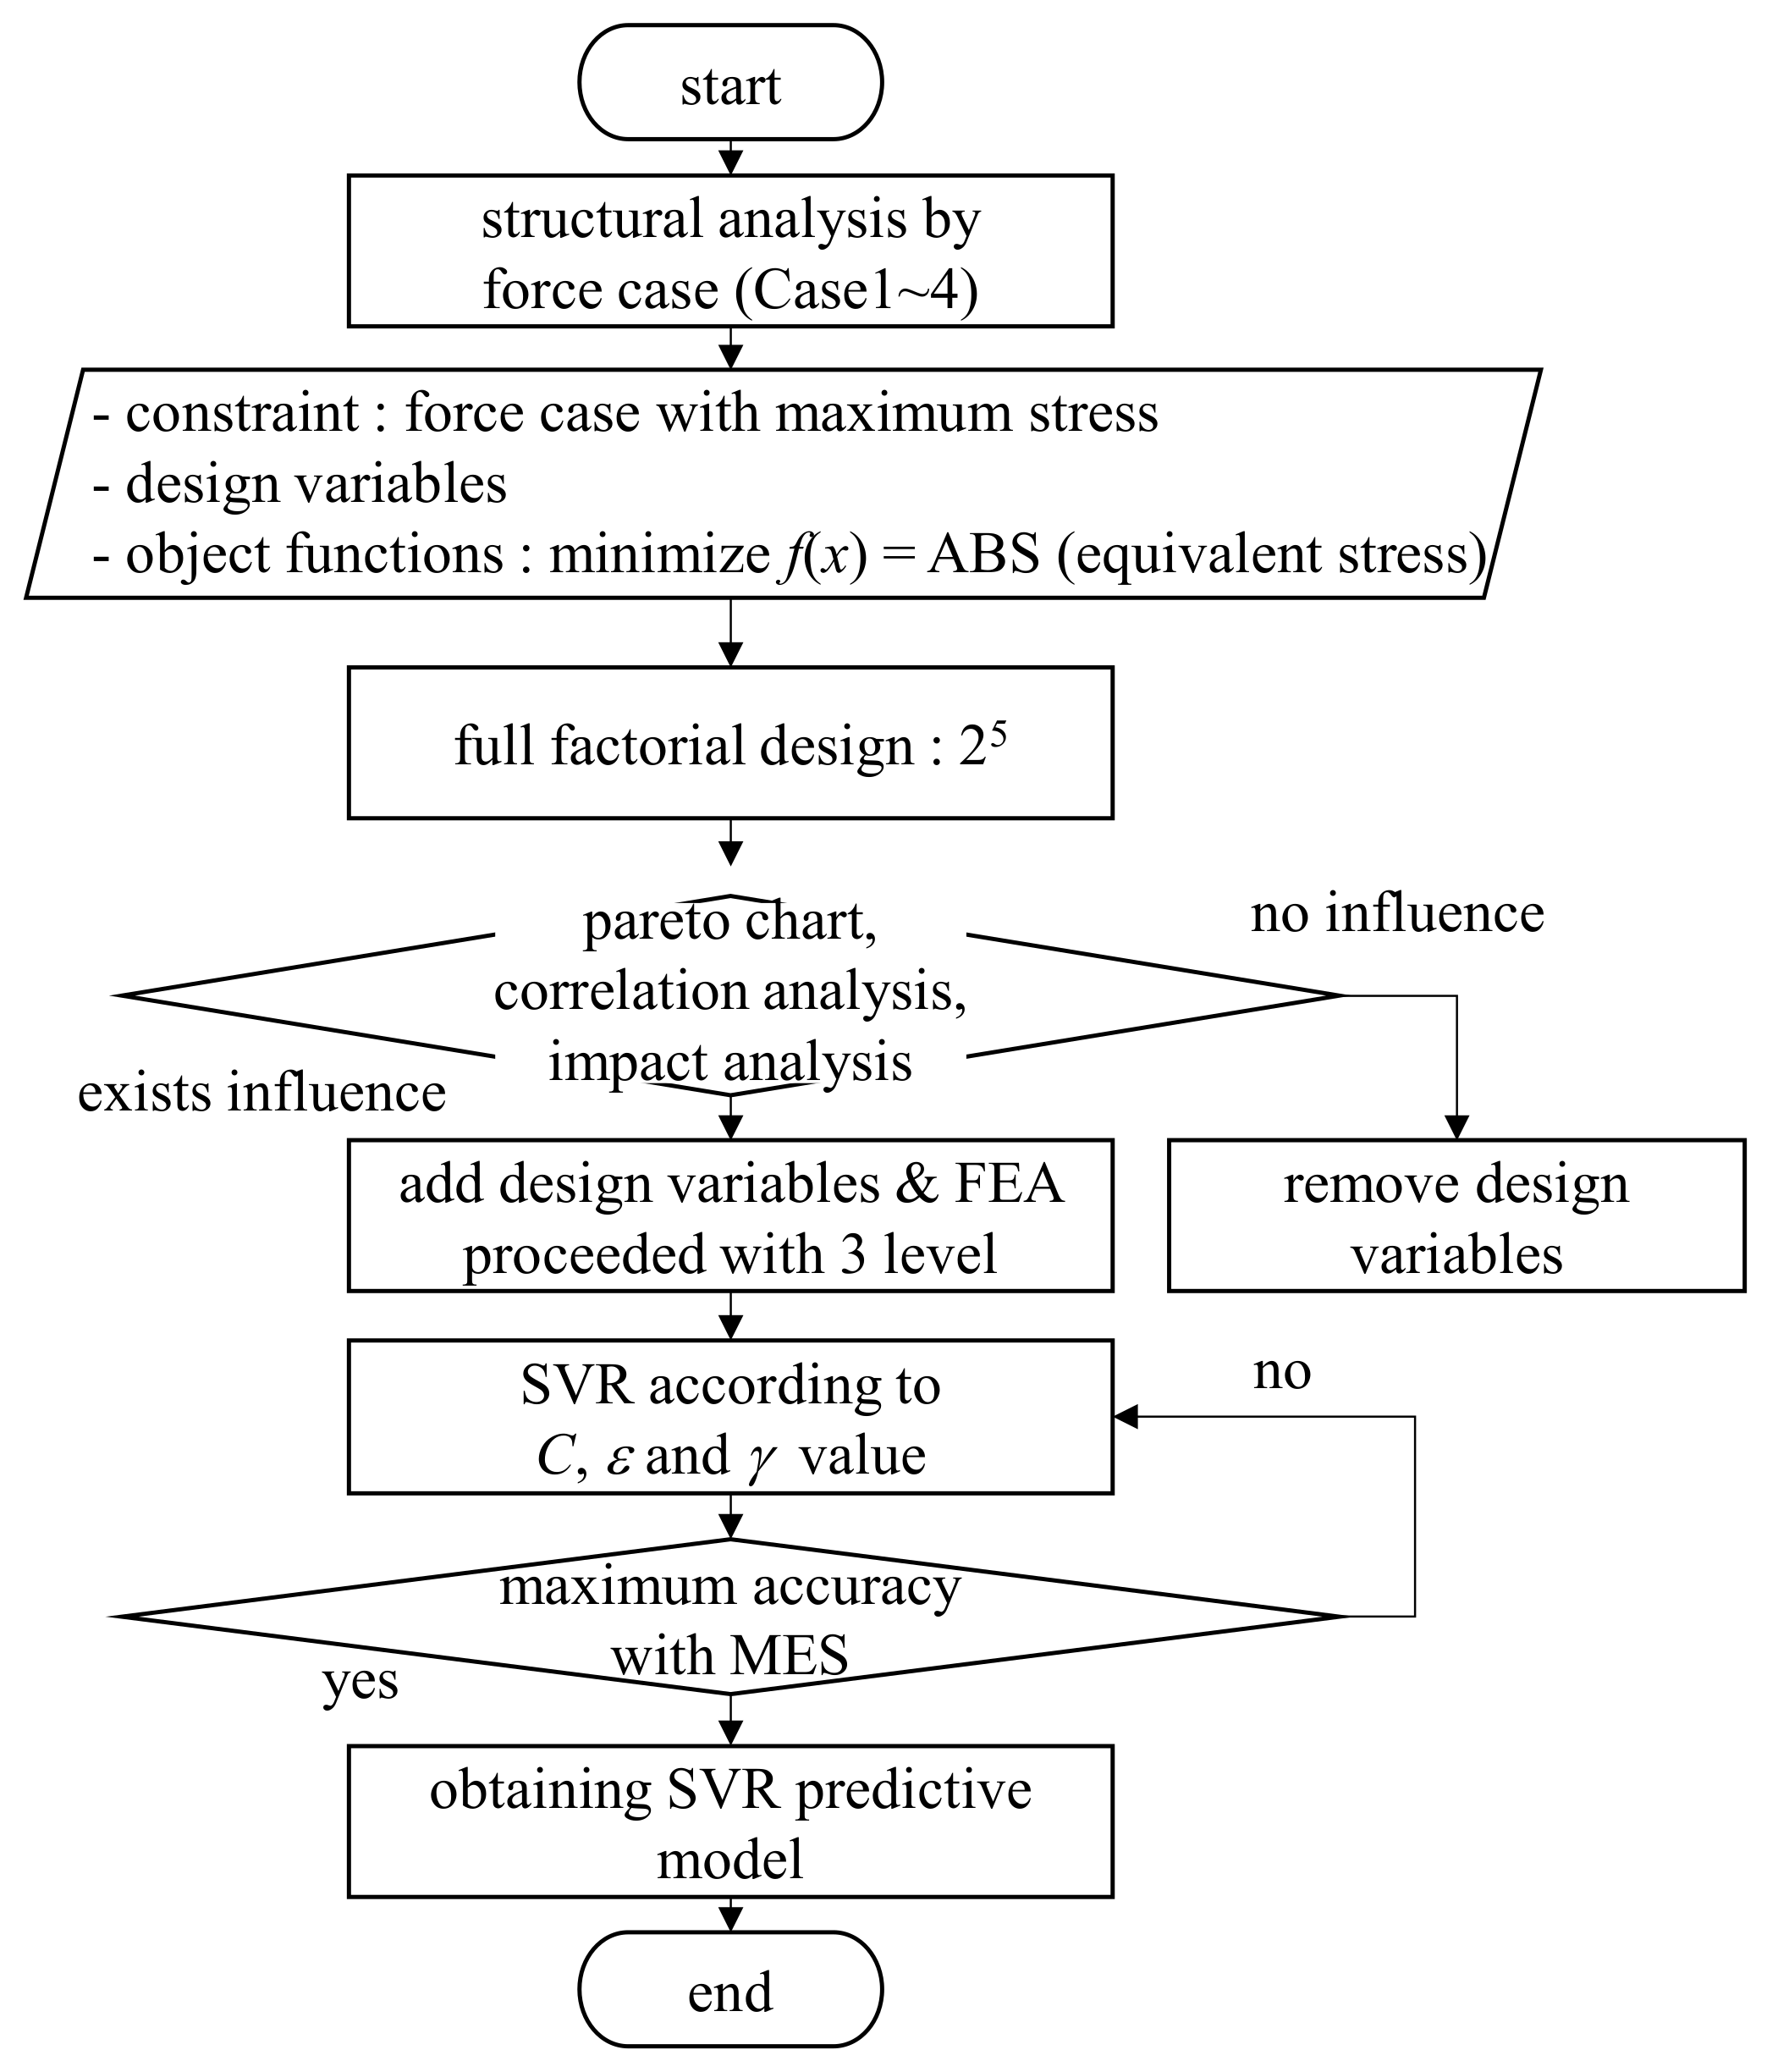
Although several studies have been conducted related to the handle or frame of a bicycle that are highly affected by outdoor factors, there are significantly fewer studies related to indoor bicycles. Indoor bicycles are not affected by outdoor factors such as weather or road conditions. They must be designed in consideration of the weight of the monitor applied to the handle. Therefore, in this study, we aimed to determine the optimal design of an indoor bicycle handle frame by applying FEA, with the additional consideration of the load applied due to the monitor. To minimize effective stress and sagging, the influence was determined through sensitivity analysis among design variables, and an optimal predictive model was derived using the support vector machine (SVM) method. The indoor bicycle handle was designated as an area of interest, and structural analysis was conducted considering the power that could be applied for simplified modeling. Further, the effective stress and sagging according to the design variables were checked by designating the load with the greatest influence. Thereafter, the correlation between the Pareto chart and the sensitivity analysis for each design variable was checked; the dataset was classified; and kernel parameter values were obtained to derive the optimal predictive model by learning with support vector regression (SVR). The learned model presented the experimental results obtained by applying the test value and calculating the actual value and error (Figure 2).

2. FEA and Optimal Design

2.1. Bicycle Handle Modeling with Monitor

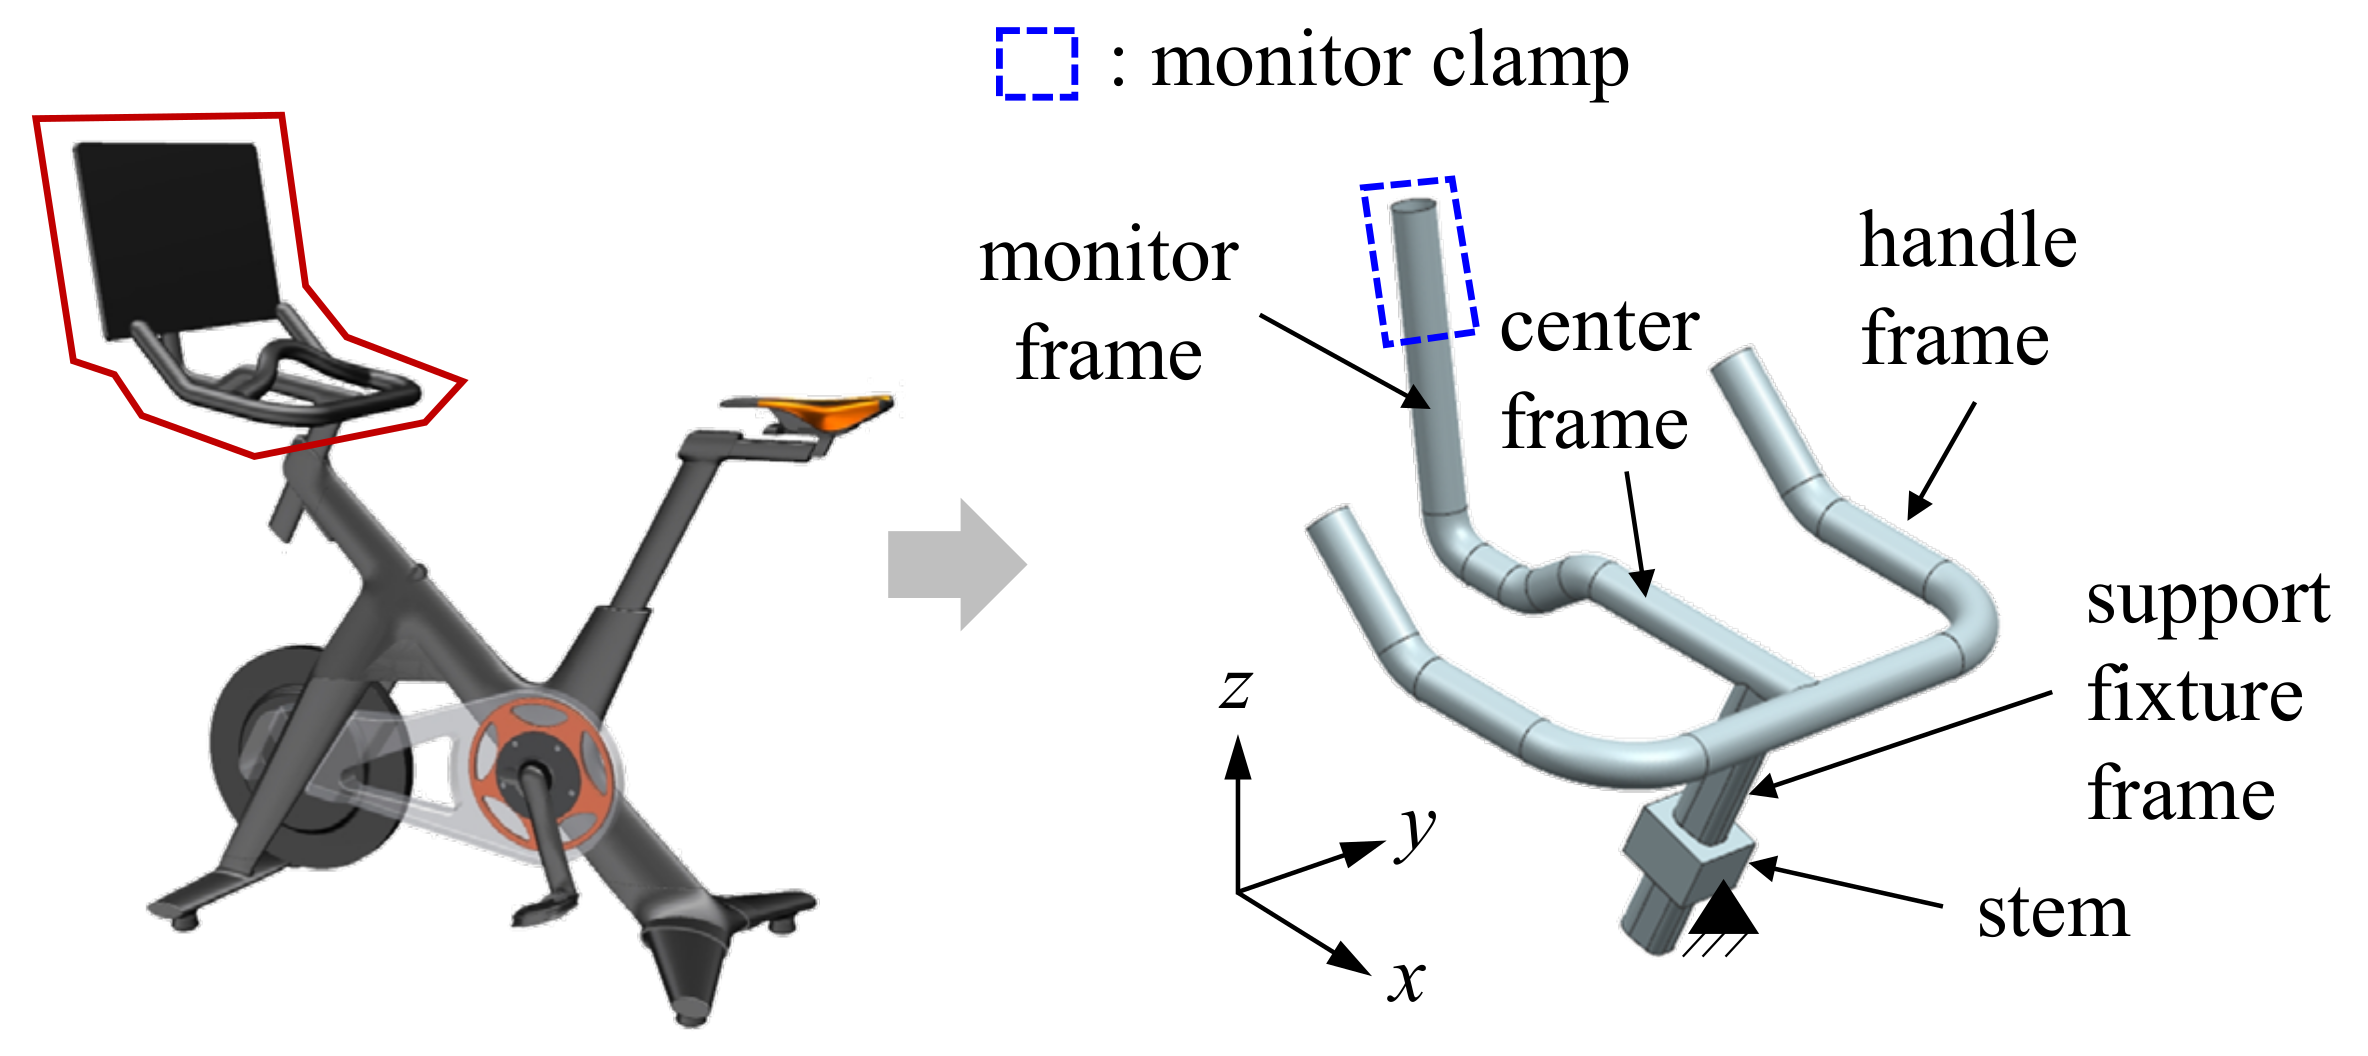
To proceed with the structural analysis according to the load size and position, the simplified geometric model of the bicycle frame structure equipped with a monitor was employed for the selected area of interest (Figure 3). The bicycle handle modeling was largely divided into five parts, as follows: (1) the monitor frame that mounts the monitor, (2) the handle frame to which the user’s load is directly applied, (3) the center frame that connects the handle and monitor mounting part, and (4) the support frame that connects it to the bicycle body, referred to as (5) the stem. In the current study, the monitor had a simple shape, and only the weight on the frame varied depending on its size. Thus, the weight was applied to the monitor mounting unit without modeling. If its largest size available for indoor bicycles was considered suitable for a 24-inch monitor, a maximum weight of 6 kg could be applied. Considering that the bicycle frame was a hollow shaft, all frames except the stem were set to a shell type, with a thickness of t = 2 mm.

2.2. Structural Analysis According to the Load

2.2.1. Boundary and Load Conditions

Bicycle frames are generally made of aluminum. Thus, as listed in Table 1, the general physical properties of aluminum were used in the Ansys software database. As the stem serves to fix the center frame, it represents a complete contact condition. Further, a fixed condition was assigned to the corresponding side because the stem side was connected to the bicycle body (Figure 4). Considering the cases where the load may be applied, the load was allocated from Case 1 to Case 4, as shown in Figure 4.
Case 1 was set as the load being applied to the monitor when the user touches or operates the monitor manually. Cases 2–4 were set as the loads being applied when the user supports or holds the bicycle handle. According to Yoon et al. [7], the load applied to the handle in the static bicycle fitting state is up to 15% of the total weight. Therefore, 240 N, that is, 20% of 120 kg of weight, was designated as the load while considering the dynamic state.

2.2.2. Effective Stress Results According to Load Conditions

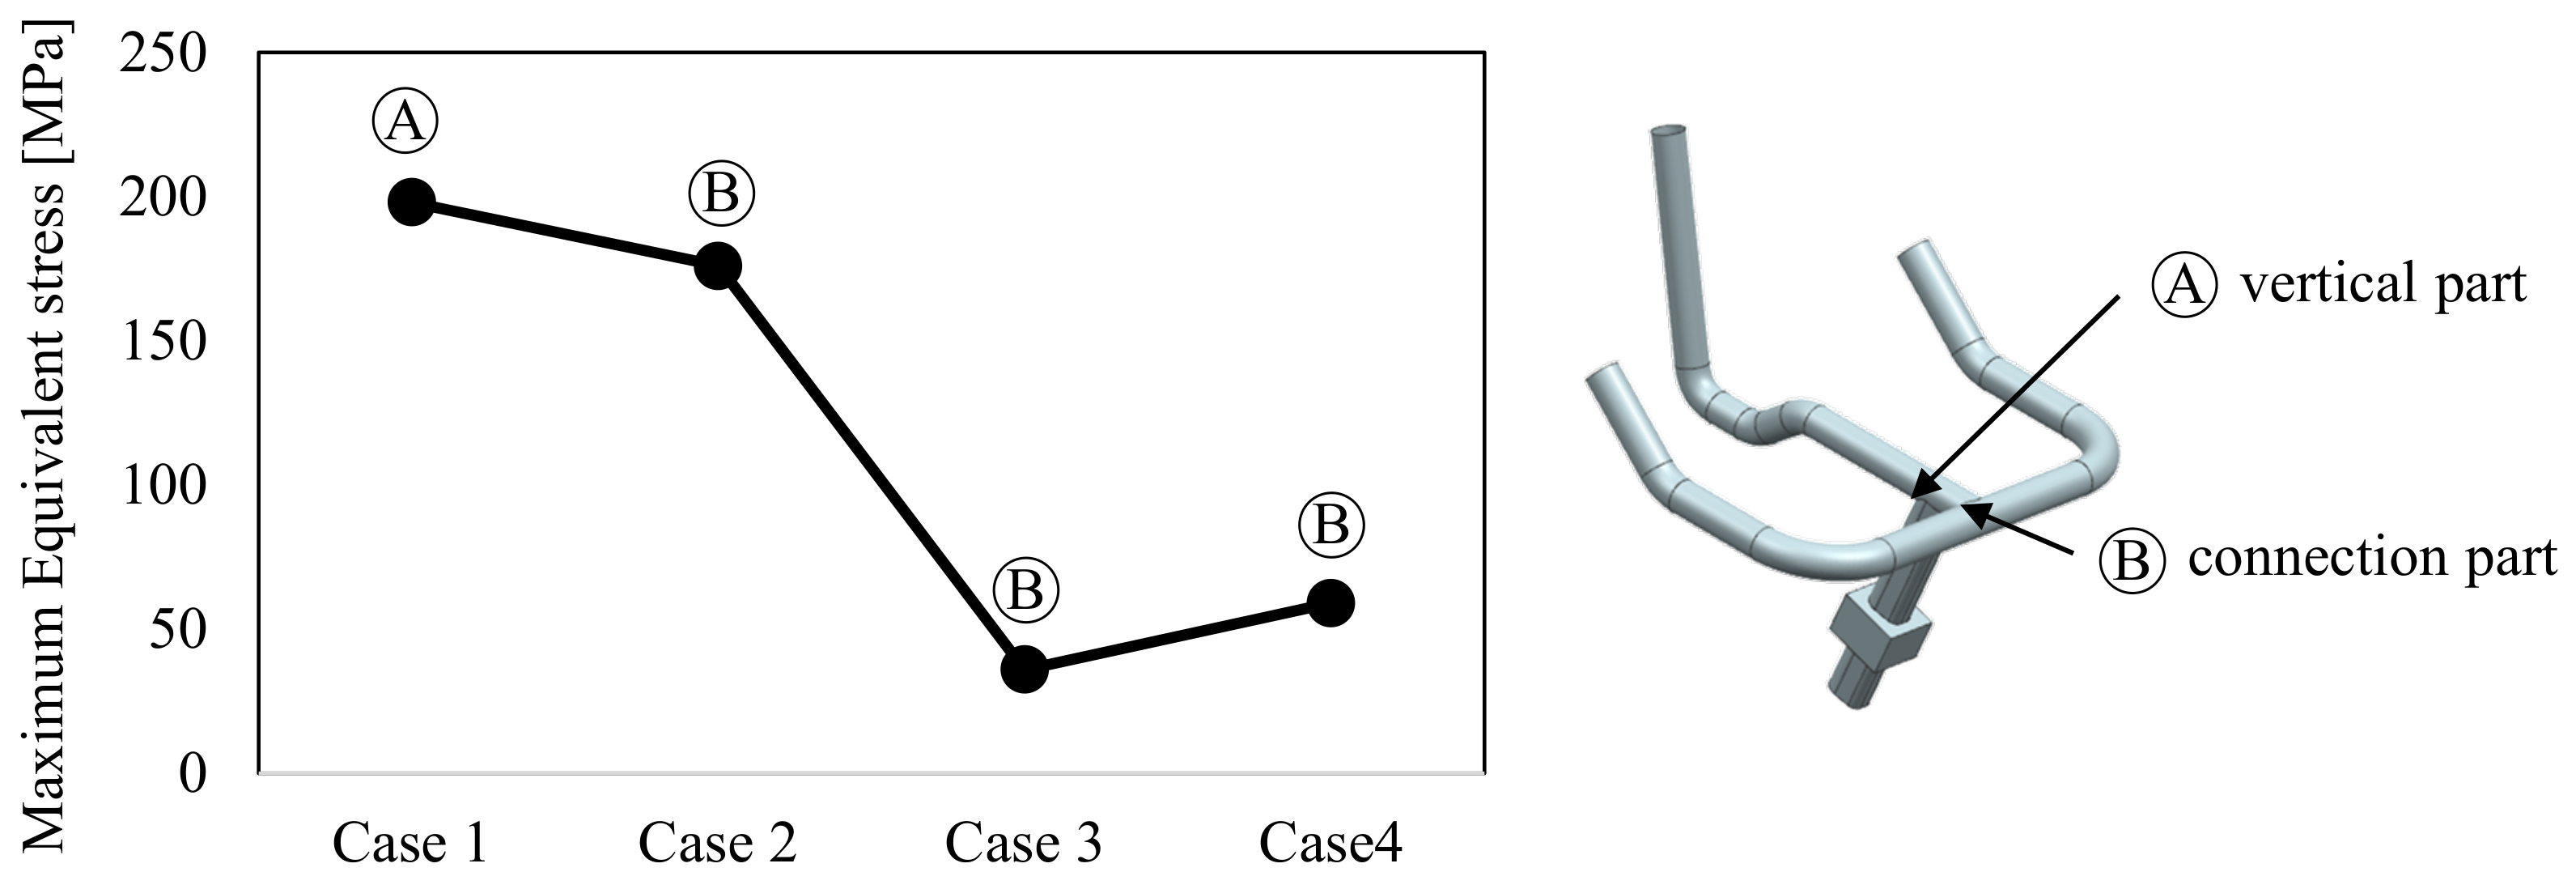
Structural analysis was conducted for the four cases by applying the aforementioned constraints and material properties. The result was calculated using the Ansys software on an NVIDIA DGX Station (Future Automotive Intelligent Electronics Core Technology Center, Cheonan, Korea). Figure 5 shows the maximum effective von Mises stress results obtained. Among all the cases, the highest effective stress was confirmed at 250 MPa for Case 1, which appeared at the connection part shown in Figure 5. For Case 2, the highest effective stress of 176 MPa was observed when a load was applied to the handle. Cases 3 and 4 exhibited values of 36 and 59 MPa, respectively. Here, all the maximum effective stress positions appeared in the vertical part. Since the handle of the indoor bicycle and the body are connected at a certain angle, when a load is applied to the handle, stress is concentrated in the connection between the center frame and the handle frame.
Generally, for flexible materials, the safety rate is obtained by dividing the yield strength by effective stress. A safety rate of 2.0 or higher signifies that the part is structurally stable [8]. Since the yield stress of aluminum was set as 280 MPa in this study, the safety rates obtained for cases 1–4 were 1.41, 1.59, 7.78, and 4.75, respectively. Therefore, deformation could occur when a load is applied for cases 1 and 2. Thus, the case with the maximum stress was selected as a constraint.

2.3. Optimal Design of Bicycle Handle Frame with Monitor

2.3.1. Design Variables

Based on the effective stress results identified in Section 2.2, a total of five design variables were assigned. These values could affect the application of loads to the bicycle handle frame (Figure 6). Table 2 lists the design variables, constraints, and objective functions used for the optimal design. The angles x1 and x2 (Figure 6) were considered to have the greatest effect on Case 1, where the load was applied to the monitor; thus, they were employed as design variables. Due to the weight of the monitor, x3 could vary depending on the length, and the center of gravity could change according to the position of x4. Owing to the hollow axial shape, the breaking of the bicycle could be avoided by increasing the shell thickness, x5. However, as the material costs and weight increase with increasing shell thickness, x5 was also selected as a design variable. According to the constraints of each design variable, a total of 25 = 32 analyses were conducted, according to the factor allocation method with a minimum of five factors and a maximum of two levels. Upon checking the Pareto chart [9], as shown in Figure 7, the influences of x5 and x1 were found to be relatively large in Case 1. However, all design variables influenced the effective stress with a reference value of 1.746 or higher. Figure 7 shows the sensitivity analysis of the design parameters as the average value according to each variable.
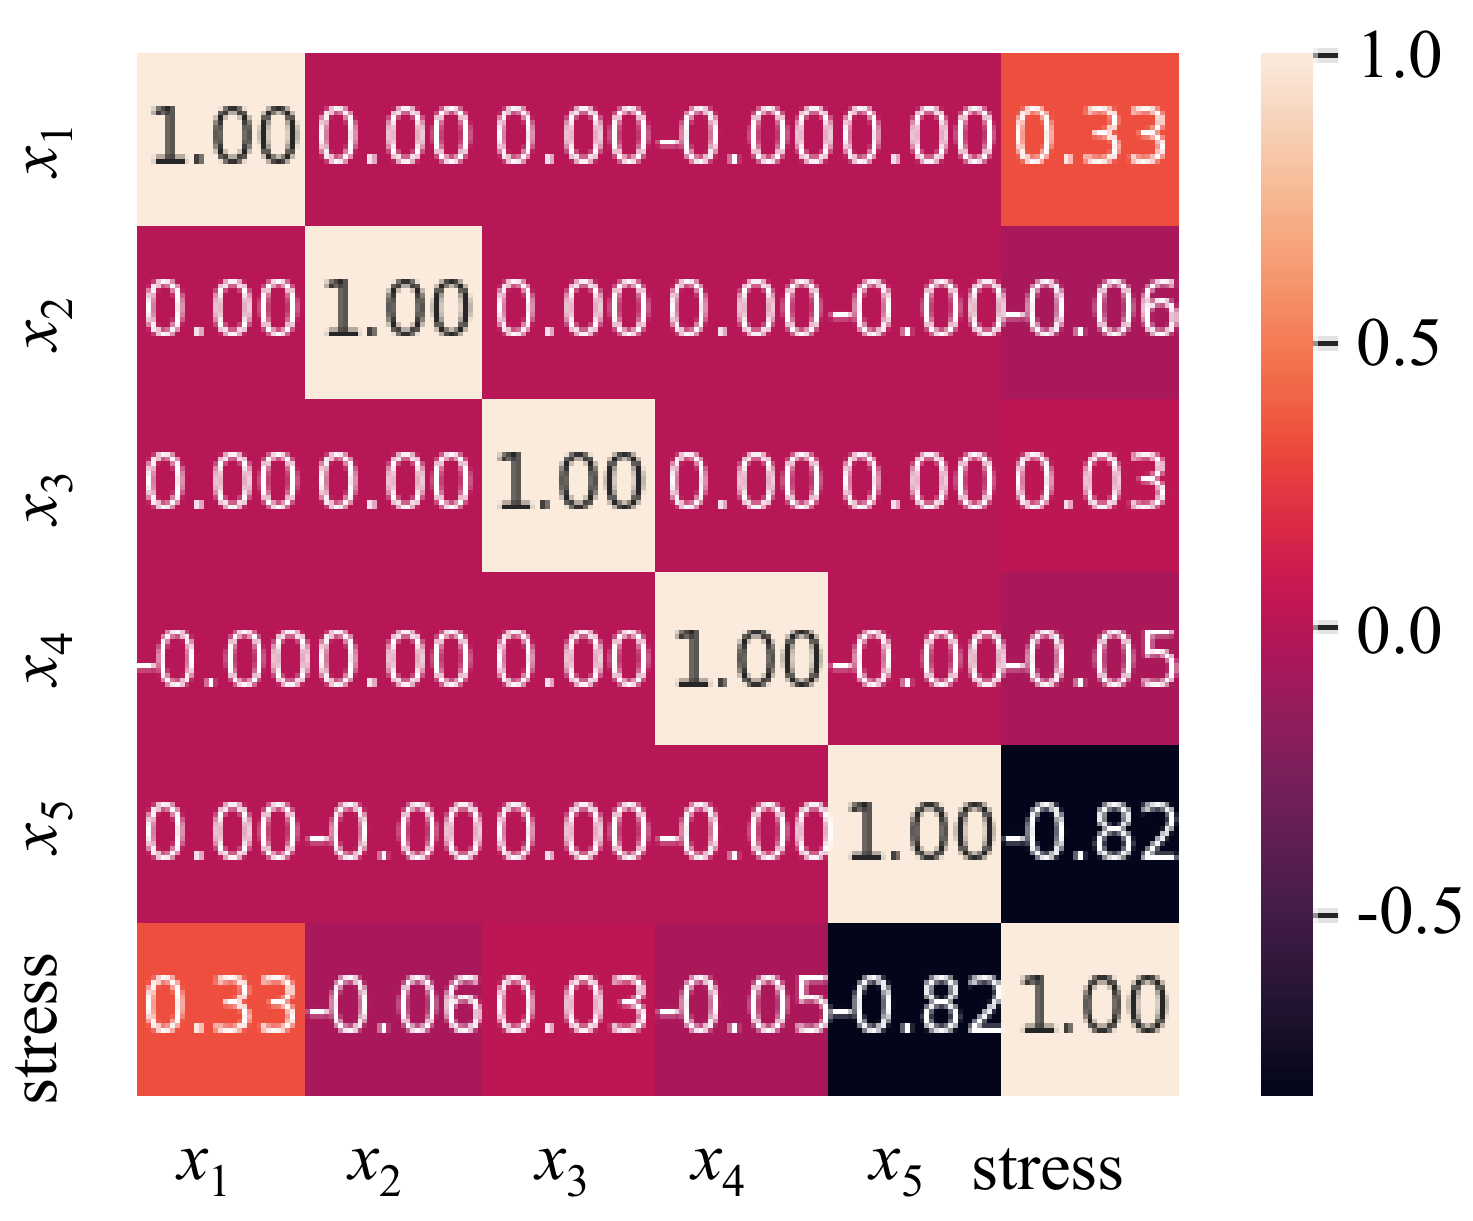
The larger the slope, the greater the influence of the design variable on the objective function. Therefore, x5 showed the greatest influence on the objective function, followed by x1, x2, x4, and x3. Additionally, the correlation by variables, from the highest to the lowest, was x5, x1, x2, x4, and x3 (Figure 8). The degree of correlation was expressed numerically and had a value of at least 0.0 to at most 1.0. A positive correlation was indicated when the number sign was (+), and a negative correlation was obtained when the sign was (−). Furthermore, all the variables were applied to predictive model learning because there was a correlation and influence between the objective function and all design variables.

2.3.2. Optimal Design Using SVR

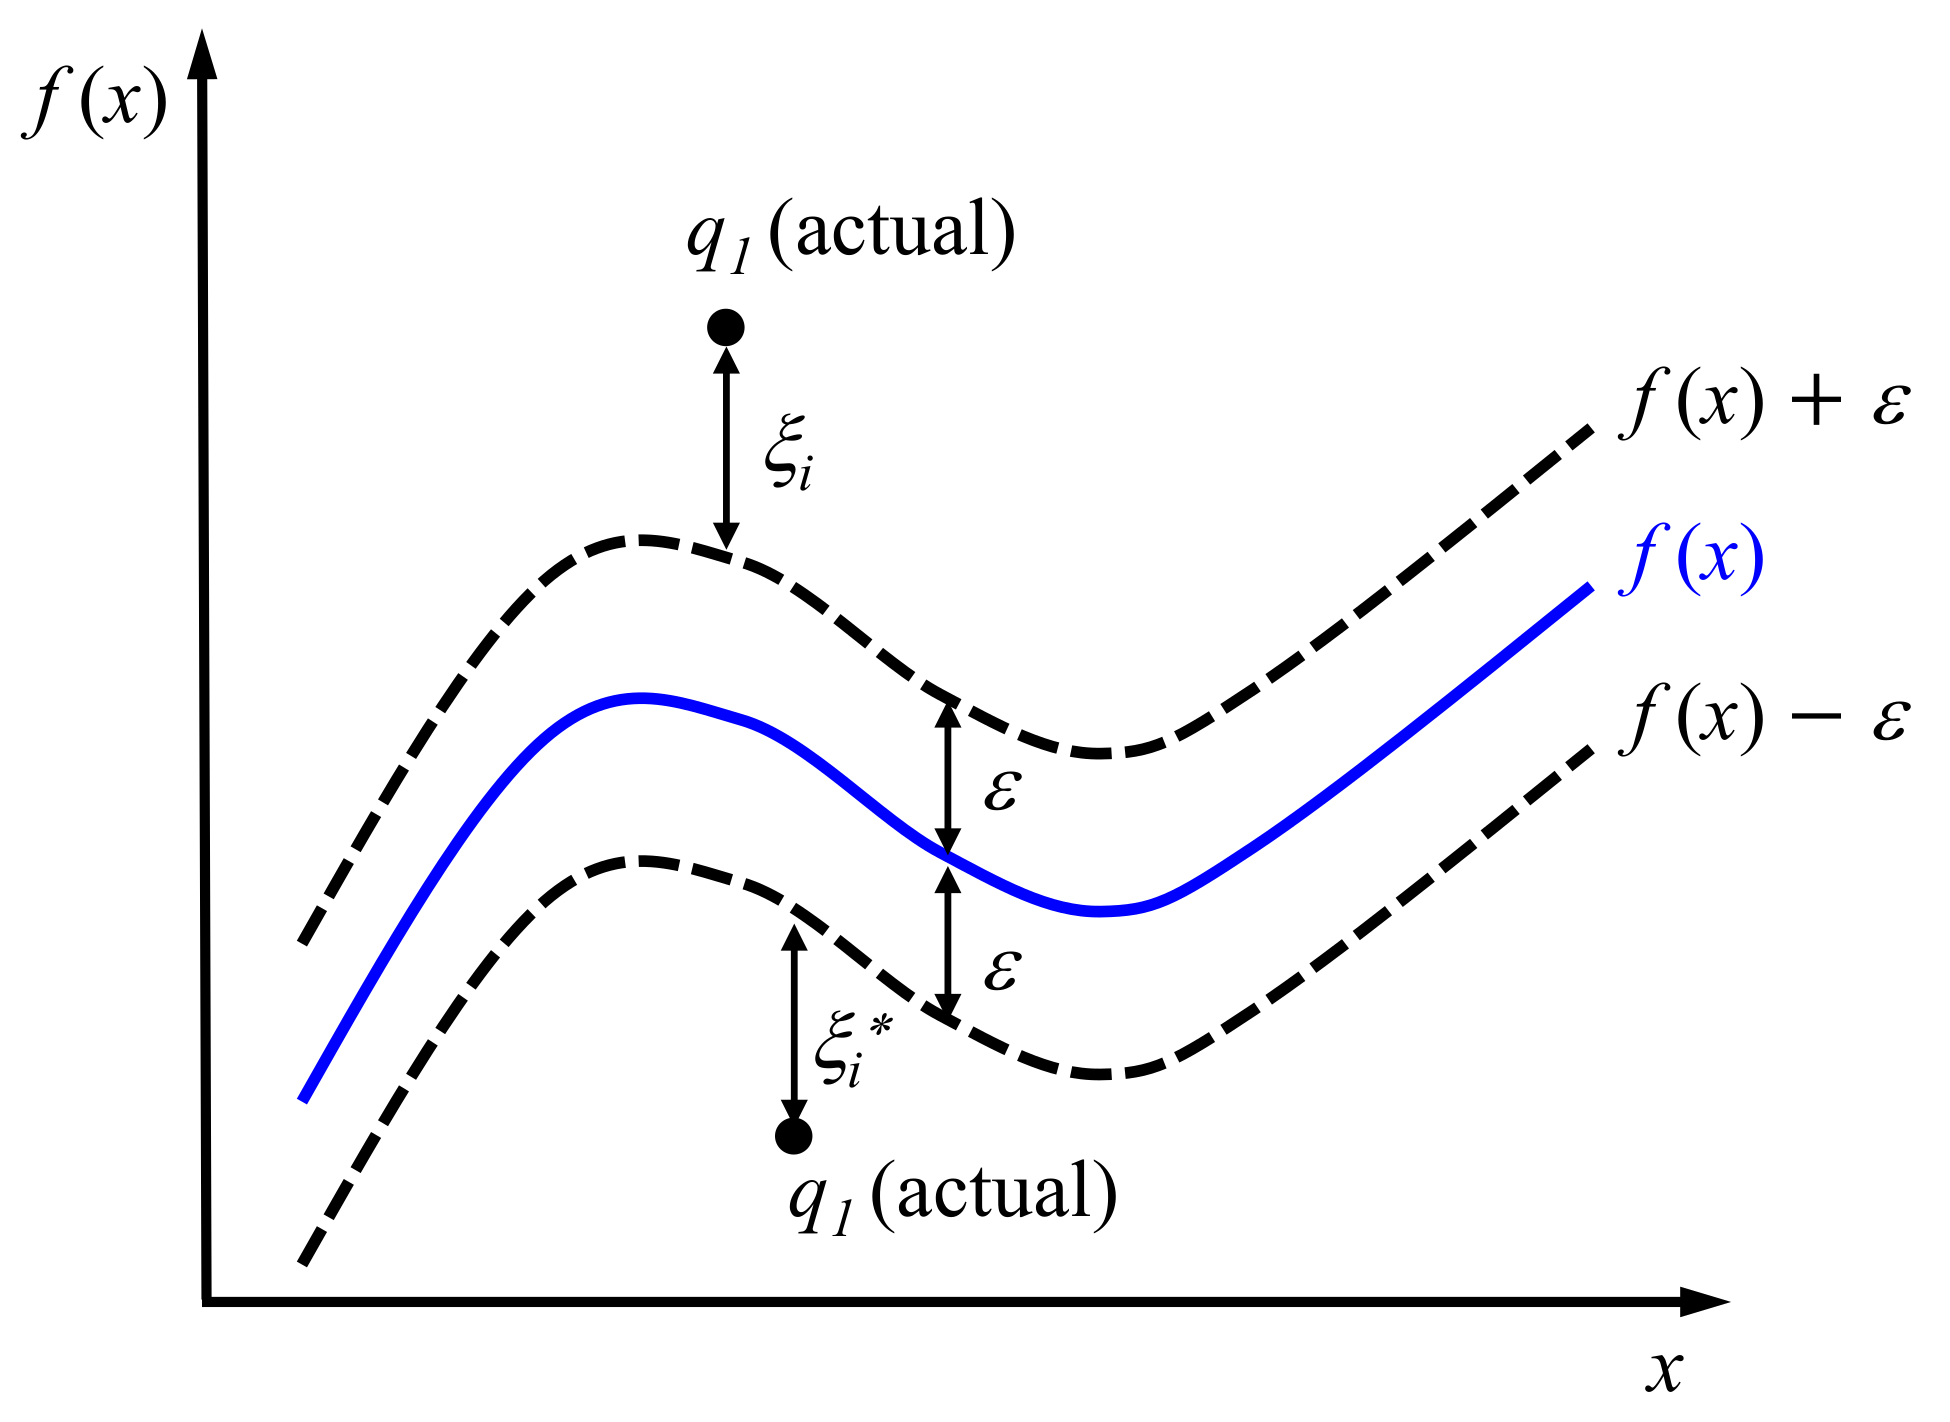
SVM is a machine learning method that is actively used in pattern recognition and data analysis. It is widely used as a classification or prediction method due to its advantage of low probability of overfitting, and high prediction accuracy [10]. It is largely classified into support vector classification (SVC), and continuous variable support vector regression (SVR) [11]. SVC calculates the cost of the model based on errors included within the margin range. Meanwhile, SVR calculates the cost of the model based on errors for out-of-margin values, and is a generalized method used to predict real values by introducing an ε-insensitivity loss function to SVM [12]. As shown in Figure 9, the difference between the actual value and the predicted value does not deviate from the error allowance rate, ε, and aims to maximize the margin. The equation of SVR is the same as Equation (1), where x is the input variable, y is the output variable, ξi is the distance outside the range ε, and yi is the penalty value given when outside the range ε. Here, the constant C and ε values must be appropriately assigned to secure good performance of the prediction model.
1 2 w 2 + C i = 0 l ξ i + ξ i * y i w x i b ε + ξ i w x i + b y i ε + ξ i * ξ i   ,   ξ i * 0
In this study, we derived a predictive model using Python 3.7, and its machine learning library, Scikit-learn [13]. Here, SVR uses a kernel function to classify the low-dimensional nonlinear data by moving it to a high-dimensional level, and the kernel types are generally either linear polynomial or radial basis function methods. To determine the kernel function suitable for the data used in this study, we compared these two types of functions: polynomial, and radial basis function kernel. Herein, C, which represents the penalty value for the error interval, was fixed at 1, ε at 0.001, and γ at 0.01, and the corresponding predicted performance was evaluated. Typically, mean square error (MSE) is widely used as an indicator for regression evaluation. The two kernels were compared in terms of their MSE, as expressed in Equation (2). The symbol y ^ i denotes a predicted value, whereas yi denotes a reference value derived by analysis. This shows that the closer the value is to 0, the better the predictive performance. Subsequently, the radial basis function kernels showed better performance. Therefore, radial basis function kernel was used to derive an optimal prediction model in the current study. The radial basis function kernel sequentially performs learning using the GridSearchCV method by setting three parameter range values, that is, C, ε, and γ. Each parameter variable value was designated as shown in Table 3, and a total of 27 result values were compared in terms of their MSE results. The results of SVR could vary according to the data scale, and the five design variables used as SVR input values could affect the prediction results because they were all different in scale. Accordingly, the range of data characteristic values was adjusted equally by the standard scaler method, using their mean and standard deviation.
MSE = 1 n i = 1 n y ^ i y i 2

3. Experimental Results

For SVR, a total of 243 datasets were learned for five factors and three levels. Table 4 presents the prediction results. Upon using a polynomial kernel, an MSE of 0.005 was obtained when C = 100, ε = 0.001, and γ = 1, which was the closest value to 0. Additionally, the coefficient of determination (R2), which is often used as a measure to confirm the suitability in regression, demonstrated a value of 0.999, which indicated good performance. The value of R2 approaching 1 signifies higher accuracy, as calculated by Equation (3), where yp, yr, and ( y r ¯ ) represent the predicted value, experimental value, and average experimental value, respectively.
Furthermore, the accuracy of the model predicted using SVR was compared with that of the regression analysis, which is the existing optimal design method. Equation (4) shows the regression equation. The value of R2 was used to compare the prediction accuracy of the two methods. As shown in Figure 10, the red series represents the accuracy R2 of the prediction model learned with SVR, and the blue series represents the accuracy of the values calculated using the regression equation. The design variables used as test data arbitrarily designated values that were not used for learning and modeled only those values that met the constraints.
R 2 = 1 y r y p 2 y r y ¯ r 2
Y 1 = 166.73 + 0.930 x 1 + ( 0.288 ) x 2 + 0.1339 x 3 + ( 0.0863 ) x 4 + ( 46.029 ) x 5
On comparing a total of 16 test datasets, the SVR prediction model showed high prediction accuracy, with an R2 of 0.94. Meanwhile, the regression equation showed an R2 of 0.70. On comparing all the test data values presented in Figure 10, it was seen that the SVR prediction values were similar to those of FEA. As the relationship between the dependent variables and the independent variables was not two-dimensional, the accuracy of SVR was higher than that of the regression equation, which considers only two-dimensional relationships. Therefore, the optimal design was implemented using the SVR prediction model, and design variable values were derived to minimize effective stress within the limited conditions. As the optimal design result, when the design variables were x1 = 120°, x2 = 90°, x3 = 30 mm, x4 = 0 mm, and x5 = 4.8 mm, the prediction with SVR confirmed that the effective stress was 47.8 MPa. The results show that the effective stress was reduced by 80%, as compared to that of 250 MPa obtained for the existing design model; and, moreover, it was structurally stable with a safety rate of 5.86. To verify the accuracy of the modeling analysis, the handle part was redesigned using the corresponding design variables, and structural analysis was conducted under the same conditions. Consequently, the maximum effective stress was estimated as 51.4 MPa, thus showing similar results with a minute difference of 3.6 MPa.

4. Conclusions

In this study, we performed FEA to improve the safety and rigidity of an indoor bicycle handle frame equipped with a monitor. The optimal design was obtained using simple analysis, and SVR was performed additionally.
(1)
The load applied to the bicycle handle frame was divided into a total of four cases to perform the structural analysis. Among the four load conditions, cases with a standard safety rate below 2.0 were selected, and those two load cases were considered for optimal design.
(2)
Five design variables that affected the minimization of effective stress were assigned, and a total of 32 analyses were performed using a five-factor, two-level factor arrangement method. The results of the sub-analysis were derived, and their consequent sensitivity analysis and correlation with the maximum effective stress, which was the objective function, were confirmed through the Pareto chart. All five design variables were found to be significant. Therefore, 125 datasets, at five factors and three levels, were obtained and compared using regression equation and prediction equation with SVR.
(3)
Using the SVR of the radial basis function kernel method, the learning model with the highest accuracy was derived by obtaining the optimal values of C, ε, and γ, which represented penalty values for the error interval. Herein, the mean square error was used for comparing the accuracy, and the best results were obtained when C = 100, ε = 0.001, and γ = 1.
(4)
Upon comparing the SVR prediction model with the existing regression equation through R2 values, the accuracy of the SVR model was found to be higher. Accordingly, an optimal design was conducted to secure the safety and rigidity of the monitor handle using the SVM prediction model. The design variable values wherein the effective stress from the model was minimized were x1 = 120°, x2 = 90°, x3 = 30 mm, x4 = 0 mm, and x5 = 4.8 mm. Consequently, the effective stress was reduced by up to 80% compared with the initial model. FEA was conducted by redesigning the model with the obtained values of the design variables, and the results obtained were similar to the predicted values. Thus, the reliability of this study was confirmed.

Author Contributions

Conceptualization, S.H.; methodology, S.H. and E.N.; software, E.N.; validation, E.N.; investigation, E.N.; writing—original draft preparation, E.N.; writing—review and editing, S.H.; visualization, E.N.; supervision, S.H.; project administration, S.H. All authors have read and agreed to the published version of the manuscript.

Funding

This research was supported by “Regional Innovation Strategy (RIS)” through the National Research Foundation of Korea (NRF) funded by the Ministry of Education (MOE) (2021RIS-004).

Institutional Review Board Statement

Not applicable.

Informed Consent Statement

Not applicable.

Data Availability Statement

Not applicable.

Conflicts of Interest

The authors declare no conflict of interest.

References

  1. Han, S.J.; Kim, S.; Cho, J.; Koo, K. Ergonomic evaluation of indoor bike coordinated with virtual images. J. Digit. Converg. 2017, 157, 443–451. [Google Scholar]
  2. Lee, H.; Park, S.W.; Shin, S.Y.; Lee, S.Y. Development of structural analysis automation system for bicycle design. In Proceedings of the KSME 2012 Spring Annual Conference, Deajeon, Korea, 26–27 June 2012; pp. 11–12. [Google Scholar]
  3. Khutal, K.; Kathiresan, G.; Ashok, K.; Simhachalam, B.; Jebaseelan, D.D. Design validation methodology for bicycle frames using finite element analysis. Mater. Today-Proc. 2020, 22, 1861–1869. [Google Scholar] [CrossRef]
  4. Devaiah, B.B.; Purohit, R.; Rana, R.S.; Parashar, V. Stress analysis of a bicycle frame. Int. J. Eng. Sci. Technol. 2018, 5, 18920–18926. [Google Scholar] [CrossRef]
  5. Covil, D.; Bdegg, S.; Elton, E.; Milne, M.; Morris, R.; Katz, T. Parametric finite element analysis of bicycle frame geometries. Procedia Eng. 2014, 72, 441–446. [Google Scholar] [CrossRef] [Green Version]
  6. Khande, H.A.; Narwade, P.A. Structural analysis of two wheeler handlebar. Int. J. Adv. Sci. 2014, 2, 2347–4289. [Google Scholar]
  7. Yoon, S.h.; Kwon, J.h.; Kim, C. Implementation of a body weight distribution measurement system applicable to static bicycle fitting. J. Sens. Sci. Technol. 2018, 27, 242–248. [Google Scholar]
  8. Jeong, S.; Park, S.; Choi, D.; Yoon, G.H. Development of topology optimization method considering static failure theories of ductile and brittle materials. In Proceedings of the KSME 2011 Fall Annual Conference, Daegu, Korea, 2–4 November 2011; pp. 531–535. [Google Scholar]
  9. Ehrgott, M. Vilfredo Pareto and multi-objective optimization. Doc. Math. 2012, 447–453. [Google Scholar]
  10. Zgheib, W.A.; Barbar, A.M. A study using support vector machines to classify the sentiments of tweets. Int. J. Comput. Appl. 2017, 170, 8–12. [Google Scholar]
  11. Drucker, H.; Burges, C.J.C.; Kaufman, L.; Smola, A.; Vapnik, V. Support vector regression machines. Adv. Neural Inf. Process. Syst. 1997, 9, 155–161. [Google Scholar]
  12. Vapnik, V. Three remarks on the support vector method of function estimation. In Advances in Kernel Methods; MIT Press: Cambridge, MA, USA, 1999; pp. 25–41. [Google Scholar]
  13. Sci-Kit-Learn. 2020. Available online: https://scikit-learn.org/stable/auto_examples/svm/plot_svm_regression (accessed on 29 December 2021).
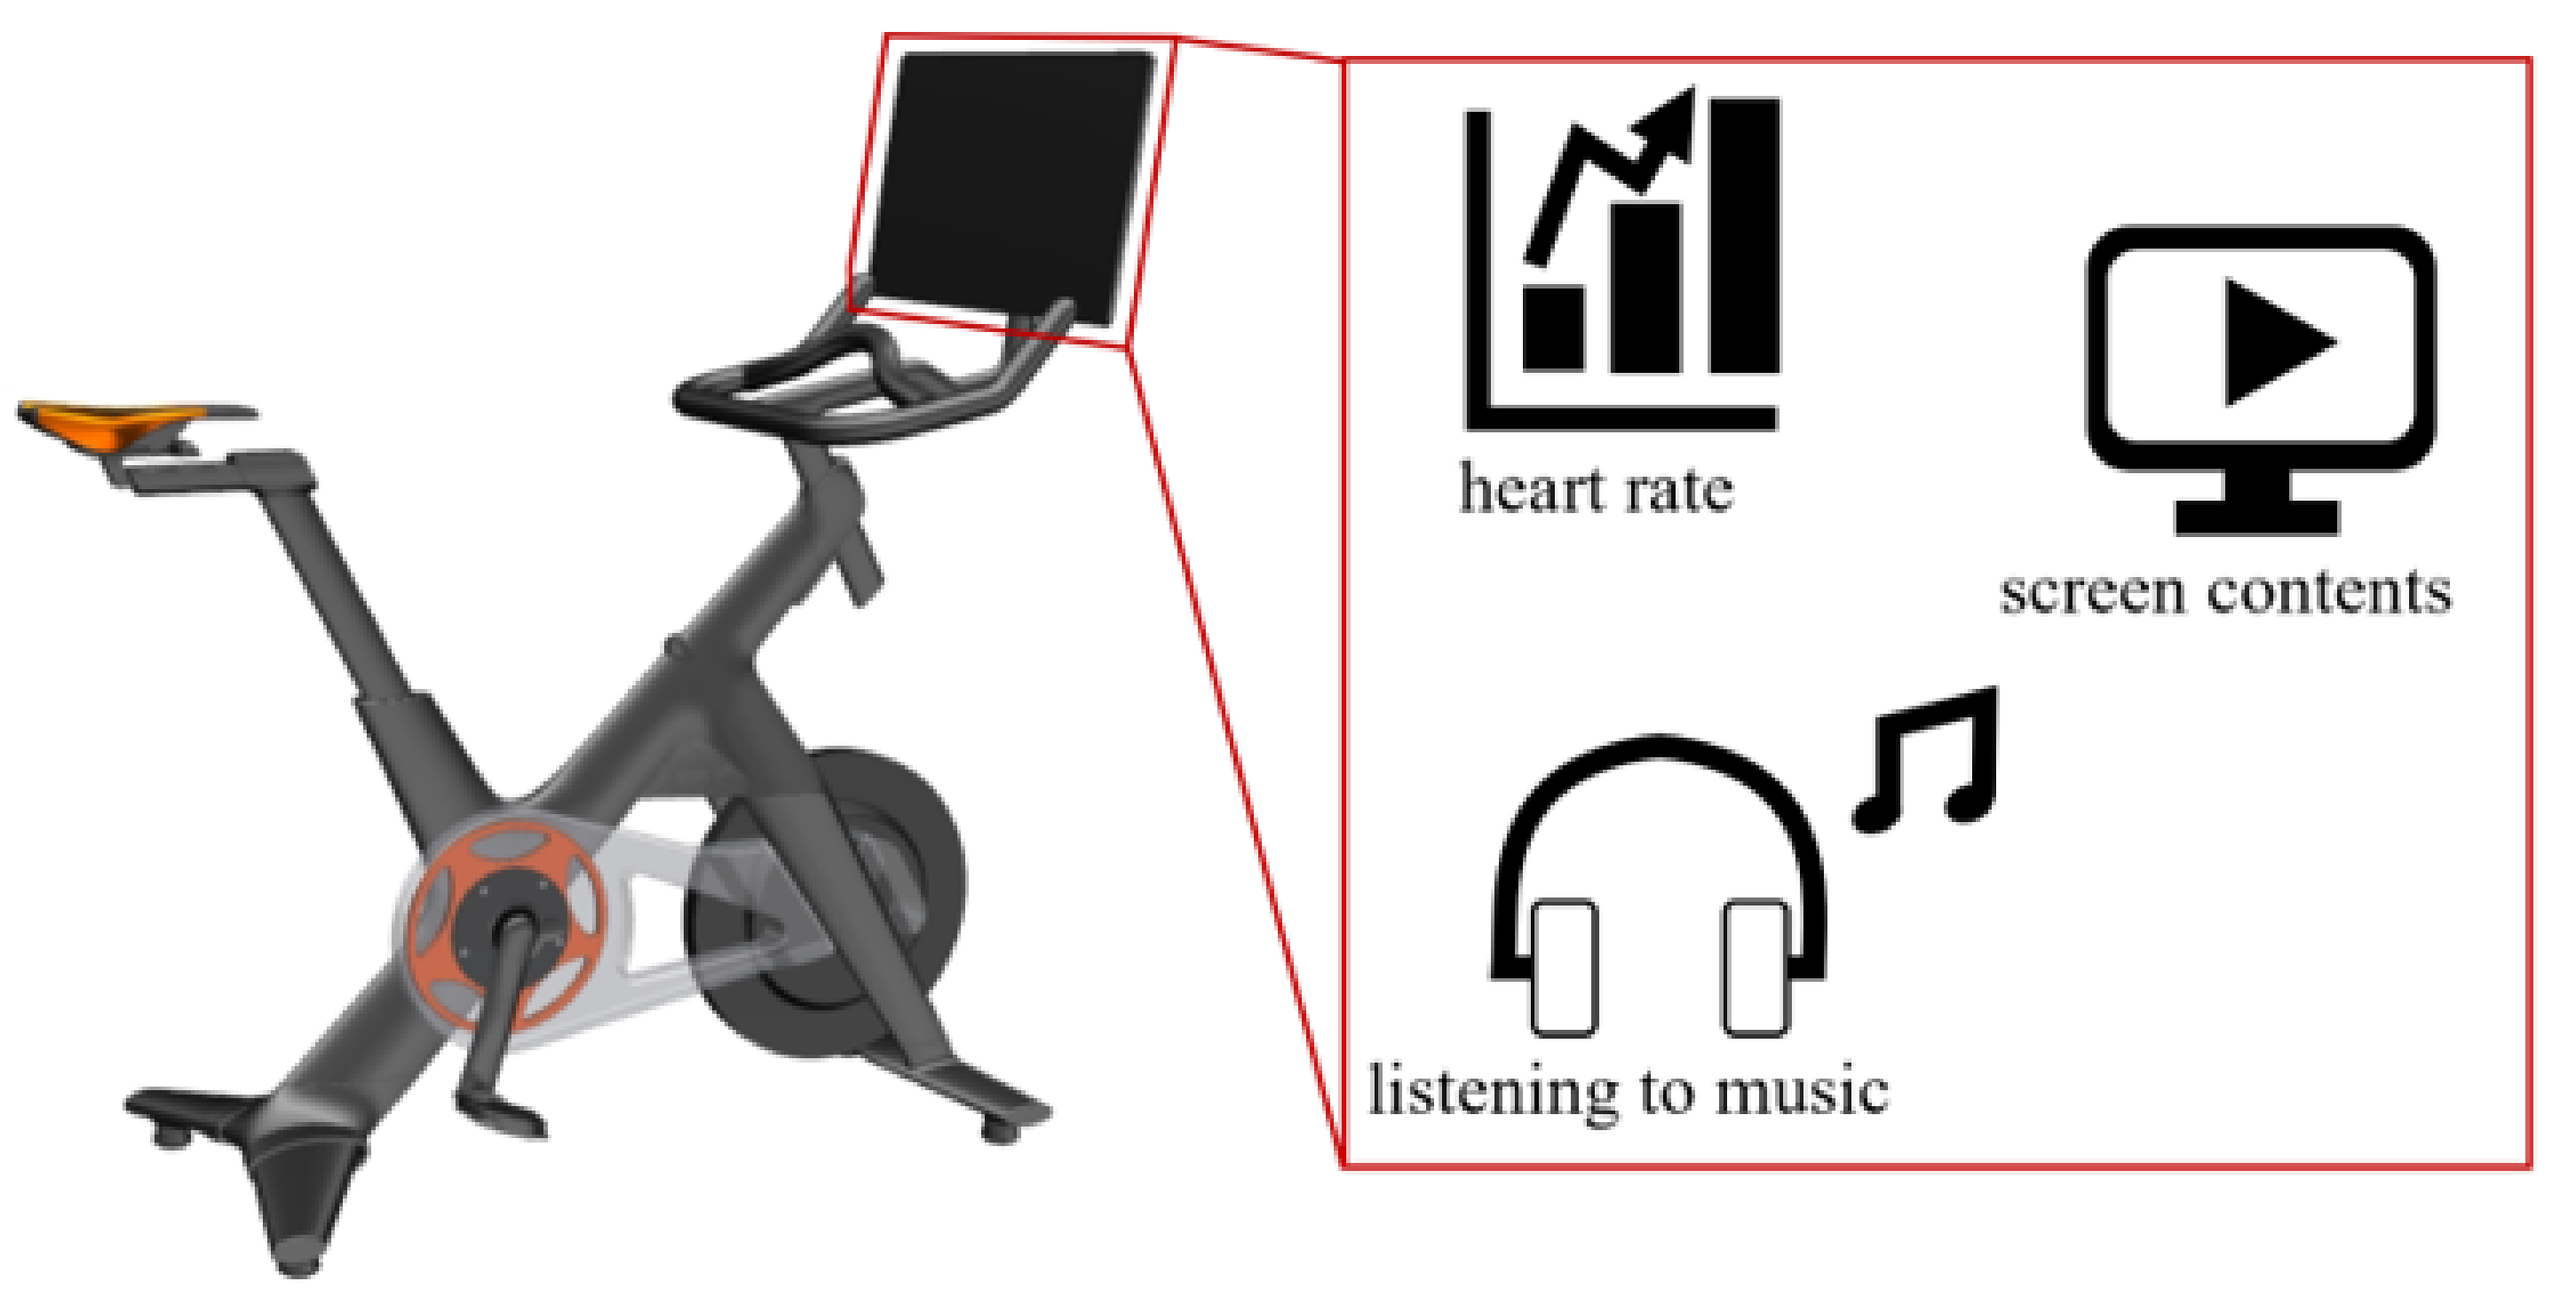
Figure 1. Indoor exercise bike and treadmill.
Applsci 12 02999 g001
Figure 2. Flowchart for optimal design of bicycle handle.
Applsci 12 02999 g002
Figure 3. Indoor exercise bike and detailed handle section.
Applsci 12 02999 g003
Figure 4. Boundary conditions and four different loading cases.
Applsci 12 02999 g004
Figure 5. Boundary conditions and four different loading cases.
Applsci 12 02999 g005
Figure 6. Design variables of the bicycle handle section.
Applsci 12 02999 g006
Figure 7. Sensitivity analysis results.
Applsci 12 02999 g007
Figure 8. Design variables of the correlation analysis.
Applsci 12 02999 g008
Figure 9. Concept of support vector regression.
Applsci 12 02999 g009
Figure 10. Data normalization results.
Applsci 12 02999 g010
Table 1. Material properties for FEA.
Mechanical PropertiesValue
FEA Material ModelsIsotropic Linear
Young’s Modulus [MPa]71,000
Poisson’s Ratio [-]0.33
Tensile Ultimate Strength [MPa]310
Tensile Yield Strength [MPa]280
Table 2. Design problem formulation.
Design Variablesx1, x2, x3, x4, x5
objective functionsminimize f(x) = ABS (equivalent stress)
constraints120° ≤ x1 ≤ 180°
90° ≤ x2 ≤ 130°
30 mm ≤ x3
0 mm ≤ x4 ≤ 100 mm
contact of stem and support fixture frame
Table 3. Parameter range values of C, ε, γ.
C 1
10
100
ε 1
10
100
γ 1
10
100
Table 4. Results of SVR.
C ε γ R2MSE
10.0010.010.7746181108.673
0.10.952339234.4494
10.972326136.1297
0.010.010.7736691113.338
0.10.952469233.8078
10.972222136.6425
0.10.010.7732671115.316
0.10.947284259.3131
10.962545184.2419
100.0010.010.892491528.8427
0.10.99098444.34811
10.9999990.005441
0.010.010.892264529.9624
0.10.99107143.92448
10.9999010.487326
0.10.010.888727547.3592
0.10.98952351.5357
10.99029847.7243
1000.0010.010.940883290.8004
0.10.9982678.526889
10.9999990.005441
0.010.010.941529287.6255
0.10.9985567.104295
10.9999010.487326
0.10.010.94643263.5146
0.10.99434627.81252
10.99029847.7243
Publisher’s Note: MDPI stays neutral with regard to jurisdictional claims in published maps and institutional affiliations.