
Experimental Study of 3D Concrete Printing Configurations Based on the Buildability Evaluation


 ,
,  and
and
Abstract
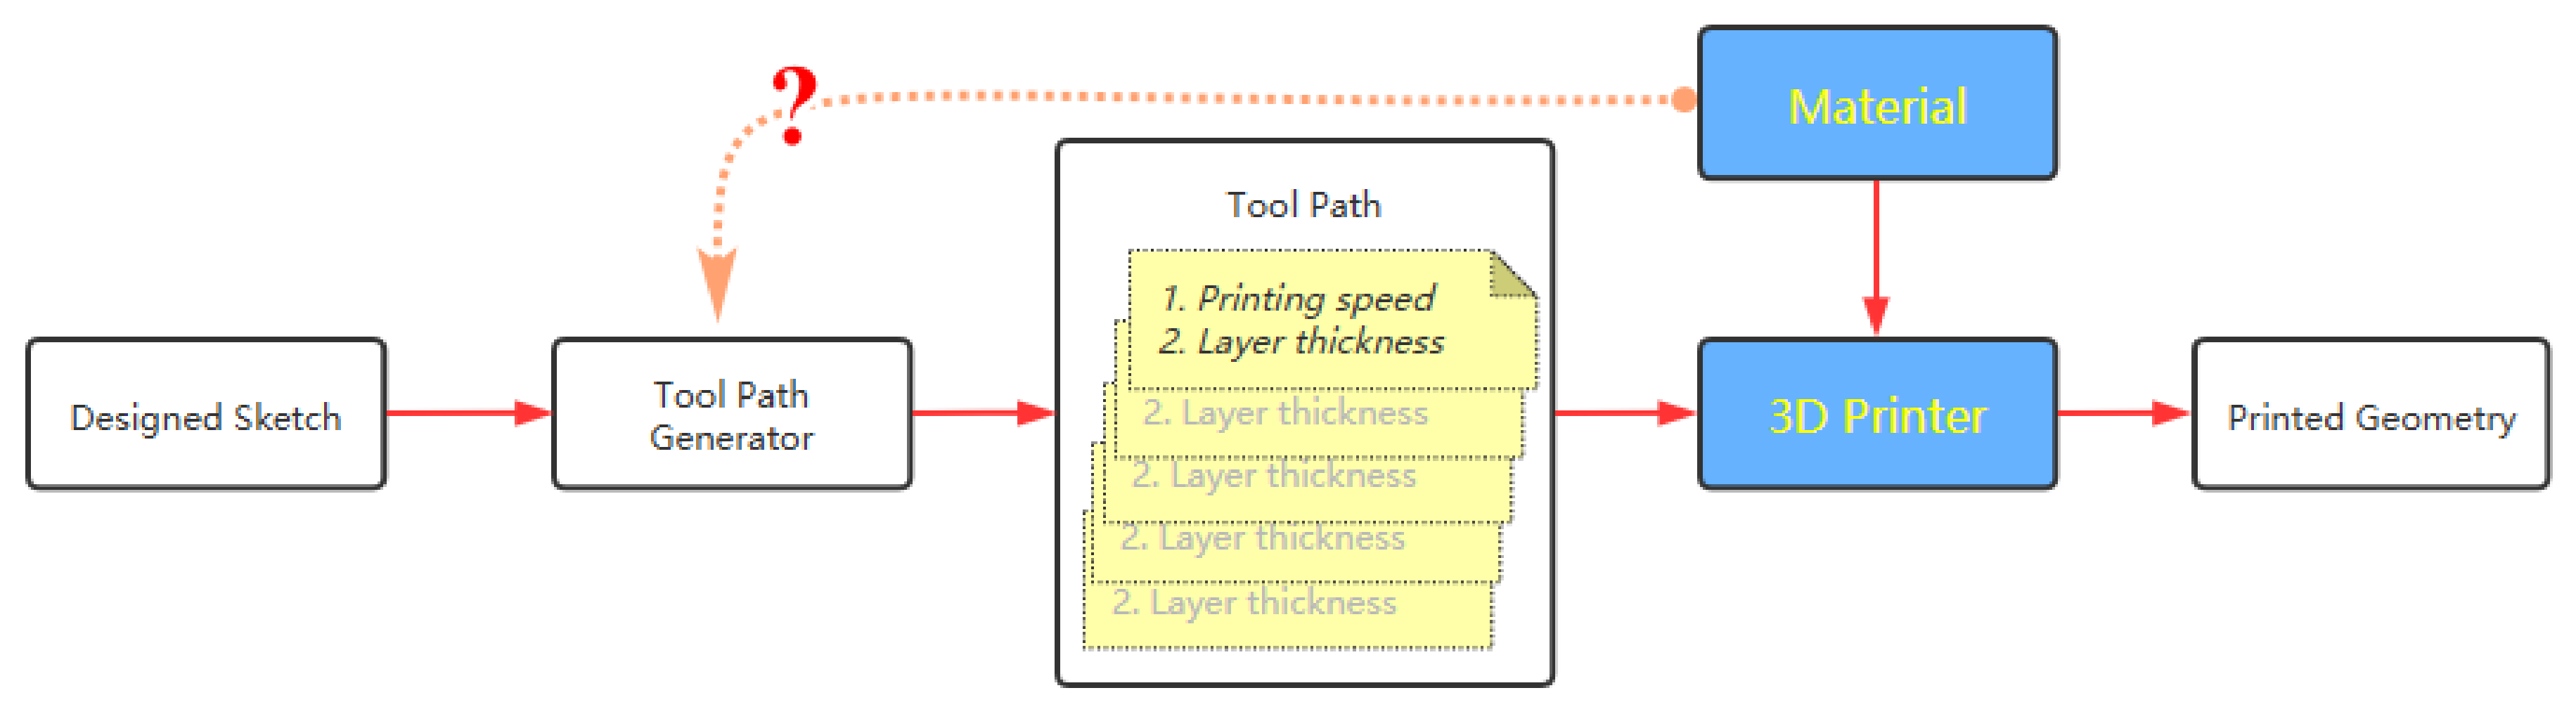
:1. Introduction
- Building index (BI): It evaluates the geometry-keeping ability. The BI can help determine the parameters for the material development and the printing configuration based on the printing scale and the material mix. The buildability can be quantified as the range of BI for one printable material;
- Height reduction test (HRT): This quantifies the slumping criteria of the printed filaments in terms of height reduction ratio (HRR) instead of the traditional slump test; and
- Leaning angle (LA): It is the angle between the vertical line and the filament-stacking direction to quantify the buildability of the material for printing complex geometry.
2. Materials and Equipment
2.1. Mix Proportion
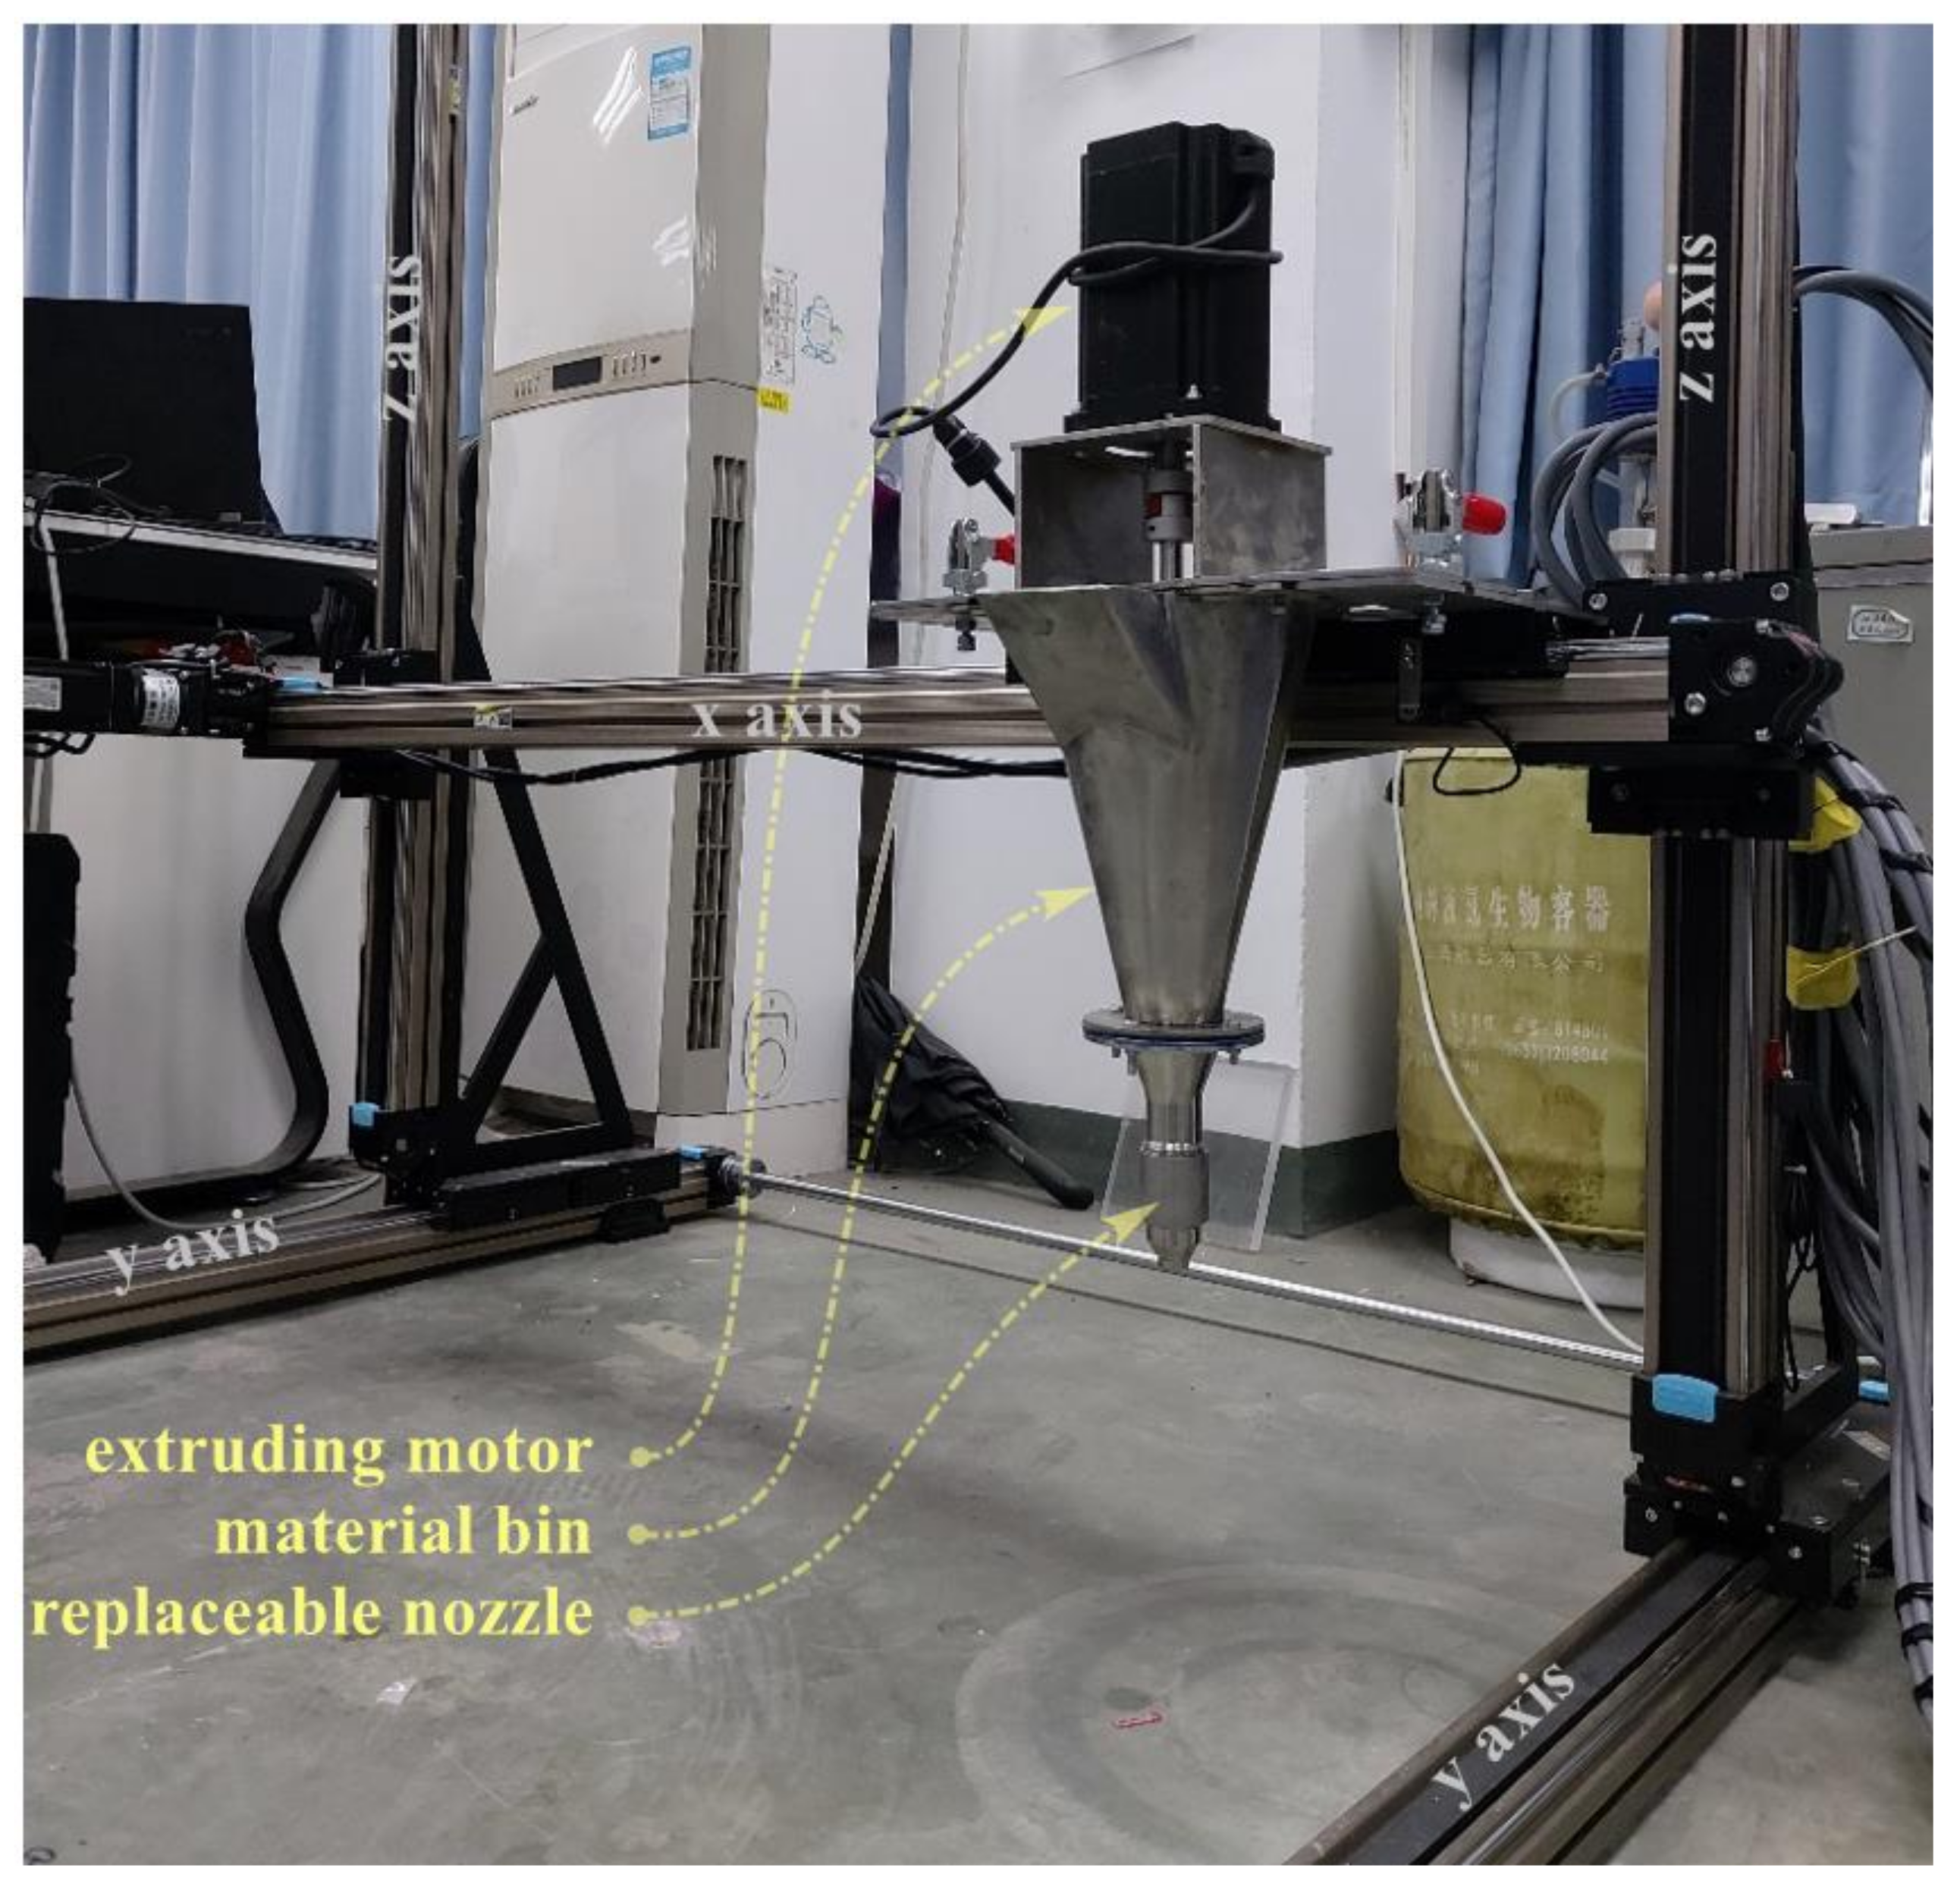
2.2. 3D Printer
3. Experimental Program
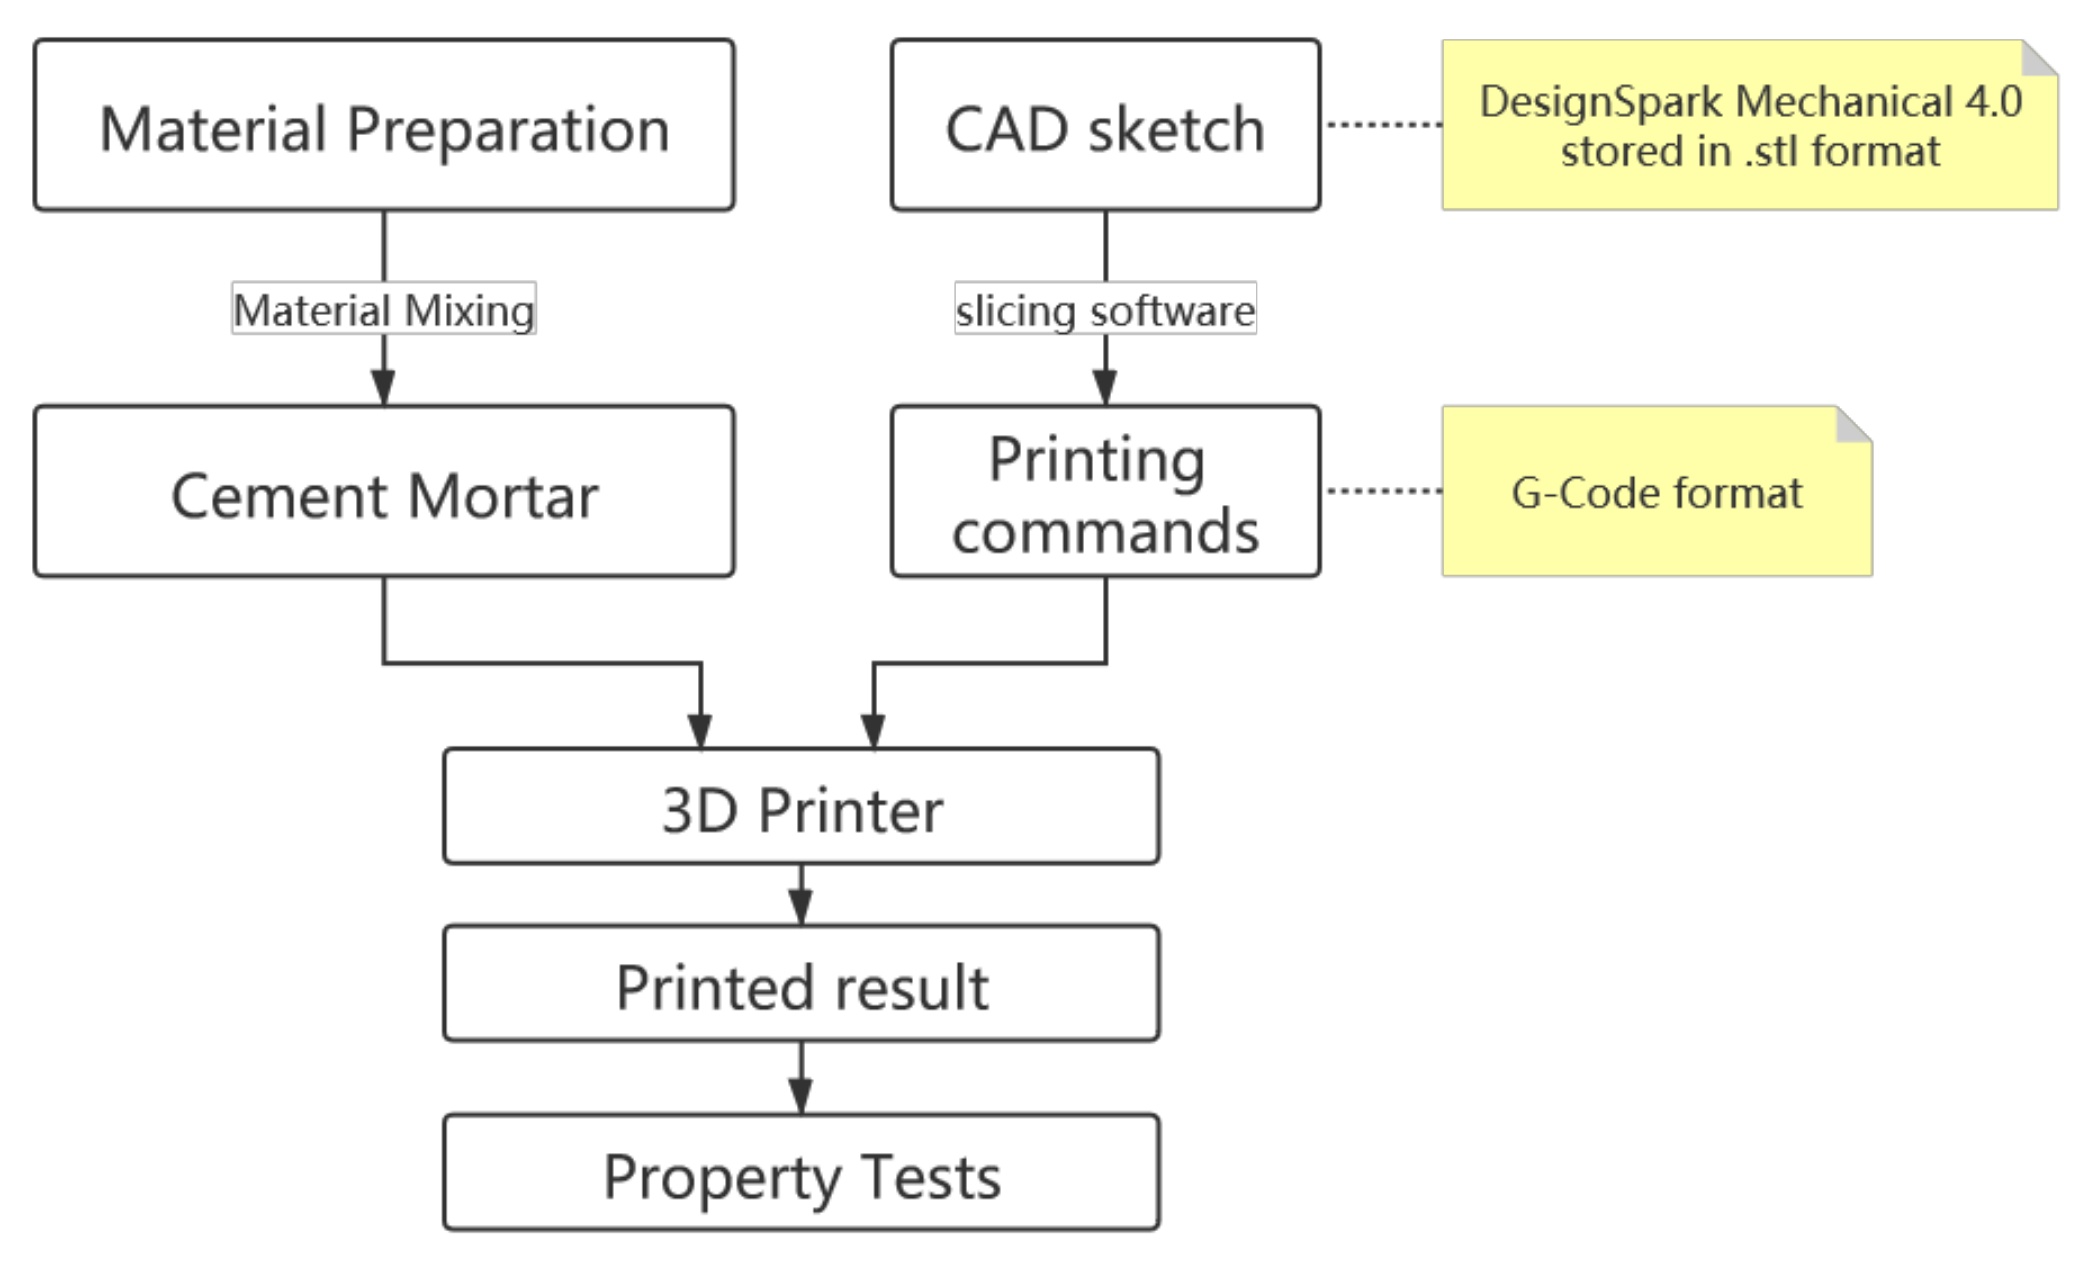
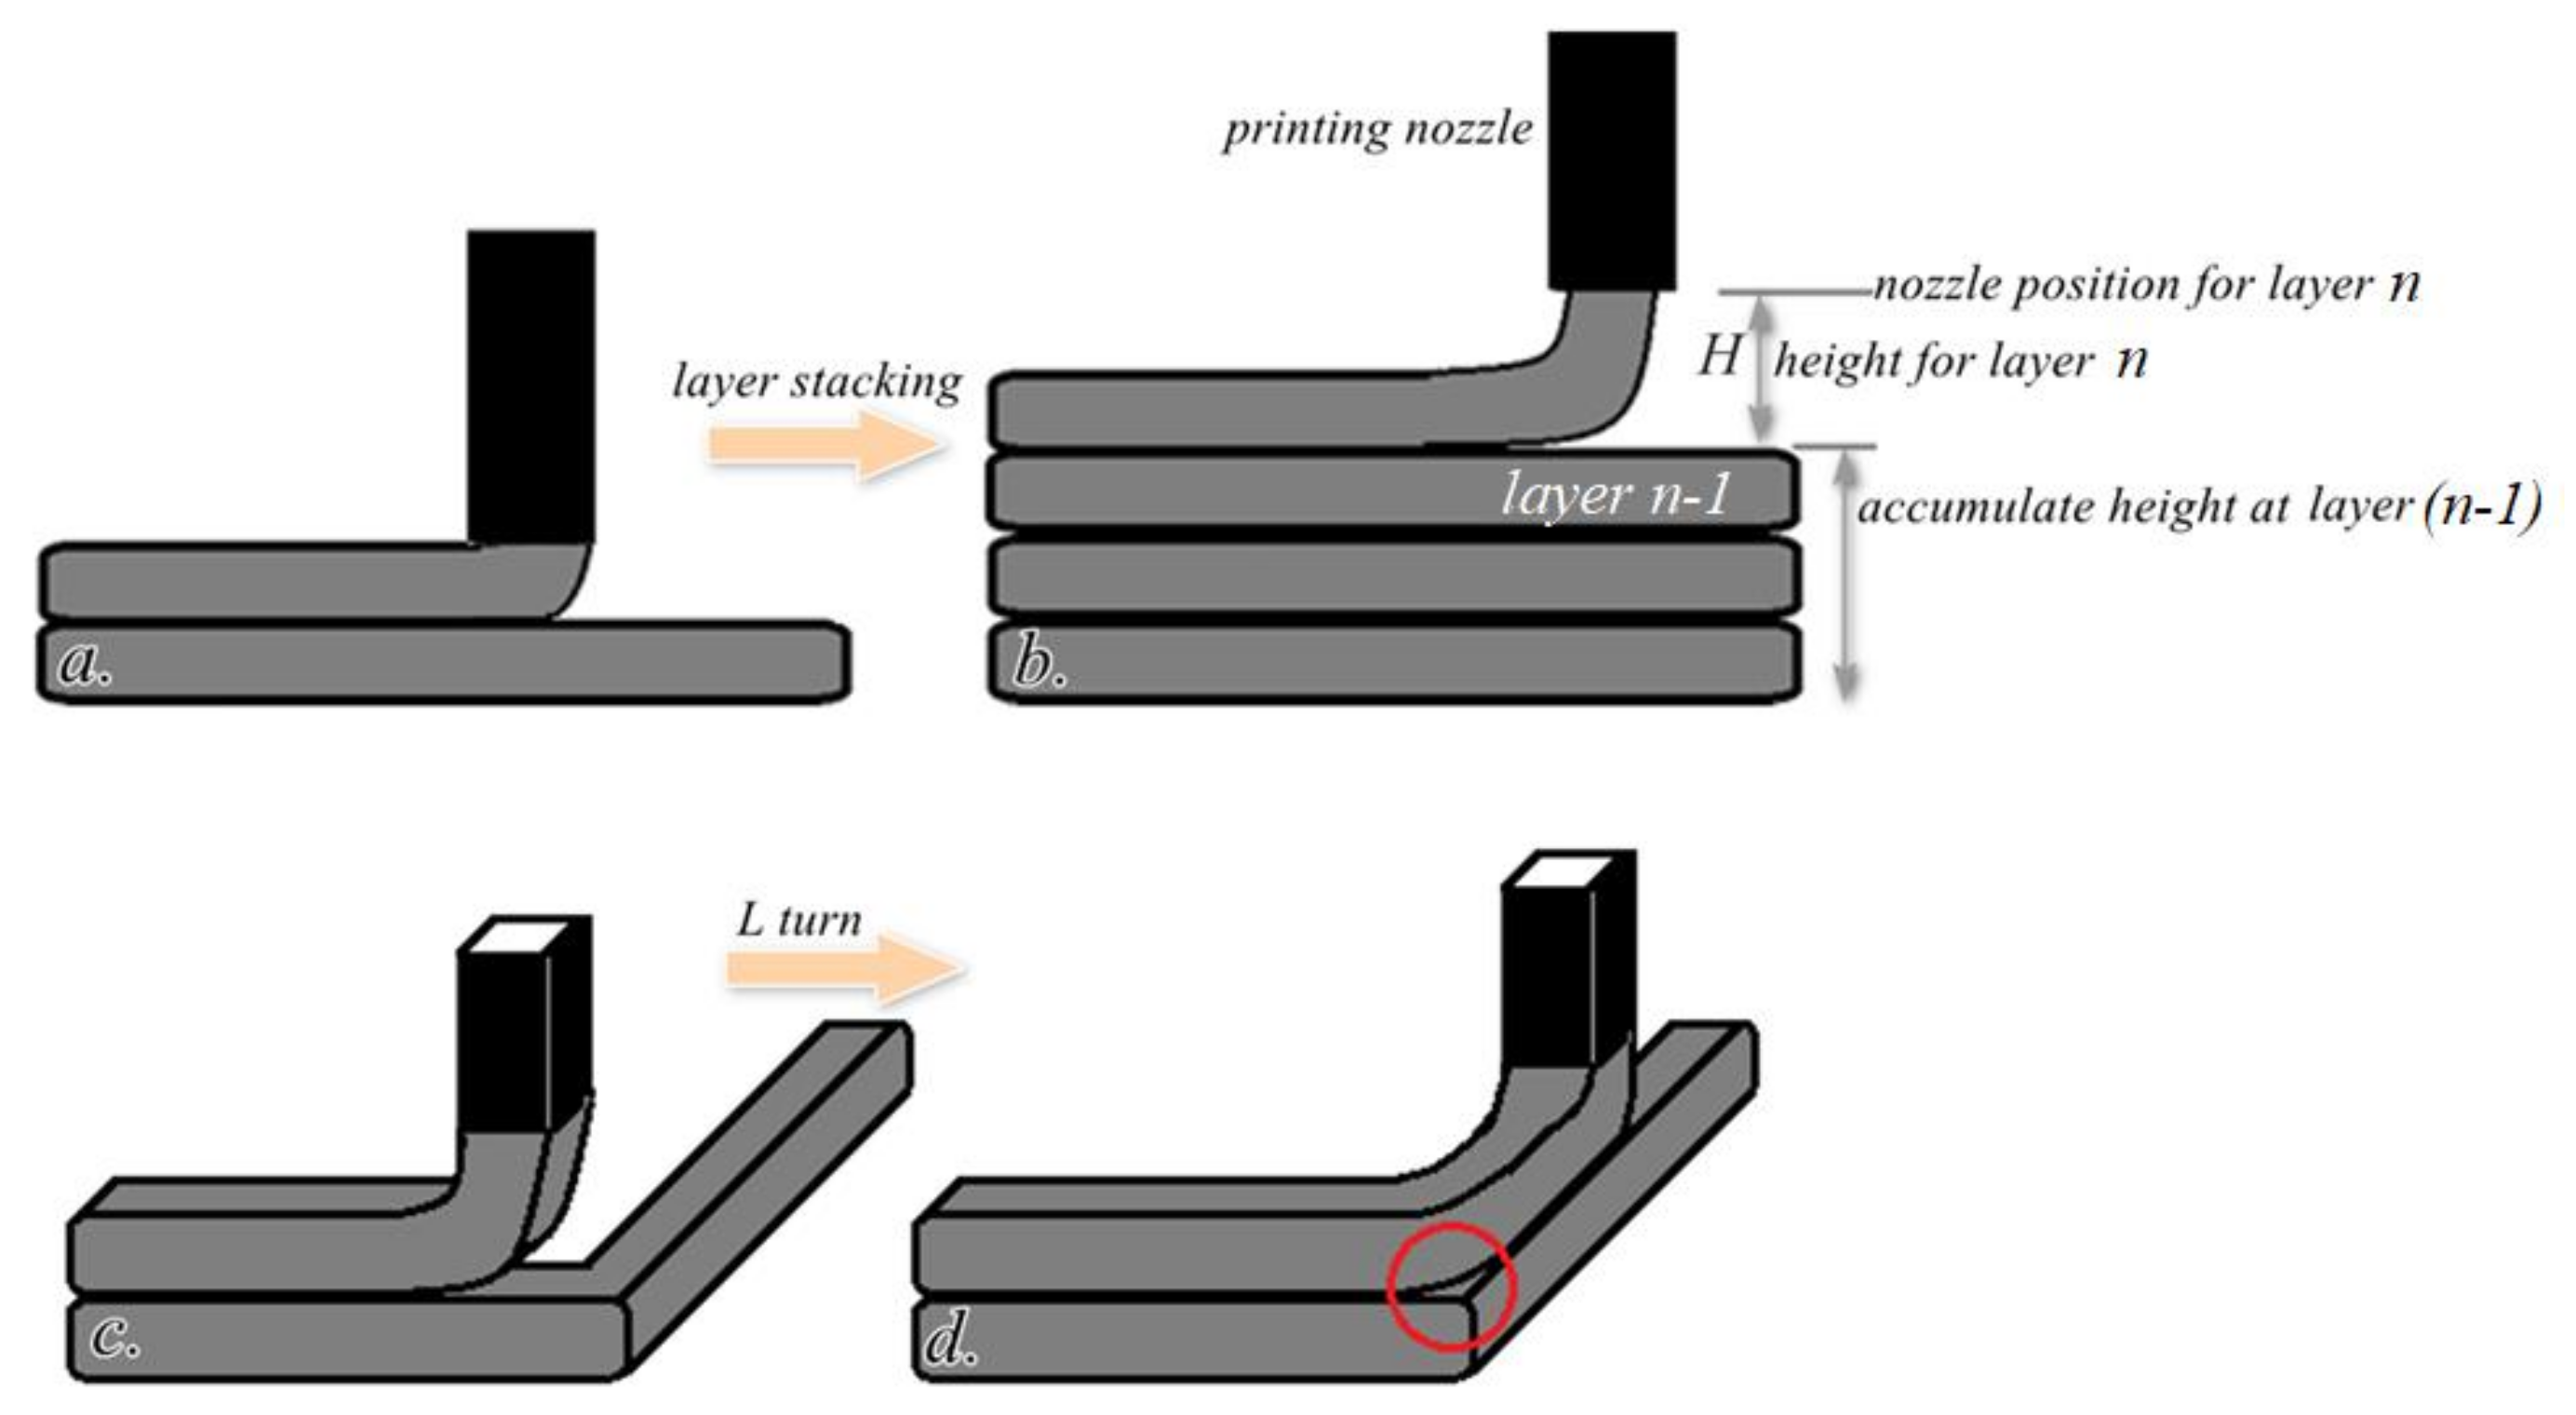
3.1. Printing Procedures
3.2. Basic Testing Methods
3.3. Configuring Methods
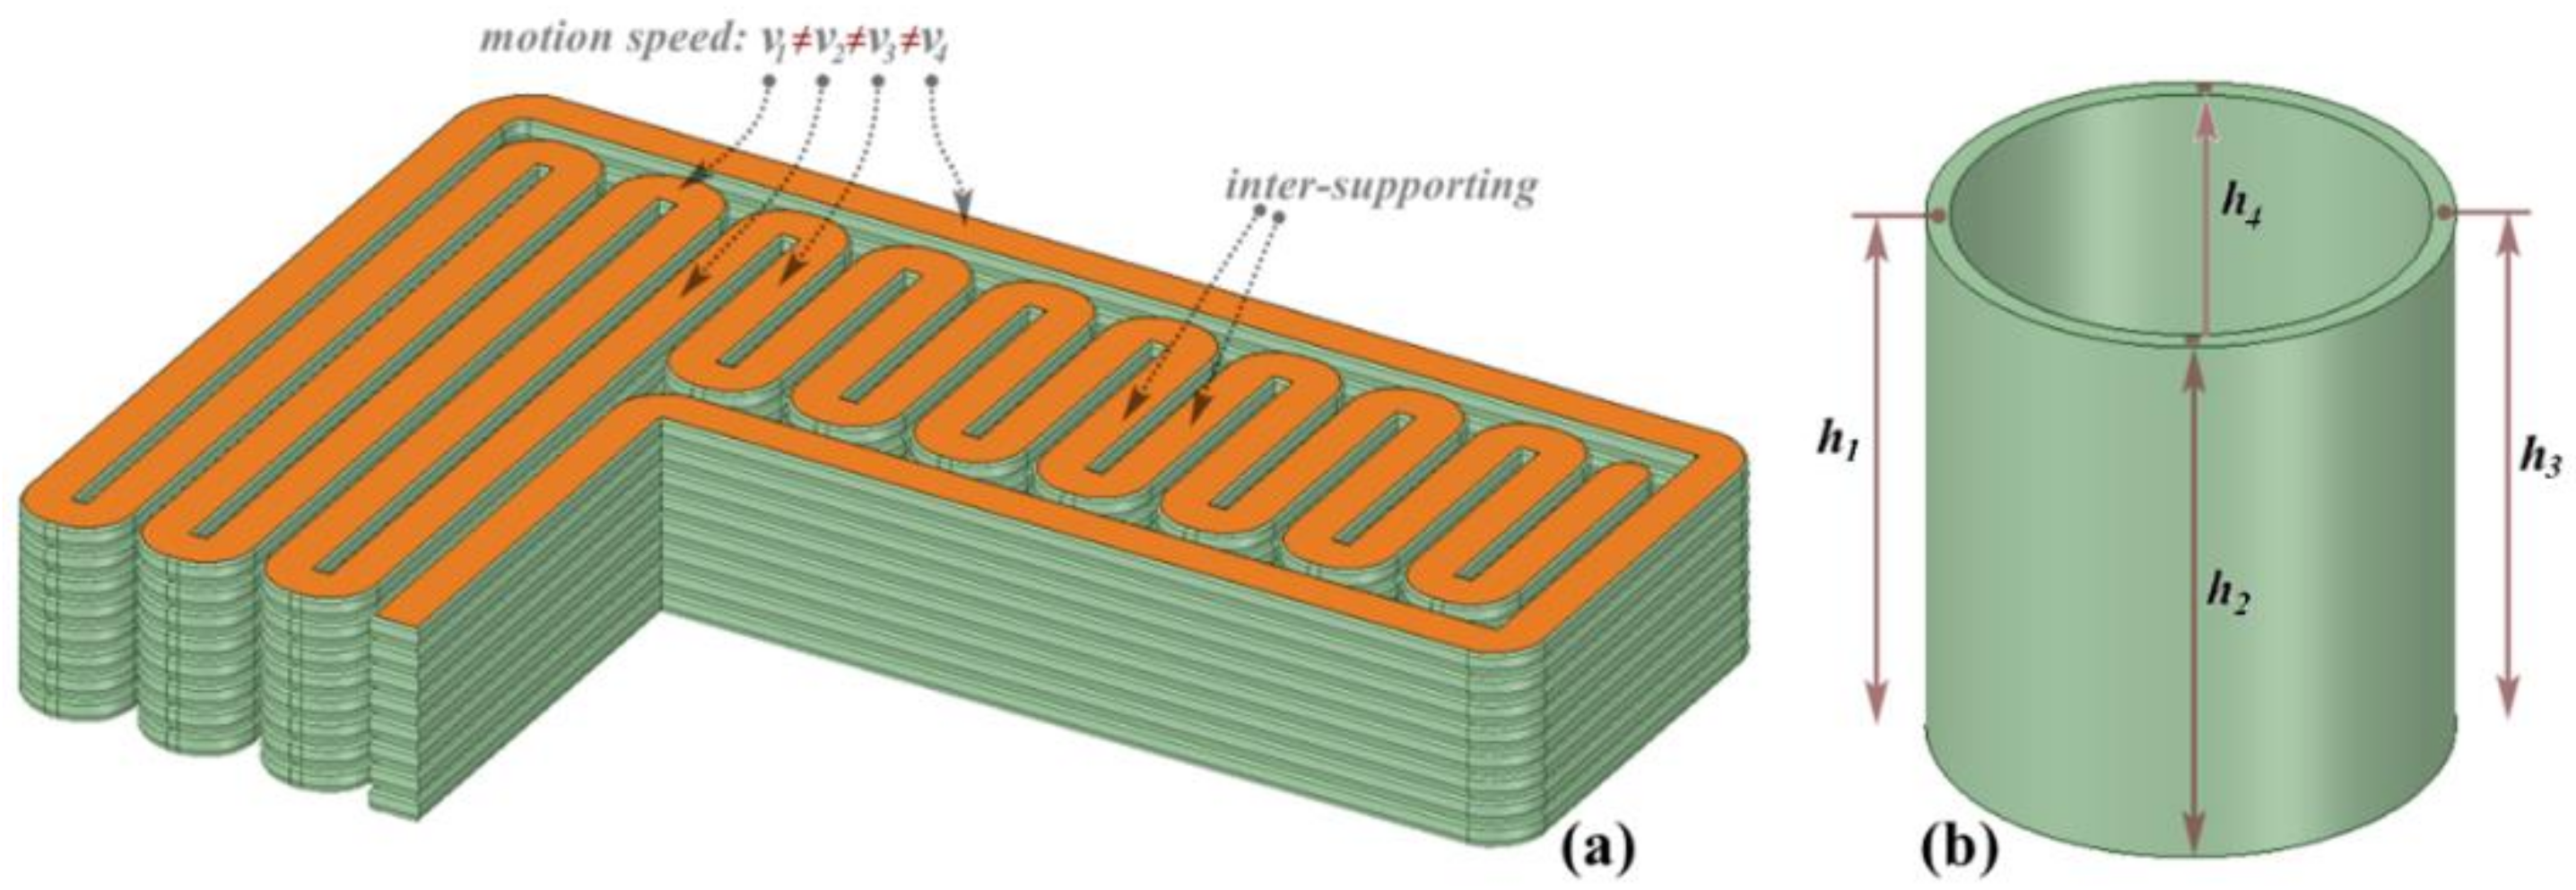
3.3.1. Building Index (BI)
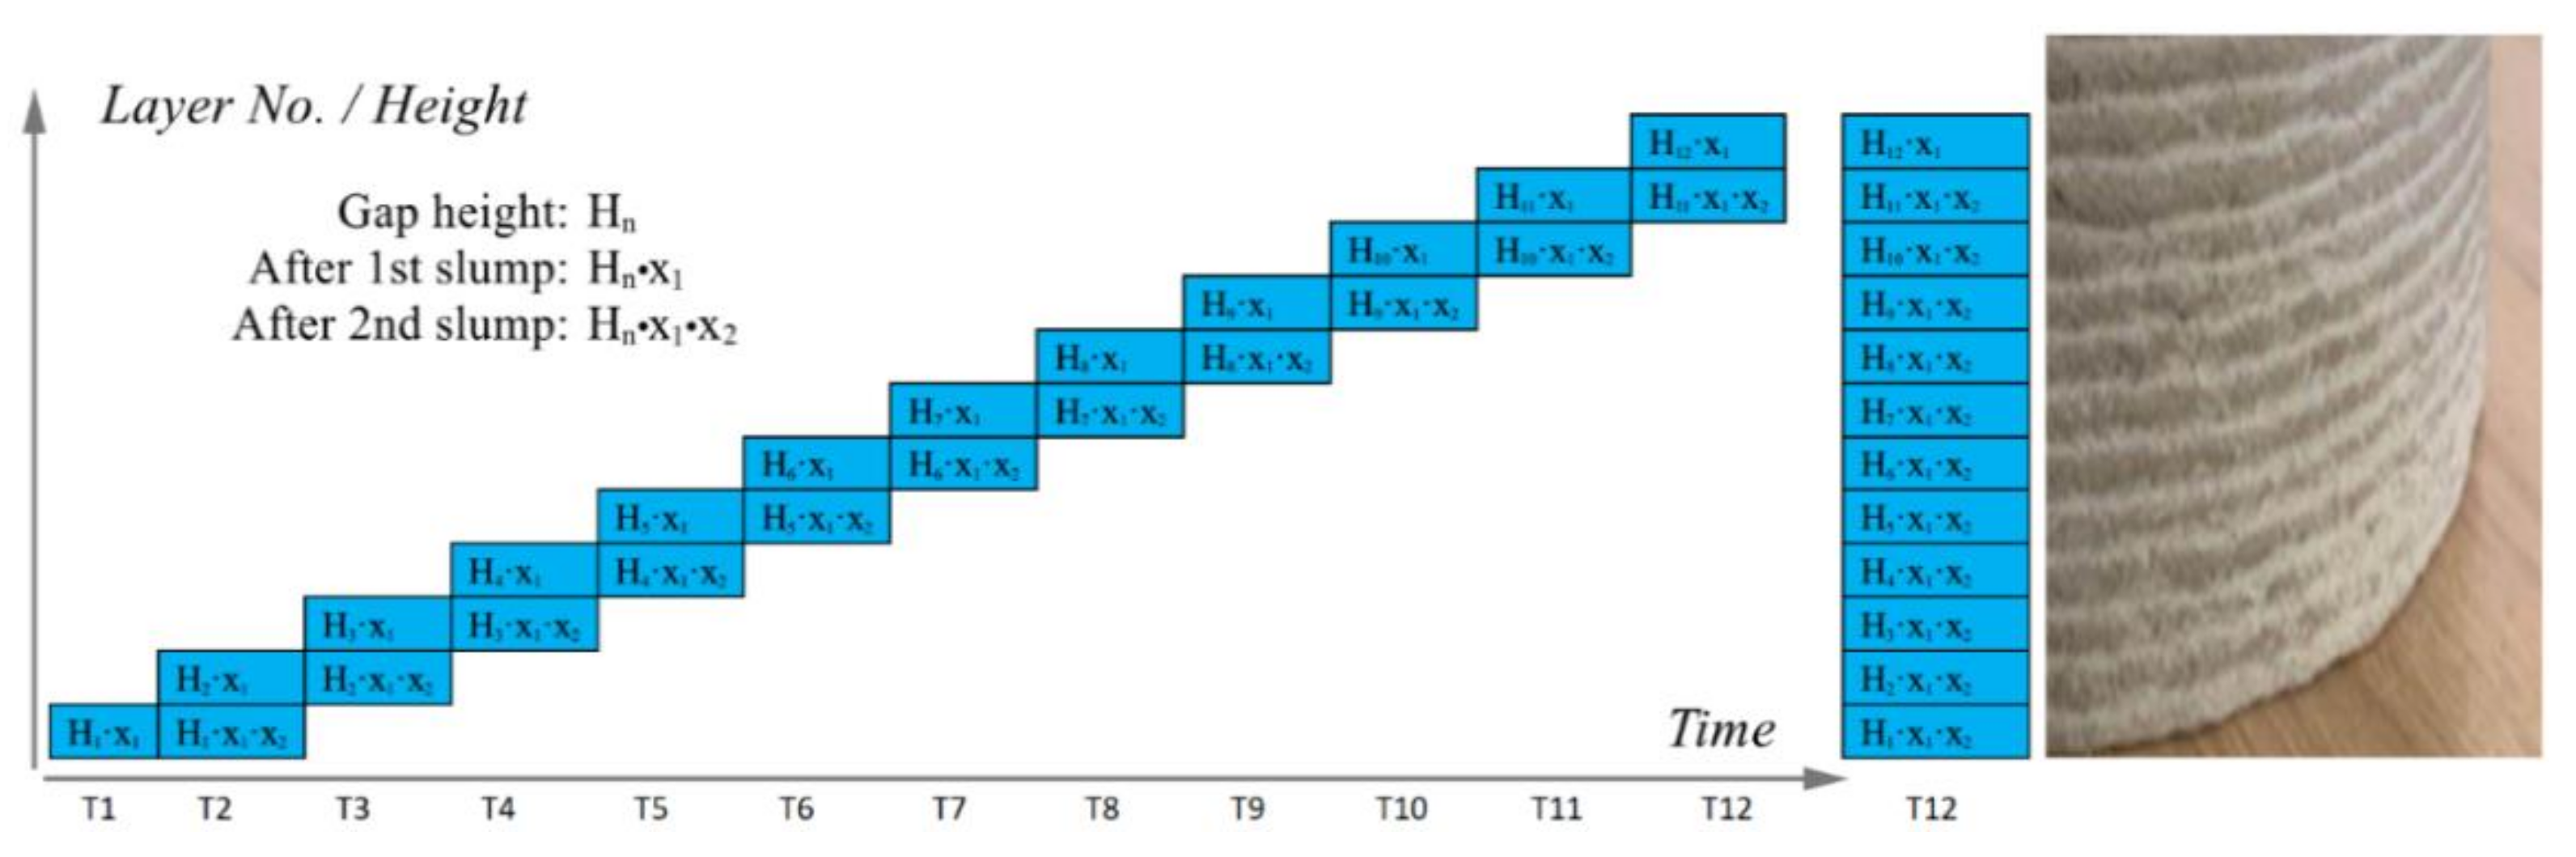
3.3.2. Height Reduction Test (HRT)
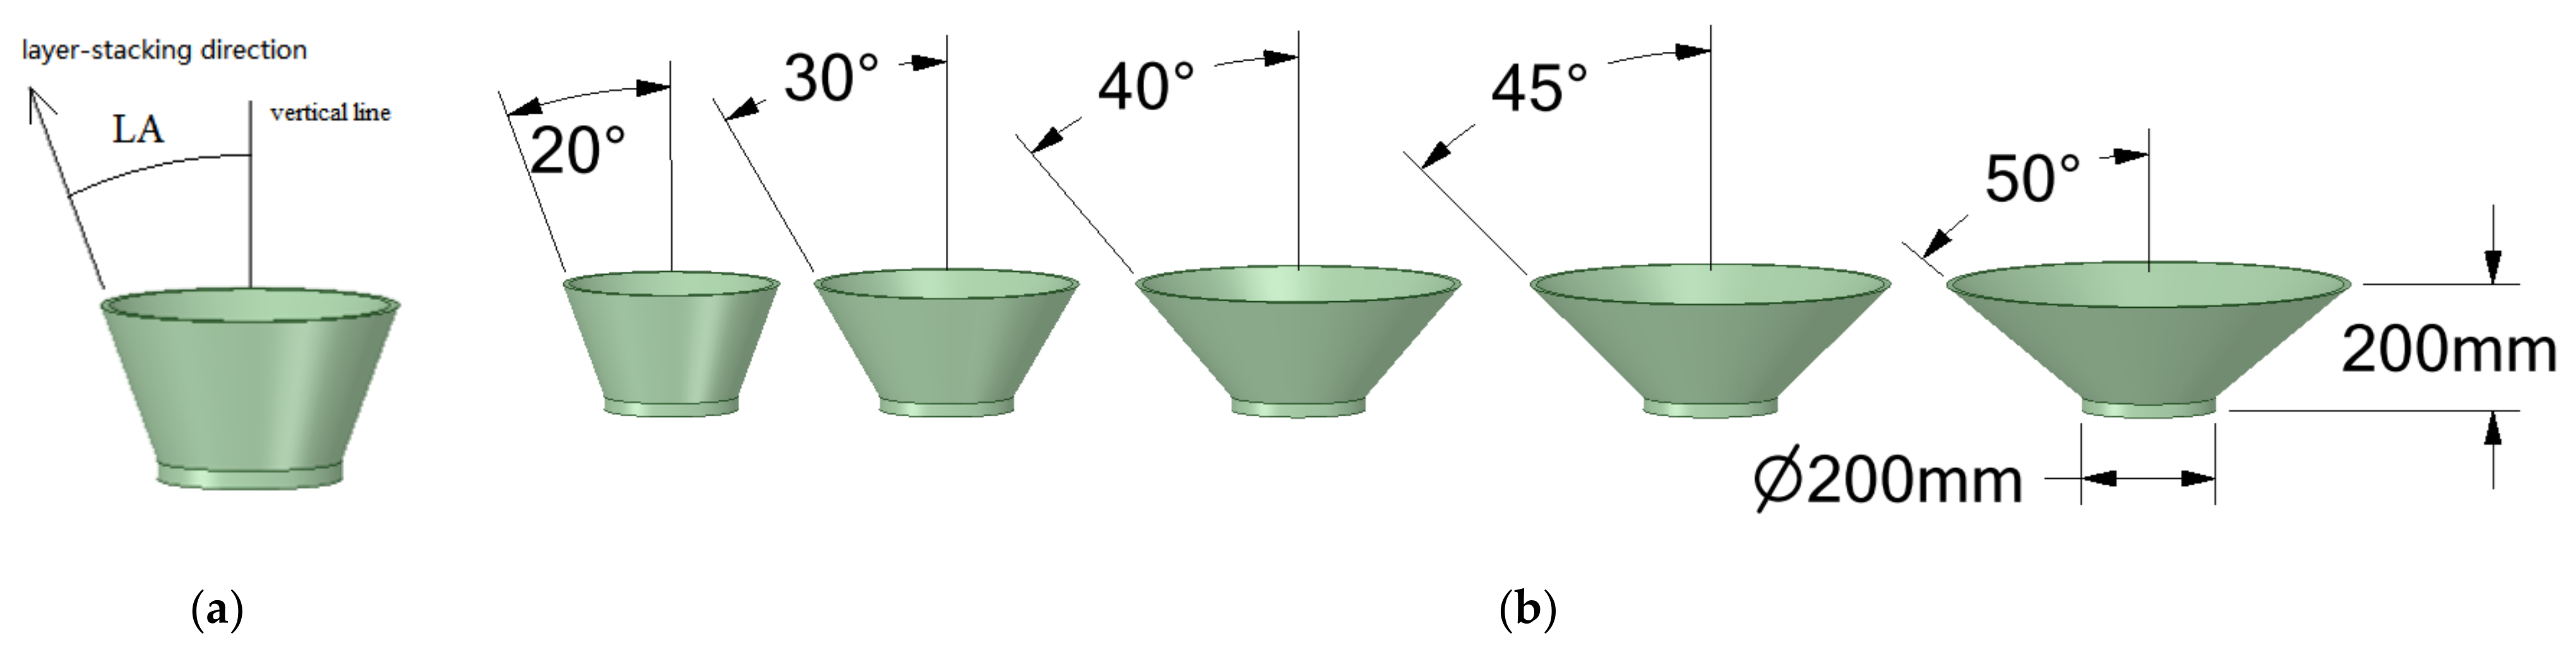
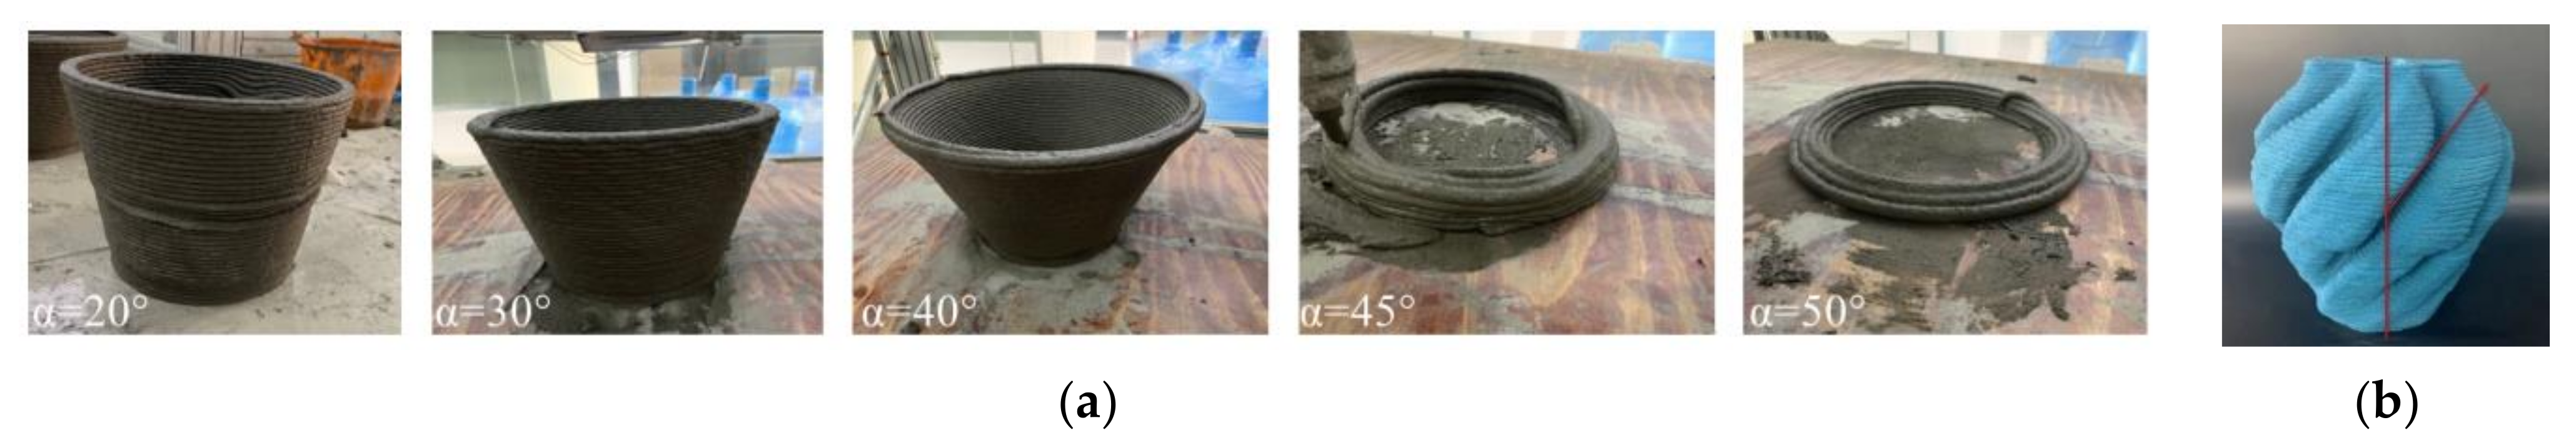
3.3.3. Leaning Angle (LA)
4. Results and Discussion
4.1. Basic Properties
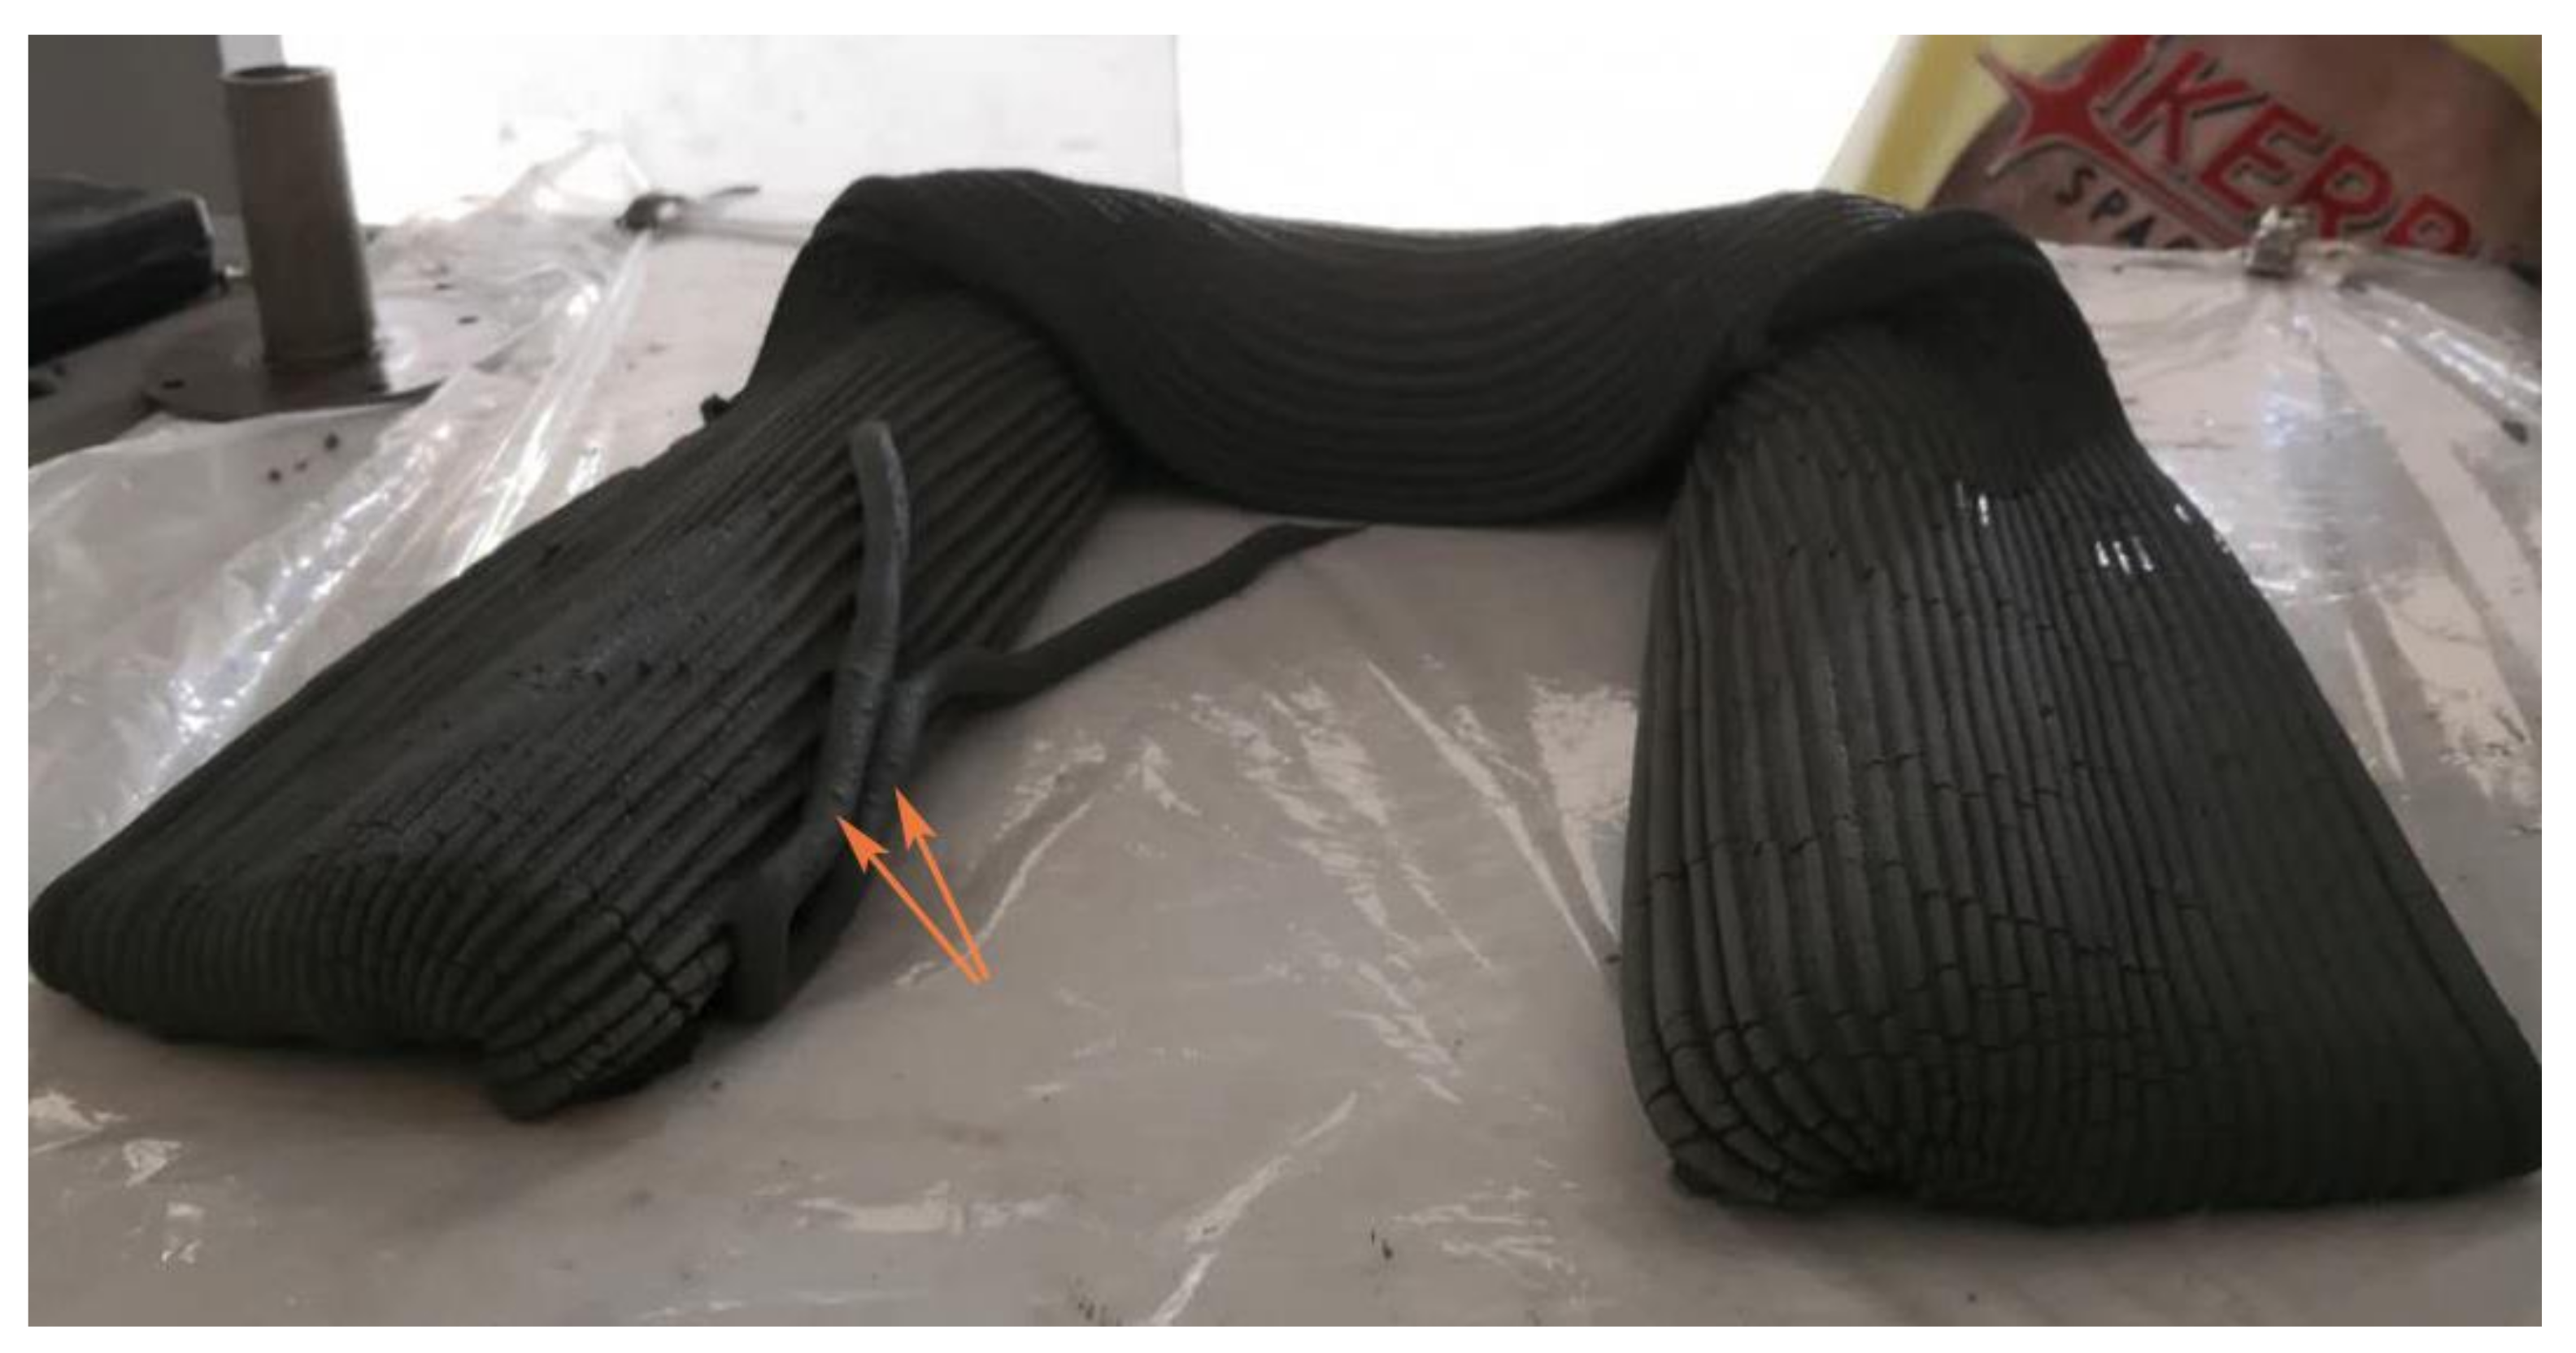
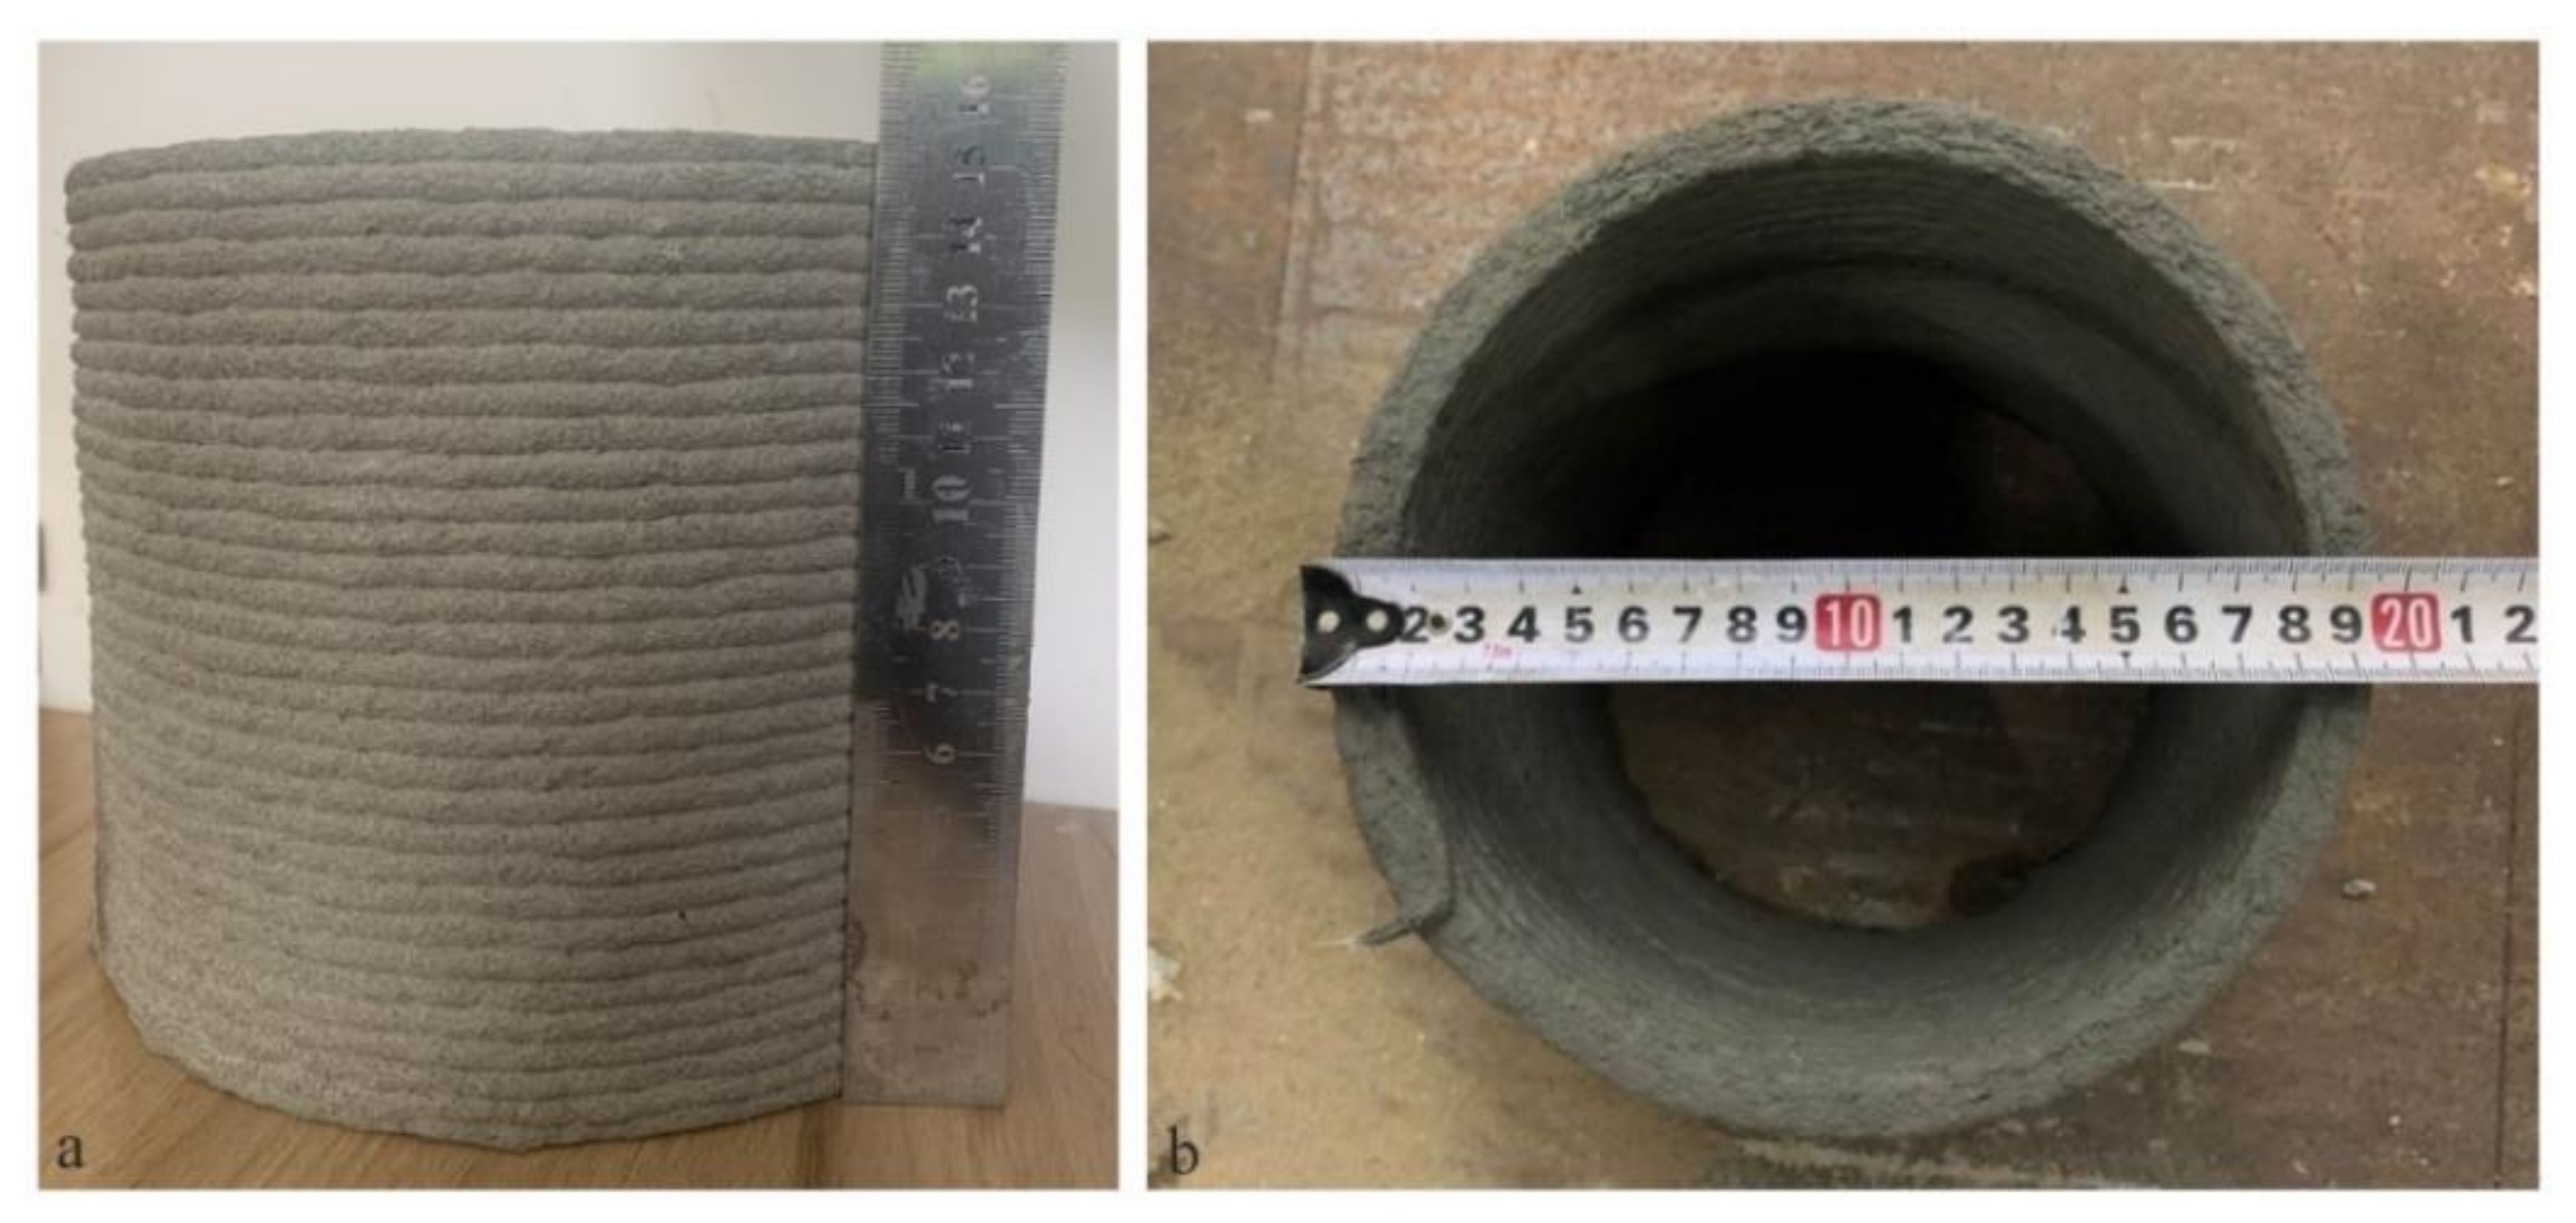
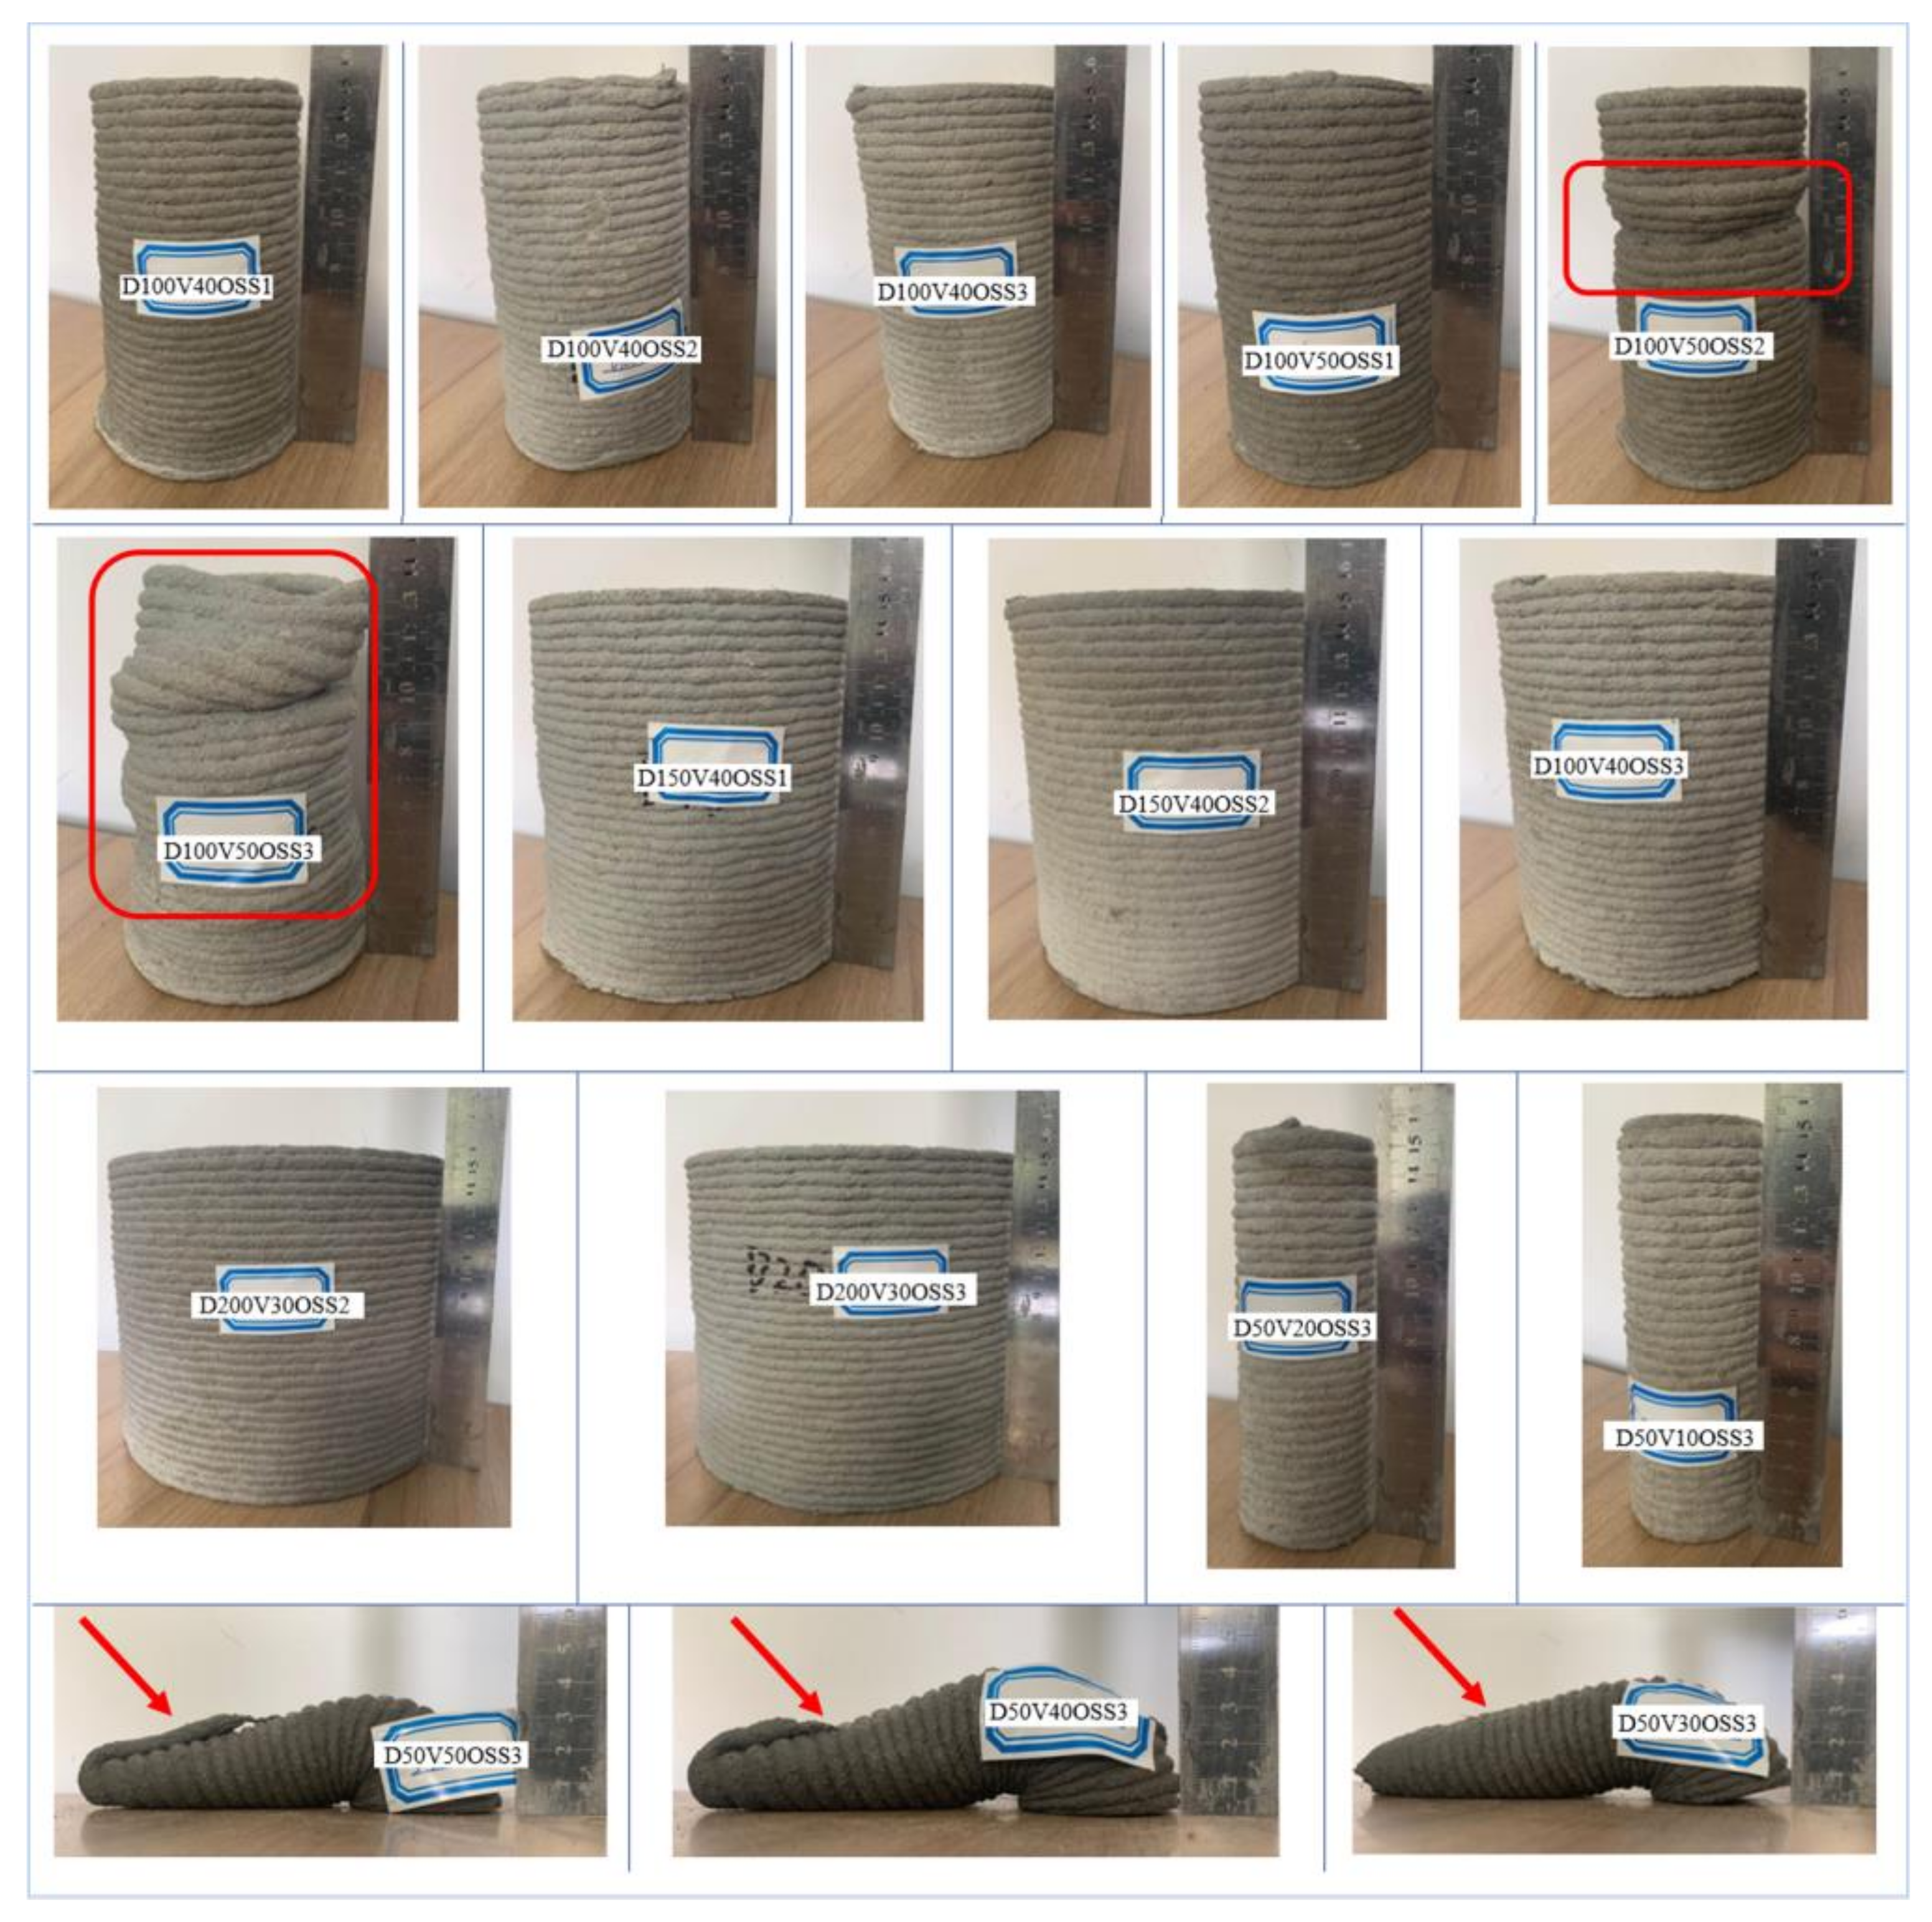
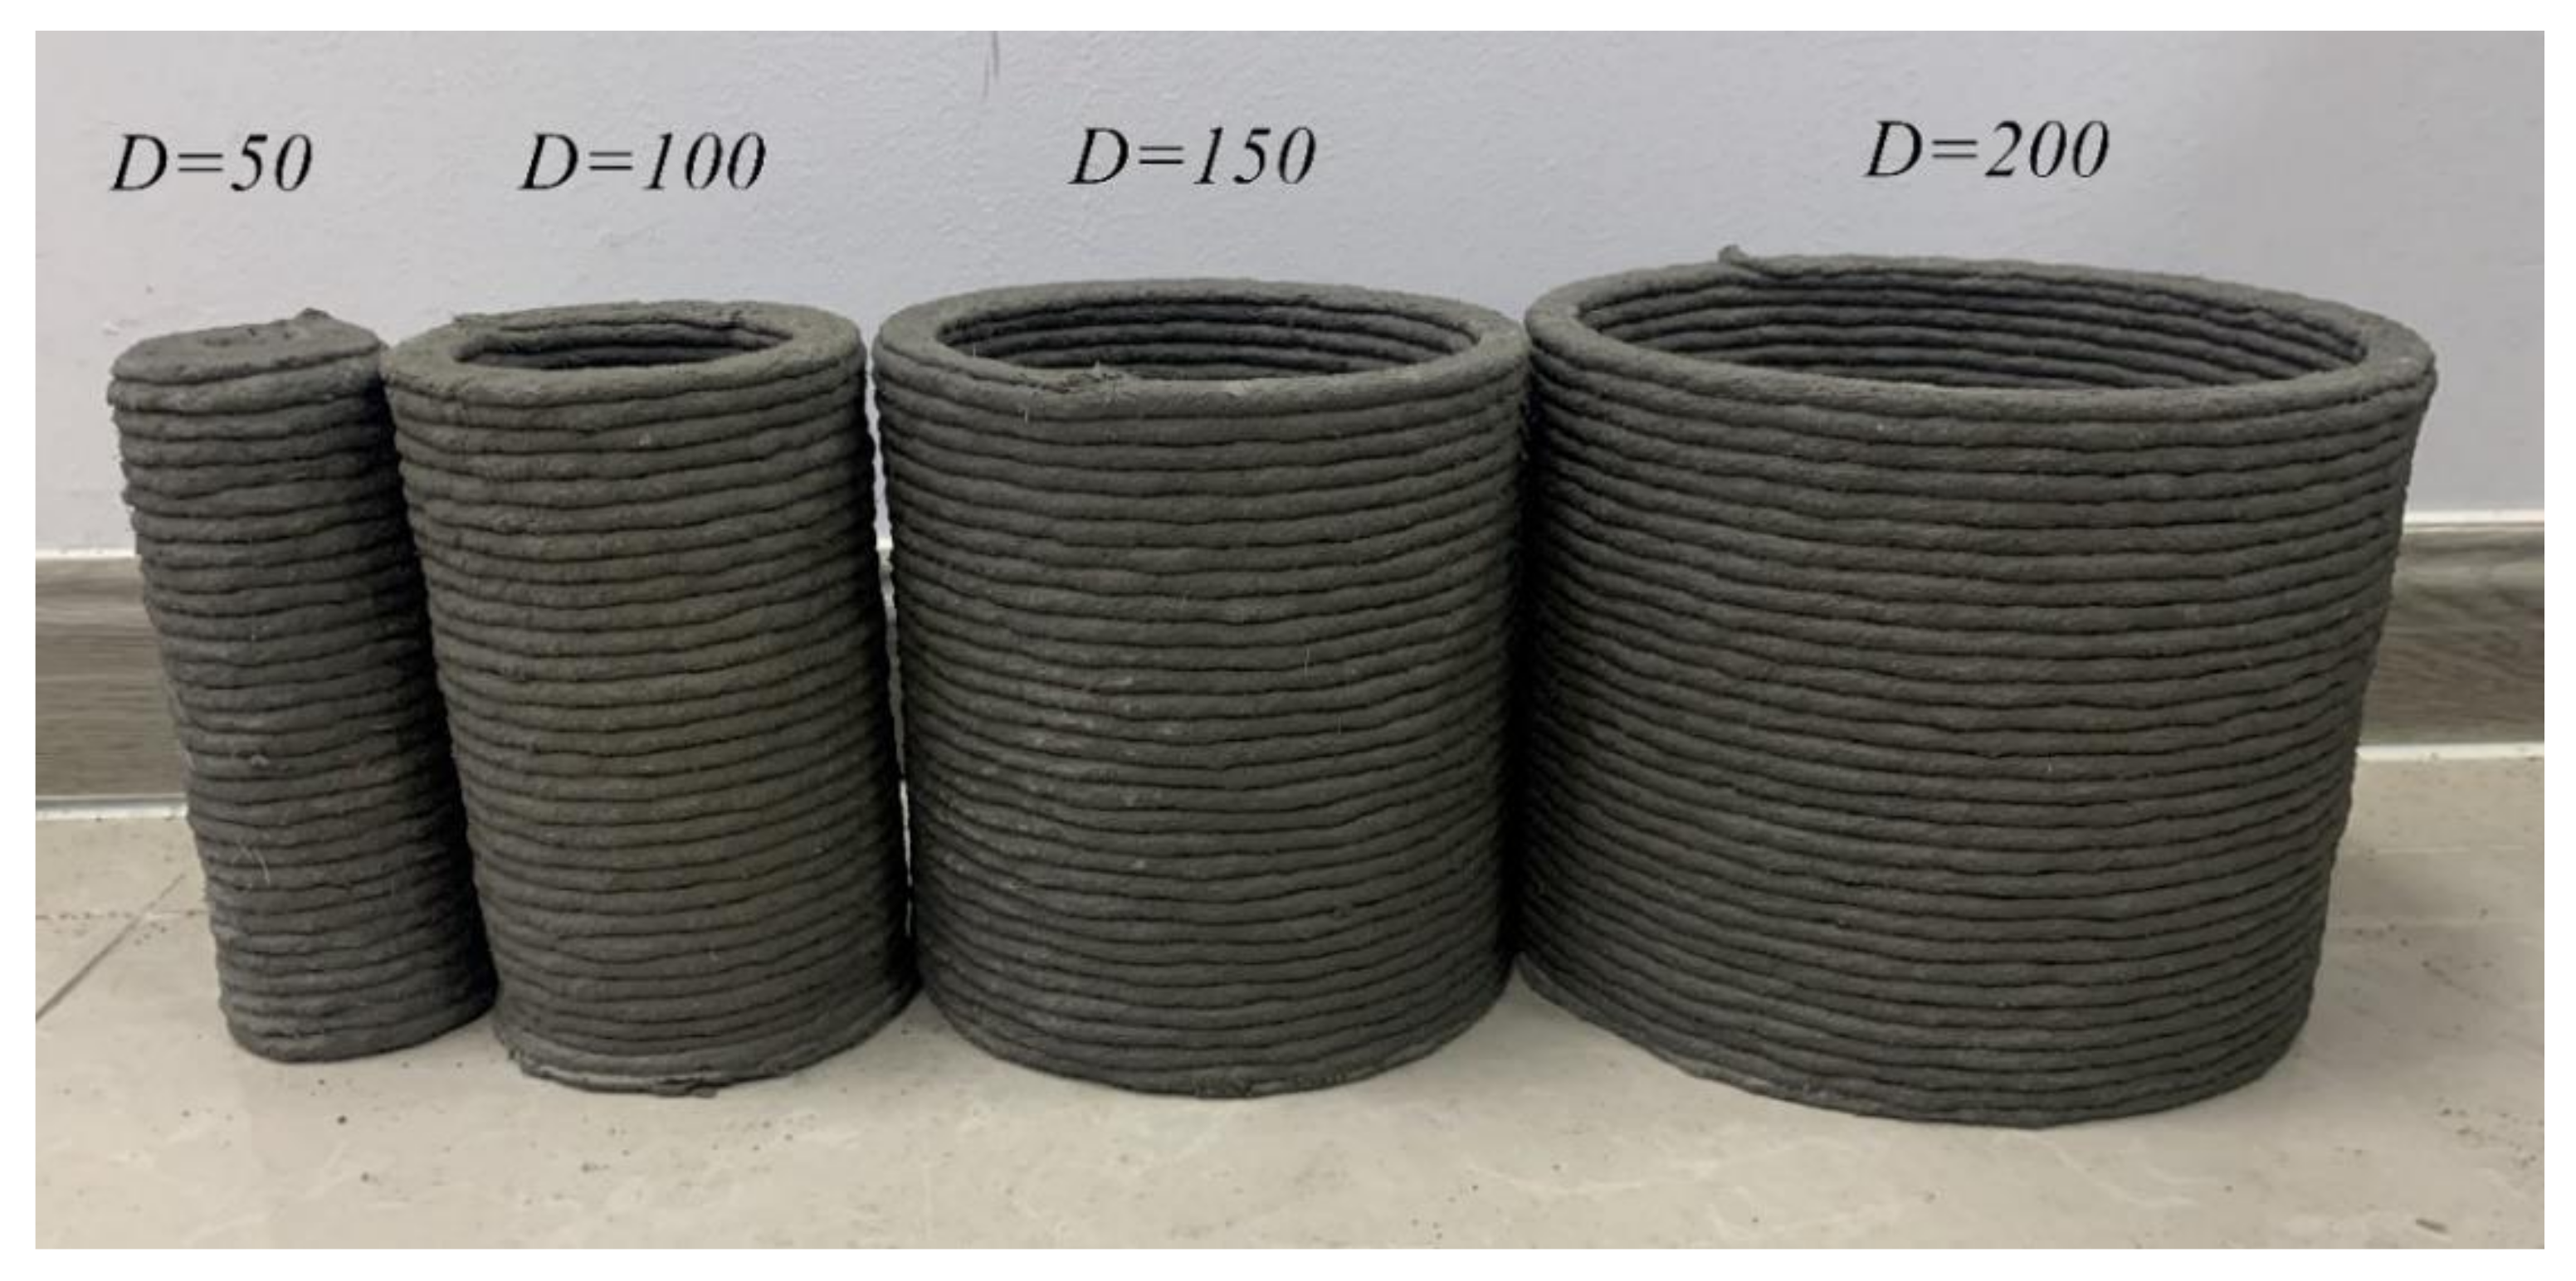
4.2. The Printed Samples
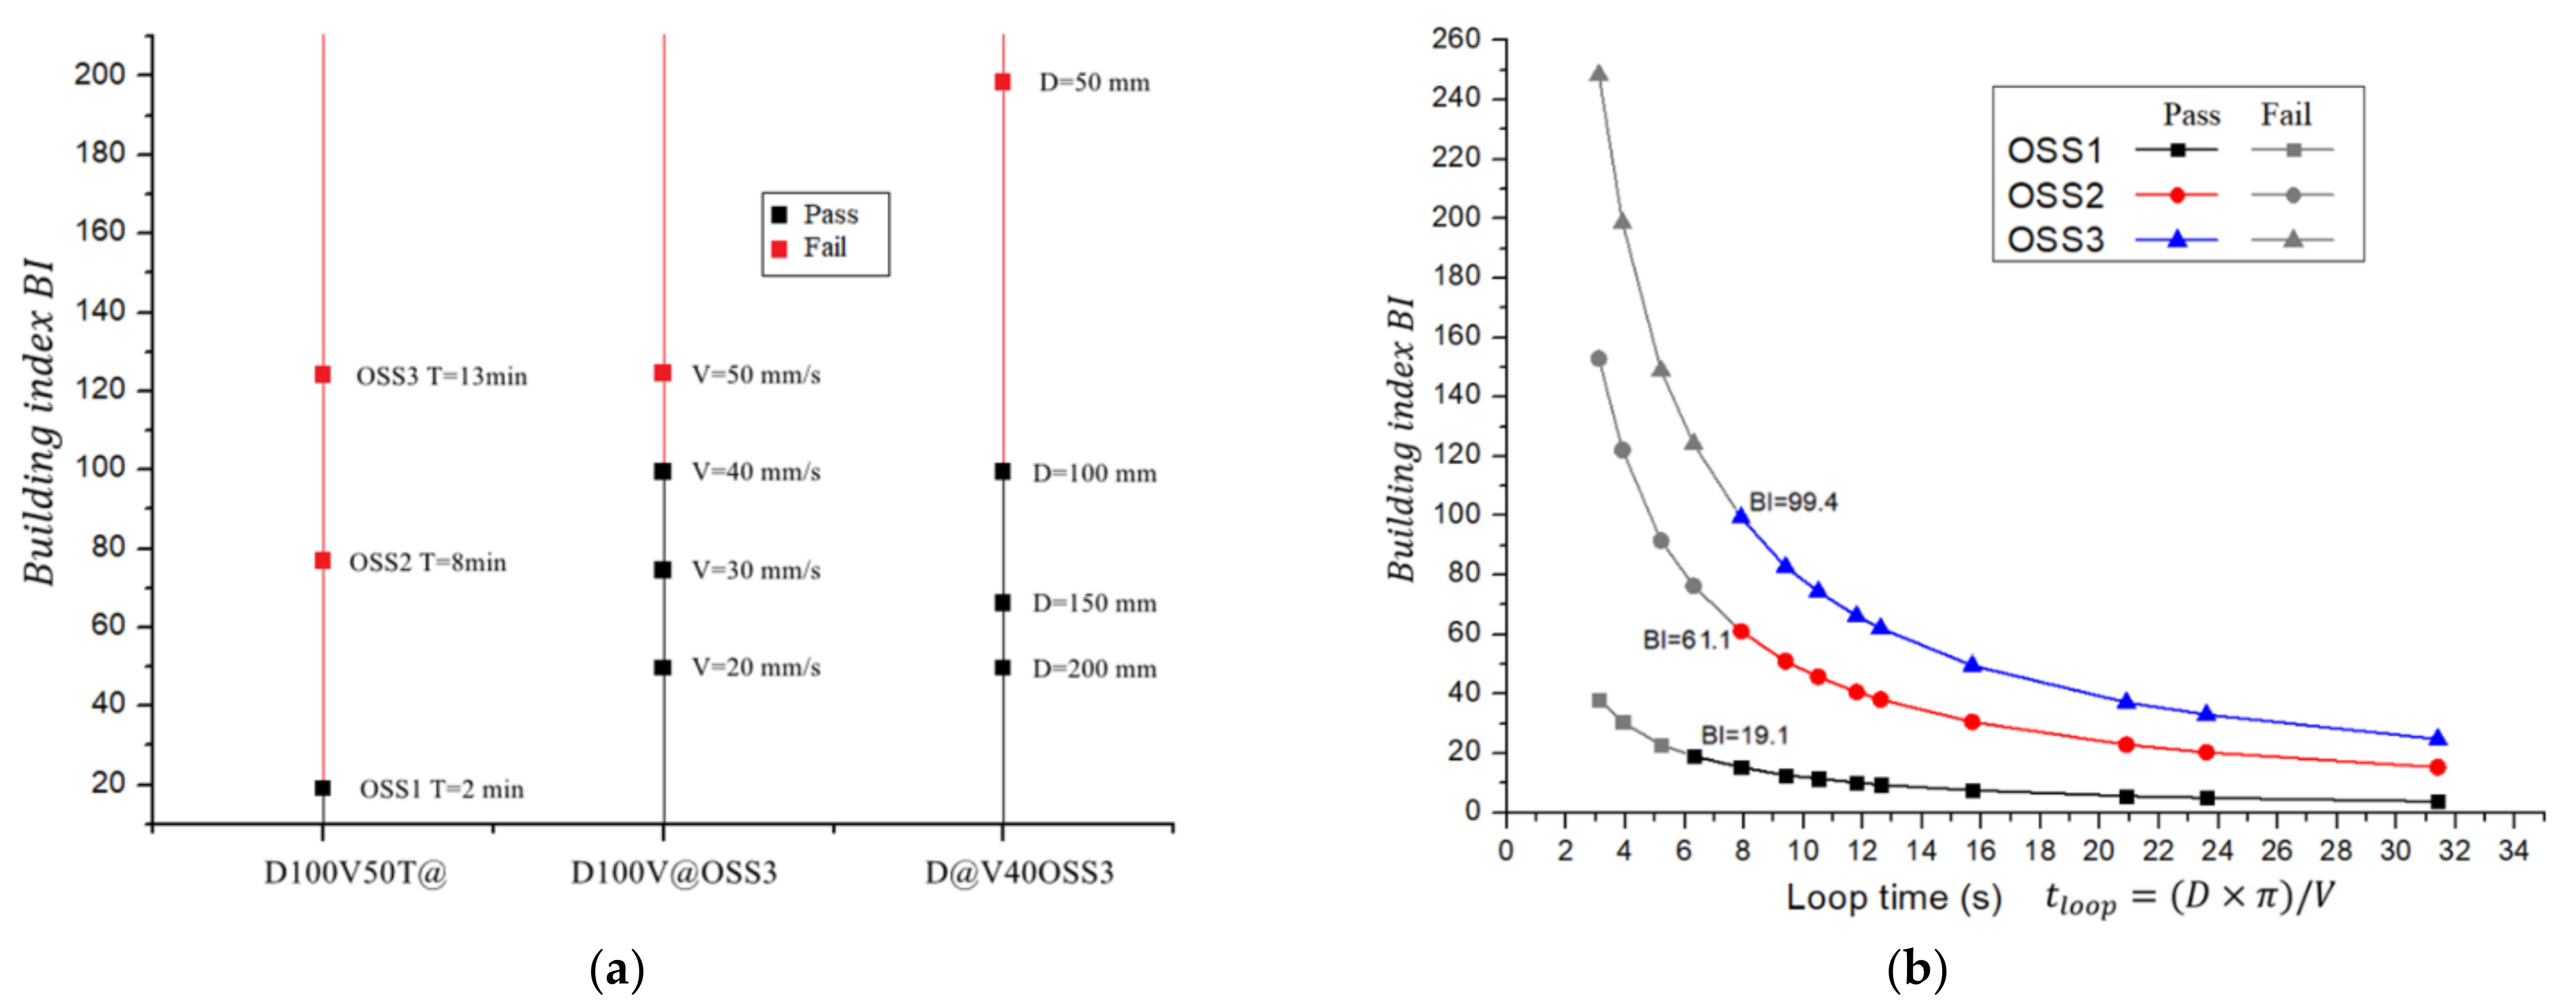
4.3. Building Index
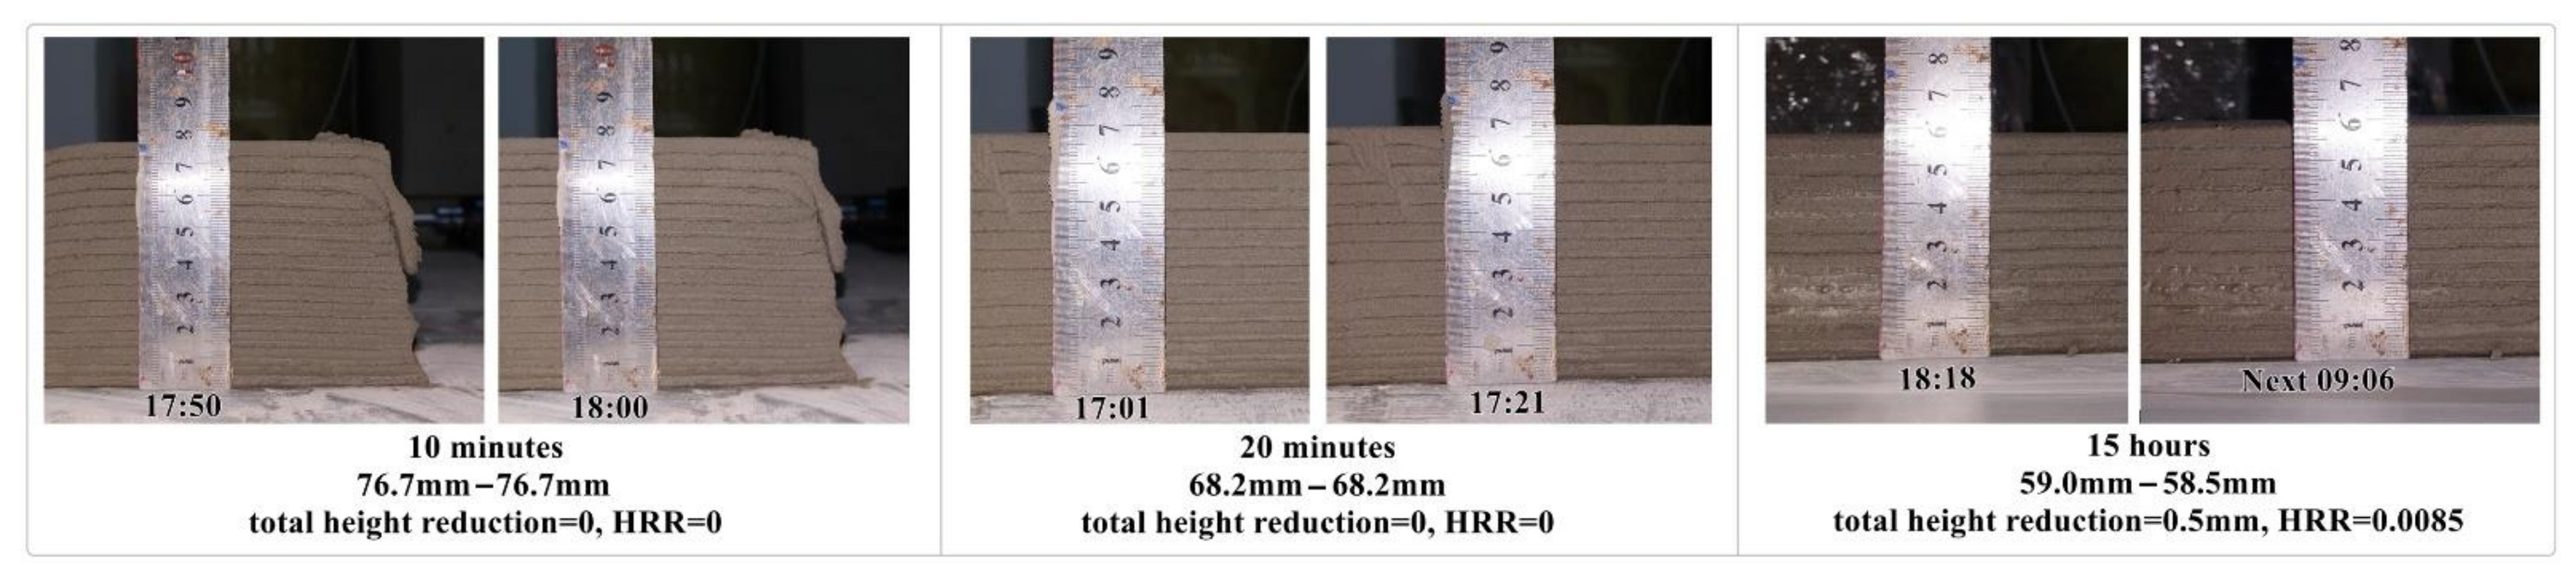
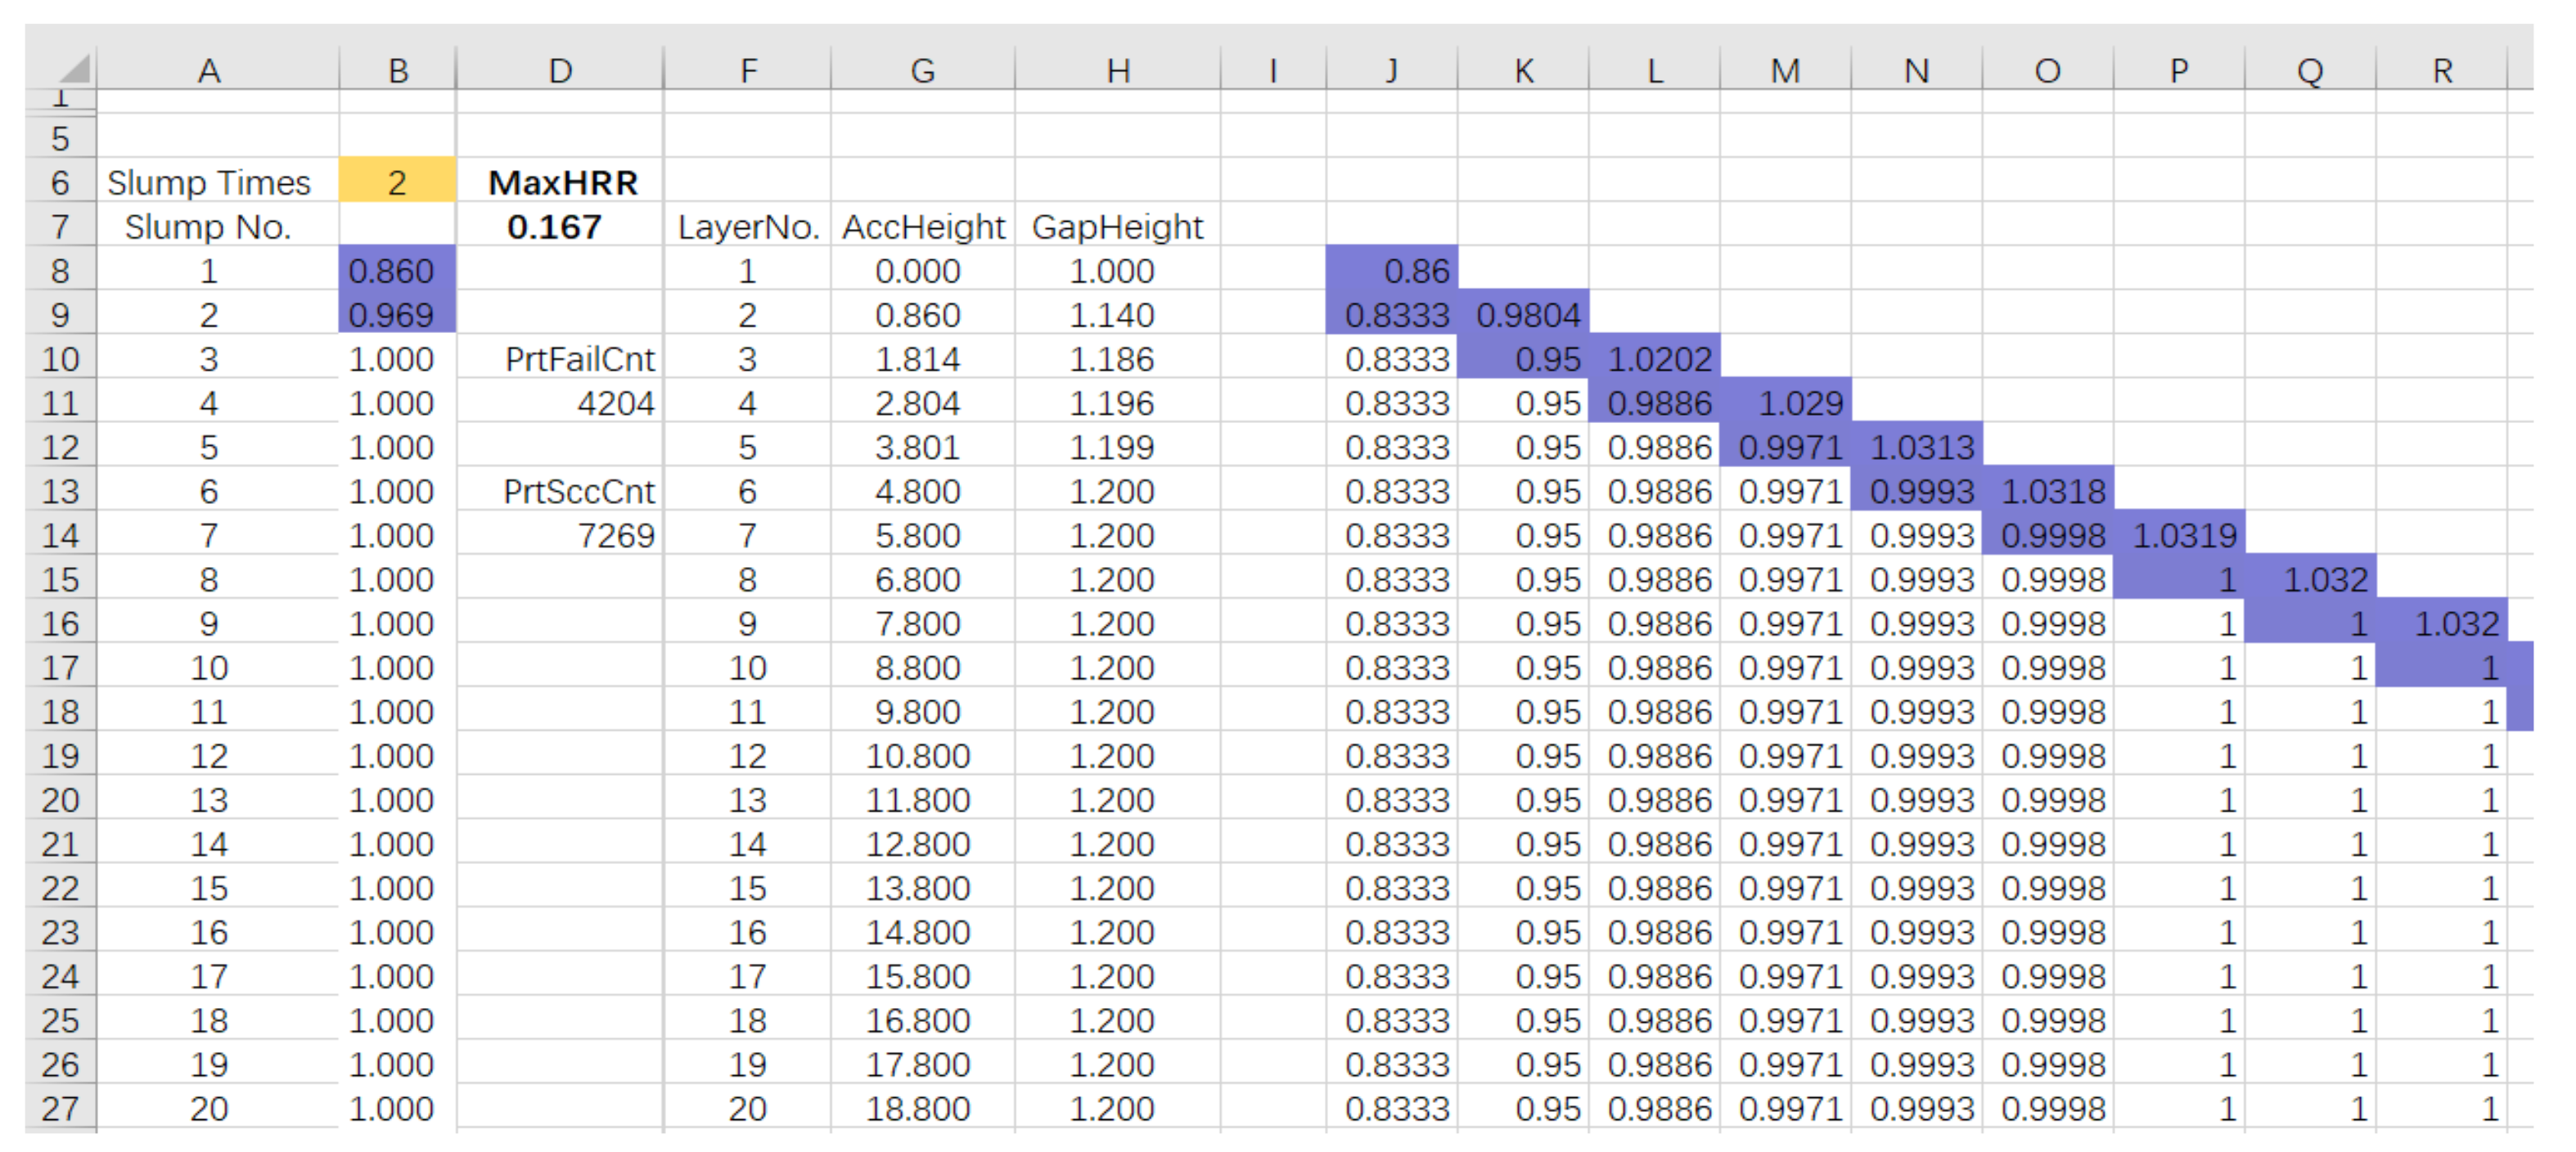
4.4. Height Reduction Test
4.4.1. HRR for
4.4.2. HRR for
4.4.3. HRR Printing Simulation
4.5. Leaning Angle
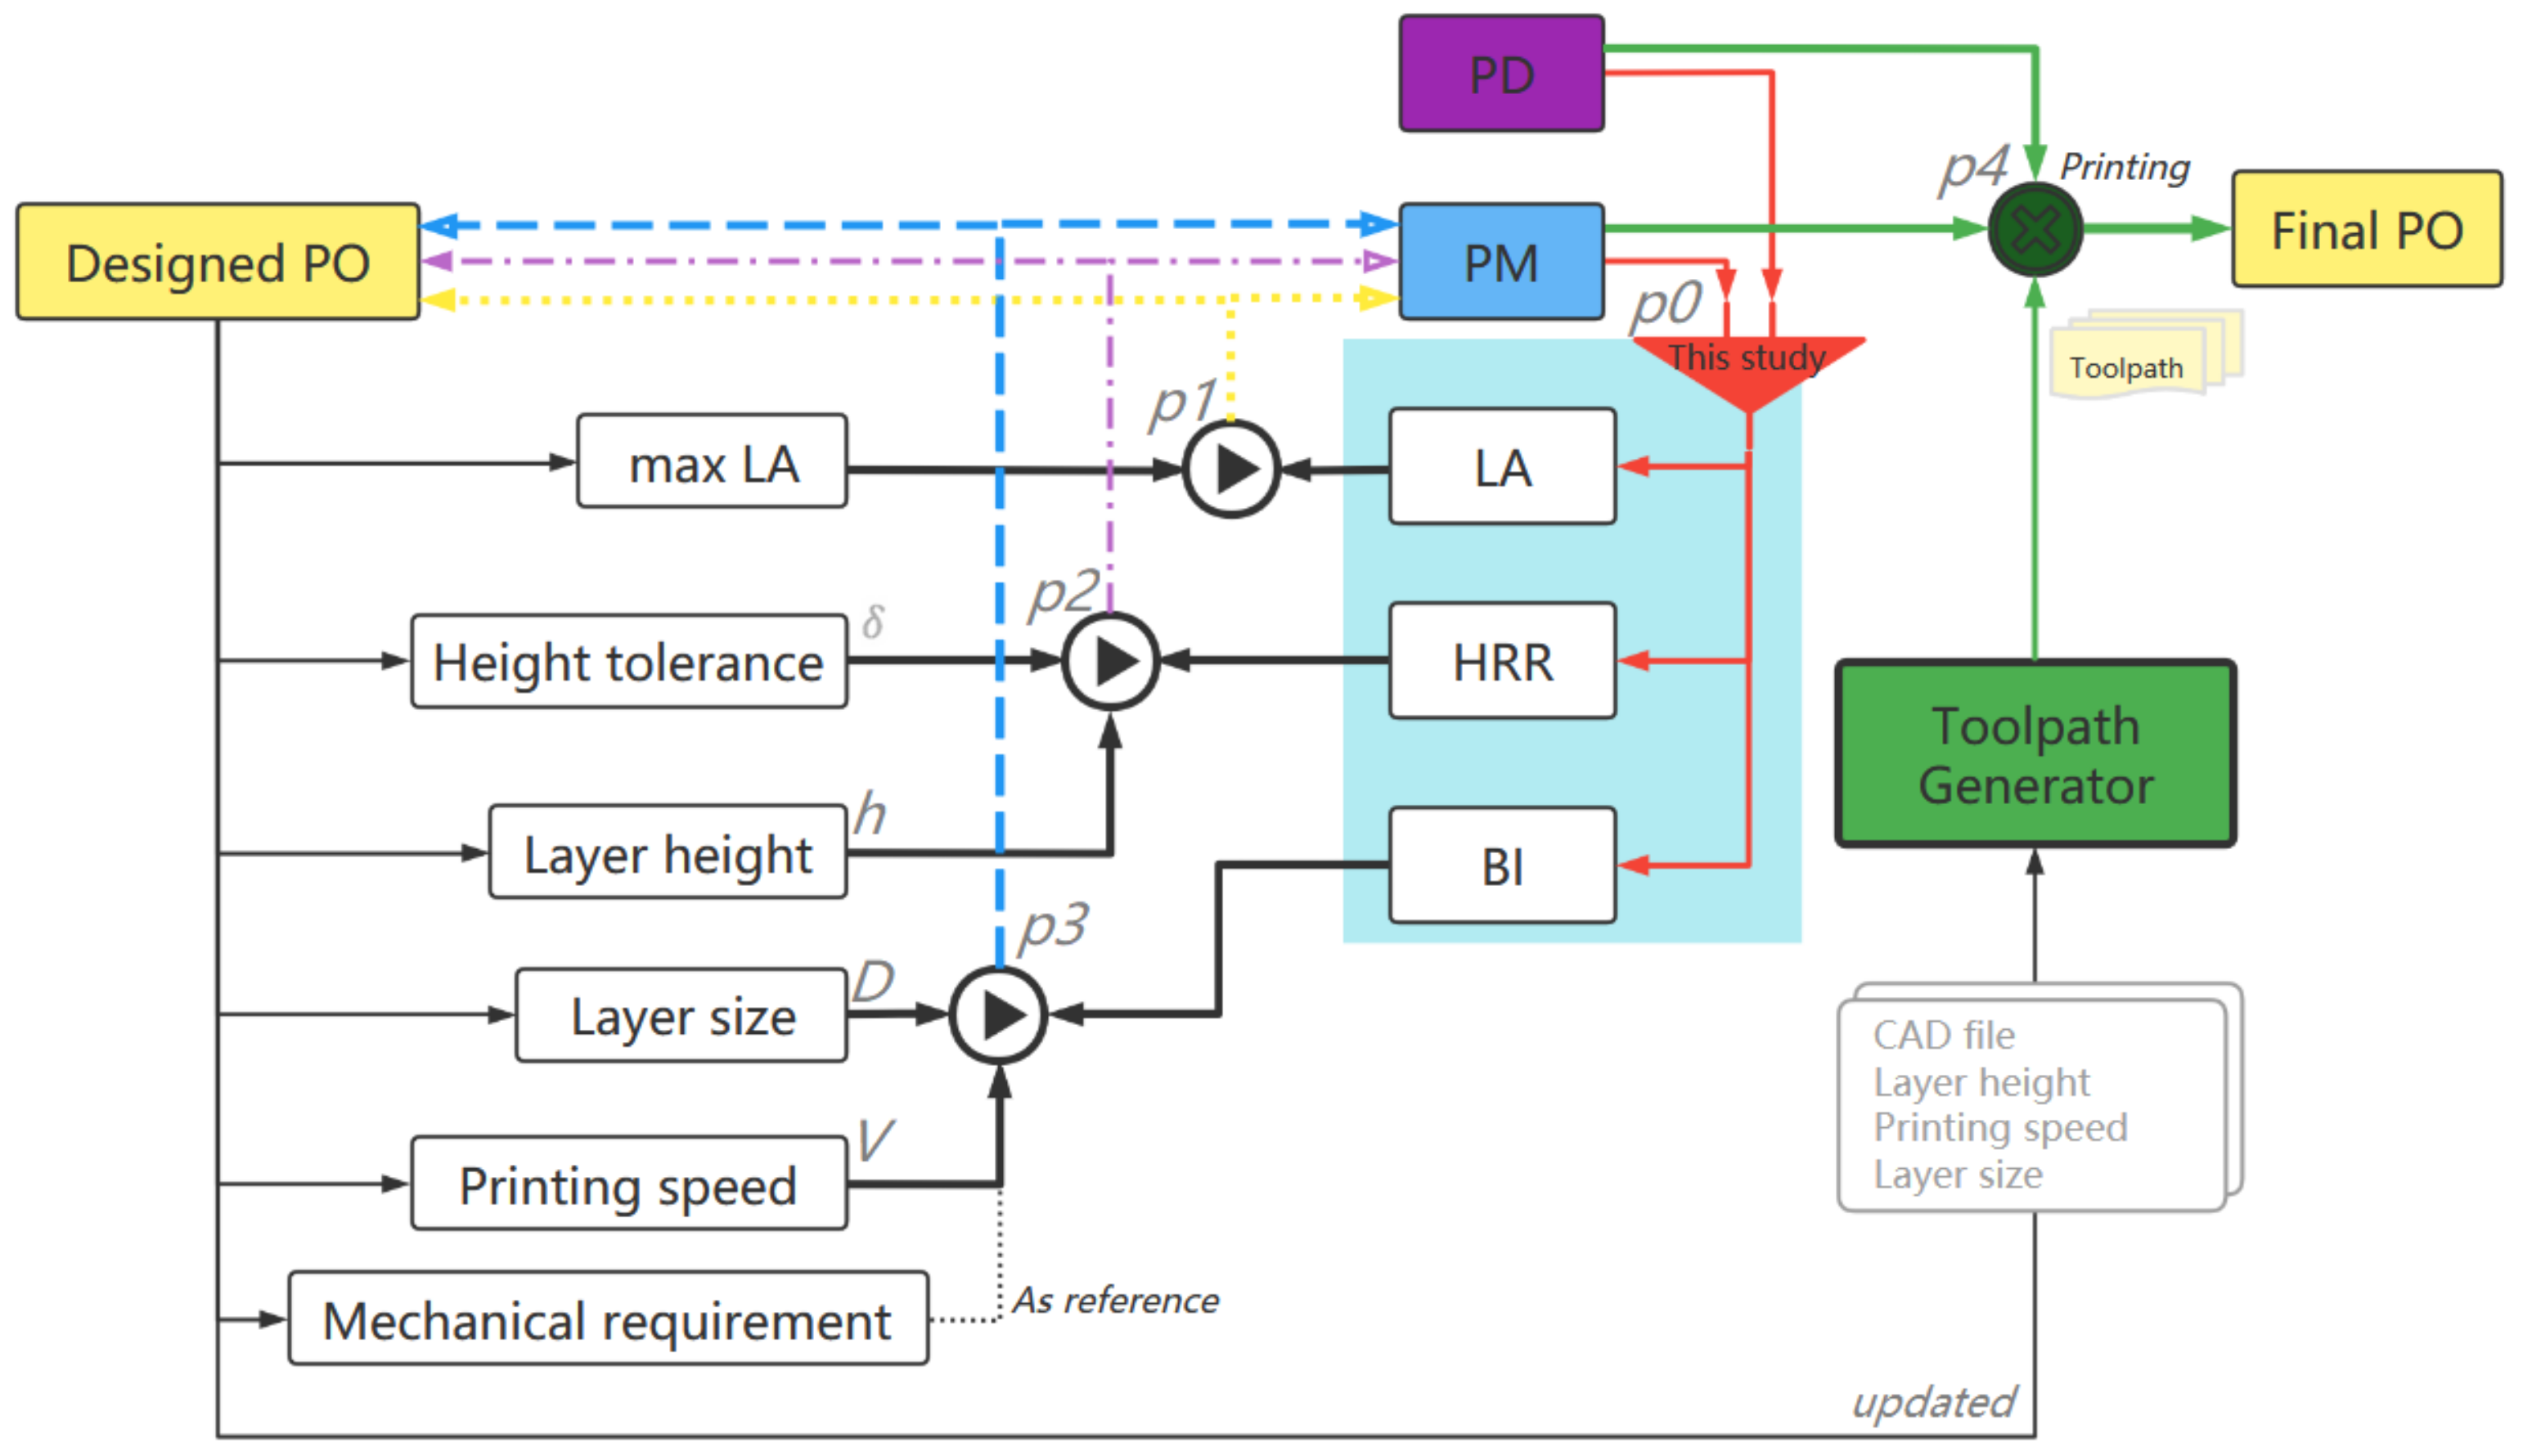
4.6. Applications of the BI, HRR, and LA
5. Conclusions
- Building index (BI) was proposed to evaluate the layer stacking ability of the PM and PD by counting how many layers were printed in the initial setting time. BI can be used to guide the printing configuration and material development. The acceptable ranges of BI for mixes OSS1, OSS2, and OSS3 in this study were 0~19.1, 0~61.1, and 0~99.4, respectively.
- The height reduction test (HRT) measures the height reduction percentage (height reduction ratio) of a PO. It is suitable for the slump evaluation of printed filaments, with more practical significance for the development of PM than the common slump test. Theoretical calculation and numerical simulation verified that the criteria HRR and gap height tolerance (GHT) have a relationship of for a PM, and 0.167 is the criteria value for regular geometry printing with .
- Leaning angle (LA) tests guide the design of CAD sketches to increase the buildability of applications.
- BI, HRR, and LA can work as the meta parameters of the 3DCPT to guide material development and printing configurations, including the printing speed and layer height.
Author Contributions
Funding
Institutional Review Board Statement
Informed Consent Statement
Data Availability Statement
Conflicts of Interest
References
- De Schutter, G.; Lesage, K.; Mechtcherine, V.; Nerella, V.N.; Habert, G.; Agusti-Juan, I. Vision of 3D printing with concrete—Technical, economic and environmental potentials. Cem. Concr. Res. 2018, 112, 25–36. [Google Scholar] [CrossRef]
- Nematollahi, B.; Xia, M.; Sanjayan, J. Current progress of 3D concrete printing technologies. In Proceedings of the International Symposium on Automation and Robotics in Construction, Taipei, Taiwan, 28 June–1 July 2017. [Google Scholar] [CrossRef]
- Pegna, J. Exploratory investigation of solid freeform construction. Automat. Constr. 1997, 5, 427–437. [Google Scholar] [CrossRef]
- Khoshnevis, B. Automated construction by contour crafting—Related robotics and information technologies. Automat. Constr. 2004, 13, 5–19. [Google Scholar] [CrossRef]
- García-Alvarado, R.; Moroni-Orellana, G.; Banda-Pérez, P. Architectural Evaluation of 3D-Printed Buildings. Buildings 2021, 11, 254. [Google Scholar] [CrossRef]
- Lim, S.; Buswell, R.A.; Le, T.T.; Austin, S.A.; Gibb, A.G.F.; Thorpe, T. Developments in construction-scale additive manufacturing processes. Automat. Constr. 2012, 21, 262–268. [Google Scholar] [CrossRef] [Green Version]
- Rahul, A.V.; Santhanam, M.; Meena, H.; Ghani, Z. 3D printable concrete: Mixture design and test methods. Cement Concrete Comp. 2019, 97, 13–23. [Google Scholar] [CrossRef]
- Perrot, A.; Rangeard, D.; Pierre, A. Structural built-up of cement-based materials used for 3D-printing extrusion techniques. Mater. Struct. 2016, 49, 1213–1220. [Google Scholar] [CrossRef]
- Rehman, A.U.; Kim, J.H. 3D Concrete Printing: A Systematic Review of Rheology, Mix Designs, Mechanical, Microstructural, and Durability Characteristics. Materials 2021, 14, 3800. [Google Scholar] [CrossRef]
- Weng, Y.W.; Li, M.Y.; Tan, M.J.; Qian, S.Z. Design 3D printing cementitious materials via Fuller Thompson theory and Marson-Percy model. Constr. Build. Mater. 2018, 163, 600–610. [Google Scholar] [CrossRef]
- Bentz, D.P.; Jones, S.Z.; Bentz, I.R.; Peltz, M.A. Towards the formulation of robust and sustainable cementitious binders for 3-D additive construction by extrusion. Constr. Build. Mater. 2018, 175, 215–224. [Google Scholar] [CrossRef]
- Panda, B.; Paul, S.C.; Hui, L.J.; Tay, Y.W.D.; Tan, M.J. Additive manufacturing of geopolymer for sustainable built environment. J. Clean. Prod. 2017, 167, 281–288. [Google Scholar] [CrossRef]
- Nerella, V.N.; Mechtcherine, V. Studying the printability of fresh concrete for formwork-free concrete onsite 3D printing technology (CONPrint3D). In 3D Concrete Printing Technology; Elsevier: Amsterdam, The Netherlands, 2019; pp. 333–347. [Google Scholar]
- Zhang, Y.; Zhang, Y.; Liu, G.; Yang, Y.; Wu, M.; Pang, B. Fresh properties of a novel 3D printing concrete ink. Constr. Build. Mater. 2018, 174, 263–271. [Google Scholar] [CrossRef]
- Pham, L.; Tran, P.; Sanjayan, J. Steel fibres reinforced 3D printed concrete: Influence of fibre sizes on mechanical performance. Constr. Build. Mater. 2020, 250, 118785. [Google Scholar] [CrossRef]
- Khalil, N.; Aouad, G.; El Cheikh, K.; Rémond, S. Use of calcium sulfoaluminate cements for setting control of 3D-printing mortars. Constr. Build. Mater. 2017, 157, 382–391. [Google Scholar] [CrossRef]
- Panda, B. 3D Printing of High-Volume Fly Ash Mixtures for Digital Concrete Construction. Ph.D. Thesis, Nanyang Technological University, Singapore, 2019. [Google Scholar]
- Wolfs, R.J.M.; Bos, F.P.; Salet, T.A.M. Early age mechanical behaviour of 3D printed concrete: Numerical modelling and experimental testing. Cem. Concr. Res. 2018, 106, 103–116. [Google Scholar] [CrossRef]
- Kazemian, A.; Yuan, X.; Cochran, E.; Khoshnevis, B. Cementitious materials for construction-scale 3D printing: Laboratory testing of fresh printing mixture. Constr. Build. Mater. 2017, 145, 639–647. [Google Scholar] [CrossRef]
- Ma, G.; Li, Z.; Wang, L. Printable properties of cementitious material containing copper tailings for extrusion based 3D printing. Constr. Build. Mater. 2018, 162, 613–627. [Google Scholar] [CrossRef]
- Arunothayan, A.R.; Nematollahi, B.; Ranade, R.; Bong, S.H.; Sanjayan, J. Development of 3D-printable ultra-high performance fiber-reinforced concrete for digital construction. Constr. Build. Mater. 2020, 257, 119546. [Google Scholar] [CrossRef]
- Joh, C.; Lee, J.; Bui, T.Q.; Park, J.; Yang, I.H. Buildability and Mechanical Properties of 3D Printed Concrete. Materials 2020, 13, 4919. [Google Scholar] [CrossRef]
- Nerella, V.N.; Hempel, S.; Mechtcherine, V. Micro-and macroscopic investigations on the interface between layers of 3d-printed cementitious elements. In Proceedings of the Proceedings of the International Conference on Advances in Construction Materials and Systems, Chennai, India, 3 September 2017; pp. 3–8. [Google Scholar]
- Chen, Y.; Chaves Figueiredo, S.; Li, Z.; Chang, Z.; Jansen, K.; Çopuroğlu, O.; Schlangen, E. Improving printability of limestone-calcined clay-based cementitious materials by using viscosity-modifying admixture. Cem. Concr. Res. 2020, 132, 106040. [Google Scholar] [CrossRef]
- Chen, M.; Li, L.; Zheng, Y.; Zhao, P.; Lu, L.; Cheng, X. Rheological and mechanical properties of admixtures modified 3D printing sulphoaluminate cementitious materials. Constr. Build. Mater. 2018, 189, 601–611. [Google Scholar] [CrossRef]
- Kwon, H. Experimentation and Analysis of Contour Crafting (CC) Process Using Uncured Ceramic Materials; University of Southern California: Los Angeles, CA, USA, 2004. [Google Scholar]
- Tay, Y.W.D.; Qian, Y.; Tan, M.J. Printability region for 3D concrete printing using slump and slump flow test. Compos. Part B Eng. 2019, 174, 106968. [Google Scholar] [CrossRef]
- Tay, Y.W.D.; Ting, G.H.A.; Qian, Y.; Panda, B.; He, L.; Tan, M.J. Time gap effect on bond strength of 3D-printed concrete. Virtual Phys. Prototy. 2018, 14, 104–113. [Google Scholar] [CrossRef]
- Babafemi, A.J.; Kolawole, J.T.; Miah, M.J.; Paul, S.C.; Panda, B. A Concise Review on Interlayer Bond Strength in 3D Concrete Printing. Sustainability 2021, 13, 7137. [Google Scholar] [CrossRef]
- Baz, B.; Aouad, G.; Leblond, P.; Al-Mansouri, O.; D’Hondt, M.; Remond, S. Mechanical assessment of concrete—Steel bonding in 3D printed elements. Constr. Build. Mater. 2020, 256, 119457. [Google Scholar] [CrossRef]
- Perrot, A.; Jacquet, Y.; Rangeard, D.; Courteille, E.; Sonebi, M. Nailing of Layers: A Promising Way to Reinforce Concrete 3D Printing Structures. Materials 2020, 13, 1518. [Google Scholar] [CrossRef] [Green Version]
- Suiker, A.S.J.; Wolfs, R.J.M.; Lucas, S.M.; Salet, T.A.M. Elastic buckling and plastic collapse during 3D concrete printing. Cem. Concr. Res. 2020, 135, 106016. [Google Scholar] [CrossRef]
- Wolfs, R.J.M.; Bos, F.P.; Salet, T.A.M. Triaxial compression testing on early age concrete for numerical analysis of 3D concrete printing. Cem. Concr. Compos. 2019, 104, 103344. [Google Scholar] [CrossRef]
- Tho, T.P.; Thinh, N.T. Using a Cable-Driven Parallel Robot with Applications in 3D Concrete Printing. Appl. Sci. 2021, 11, 563. [Google Scholar] [CrossRef]
- Cao, X.; Yu, S.; Cui, H. Experimental Investigation on Inner- and Inter-Strip Reinforcements for 3D Printed Concrete via Automatic Staple Inserting Technique. Appl. Sci. 2022, 12, 2099. [Google Scholar] [CrossRef]
- Nair, S.A.O.; Panda, S.; Santhanam, M.; Sant, G.; Neithalath, N. A critical examination of the influence of material characteristics and extruder geometry on 3D printing of cementitious binders. Cem. Concr. Compos. 2020, 112, 103671. [Google Scholar] [CrossRef]
- Vlachakis, C.; Perry, M.; Biondi, L.; McAlorum, J. 3D printed temperature-sensing repairs for concrete structures. Addit. Manuf. 2020, 34, 101238. [Google Scholar] [CrossRef]
- Soltan, D.G.; Li, V.C. A self-reinforced cementitious composite for building-scale 3D printing. Cem. Concr. Compos. 2018, 90, 1–13. [Google Scholar] [CrossRef]
- Ashrafi, N.; Nazarian, S.; Meisel, N.A.; Duarte, J.P. Experimental prediction of material deformation in large-scale additive manufacturing of concrete. Addit. Manuf. 2021, 37, 101656. [Google Scholar] [CrossRef]
- Dressler, I.; Freund, N.; Lowke, D. The Effect of Accelerator Dosage on Fresh Concrete Properties and on Interlayer Strength in Shotcrete 3D Printing. Materials 2020, 13, 374. [Google Scholar] [CrossRef] [PubMed] [Green Version]
- Khoshnevis, B.; Bukkapatnam, S.; Kwon, H.; Saito, J. Experimental investigation of contour crafting using ceramics materials. Rapid Prototyp. J. 2001, 7, 32–41. [Google Scholar] [CrossRef]


| CaO | SiO2 | Al2O3 | MgO | Fe2O3 | SO3 | IL | TiO2 | Na2O | K2O | Others | |
|---|---|---|---|---|---|---|---|---|---|---|---|
| OPC | 55.01 | 23.44 | 7.19 | 2.24 | 2.96 | 2.87 | 3.48 | 0.27 | 0.32 | 0.89 | 1.33 |
| SAC | 44.48 | 7.82 | 20.02 | 1.94 | 1.46 | 17.9 | 4.31 | - | - | 0.70 | 1.37 |
| No. | W/C | OPC/g | SAC/g | Fine Sand/g | HRWR/g | HPMC/g | DFA/g | PFB/g |
|---|---|---|---|---|---|---|---|---|
| OSS1 | 0.37 | 1440 | 960 | 1600 | 19.2 | 8 | 2 | 40 |
| OSS2 | 0.37 | 1680 | 720 | 1600 | 19.2 | 8 | 2 | 40 |
| OSS3 | 0.37 | 1800 | 600 | 1600 | 19.2 | 8 | 2 | 40 |
| Sample Group | Sample Name | Diameter | V (Speed) | Mixture |
|---|---|---|---|---|
| D100V50T@ | D100V50OSS1 | 100 | 50 | OSS1 |
| D100V50OSS2 | OSS2 | |||
| D100V50OSS3 | OSS3 | |||
| D100V@OSS3 | D100V20OSS3 | 100 | 20 | OSS3 |
| D100V30OSS3 | 30 | |||
| D100V40OSS3 | 40 | |||
| D100V50OSS3 | 50 | |||
| D@V40OSS3 | D50V40OSS3 | 50 | 40 | OSS3 |
| D100V40OSS3 | 100 | |||
| D150V40OSS3 | 150 | |||
| D200V40OSS3 | 200 | |||
| Other specimens excluding above samples | D50V20-, D50V30-, D50V40-, D50V50-, D100V20-, D100V30-, D100V40-, D100V50-, D150V20-, D150V30-, D150V40-, D150V50-, D200V20-, D200V30-, D200V40-, D200V50-, | OSS1 OSS2 OSS3 | ||
| V = 20 mm/s | V = 30 mm/s | V = 40 mm/s | V = 50 mm/s | |
|---|---|---|---|---|
| D = 50 mm | 3.13 min | 2.12 min | 1.60 min | 1.10 min |
| D = 100 mm | 7.52 min | 5.03 min | 4.17 min | 2.68 min |
| D = 150 mm | 11.82 min | 8.03 min | 5.80 min | 4.78 min |
| D = 200 mm | 15.98 min | 10.85 min | 8.15 min | 6.53 min |
| Unit | D = 50 mm | D = 100 mm | D = 150 mm | D = 200 mm | |
|---|---|---|---|---|---|
| Printing speed * | mm/s | 10.1 | 18.6 | 27.9 | 37.2 |
| s | 15.5 | 16.9 | 16.9 | 16.9 | |
| BI | 50.2 | 46.2 | 46.2 | 46.2 |
| Layer No. | 1. Nozzle Positioning | 2. Printing | 3. Material Slump | Accumulated Height |
|---|---|---|---|---|
| Nozzle Position * | H, Gap Height ** | Layer Height after Slump *** | ||
| 0 | h | h − 0 | h (1 − r) | h (1 − r) |
| 1 | 2 h | 2 h − h (1 − r) | (2 h − h (1 − r)) (1 − r) | h (1 − r) + (2 h − h (1 − r)) (1 − r) |
| N | (N + 1) h | (1 + r1 + r2 + … + rN) h | (1 − rN+1) h | (N − r1 − r2 − … − rN+1) h |
Publisher’s Note: MDPI stays neutral with regard to jurisdictional claims in published maps and institutional affiliations. |
© 2022 by the authors. Licensee MDPI, Basel, Switzerland. This article is an open access article distributed under the terms and conditions of the Creative Commons Attribution (CC BY) license (https://creativecommons.org/licenses/by/4.0/).
Share and Cite
Cui, H.; Li, Y.; Cao, X.; Huang, M.; Tang, W.; Li, Z. Experimental Study of 3D Concrete Printing Configurations Based on the Buildability Evaluation. Appl. Sci. 2022, 12, 2939. https://doi.org/10.3390/app12062939
Cui H, Li Y, Cao X, Huang M, Tang W, Li Z. Experimental Study of 3D Concrete Printing Configurations Based on the Buildability Evaluation. Applied Sciences. 2022; 12(6):2939. https://doi.org/10.3390/app12062939
Chicago/Turabian StyleCui, Hongzhi, Yuanhong Li, Xiangpeng Cao, Mingyang Huang, Waiching Tang, and Zongjin Li. 2022. "Experimental Study of 3D Concrete Printing Configurations Based on the Buildability Evaluation" Applied Sciences 12, no. 6: 2939. https://doi.org/10.3390/app12062939
APA StyleCui, H., Li, Y., Cao, X., Huang, M., Tang, W., & Li, Z. (2022). Experimental Study of 3D Concrete Printing Configurations Based on the Buildability Evaluation. Applied Sciences, 12(6), 2939. https://doi.org/10.3390/app12062939