Article

Discriminative Frequencies and Temporal EEG Segmentation in the Motor Imagery Classification Approach

Research Center for Neurotechnology, Southern Federal University, 344006 Rostov-on-Don, Russia
*
Authors to whom correspondence should be addressed.
Appl. Sci. 2022, 12(5), 2736; https://doi.org/10.3390/app12052736
Submission received: 25 November 2021 / Revised: 25 February 2022 / Accepted: 2 March 2022 / Published: 7 March 2022

Abstract

:
A linear discriminant analysis transformation-based approach to the classification of three different motor imagery types for brain–computer interfaces was considered. The study involved 16 conditionally healthy subjects (12 men, 4 women, mean age of 21.5 years). First, the search for subject-specific discriminative frequencies was conducted in the task of movement-related activity. This procedure was shown to increase the classification accuracy compared to the conditional common spatial pattern (CSP) algorithm, followed by a linear classifier considered as a baseline approach. In addition, an original approach to finding discriminative temporal segments for each motor imagery was tested. This led to a further increase in accuracy under the conditions of using Hjorth parameters and interchannel correlation coefficients as features calculated for the EEG segments. In particular, classification by the latter feature led to the best accuracy of 71.6%, averaged over all subjects (intrasubject classification), and, surprisingly, it also allowed us to obtain a comparable value of intersubject classification accuracy of 68%. Furthermore, scatter plots demonstrated that two out of three pairs of motor imagery were discriminated by the approach presented.

1. Introduction

Currently, intelligent methods of data processing have begun to play a crucial role in the personalization of various areas of human activity. Interaction with technical systems is one of them, and it is referred to as human–machine interfaces. The availability and miniaturization of computer technology has created the prerequisites for the widespread use of new-generation human–machine interfaces, such as brain–computer interfaces (BCIs) or neural interfaces [1,2]. The development of BCIs is carried out in a multidisciplinary approach at the intersection of information technology and neuroscience and is, perhaps, one of the most intensively growing and promising areas of applied research. The primary goal, as is widely known, is to create a new reliable communication channel for the rehabilitation of people with speech and motor activity disorders [3,4]. BCI implements its communication function by decoding various types of mental commands of an individual, including evoked brain activity (ERP) and voluntary EEG-induced patterns (motor imagery and inner speech) that are formed in the brain electrical activity.
However, at present, the limiting factor for the practical implementation of such systems is the lack of sufficiently developed intelligent data processing methods that provide automated individual interface adjustment [5,6,7]. This leads to the urgent unsolved problem of bringing such systems out of scientific laboratories to the end-user environment. One of the unsolved problems hindering achievement that is the exclusion of the laborious participation of an expert researcher, who forms training samples manually, from the process of tuning the neural control system. Therefore, the development of computational methods that provide autonomous BCI tuning is urgent.
In numerous BCIs based on the patterns of the motor imagery (MI) acts electroencephalogram (EEG), at the stage of setting up the system, the stimulus-dependent experimental paradigm is used. It consists in presenting the user with various stimuli that specify the execution of single movements (Berlin BCI [8], Graz BCI [9], Wadsworth BCI [10]). On the one hand, within this paradigm, it is convenient to configure and test computational methods for recognizing control EEG commands and monitoring the user’s training for their reproduction. On the other hand, control stimuli affect the EEG of a movement’s mental performance, since the MI signal and the components of the evoked potential are superposed [11,12]. Subsequently, this complicates the operation of the BCIs configured in this way in the control mode, in which the MI activity is performed by the user in an arbitrary manner without reference to external stimuli. Therefore, it is urgent to develop a BCI adjustment procedure that does not use external stimuli that induce the execution of individual ideomotor acts. Methods for detecting EEG patterns of target motor imagery acts are a key element in the implementation of tuning autonomy in completely stimulus-independent BCIs.
Voluntary imaginary hand and leg movements are actively used in BCIs within the framework of the stimulus-independent experimental paradigm. It is well known that the main advantage of this experimental approach is that mental actions are not associated with external stimuli on the monitor screen, and therefore the control commands themselves are completely voluntary. Thus, the mental formation of control commands for external devices occurs at a random moment at the request of the subject. This allows the user to work at a voluntary pace that is convenient for them. Existing methods of accounting for individual characteristics of brain activity and BCIs based on mental performance of movements [13,14,15,16] were proposed only for particular tasks, with a fixed set of EEG commands known a priori and are difficult to implement for completely stimulus-independent autonomously tuned BCIs.
The noninvasive approach based on electroencephalogram (EEG) signals proved to be extremely useful for the development of BCI technology. The EEG method has convincingly proved its high safety and reliability, primarily in the framework of providing a new channel of communication with the outside world to patients if they are immobilized for various reasons [17]. The BCIs neural communication system does not require any pronounced muscular activity from the user, and therefore it can actually function even in patients with severe neurodegenerative diseases of the motor system and disorders caused by spinal cord injuries [18,19].
The selection of informative features to describe the target patterns of multidimensional EEG patterns often faces a number of problems, including too wide range of parameters and the nature of the analyzed activity in the EEG, in particular, its nonlinearity and nonstationary. Furthermore, it has been experimentally shown that significant individual differences in informative EEG features are observed in different subjects [20]. Although we have previously identified the most significant frequency ranges (such as µ (10–13 Hz), β (13–25 Hz), and γ (30–70 Hz)) reliable for the classification of MI-related EEG patterns [3], we assume that the most effective frequency band of the EEG and its severity are determined by the individual characteristics of the subject [20]. It has also been shown that the ability of a person, in principle, to voluntarily induce patterns of brain activity, for example, when mentally performing a movement with a certain limb, is purely individual [21,22,23]. Therefore, the BCI user is not always able to operate with the set of control commands offered to them. This problem for the case of a practical need to find and consolidate a new pattern or command is not considered in existing systems. In this regard, it is necessary to develop universal and noise-resistant approaches that allow us to isolate informative signal components to detect EEG patterns of target ideomotor acts.
EEG signals recorded in MI tasks, such as legs, left-hand, and right-hand movements, are widely analyzed by various methods for BCI applications. For example, the use of conventional support vector machines (SVM), autoregressive SVM (AR-SVM), CSP-SVM [16,24,25], and LDA models [26,27] provide sufficient performance for neural control. Artificial neural networks (ANN) and algorithms for the classification of EEG-related MI have also been implemented [28]: empirical mode decomposition, radial basis function networks, local approximation, and interpretation of time series [3,23,29,30]. These methods improve the accuracy of recognition and classification of target EEG patterns. On the other hand, data augmentation and deep learning approaches are used to classify MI. Convolutional neural networks (CNN) for feature extraction and MI classification provide better accuracy than conventional methods [31]. CNN and Morlet wavelets have also been applied to EEG to create pattern-similar frames to improve the accuracy of evoked potential analysis [32,33]. Comparative analysis shows that although the effectiveness of neural network methods is high, they require higher computing power and training time.
In this paper, an MI EEG pattern classification approach is proposed (Materials and Methods, D). It consists in (i) detection of the most informative EEG frequency ranges specific to different subjects and classes of MI by linear discriminant analysis (LDA); (ii) highlighting the most informative and shorter time segments of the EEG containing the target MI pattern by LDA transformation of all time segments, which also minimizes noise; and (iii) classification of the transformed data by logistic regression.
The paper is organized as follows. In Section 2, a description of the experimental procedures followed in EEG recording and processing is presented, as well as the approach developed. A summary of the results obtained is provided in Section 3. Section 4 presents a discussion of the results obtained in this work. Finally, some conclusions are drawn in Section 5.

2. Materials and Methods

2.1. Dataset and Subjects

The dataset includes 16 subjects of both sexes (12 men, 4 women) from 18 to 25 years of age (average 21.5 ± 3.5 years). Each subject provided their voluntary consent to participate in the study prior to the start of the experiment. The experimental methodology was approved by the Ethics Committee of the Southern Federal University.

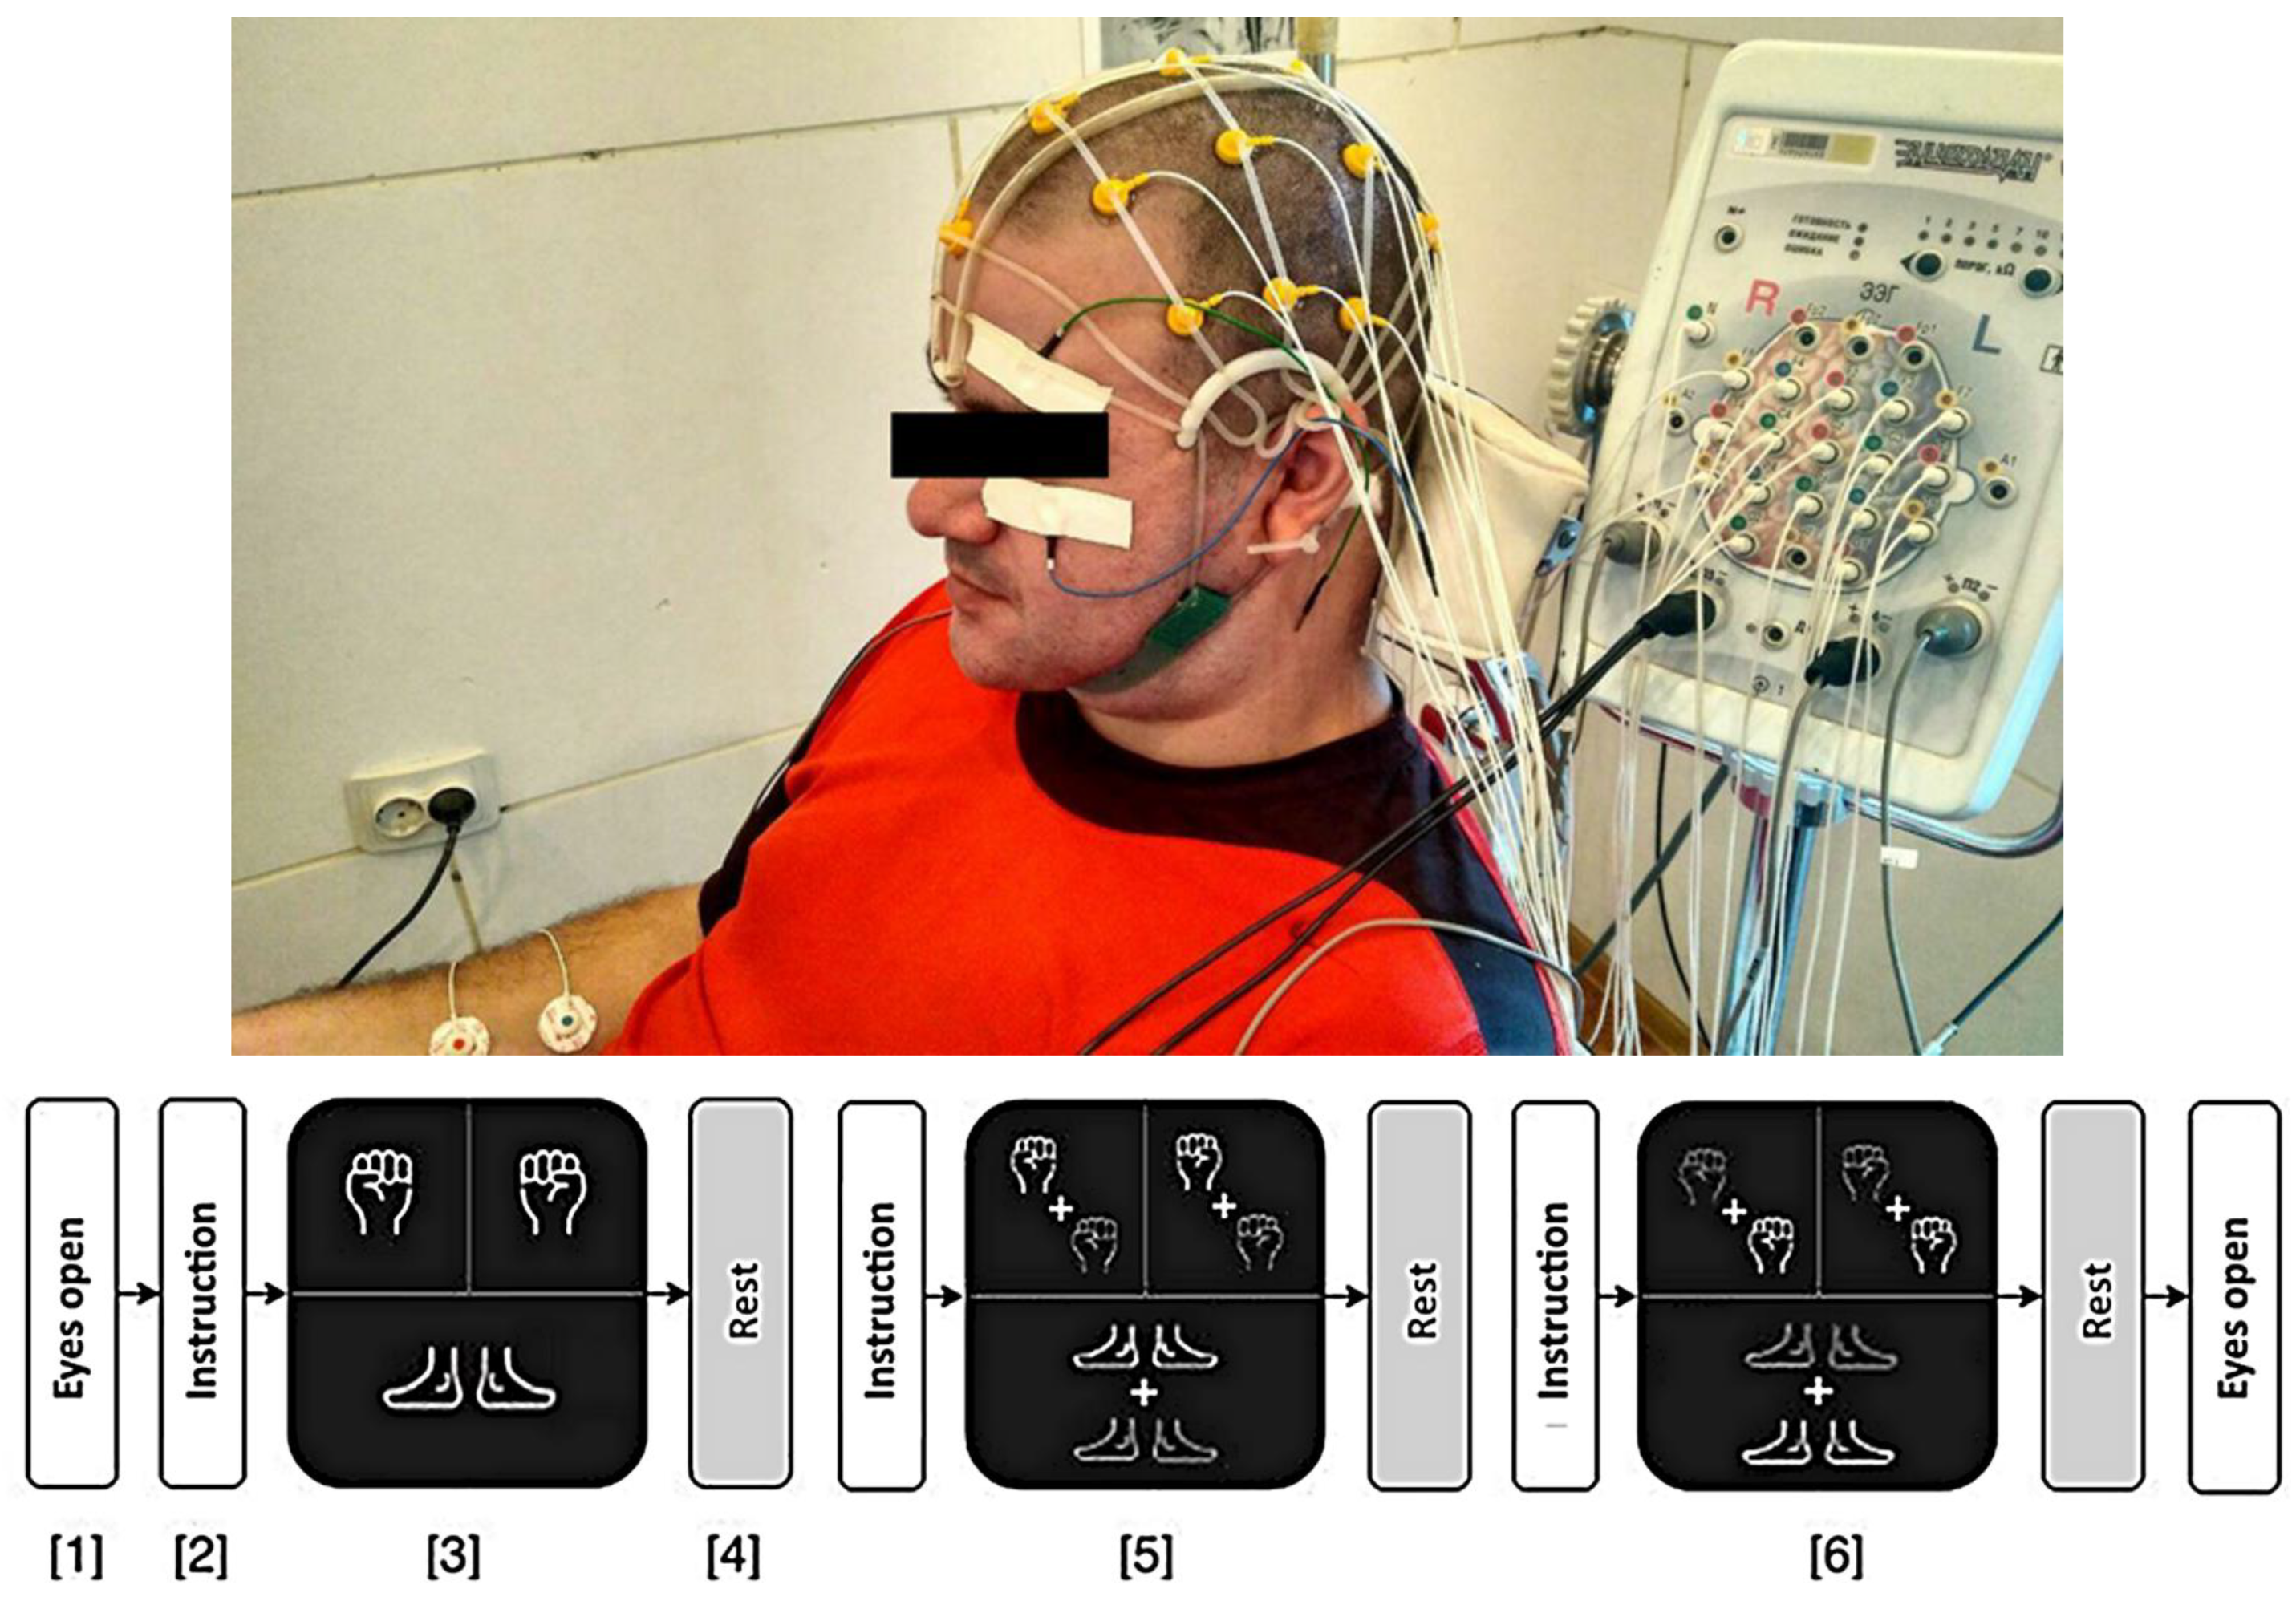
2.2. Experimental Design

The methodology of the experiment included 3 series with a different type of voluntary movements. Each series lasted 180 s and included 15–20 repetitions of each movement execution and motor imagery. Voluntary movement execution took place for 2 s in a random mode with the simultaneous fixation of the gaze on the monitor screen. The target was stationary in the center of the screen to exclude eye movements. Hand movements consisted in compressing the hands into a fist. The movements of the legs were the simultaneous bending and unbending of both feet in the vertical plane. Subjects performed real voluntary movement with their hands and feet in the first series (Figure 1).
In the second series, the subjects performed all the same real movements, but after each of them, they had to reproduce the MI of a specific movement. In other words, the repetition of mental equivalents followed the actual execution of the corresponding movement.
Finally, the MI preceded the actual implementation of the corresponding movement execution in the third series. It was not required to report the beginning or end of the MI. Subsequently, artifacts that affected the quality of the MI EEG patterns (“MI classes”) were removed from the electrograms on the basis of electrooculogram (EOG) signals using the cross-correlation method in series 2 and 3 in each subject (on average: right hand MI (RHMI)—35.9 ± 9.7, left hand MI (LHMI)—35.1 ± 9.1, legs MI (LMI)—32.9 ± 9.2, rest—207.9 ± 55.0).
In total, 1663 artifact-free EEG epochs were analyzed for both resting state and MI classes. The artifact removal method, in turn, did not affect the number of signal epochs, that is, it did not consist in removing fragments of the signal. Rather, it consisted in cleaning the signal using the cross-correlation method (Figure 2). Resting state examples were taken between single trials of MI executions.
EEG signals were recorded using an Encephalan biopotential amplifier (Medicom MTD LLC, Taganrog, Russia) in a room with light and sound insulation. There was a total of 17 channels (F7, F3, Fz, F4, F8, T3, C3, Cz, C4, T4, T5, P3, Pz, P4, T6, O1, O2) according to the international 10–20 system. The sampling rate was 250 Hz. To remove network crosstalk, a notch filter (50 Hz) was used. The surface electromyogram (EMG) of both hands was recorded in the superficial muscles of the hands (m. Brachioradialis, m. Flexor digitorum superficialis) and the legs (m. Tibialis anterior). Brain potentials associated with MI (MI-related potentials) were isolated and accumulated relative to the initiation marks of real movements recorded on the electromyogram channels (EMG).
Events were set after bandpass (0.1–4 Hz) filtering of the EMG. The threshold level of the amplitude of the EMG, the achievement of which the tags were set, was set at 10 µV. The threshold of movement onset was determined at the rising front of the smoothed EMG channels. The EEG epoch for the analysis of MI potentials was 2 s after the completion of myographic activity in series 2 and 2 s before the start of EMG in series 3. An example of such event detection is shown in Figure 3.

2.3. Linear Transformations

To transform feature vectors, linear discriminant analysis (LDA) with singular value decomposition as a solver method and the tolerance for stopping criteria of 10−4 was used. The rest of the parameters were set to their default values provided in Scikit-Learn v. 1.0 for Python programming language [34]. By default, all input values were converted to z-scores.
To highlight the most discriminative frequency ranges the initial feature vector of length 153 (17 channels × 9 frequency bands), the transformation method based on LDA was applied:
  • For each class of movement, a separate model of a 1-component LDA model (transformer) was trained: the training sample included all the examples of the given class and as many resting state signal examples.
  • On the completion of the transformation, 153 values of features collapsed into one, a linear combination, while for each class, there was a specific set of coefficients.
  • After tuning all class-specific transformers, the final feature vector was three-dimensional (one feature for each class).
A schematic of this transformation procedure is shown in Figure 4.
During the complementing search for the most informative segments of the time domain for each two-second segment of each MI, a sample of examples of two classes was artificially created: the considered movement and the resting state signal. The feature vector consisted of the differences between feature vectors of all window combinations with each window having a length of 750 ms and a shift being 100 ms within a given MI signal epoch and a 2 s long background signal epoch. If frequency spectrum features were used, they were converted to three components in the manner described above. Otherwise, from the weights of each frequency LDA transformer, one frequency corresponding to the highest absolute weight value was extracted. Finally, multiband filtering was applied to the signals processed using the frequencies found in the previous step.
The window length of 750 ms was used, since it provided the best classification accuracies (compared to 500 and 1000 ms). In 2 s, 13 different 750 ms windows are accommodated with a 100 ms shift. These windows resulted in 13 examples labeled as the class of a given mental movement. Each of these examples included differences between a particular background window and the 13 windows of a given MI epoch. A total of 13 more examples were labeled background class and included differences between pairs of the background signal epoch windows in the same manner.
Thus, each MI signal epoch was first transformed into a 26 × 153 sample, and then this sample was used to train a two-component LDA-based transformer. To be added to the final sample, each example was transformed as follows: a pseudo-example was created from the differences of the averaged feature vector over all background signal windows and all shifts of the given mental movement example, which was then transformed by a trained two-component LDA. A detailed step-by-step description of this transformation is shown in Figure 5.
The approach to find informative time segments steps are as follows:
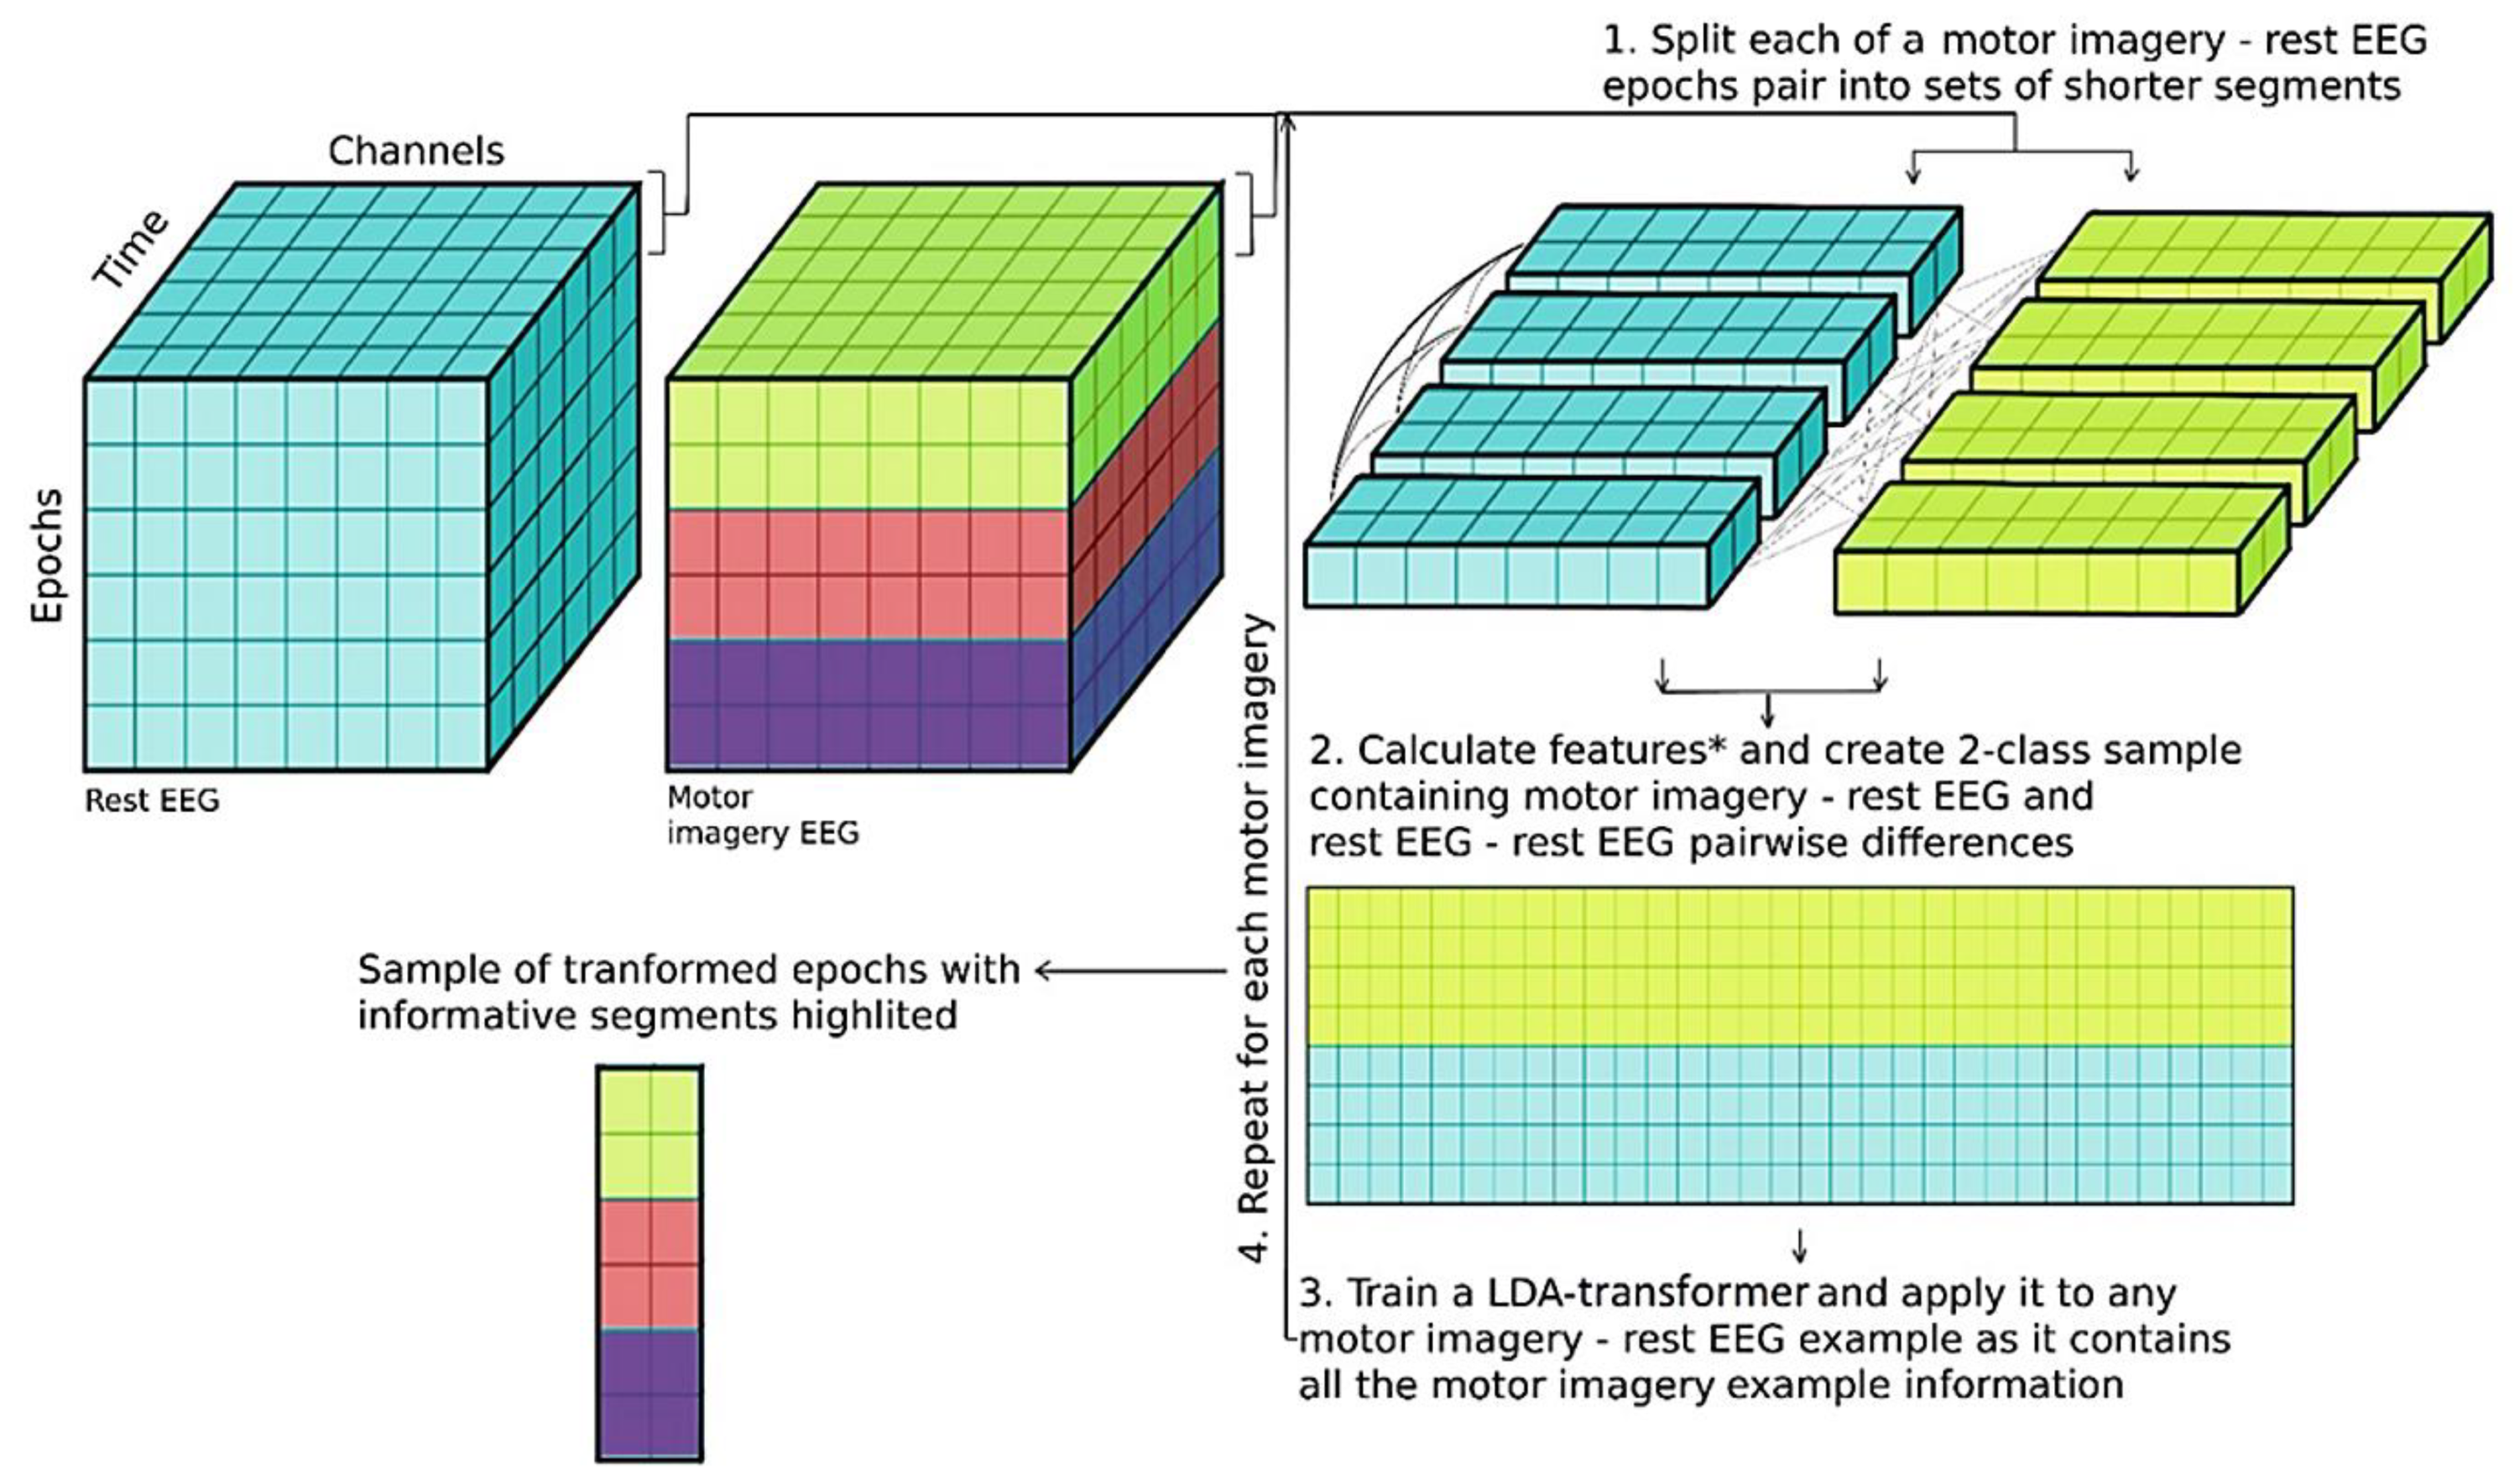
  • A two second long epoch of a single MI and a single randomly chosen two second long epoch of background signal are independently split into windows of lengths of 750 ms with 100 ms shift; this results in 13 windows of the MI and 13 windows of the background signal.
  • Features are computed for each of 26 examples considering the results of previous searches for informatory frequencies for the current subject.
  • The sample of the current MI is formed as follows:
    • Each MI example feature vector is the result of stacking differences between fixed background window features and all the MI windows features (thus, on a smaller scale, the resulting feature vector periodically represents a feature number for each window, and, on larger scale, it represents window number, i.e., time);
    • Each background example feature vector is the result of stacking differences between a fixed background window’s features and all the background windows’ features.
    • The resulting two-class sample is of shape 26 * (13 * n features).
  • An LDA model is trained on the sample obtained.
  • The trained LDA model is applied to the windowed example feature representation of the whole MI example calculated as the result of stacking differences between the averaged background windows feature vector and all the MI window features.
  • The transformed representation of the whole MI is added to the final sample.
  • Steps 1–6 are repeated for each MI.
  • Logistic regression is applied to classify the resulting three-class transformed sample.
To compare this approach using different window lengths with the approach using the whole signal of each MI (2 s), the features were simply calculated using the entire MI signal, considering the most informative frequencies previously found for each subject, as provided in the Figure 5 notes.

2.4. Classification

To perform classification and obtain corresponding accuracy scores, we used the logistic regression implemented in the Scikit-Learn module for the Python programming language [34]. The L2 function was used for penalty; the optimization algorithm was L-BFGS with a tolerance for stopping criteria of 10−4. To optimally set the regularization parameter C, a grid search was performed over the following values: 10−3, 0.01, 0.1, 1, 10. The twofold cross-validation accuracy was then used to evaluate the classification quality. By accuracy score, we mean the simplest definition of accuracy, i.e., the ratio between correct answers of the model and the total number of predictions.
Preliminarily, all feature values were converted to z-scores, and the entire sample of MI examples was randomly mixed. The classification procedure described was applied separately to the three-class data samples of each subject, and the final score was calculated as the mean value of all subjects’ scores.

2.5. Frequency Spectrum Features

Nine biologically significant EEG frequency bands were used: δ or delta (1–3 Hz), θ or theta (3–7 Hz), α or alpha (7–10 Hz), µ or mu (10–13 Hz), β1 or beta-1 (13–25 Hz), β2/γ1 or beta2-gamma1 (25–45 Hz), γ2 or gamma2 (55–70 Hz), γ3 or gamma3 (70–90 Hz), and γ4 or gamma 4 (90–110 Hz). PSDs (power spectral densities) of these bands were calculated with the Welch method (Hanning filtering window, 50% overlap of consecutive windows) [35]. Once the PSDs were calculated, they were converted to the feature vector by summing the PSDs of frequencies lying between the boundaries of each band.

2.6. Frequency Filtering

Frequency filtering was carried out using a Butterworth filter with an infinite impulse response of the fifth order.

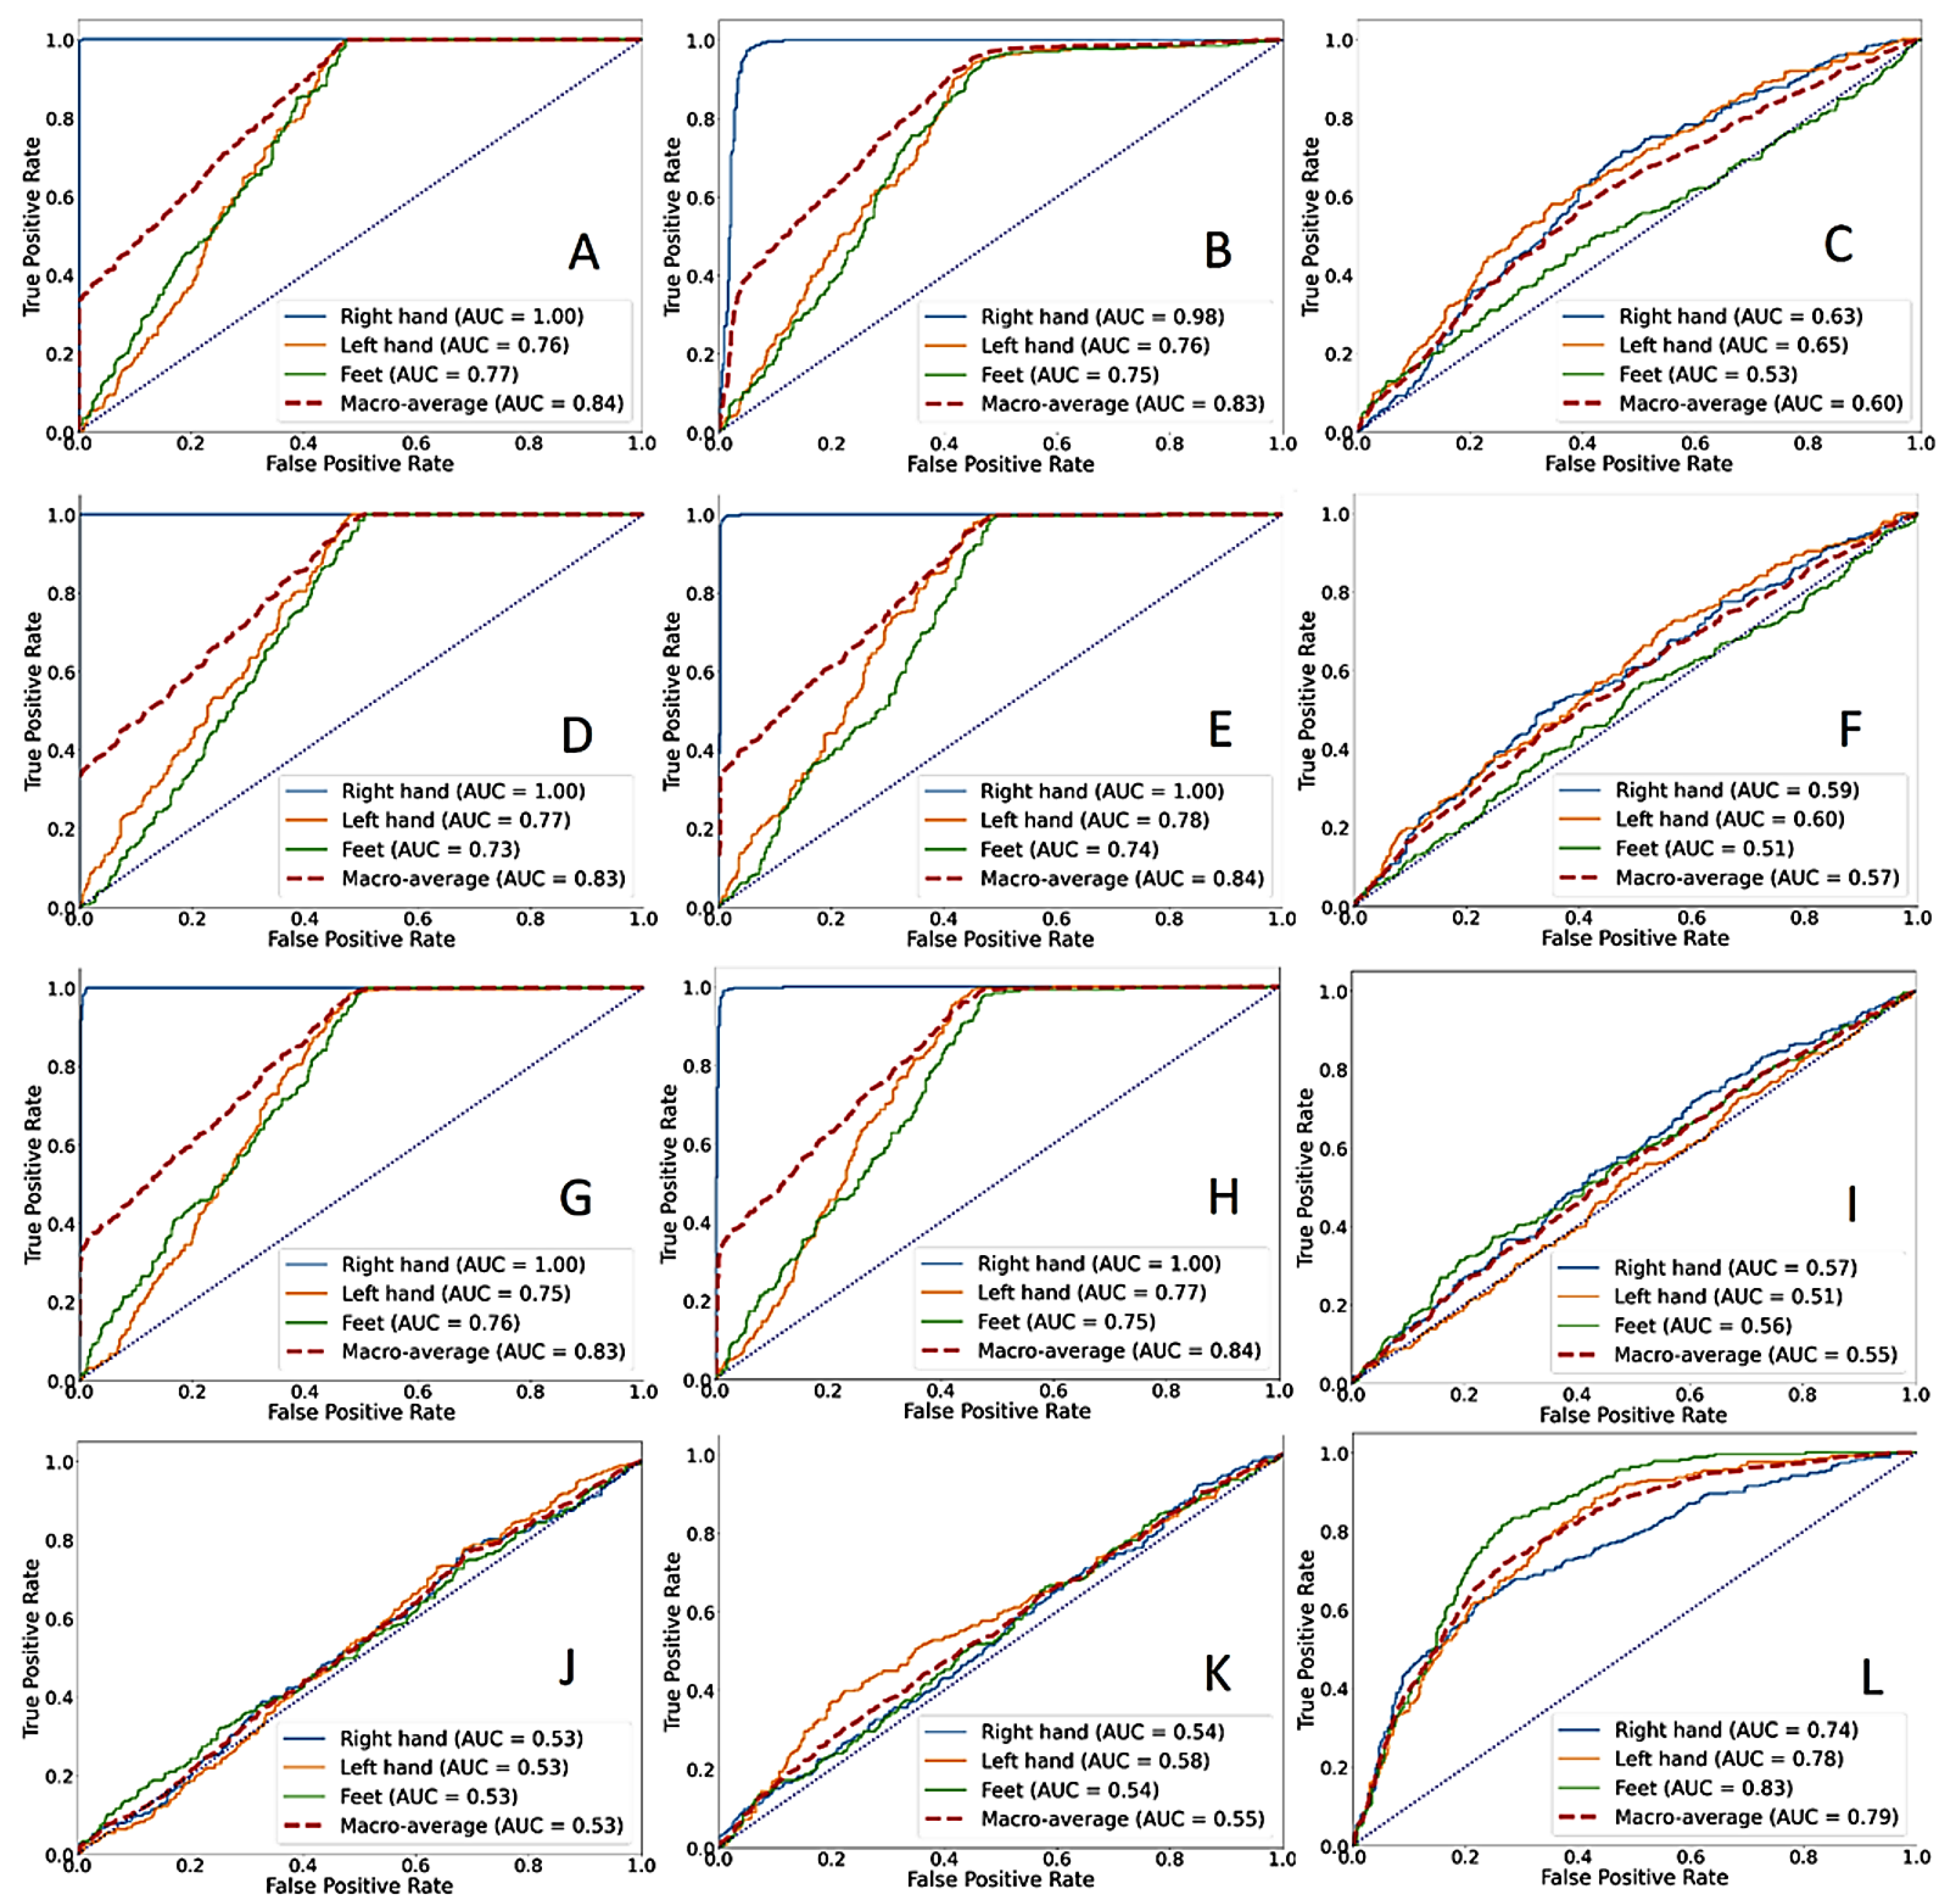
2.7. Receiver Operating Characteristic Curves

To validate the quality of models built on different features and segment lengths, we plotted receiver operating characteristic (ROC) curves. It was carried out using samples of all subjects concatenated after both linear transformations had been applied to the data of each subject independently. The intersubject manner was chosen in order to reduce the number of resulting graphs. First, a logistic regression-based model with parameters described in D. Classification was optimized using the very same approach. The model with the best hyperparameters found was then re-fitted on half of the sample, and the other half was used to obtain the values of the decision function to further construct the ROC curves using the corresponding Scikit-Learn function [34]. The best score of hyperparameter optimization during cross-validation was used as the accuracy of the intersubject classification by the model considered.

3. Results

To perform a comparative analysis, baseline accuracy was obtained with the traditional combination of common spatial pattern (CSP) and a linear classifier [20] (in our case, logistic regression). In addition to the described adjustment of the logistic regression regularization coefficient, the optimal number of CSP filters in the range from 1 to 9 was also selected during cross-validation. In this approach, the resulting accuracy was 51.1 ± 10.8%, that is, even such an efficient and widely used model resulted in quite poor classification.
Next, the algorithm of discriminative frequencies selection, including mu, beta-2, gamma-1, and gamma-2 ranges in the frontal, central, and parietal brain areas was tested. The best linear combination of the bands considered was determined for each MI class in order to provide the most accurate discrimination between its signal epochs and the background signal epochs. However, it also improved the discrimination between three MI classes themselves: after applying such a transformation, the accuracy increased to 65.4 ± 9.1%. Furthermore, this transformation allows one to reduce the dimensionality of the feature vector by more than 50 times, resulting in higher computational efficiency and compact feature space representation [36]. Additionally, Hjorth parameters [37] and pairwise interchannel correlation coefficients were used to form feature vectors. When Hjorth parameters were used, the accuracy of classification was 53.9 ± 11.4%; use of correlation coefficients led to the classification accuracy of 53.7 ± 8.2% (Table 1).
Further refinement was the addition of the search for the most informatory time intervals within 2 s in each mental movement act. Since the onset and duration of MI execution were quite voluntary, it is reasonable to find the informatory time interval for each MI act. Three types of features were used to test this approach: power spectral densities, Hjorth parameters, and coefficients of pairwise interchannel correlation. The resulting classification accuracies are listed in Table 2.
The decrease in accuracy according to the PSD features obtained for shorter windows was probably due to the use of fewer data points rather than all 2 s, which leads to poorer spectra. However, it can be argued that the sequential determination of discriminative frequency ranges and informatory time segments, although using different features, leads to an improvement in the classification results. Indeed, according to Table 2, the highest accuracy among all subjects was obtained using 750 ms windows and coefficients of pairwise interchannel correlation as features.
It is also clearly shown in Table 2 and Table 3 that using shorter windows is advantageous compared to using the entire 2 s epochs if coefficients of pairwise interchannel correlation or Hjorth parameters are used as features.
The ROC curves and AUC scores calculated for the transformed sample of all subjects after the completion of the search for discriminative time segments do not allow us to clearly see which window length is the most advantageous. However, according to the best features (coefficients of pairwise interchannel correlation and Hjorth parameters) and segments of lengths of up to 1000 ms (Figure 6A,B,D,E,G,H) providing the highest intersubject accuracies, a window of 750 ms seems to be somewhat optimal. Indeed, for the former features, 500 ms is somewhat better than comparable 750 and 1000 ms, whereas, for the latter, 750 ms along with 1000 ms is superior to 500 ms. Moreover, according to the averaged intrasubject accuracy (Table 2), the window of 750 ms is definitely superior.
It is noteworthy that the signals of each MI class are processed independently, but an improvement in accuracy is still observed when they are combined again, that is, the method is able to identify general patterns. Moreover, this also leads to the accuracy rate of the intersubject classification being comparable (Table 3) to that of the intrasubject classification (Table 2). Among its advantages, one can also note the resistance to noise, since, in the process of its operation, all pairwise combinations of background windows and the MI signal are used. The classification accuracies for the different features used and the approaches implemented are summarized in Table 1 and Table 2. Scatter plots with axes being the LDA components obtained are shown in Figure 7 and Figure 8 for the Hjorth parameters and cross-channel correlations, respectively.
One can clearly see that the right-hand MI is almost completely discriminated from other MIs, which is more likely due to the most subjects being right-handed and is also reflected in the ROC scores shown in Figure 6.

4. Discussion

Currently, the methods of spontaneous EEG analysis, including both linear classifiers [38] and artificial neural networks (ANN), have become quite widespread for solving neural communication problems [23,39]. The results of the comparative analysis, on the one hand, show the superiority of nonlinear neural network algorithms over linear ones, primarily in terms of the efficiency of their functioning and adaptive settings [40,41,42]. This is achieved, in particular, through the development of new neural network methods [43] that integrate extensive customization capabilities and advantages of various approaches that can effectively detect specific and invariant MI patterns of bioelectric brain activity. On the other hand, linear classifiers are still a clear and easy-to-interpret method; in addition, they form a low computational load. However, since quasi-stationary EEG can lead to nonlinear discriminant functions, this type of classification does not always show high accuracy of detecting control commands in the BCI circuit. In this regard, improving the accuracy of linear methods requires an additional method of preprocessing and highlighting significant features for invariant EEG patterns [44].
The results of EEG-based multiclass MI pattern classification in the methodology and approach developed by us showed that the method is capable of increasing the accuracy (up to 71.6 ± 3.9%) of detecting randomly generated control commands in the BCI circuit. The results obtained are consistent with the already available data, indicating that neural interfaces exploiting mental equivalents of real movement execution (MI) and various approaches for solving neurofeedback problems are able to provide a reliable and effective nonmuscular communication channel. However, it requires the development of new user training techniques and scenarios, as well as thorough training and adaptation of methods themselves [45,46] to ensure a reliable and fast integration of technical units into the somatosensory map of the human body.
Finally, our results are in good agreement with the well-researched characteristics of event-related desynchronization (ERD) and synchronization (ERS) phenomena in the mu- and beta-rhythms of the EEG. They are primarily considered events that reflect the performance of MI or mental movements [5,47]. The ERD phenomenon develops not only when performing a movement execution, but also when the subject only mentally imagines movement or sensation in a certain part of the body [48,49]. At the same time, the authors note a characteristic somatotopic localization of the effects: the ERD effect is more pronounced in the contralateral hemisphere of the working hand [50].
These EEG phenomena are usually obtained statistically by averaging EEG signals recorded in different mental tasks identical in content and other characteristics by a group of subjects in the field of classical EEG frequencies corresponding to lower (delta, theta, alpha (mu)), or higher (beta and gamma) rhythms. The analysis of single events in the EEG, in turn, is relatively rarely used, especially at short time intervals [25,51]. Comparative analysis has shown [52,53,54] that by single implementations of short (up to 500 ms) EEG segments, it is possible to identify the type of visual stimulus that indicates, for example, the direction of movement and the areas of the brain involved in its processing. In addition, even shorter EEG epochs (up to 200 ms) may be sufficient in identifying the readiness potential, indicating the lateralization of the upcoming motor act. However, analysis epochs of at least 500–700 ms are considered to be the most reliable for identifying motor intent [51,55].
We have also shown earlier [12,56] that mental representation of movements leads to additional activation, not only of the central motor cortex but also of the frontal and temporal cortical areas. At the same time, sufficiently pronounced phenomena associated with motor imagination were recorded at gamma frequencies. We believe that the increase in the power of gamma oscillations can be considered as a reflection of the intensification of specific information processes associated with voluntary forms of motor behavior regulation. The specificity of these changes is indicated, in particular, by their close connection with the target areas of the cortex that are contralateral to the MI that is performed, as well as those involved in the formation of spatial images and their relationships.
This fact is confirmed by studies performed using fMRI and MEG methods, which demonstrated the effects of local growth of high-frequency gamma activity within the somatosensory cortex in the task of MI repetition [57,58]. Thus, the EEG phenomena associated with MI are quite diverse and require thorough and extensive consideration when creating high-quality classification algorithms for BCIs.

5. Conclusions

Thus, in this study, it was observed that the MI activity of the brain is accompanied by a number of electrographic phenomena that can be used in BCIs. Motor imaginations are used by a number of groups [1,42] to create prototypes of such systems, and in terms of efficiency (reliability, speed control, etc.), they are not inferior to systems operating on other phenomena, particularly on the basis of P300-evoked potentials. Their significant advantage is that, on the one hand, they do not require external stimuli and are associated with more local cortical phenomena than other types of cognitive activity, and, on the other hand, they are distinguished by a relatively short duration, which is essential for creating real-time systems. Nevertheless, it is currently possible to form a fairly limited alphabet of MI control commands. This apparently is due both to the lack of skills of effective MI activity in a person, with the exception of mental or inner speech [59], as well as to the complexity of classifying electrographic patterns correlating with visual and proprioceptive types of MI [60,61]. The development of such classifiers is an urgent task that many groups of researchers are currently working on.
It is obvious that such important factors as increasing the reliability of methods for detecting and classifying invariant EEG patterns generated by the user in voluntary and anthropomorphic mode directly affect the development of BCI technology. The successful solution of these problems can determine the overall effectiveness and stability of neural communication systems, which will contribute to the rapid spread of technology among paralyzed individuals. The demand for these technologies is quite high, both in the framework of scientific research and in the mass consumer market to solve the problems of monitoring the functional state of a person, as well as the formation of a new nonmuscular, auxiliary control channel for external devices for various purposes [62,63].
In this paper, it was experimentally demonstrated that the problem of classifying MI EEG patterns or equivalents of real movements can be solved effectively by searching for specific frequency ranges that are individual for the subject. At the same time, the sequential limitation of the time window of EEG epochs within the framework of the procedure for finding the best time segment containing target MI patterns additionally contributed to an increase in the accuracy of classification. In particular, the best classification accuracy of 71.6 ± 3.9% was obtained when (a) the search for discriminative frequency bands was performed using power spectral density features, (b) the search for discriminative time segments was performed on the basis of interchannel correlation coefficient features applied to the signal filtered in the bands found during the previous step (three best frequency bands by absolute values of their weights in the linear combinations), and (c) logistic regression was used to classify the transformed data from the previous step.
In addition, as part of the development of successful classification models suitable for practical use in the end-user environment, it is necessary to solve the additional task of significantly improving and developing the experimental paradigm of training subjects in the neural interface circuit. These preliminary results obtained by us will become the basis for the development of an adaptive approach in BCI technology. In particular, new methods of deep and machine learning will facilitate the improvement of the accuracy of the classification of MI execution. The development of such models is the subject of our current work.

Author Contributions

A.S.: software and validation, writing—draft preparation; I.S.: conceptualization, methodology; D.S.: visualization, investigation; D.L.: data collection, writing—draft preparation; V.K.: reviewing and editing. All authors have read and agreed to the published version of the manuscript.

Funding

The research was supported by the Russian Science Foundation (project no. 20-19-00627).

Institutional Review Board Statement

In accordance with the ethical standards of the 1964 Helsinki Declaration and its later amendments, as well as the ethics committee of Southern Federal University, all volunteers signed a voluntary consent protocol (approved 6 April 2017 (no. 3.17)).

Informed Consent Statement

Informed consent was obtained from all subjects involved in the study.

Data Availability Statement

Provided by the first author upon request.

Acknowledgments

The authors express their gratitude to the Southern Federal University Strategic Academic Leadership Program (“Priority 2030”) for providing an experimental base for conducting research. We thank our two anonymous Reviewers for their useful comments on this paper.

Conflicts of Interest

The authors declare that they have no conflict of interest.

References

  1. Frolov, A.A.; Bobrov, P.D. Brain–Computer Interfaces: Neurophysiological Bases and Clinical Applications. Neurosci. Behav. Physiol. 2018, 48, 1033–1040. [Google Scholar] [CrossRef]
  2. Mane, R.; Chouhan, T.; Guan, C. BCI for stroke rehabilitation: Motor and beyond. J. Neural Eng. 2020, 17, 041001. [Google Scholar] [CrossRef] [PubMed]
  3. Lazurenko, D.; Kiroy, V.N.; Shepelev, I.E.; Podladchikova, L.N. Motor Imagery-based Brain-Computer Interface: Neural Network Approach. Opt. Mem. Neural Netw. 2019, 28, 109–117. [Google Scholar] [CrossRef]
  4. Khan, M.A.; Das, R.; Iversen, H.K.; Puthusserypady, S. Review on motor imagery based BCI systems for upper limb post-stroke neurorehabilitation: From designing to application. Comput. Biol. Med. 2020, 123, 103843. [Google Scholar] [CrossRef] [PubMed]
  5. Pfurtscheller, G. S5: Movement-related desynchronization and resting state sensorimotor networks. Clin. Neurophysiol. 2014, 125, S2. [Google Scholar] [CrossRef]
  6. Pfurtscheller, G.; Neuper, C. Future prospects of ERD/ERS in the context of brain–computer interface (BCI) developments. Prog. Brain Res. 2006, 159, 433–437. [Google Scholar] [CrossRef]
  7. Yao, L.; Sheng, X.; Zhang, D.; Jiang, N.; Farina, D.; Zhu, X. A BCI System Based on Somatosensory Attentional Orientation. IEEE Trans. Neural Syst. Rehabil. Eng. 2017, 25, 81–90. [Google Scholar] [CrossRef] [Green Version]
  8. Neuper, C.; Scherer, R.; Wriessnegger, S.; Pfurtscheller, G. Motor imagery and action observation: Modulation of sensorimotor brain rhythms during mental control of a brain—computer interface. Clin. Neurophysiol. 2009, 120, 239–247. [Google Scholar] [CrossRef]
  9. Friedrich, E.V.; McFarland, D.J.; Neuper, C.; Vaughan, T.M.; Brunner, P.; Wolpaw, J.R. A scanning protocol for a sensorimotor rhythm-based brain–computer interface. Biol. Psychol. 2009, 80, 169–175. [Google Scholar] [CrossRef] [Green Version]
  10. McFarland, D.J.; Krusienski, D.J.; Sarnacki, W.A.; Wolpaw, J.R. Emulation of computer mouse control with a noninvasive brain–computer interface. J. Neural Eng. 2008, 5, 101–110. [Google Scholar] [CrossRef]
  11. Markazi, S.A.; Qazi, S.; Stergioulas, L.S.; Ramchurn, A.; Bunce, D. Wavelet Filtering of the P300 Component in Event-Related Potentials. In Proceedings of the 2007 29th Annual International Conference of the IEEE Engineering in Medicine and Biology Society, Lyon, France, 23–26 August 2007; Volume 1, pp. 1719–1722. [Google Scholar] [CrossRef]
  12. Kiroi, V.N.; Vladimirskii, B.M.; Aslanyan, E.V.; Bakhtin, O.M.; Minyaeva, N.R. Electrographic Correlates of Actual and Imagined Movements: Spectral Analysis. Neurosci. Behav. Physiol. 2012, 42, 21–27. [Google Scholar] [CrossRef]
  13. McFarland, D.J.; McCane, L.M.; David, S.; Wolpaw, J. Spatial filter selection for EEG-based communication. Electroencephalogr. Clin. Neurophysiol. 1997, 103, 386–394. [Google Scholar] [CrossRef]
  14. Garrett, D.; Peterson, D.; Anderson, C.; Thaut, M. Comparison of linear, nonlinear, and feature selection methods for EEG signal classification. IEEE Trans. Neural Syst. Rehabilit. Eng. 2003, 11, 141–144. [Google Scholar] [CrossRef]
  15. Peterson, D.A.; Knight, J.N.; Kirby, M.J.; Anderson, C.W.; Thaut, M.H. Feature Selection and Blind Source Separation in an EEG-Based Brain-Computer Interface. EURASIP J. Adv. Signal Process. 2005, 2005, 218613. [Google Scholar] [CrossRef] [Green Version]
  16. Attallah, O.; Abougharbia, J.; Tamazin, M.; Nasser, A.A. A BCI System Based on Motor Imagery for Assisting People with Motor Deficiencies in the Limbs. Brain Sci. 2020, 10, 864. [Google Scholar] [CrossRef]
  17. Allison, B.Z.; Cho, W.; Ortner, R.; Heilinger, A.; Edlinger, G.; Guger, C. Validation of a Brain-Computer Interface (BCI) System Designed for Patients with Disorders of Consciousness (DOC): Regular and Sham Testing with Healthy Participants. In Lecture Notes in Computer Science—Leibniz Center for Informatics; Springer: Cham, Germany, 2017; pp. 253–265. [Google Scholar] [CrossRef]
  18. Jiang, L.; Stocco, A.; Losey, D.M.; Abernethy, J.A.; Prat, C.S.; Rao, R.P.N. BrainNet: A Multi-Person Brain-to-Brain Interface for Direct Collaboration Between Brains. Sci. Rep. 2019, 9, 1–11. [Google Scholar] [CrossRef] [Green Version]
  19. Kruse, A.; Suica, Z.; Taeymans, J.; Schuster-Amft, C. Effect of brain-computer interface training based on non-invasive electroencephalography using motor imagery on functional recovery after stroke—A systematic review and meta-analysis. BMC Neurol. 2020, 20, 1–14. [Google Scholar] [CrossRef]
  20. Wu, S.-L.; Wu, C.-W.; Pal, N.R.; Chen, C.-Y.; Chen, S.-A.; Lin, C.-T. Common spatial pattern and linear discriminant analysis for motor imagery classification. In Proceedings of the 2013 IEEE Symposium on Computational Intelligence, Cognitive Algorithms, Mind, and Brain (CCMB), Singapore, 16–19 April 2013; pp. 146–151. [Google Scholar] [CrossRef]
  21. Birbaumer, N.; Kübler, A.; Ghanayim, N.; Hinterberger, T.; Perelmouter, J.; Kaiser, J.; Iversen, I.; Kotchoubey, B.; Neumann, N.; Flor, H. The thought translation device (TTD) for completely paralyzed patients. IEEE Trans. Rehabilit. Eng. 2000, 8, 190–193. [Google Scholar] [CrossRef] [Green Version]
  22. Kiroy, V.N.; Lazurenko, D.; Shepelev, I.E.; Minyaeva, N.R.; Aslanyan, E.V.; Bakhtin, O.M.; Shaposhnikov, D.; Vladimirskiy, B.M. Changes in EEG spectral characteristics in the course of neurofeedback training. Hum. Physiol. 2015, 41, 269–279. [Google Scholar] [CrossRef]
  23. Shepelev, I.E.; Lazurenko, D.; Kiroy, V.N.; Aslanyan, E.V.; Bakhtin, O.M.; Minyaeva, N.R. A Novel Neural Network Approach to Creating a Brain–Computer Interface Based on the EEG Patterns of Voluntary Muscle Movements. Neurosci. Behav. Physiol. 2018, 48, 1145–1157. [Google Scholar] [CrossRef]
  24. Selim, S.; Tantawi, M.M.; Shedeed, H.A.; Badr, A. A csp\am-ba-svm approach for motor imagery bci system. IEEE Access 2018, 6, 49192–49208. [Google Scholar] [CrossRef]
  25. Tang, Z.; Li, C.; Sun, S. Single-trial EEG classification of motor imagery using deep convolutional neural networks. Optik 2017, 130, 11–18. [Google Scholar] [CrossRef]
  26. Aggarwal, S.; Chugh, N. Signal processing techniques for motor imagery brain computer interface: A review. Array 2019, 1–2, 100003. [Google Scholar] [CrossRef]
  27. Zhang, Y.; Chen, W.; Lin, C.L.; Pei, Z.; Chen, J.; Chen, Z. Boosting-LDA algriothm with multi-domain feature fusion for mo-tor imagery EEG decoding. Biomed. Signal Processing Control 2021, 70, 102983. [Google Scholar] [CrossRef]
  28. Tyagi, A.; Nehra, V. Classification of motor imagery EEG signals using SVM, k-NN and ANN. CSI Trans. ICT 2016, 4, 135–139. [Google Scholar] [CrossRef]
  29. Mohamed, E.A.; Yusoff, M.Z.; Malik, A.S.; Bahloul, M.R.; Adam, D.M.; Adam, I.K. Comparison of EEG signal decomposition methods in classification of motor-imagery BCI. Multimedia Tools Appl. 2018, 77, 21305–21327. [Google Scholar] [CrossRef]
  30. Shankar, A.; Muttan, S.; Vaithiyanathan, D. Signal Processing and Classification for Electroencephalography Based Motor Imagery Brain Computer Interface. J. Med. Imaging Health Inform. 2021, 11, 2918–2927. [Google Scholar] [CrossRef]
  31. Ma, T.; Wang, S.; Xia, Y.; Zhu, X.; Evans, J.; Sun, Y.; He, S. CNN-based classification of fNIRS signals in motor imagery BCI system. J. Neural Eng. 2021, 18, 056019. [Google Scholar] [CrossRef]
  32. Zhang, Z.; Duan, F.; Solé-Casals, J.; Dinares-Ferran, J.; Cichocki, A.; Yang, Z.; Sun, Z. A Novel Deep Learning Approach With Data Augmentation to Classify Motor Imagery Signals. IEEE Access Digit. Object Identifier 2019, 15945. [Google Scholar] [CrossRef]
  33. Hou, Y.; Zhou, L.; Jia, S.; Lun, X. A novel approach of decoding EEG four-class motor imagery tasks via scout ESI and CNN. J. Neural Eng. 2019, 17, 016048. [Google Scholar] [CrossRef]
  34. Pedregosa, F.; Varoquaux, G.; Gramfort, A.; Michel, V.; Thirion, B.; Grisel, O.; Duchesnay, E. Scikit-learn: Machine Learning in Python. J. Mach. Learn. Res. 2011, 12, 2825–2830. [Google Scholar]
  35. Welch, P.D. The use of fast Fourier transform for the estimation of power spectra: A method based on time averaging over short, modified periodograms. IEEE Trans. Audio Electroacoust. 1967, 15, 70–73. [Google Scholar] [CrossRef] [Green Version]
  36. Wang, J.; Feng, Z.; Lu, N.; Luo, J. Toward optimal feature and time segment selection by divergence method for EEG signals classification. Comput. Biol. Med. 2018, 97, 161–170. [Google Scholar] [CrossRef]
  37. Hjorth, B. EEG analysis based on time domain properties. Electroencephalogr. Clin. Neurophysiol. 1970, 29, 306–310. [Google Scholar] [CrossRef]
  38. Jusas, V.; Samuvel, S.G. Classification of Motor Imagery Using Combination of Feature Extraction and Reduction Methods for Brain-Computer Interface. Inf. Technol. Control 2019, 48, 225–234. [Google Scholar] [CrossRef] [Green Version]
  39. Craik, A.; He, Y.; Contreras-Vidal, J.L. Deep learning for electroencephalogram (EEG) classification tasks: A review. J. Neural Eng. 2019, 16, 031001. [Google Scholar] [CrossRef]
  40. Gao, Z.; Wang, X.; Yang, Y.; Mu, C.; Cai, Q.; Dang, W.; Zuo, S. EEG-Based Spatio–Temporal Convolutional Neural Network for Driver Fatigue Evaluation. IEEE Trans. Neural Netw. Learn. Syst. 2019, 30, 2755–2763. [Google Scholar] [CrossRef]
  41. Xu, G.; Shen, X.; Chen, S.; Zong, Y.; Zhang, C.; Yue, H.; Liu, M.; Chena, F.; Che, W. A Deep Transfer Convolutional Neural Network Framework for EEG Signal Classification. IEEE Access 2019, 7, 112767–112776. [Google Scholar] [CrossRef]
  42. Chaudhary, S.; Taran, S.; Bajaj, V.; Sengur, A. Convolutional Neural Network Based Approach Towards Motor Imagery Tasks EEG Signals Classification. IEEE Sens. J. 2019, 19, 4494–4500. [Google Scholar] [CrossRef]
  43. Dai, G.; Zhou, J.; Huang, J.; Wang, N. HS-CNN: A CNN with hybrid convolution scale for EEG motor imagery classification. J. Neural Eng. 2019, 17, 016025. [Google Scholar] [CrossRef]
  44. Shah, S.A.A.; Zhang, L.; Bais, A. Dynamical system based compact deep hybrid network for classification of Parkinson disease related EEG signals. Neural Netw. 2020, 130, 75–84. [Google Scholar] [CrossRef] [PubMed]
  45. Khan, J.; Bhatti, M.H.; Khan, U.G.; Iqbal, R. Multiclass EEG motor-imagery classification with sub-band common spatial patterns. EURASIP J. Wirel. Commun. Netw. 2019, 2019, 174. [Google Scholar] [CrossRef] [Green Version]
  46. Jochumsen, M.; Knoche, H.; Kjaer, T.W.; Dinesen, B.; Kidmose, P. EEG Headset Evaluation for Detection of Single-Trial Movement Intention for Brain-Computer Interfaces. Sensors 2020, 20, 2804. [Google Scholar] [CrossRef] [PubMed]
  47. Nam, C.S.; Jeon, Y.; Kim, Y.-J.; Lee, I.; Park, K. Movement imagery-related lateralization of event-related (de)synchronization (ERD/ERS): Motor-imagery duration effects. Clin. Neurophysiol. 2011, 122, 567–577. [Google Scholar] [CrossRef]
  48. Kaiser, V.; Bauernfeind, G.; Kreilinger, A.; Kaufmann, T.; Kübler, A.; Neuper, C.; Müller-Putz, G. Cortical effects of user training in a motor imagery based brain–computer interface measured by fNIRS and EEG. NeuroImage 2014, 85, 432–444. [Google Scholar] [CrossRef]
  49. McFarland, D.J.; Sarnacki, W.A.; Wolpaw, J. Effects of training pre-movement sensorimotor rhythms on behavioral performance. J. Neural Eng. 2015, 12, 066021. [Google Scholar] [CrossRef]
  50. Lorey, B.; Naumann, T.; Pilgramm, S.; Petermann, C.; Bischoff, M.; Zentgraf, K.; Stark, R.; Vaitl, D.; Munzert, J. How equivalent are the action execution, imagery, and observation of intransitive movements? Revisiting the concept of somatotopy during action simulation. Brain Cogn. 2013, 81, 139–150. [Google Scholar] [CrossRef]
  51. Velu, P.D.; De Sa, V.R. Single-trial classification of gait and point movement preparation from human EEG. Front. Neurosci. 2013, 7, 84. [Google Scholar] [CrossRef] [Green Version]
  52. de Peralta Menendez, R.G.; Andino, S.G.; Ferrez, P.W.; Millán, J.D.R. 16 Noninvasive Estimates of Local Field Potentials for Brain-Computer Interfaces. In Toward Brain-Computer Interfacing; MIT Press: Cambridge, UK, 2007; ISBN 9780262042444. [Google Scholar]
  53. O’Shea, H.; Moran, A. To go or not to go? Pupillometry elucidates inhibitory mechanisms in motor imagery. J. Cogn. Psychol. 2018, 30, 466–483. [Google Scholar] [CrossRef]
  54. Delisle-Rodriguez, D.; Cardoso, V.; Gurve, D.; Loterio, F.; Romero-Laiseca, M.A.; Krishnan, S.; Bastos-Filho, T. System based on subject-specific bands to recognize pedaling motor imagery: Towards a BCI for lower-limb rehabilitation. J. Neural Eng. 2019, 16, 056005. [Google Scholar] [CrossRef] [Green Version]
  55. Gonzalez, S.L.; De Peralta, R.G.; Thut, G.; Millán, J.D.R.; Morier, P.; Landis, T. Very high frequency oscillations (VHFO) as a predictor of movement intentions. NeuroImage 2006, 32, 170–179. [Google Scholar] [CrossRef] [PubMed] [Green Version]
  56. Lazurenko, D.M.; Kiroy, V.N.; Aslanyan, E.V.; Shepelev, I.E.; Bakhtin, O.M.; Minyaeva, N.R. Electrographic Properties of Movement-Related Potentials. Neurosci. Behav. Physiol. 2018, 48, 1078–1087. [Google Scholar] [CrossRef]
  57. Smith, M.M.; Weaver, K.E.; Grabowski, T.J.; Rao, R.P.N.; Edarvas, F. Non-invasive detection of high gamma band activity during motor imagery. Front. Hum. Neurosci. 2014, 8, 817. [Google Scholar] [CrossRef] [PubMed]
  58. Mashat, M.E.M.; Lin, C.-T.; Zhang, D. Effects of Task Complexity on Motor Imagery-Based Brain–Computer Interface. IEEE Trans. Neural Syst. Rehabilit. Eng. 2019, 27, 2178–2185. [Google Scholar] [CrossRef]
  59. Kiroy, V.; Bakhtin, O.; Krivko, E.; Lazurenko, D.; Aslanyan, E.; Shaposhnikov, D.; Shcherban, I. Spoken and Inner Speech-related EEG Connectivity in Different Spatial Direction. Biomed. Signal Process. Control 2021, 71, 103224. [Google Scholar] [CrossRef]
  60. Thomas, K.P.; Guan, C.; Lau, C.T.; Vinod, A.P.; Ang, K.K. Adaptive tracking of discriminative frequency components in electroencephalograms for a robust brain–computer interface. J. Neural Eng. 2011, 8, 036007. [Google Scholar] [CrossRef]
  61. Yang, B.H.; Wu, T.; Wang, Q.; Han, Z.J. Motor Imagery EEG Recognition Based on WPD-CSP and KF-SVM in Brain Computer Interfaces. Appl. Mech. Mater. 2014, 556–562, 2829–2833. [Google Scholar] [CrossRef]
  62. Freudenburg, Z.V.; Branco, M.; Leinders, S.; Van Der Vijgh, B.H.; Pels, E.G.M.; Denison, T.; Berg, L.H.V.D.; Miller, K.J.; Aarnoutse, E.J.; Ramsey, N.F.; et al. Sensorimotor ECoG Signal Features for BCI Control: A Comparison between People with Locked-In Syndrome and Able-Bodied Controls. Front. Neurosci. 2019, 13, 1058. [Google Scholar] [CrossRef]
  63. Belkacem, A.N.; Jamil, N.; Palmer, J.A.; Ouhbi, S.; Chen, C. Brain Computer Interfaces for Improving the Quality of Life of Older Adults and Elderly Patients. Front. Neurosci. 2020, 14, 692. [Google Scholar] [CrossRef]
Figure 1. Timing representation of a scenario with the participation of volunteers in the task of movement execution (ME) and motor imagery (MI). (1)—rest with eyes open (EO, 60 s); (2)—instructions, 60 s; (3)—series 1 (ME) (180 s), (4)—rest after series 1, 60 s; (5)—series 2 (ME + MI) (180 s), (6)—series 3 (MI + ME) (180 s).
Applsci 12 02736 g001
Figure 2. Artifact removal example. (A) Raw signal containing artifacts. (B) Signal with artifacts removed. Channels 1–3 are EMG channels for the right hand, left hand, and feet, respectively, and channel 4 is EOG.
Applsci 12 02736 g002
Figure 3. Real movement detection (left hand) detection using the EMG signal. (A) Raw EEG and EMG data. (B) 1–4 Hz filtered EEG and EMG data for movement onset detection. The blue label “5” at almost 00:17:56 is the detected onset of the movement in channel 2, where the absolute value of the filtered signal first exceeded 10 µV. Ellipsis indicates the channels skipped for more compact representation. Other designations are adopted from Figure 2.
Applsci 12 02736 g003
Figure 4. The procedure of transformation for finding informative frequencies.
Applsci 12 02736 g004
Figure 5. The transformation procedure for finding informative segments. * If the power spectral density features are used, then the spectrum is computed, and the previously trained informative frequency LDA transformers are applied; otherwise, if Hjorth parameters or interchannel correlation coefficients are used as features, 3 frequency bands corresponding to the largest absolute values of the previously trained informative frequency LDA transformers weights are extracted, and then multiband frequency filtering is performed, and features are calculated.
Applsci 12 02736 g005
Figure 6. ROC curves obtained in the approach according to the search for informative frequencies and segments for different features (first column (graphs A,D,G,J)—coefficients of pairwise interchannel correlation, second column (graphs B,E,H,K)—Hjorth parameters, third column (graphs C,F,I,L)—PSD) and window lengths (first row (graphs AC)—500 ms, second row (graphs DF)—750 ms, third row (graphs GI)—1000 ms, fourth row (graphs JL)—2000 ms).
Applsci 12 02736 g006
Figure 7. Scatter diagram for the sample comprising all 16 subjects in the space of LDA components after finding discriminative frequencies and time intervals using Hjorth parameters for three motor imagery classes.
Applsci 12 02736 g007
Figure 8. Scatter diagram for the sample comprising all 16 subjects in the space of LDA components after finding discriminative frequencies and time intervals using interchannel cross-correlation coefficients for three motor imagery classes.
Applsci 12 02736 g008
Table 1. Motor imagery classification accuracies in the approach for the detection of the most informative frequencies.
Approach Feature Classification Accuracy
CSP + LRCSP patterns51.1 ± 10.8%
Search for informative frequenciesPSD65.4 ± 9.1%
Hjorth parameters53.9 ± 11.4%
Correlation coefficients53.7 ± 8.2%
Table 2. Accuracies of motor imagery classification in the approach according to the search for informative frequencies and segments for different features and window lengths (intrasubject).
Window Length500 ms750 ms1000 ms2000 ms
Feature
PSD59.8 ± 9.6%57.9 ± 8.4%54.3 ± 8.3%64.8 ± 7.6%
Hjorth parameters67.9 ± 4.7%68.6 ± 3.1%68.9 ± 3.9%54.0 ± 12.6%
Correlation coefficients68.8 ± 3.1%71.6 ± 3.9%68.5 ± 4.3%53.9 ± 8.3%
Table 3. Motor imagery classification accuracies in the approach according to the search for informative frequencies and segments for different features and window lengths during additional classification for ROC curves creation (intersubject).
Window Length500 ms750 ms1000 ms2000 ms
Feature
PSD38.55%35.29%34.64%64.7%
Hjorth parameters66.08%67.77%68.01%35.48%
Correlation coefficients68.07%68.01%67.65%35.72%
Publisher’s Note: MDPI stays neutral with regard to jurisdictional claims in published maps and institutional affiliations.

