Article

Intake Differences between Subsequent 24-h Dietary Recalls Create Significant Reporting Bias in Adults with Obesity

by
Costela Lacrimioara Serban
1,
Adela Chirita-Emandi
2,3,*,
Iulia Teodora Perva
2,3,
Alexandra Sima
4,5,
Nicoleta Andreescu
2,3,
Salomeia Putnoky
6,
Mihai Dinu Niculescu
3,7 and
Maria Puiu
2,3
1
Department of Functional Sciences, “Victor Babes” University of Medicine and Pharmacy Timisoara, 300041 Timisoara, Romania
2
Genetics Compartment, Emergency Hospital for Children Louis Ţurcanu, 2 Doctor Iosif Nemoianu Str., 300011 Timisoara, Romania
3
Center of Genomic Medicine, Department of Microscopic Morphology-Genetics, “Victor Babes” University of Medicine and Pharmacy Timisoara, 300041 Timisoara, Romania
4
Department of Internal Medicine—Diabetes, Nutrition and Metabolic Diseases, “Victor Babes” University of Medicine and Pharmacy Timisoara, 300041 Timisoara, Romania
5
Center and Clinic for Diabetes, Nutrition and Metabolic Diseases, “Pius Brinzeu” Emergency County Hospital Timisoara, 300723 Timisoara, Romania
6
Department of Microbiology, “Victor Babes” University of Medicine and Pharmacy Timisoara, 300041 Timisoara, Romania
7
Advanced Nutrigenomics, Durham, NC 27703, USA
*
Author to whom correspondence should be addressed.
Appl. Sci. 2022, 12(5), 2728; https://doi.org/10.3390/app12052728
Submission received: 3 February 2022 / Revised: 21 February 2022 / Accepted: 4 March 2022 / Published: 6 March 2022
(This article belongs to the Special Issue Overweight, Obesity and Body Mass Index (BMI))

Abstract

:
In depth understanding of the dietary patterns of individuals with obesity is needed in practice and research, in order to support dietitians and physicians in the design and implementation of nutritional management. We aimed to analyze the consistency of energy, macro-, and micronutrient reported intakes in four non-consecutive 24-h dietary recalls from 388 adults with obesity using information collected in the NutriGen Study (ClinicalTrials.gov, NCT02837367). Significant decreases were identified for reported energy and several, macro- and micronutrient intakes, between the first and subsequent 24-h recalls. Significant differences of reported intakes were identified in sensitivity analyses, suggesting that the first recall (also the only one performed on site, face-to-face) might be a point of bias. A comparison of the differences in intakes between weekend and weekday, after adjustment for false discovery rate were non-statistically significant either in male, females, or in total. To overcome this potential bias, studies should be carefully conducted, starting from the design phase, through to the analysis and interpretation phases of the study. Prior to averaging specific intakes across all sessions of reporting, a preliminary analysis must be conducted to identify if a certain time point had significant differences from all other time points and overview potential sources of bias: reporting bias, training bias, or behavioral changes could be responsible for such differences.

1. Introduction

Twenty-four hour dietary recalls provide metrics of estimated food intake, necessary for studies that link nutrient intake to diseases or other health-related outcomes. The multiple pass 24-h recall method used for estimating food intake has been proven to be a reliable method for the estimation of nutritional intakes in individuals with obesity [1,2]. Usually, several 24-h recalls are needed, in order to provide sufficient time to capture intra-individual intake variations. The recommended number of 24-h recalls varies, depending on the outcome of the study, ranging from a minimum of two (for the comparison of protein and potassium intake between European countries [3]) to a maximum of 10–15 days when assessing comprehensive diets across a six month period [4]. Jackson et al.l [5] suggested a maximum of eight 24-h recalls in an overweight and obese population, in order to reduce random errors.
Several authors have underpinned that the simple averaging of several 24-h dietary intakes is not a suitable method to account for systematic errors in the design of the study. This method is useful only to account for random errors in this type of assessment. Therefore, through a carefully planned design, some sources of known bias on the measurement of intake such as gender, age, body mass index (BMI), day of the week, or rural or urban location can be accounted for [6,7].
Underreporting of food intakes has been acknowledged as a source of bias and has been associated with higher BMI or body fat percent, feminine gender, and social desirability [8,9,10]. Even when dietary restraint practices were related to lower energy and fat reporting, this did not modify the accuracy of the method [11]. Several studies support the idea that attentional bias toward food cues is increased in individuals with obesity [12]. Interventional studies have proven that this attentional bias in individuals with obesity can be altered in both directions [13,14].
Little is known about whether the order of the subsequent recalls could be a specific factor to account for when assessing bias, or whether the order of recalls would induce behavior changes through alterations of attentional bias to the interviewed individuals. The purpose of this study was to evaluate the consistency of reported energy, macro-, and micronutrient intakes in a series of four 24-h recalls in adults with obesity.

2. Materials and Methods

2.1. Recruitment of Subjects

Data represent the estimated food intake collected with a broader scope within the NutriGen Study (ClinicalTrials.gov NCT02837367), performed in Timisoara, Romania. For the current study, 197 men and 212 women were selected form the original cohort of 204 men and 217 women. The inclusion criteria for the NutriGen Study were: adults (age 18–70 years), with obesity (BMI ≥ 30 kg/m2), abdominal circumference ≥84 cm in women and ≥90 cm in men, dyslipidemia with total serum cholesterol ≥200 mg/dL, HDLc ≤50 mg/dL in women and ≤40 mg/dL in men, serum triglycerides ≥150 mg/dL or treatment for dyslipidemia (e.g., statins, fibrates, omega 3 fatty acids, cholestyramine, ezetimibe) or for type 2 diabetes. Exclusion criteria consisted of the prior diagnosis of cancer, autoimmune disease, psychiatric, blood coagulation disorders, and history of drug and alcoholic abuse, as previously presented elsewhere [15]. The participants were under medical surveillance and treatment for these conditions at the time of recruitment, which took place from September 2016 to December 2018.

2.2. Dietary Intake Assessment

The personnel involved (interviewers) in the dietary assessment procedures received specialized training from one experienced person to ensure the accuracy of the collection and data entry. Trained physicians and medical students collected the estimates of dietary intakes using a 5-pass 24-h dietary recall method [1,2]. The assessment evaluated the food intakes for the previous day by assessing type/composition/brand, quantity (either in international units or estimated using usual household measurements), and hour of the day for each food or drink. This information was recorded on paper using a pre-established template and standard operating procedure. A total of 1587 24-h dietary recalls were collected, representing up to four days of food intake assessment for each participant. Except for the first 24-h recall, which was performed face-to-face during the baseline visit, the other 24-h recalls were performed at various intervals during the study over the telephone, without prior announcement. For the purpose of this study, 388 adults were included who had complete sets of four 24-h recalls. The median timeframe for the included recalls was 62 days, with an interquartile range (IQR) of 56.5 days. Of the four dietary recalls, three recalls were performed during weekdays (Monday to Friday), and one on a day of the weekend (Saturday or Sunday). Food intake estimates obtained from the recalls were converted into nutrient intakes using Nutritioapp (https://nutritioapp.com, accessed 22 September 2021) [16], a web-application using data from both the USDA Food and Nutrient Database for Dietary Studies, and from European and Romanian databases, as previously described [15]. Subjects were on ad libitum diets during the recording of all 24-h recalls.

2.3. Anthropometry, Biochemistry, and Diagnostic of Chronic Diseases

During the baseline visit, the weight, height and abdominal circumference were measured using international standards, and blood samples were collected in the morning, following overnight fasting of at least 8 h, in EDTA sterile vacutainers. Among other biochemical assessments, total cholesterol (TC) and triglycerides (Tg) were determined following the manufacturer’s protocols, as previously described [17]. Total serum lipids (TSL) were estimated using Philips’s formula TSL (g/l) = 2.27 × TC + Tg + 0.623 [18]. The diagnostic of associated chronic diseases had been previously established by specialist physicians and were recorded from medical documents.

2.4. Data Analysis

Data analysis was performed using the IBM-SPSS version 25 software (IBM, Armonk, NY, USA). The Kolmogorov–Smirnoff test was used to test for normal distribution. Variables were expressed as the mean and standard deviation or as medians and interquartile range. The Mann–Whitney test was used for comparing two level factors. Proportions of participants with associated chronic diseases were compared using the chi-square test. Proportions of weekend/weekdays days in each 24-h recall set were compared using chi-square, and statistical significance was adjusted using the Bonferroni method. For each participant, three 24-h recalls performed on weekdays were also averaged and further used in analysis. Average nutrient intakes from four ordered 24-h recalls and averaged nutrient intakes from three 24-h recalls (resulting from the exclusion of either the first, second, third, or fourth ordered 24-h recall) were also used in the analyses. Three different types of models for repeated design were used separately each nutrient category: energy, macro-, and micronutrient intakes in the following circumstances: (1) the four ordered 24-h recalls; (2) the weekend and mean weekday intakes; (3) the mean of four 24-h recalls compared to mean of three 24-h (resulting from the exclusion of the first ordered 24-h recall); (4) the mean of four 24-h recalls compared to the mean of three 24-h (resulting from the exclusion of the second ordered 24-h recall); and (5) the mean of four 24-h recalls compared to the mean of three 24-h (resulting from the exclusion of the third ordered 24-h recall); and (5) the mean of four 24-h recalls compared to the mean of three 24-h (resulting from the exclusion of the fourth ordered 24-h recall). The general linear model and Wilcoxon-signed rank test were used for comparisons.
For the general linear model, results of pairwise comparisons between the four ordered 24-h recalls were adjusted using the Sidak method. All results were also adjusted for false discovery rate (FDR) using an online tool (https://tools.carbocation.com/FDR, accessed 15 March 2020) [19], which adjusted the p-values to the number of comparisons per research hypothesis. After the adjustments, the new p-values < 0.05 were considered statistically significant. For size effect interpretation, r was calculated and interpreted according to Cohen’s criteria: for r = 0.10–0.30, there was a small effect size; for r = 0.30–0.50, there was a medium effect size; and for r > 0.50, there was a large effect size [20].

3. Results

The baseline measurements are presented in Table 1 as averages stratified by sex. The cohort had a median age of 56.20 years (interquartile range, IQR: 23.0 years, with 54.0 years—IQR: 29 years for males and 57.0 years—IQR: 19 years for females) and a median body mass index (BMI) of 35.2 kg/m2 (14.7 kg/m2) kg/m2 (33.9 kg/m2—IQR:14.2 kg/m2 for males and 36.7 kg/m2—IQR:14.7 kg/m2 for females).

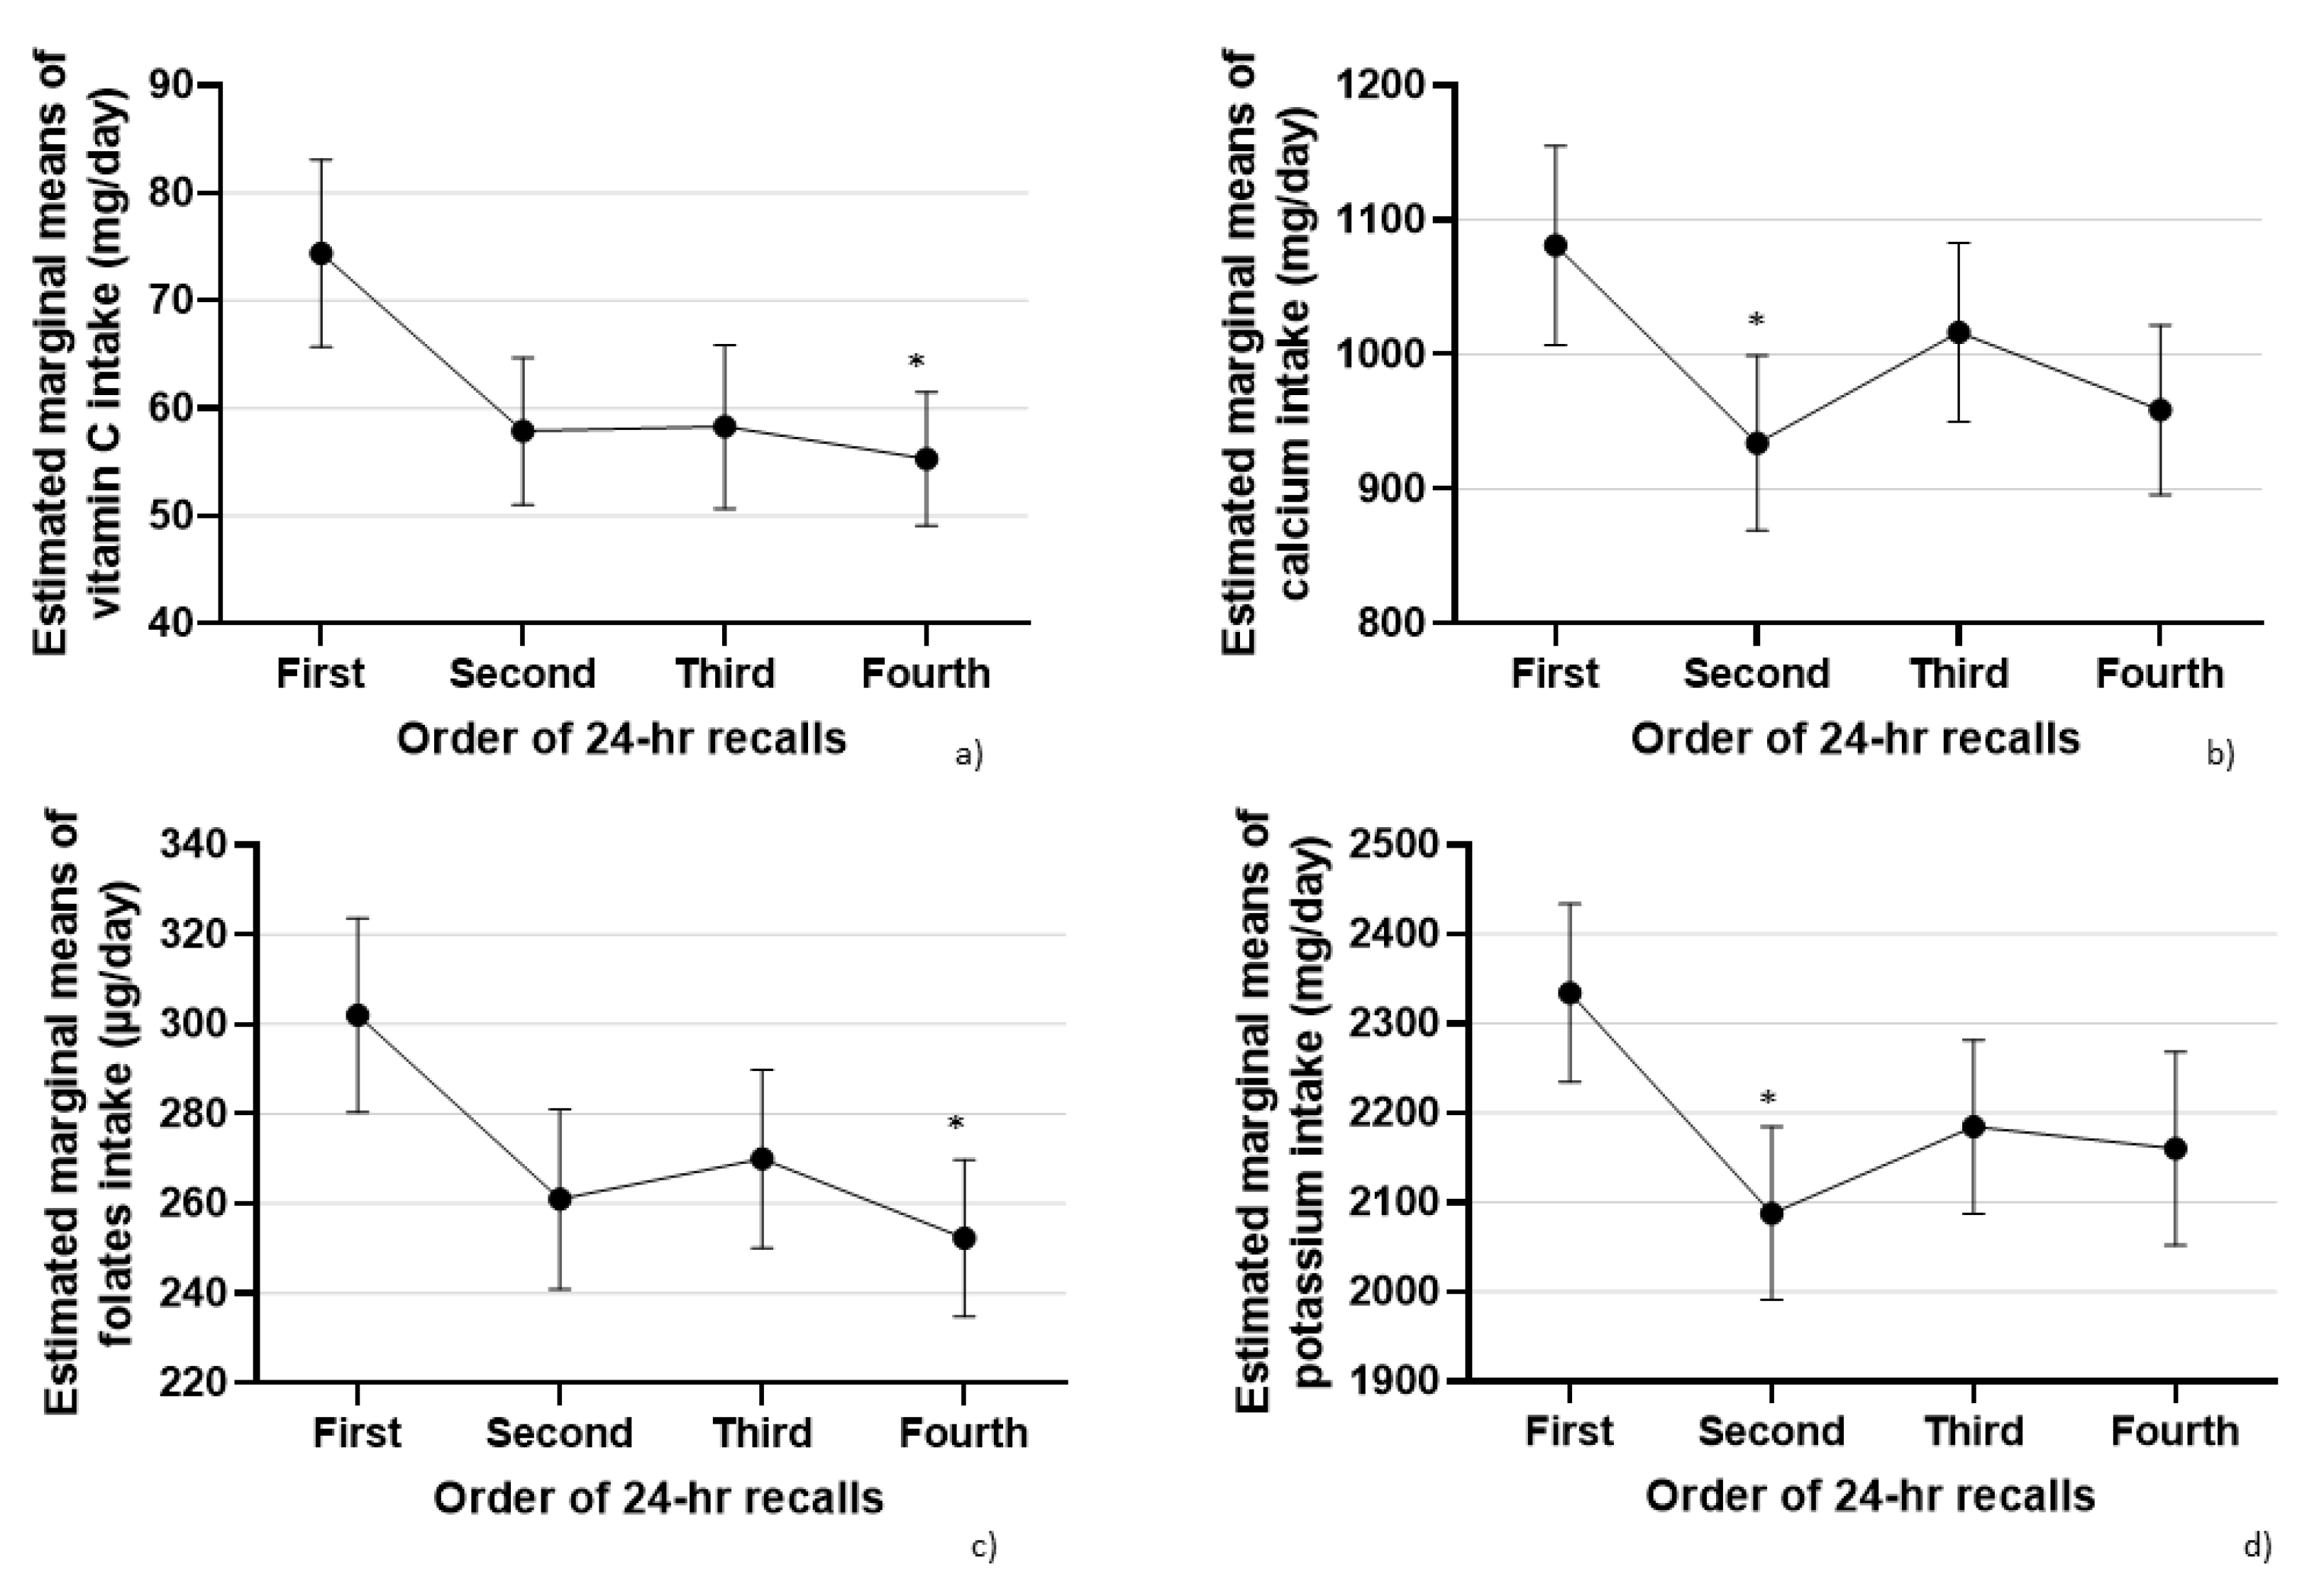
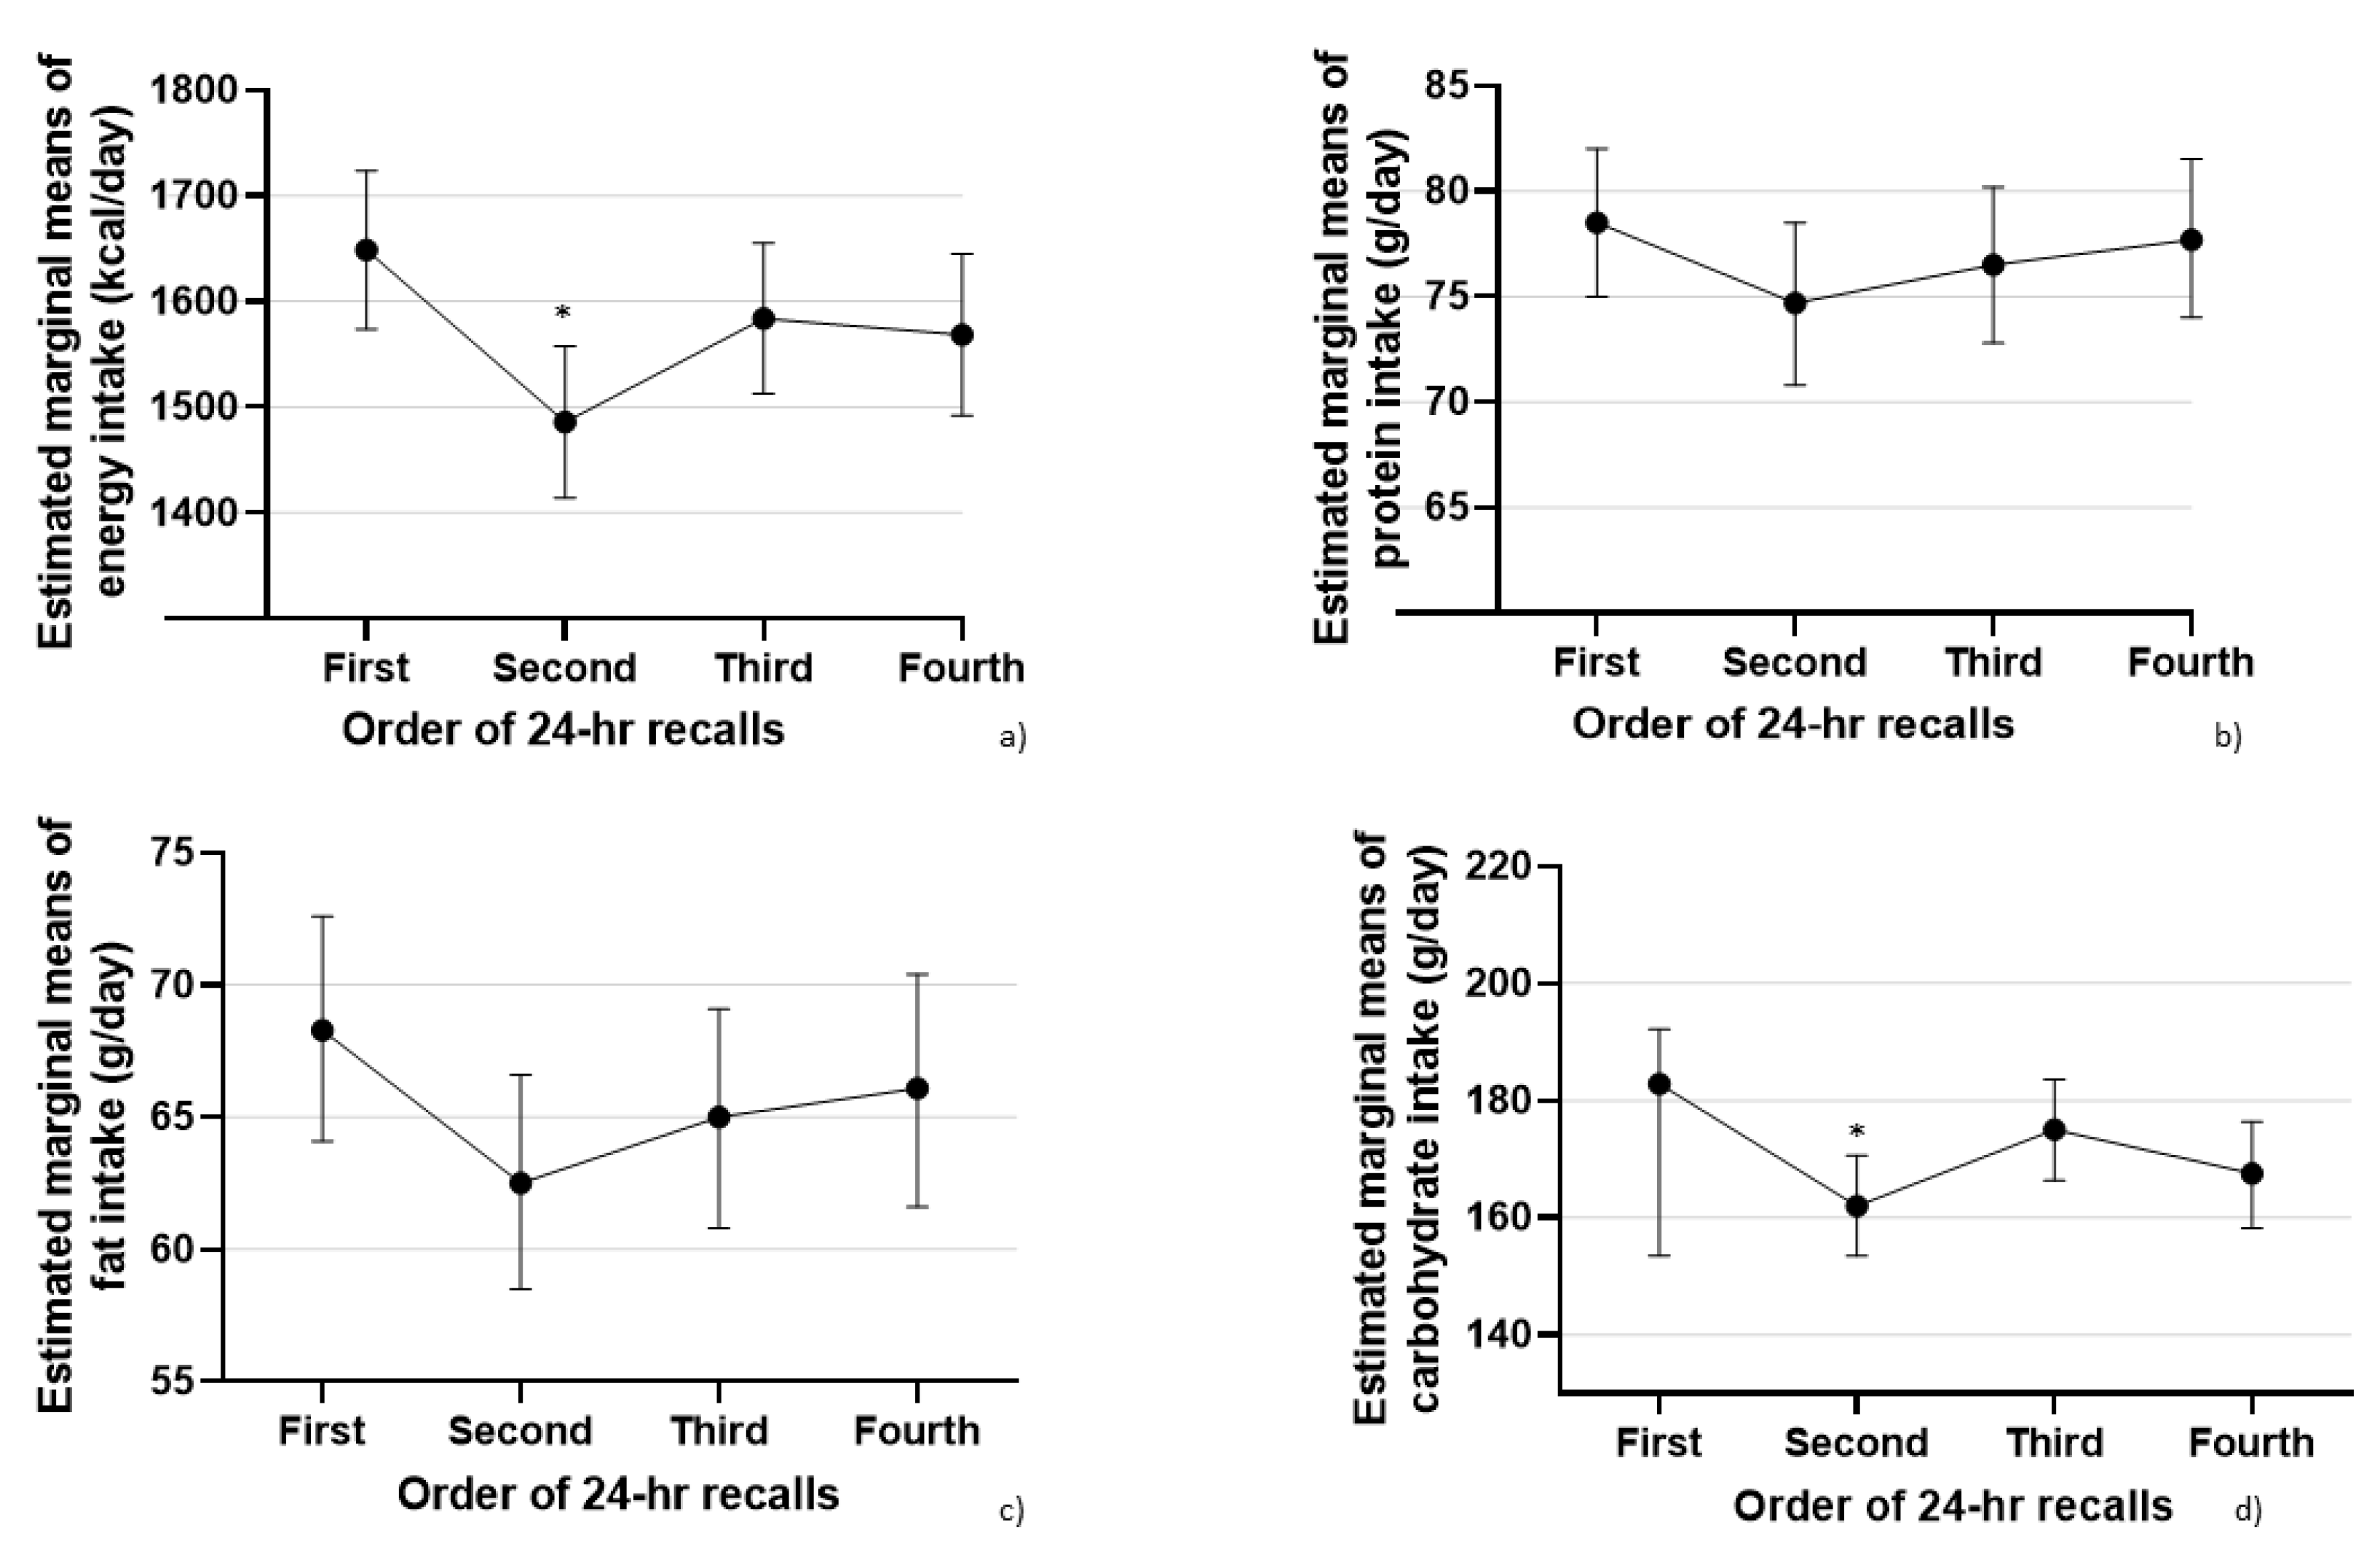
3.1. Model 1: Order of 24-h Recalls and Nutrient Intakes

Median timeframes and their IQRs between the first and second, second and third, and third and fourth 24-h recalls were 17.0 (15.0), 19.00 (18.0), and 20.00 (23.0) days, respectively. Estimated mean intakes of energy and of 36 macro- and micronutrients are presented for each 24-h dietary recall in Table 2. For each variable, the differences between the ordered recalls were assessed for statistical significance using general linear models. Significant differences were identified between 24-h recalls, after FDR correction, for energy, carbohydrates, vitamin C, calcium, fiber, folates, potassium, and total sugar. The estimated intakes for vitamin C, folates, fiber, and total sugar were different between recalls 1 and 4, while all other differences identified were between recalls 1 and 2. Figure 1 illustrates the mean values for thee energy and macronutrients for each recall, while Figure 2 shows the mean values for the micronutrient intakes found to be significantly different between recalls. Sex was considered as a between-subjects factor. All interactions between sex and time factors were not statistically significant (p > 0.05).

3.2. Model 2: Weekend vs. Weekday Intakes

We tested whether the presence of weekend days was balanced between ordered recalls, in order to identify a potential bias that could be associated with the differences previously identified. Weekend days represented 12.0% of the first ordered 24-h recall, 11.3% of the second ordered 24-h recall, 10.6% of the third ordered 24-h recall, and 66.0% of the fourth ordered 24-h recall. Except for the fourth ordered 24-h recall, which had a significantly higher proportion of weekend days compared to previous recalls (p > 0.0083), no significant differences were observed after Bonferroni correction (p < 0.0083 as significance threshold) between the first, second, or third recalls.
General linear models used the energy and nutrients from weekend intakes versus the mean intake values of the three weekdays. Significant interactions were observed between sex and type of day of the week, and therefore, the analysis presented in Table 3 was stratified by sex. Table 3 presents the means of energy and nutrients, with a 95% confidence interval of means. Differences in intakes between weekend and weekday for each gender were compared with the Wilcoxon-signed rank test and, after adjustment for FDR, were non-statistically significant either in male, females, or in total.

3.3. Model 3: Exclusion of the First 24-h Recall

In this model, the comparison was made between the mean of recalls with the first 24-h recall excluded, and the mean of all 24-h recall. Table 4 presents the effect size of the differences between the mean of recalls when the first 24-h recall was omitted and the mean of all 24-h recalls. Exclusion of the first 24-h recall determined an increase in the mean of several nutrients, statistically significant after FDR correction for fibers, folates, potassium, and a decrease in the mean of vitamin B12, EPA (eicosapentaenoic acid), DHA (docosahexaenoic acid), and ALA (alpha-linolenic acid) (Table 4) after FDR correction.

3.4. Model 4: Exclusion of the Second 24-h Recall

Because the second ordered 24-h recall was identified to have differences in reported intakes of energy and carbohydrates when compared to the first ordered 24-h recall, we sought to evaluate whether, by omitting the second ordered 24-h recall, significant changes could be identified when compared to the means from all four recalls. Table 4 indicates the size effect and statistical significance of the differences in mean intakes for the complete set of recalls and for the mean intakes of recalls from which the second 24-h recall was excluded. Results indicated an increase in the mean of 24-h recalls when second ordered recall was excluded, which was significant for energy, protein, fat, carbohydrates, vitamin C, vitamin D, iron, calcium, magnesium, total water, fiber, vitamin K, vitamin B12, folates, betaine, choline, copper, phosphor, manganese, potassium, sodium, EPA, DHA, total sugars, fatty acids total saturated, LA (linoleic acid), and ALA (Table 4).

3.5. Model 5: Exclusion of the Third 24-h Recall

In this model, the comparison was made between the mean of recalls, when the third 24-h recall was omitted, and the mean of all 24-h recall. Excluding the third 24-h recall from the total means determines an increase in the mean of several nutrients, statistically significant after FDR correction for vitamin C, vitamin K, betaine, EPA, and DHA (Table 4).

3.6. Model 6: Exclusion of the Fourth 24-h Recall

Excluding the fourth 24-h recall from the total means determined an increase in the means of several nutrients, statistically significant after FDR correction for vitamin C, vitamin D, vitamin A, iron, calcium, magnesium, fiber, vitamin K, thiamine, riboflavin, folates, vitamin B12, pantothenic acid, betaine, copper, fluor, phosphor, manganese, zinc, EPA, DHA, total sugars, vitamin E, and ALA (Table 4).

4. Discussion

4.1. Misreporting in Food and Drink Consumption

This is the only study, to the best of our knowledge, which investigated the consistency of energy, macro-, and micronutrient estimated intakes between four non-consecutive 24-h recalls in Romanian adults with obesity. It is also one of the few studies worldwide to explore these consistencies. In discussing how these results should be interpreted, several aspects were considered. Misreporting in both directions (over- and under-reporting) has been previously reported from people with obesity, with underreporting being more prevalent [21]. Estimation of underreporting in 24-h recalls by using recovery biomarkers was considered between 12% to 23%, much lower than in other types of dietary assessment [22,23,24,25]. Random error in dietary assessment represents day-to-day variability due to different daily patterns of food intakes, and can be accounted by averaging intakes from several 24-h recalls [6,26,27]. Therefore, the decrease reported in the second and fourth 24-h recalls was tested for consistency by a sensitivity analysis presented through models 3–6 and in Table 4). Systematic error in dietary assessment includes measurements that are shifted in the same direction from the true value. It has been shown that the systematic errors influence 24-h recalls to a lesser extent, and can be accounted for by collecting and controlling for known potential confounders such as day of the week, gender, age, BMI status, etc. [6,26,27].

4.2. Controlling for Systematic Bias across Multiple Days

A decrease in intakes across multiple days of assessment has been reported by others using food diaries [28,29]; however, there are no studies that have reported the same changes in individuals with obesity using 24-h recalls. In our dataset, the energy and carbohydrate intakes (in which a reduction of reporting was observed after the first recall) and fat and protein intakes (in which similar intakes were observed) support the results found by Arab et al. in a series of eight days of evaluation [4,28] and by Whybrow [29], who reported that the energy decrease in four days of food diary was greater in individuals with obesity compared to lean individuals. The decreased reporting in a series of 24-h recalls could be explained by subjects becoming aware of their intakes in the process of declaring the intakes, also known as training bias (the “big brother” effect). However, the same findings could also be due to reporting fatigue, or could reflect genuine changes in eating habits, induced by the fact that subjects become more aware of their diets and the importance of healthy eating, influence that then subsides or diminishes during subsequent recalls (third and fourth).

4.3. Controlling for Systematic Bias across Weekday versus Weekend 24-h Dietary Recalls

The origin of differences reported in energy and carbohydrate intakes, specific to the second recall, and to the fourth recall, respectively, is not clear. Such differences could reflect true variation in intakes. However, the second to fourth 24-h recalls were performed for each individual on different days of the week, with no obvious reason to consider that such differences could arise from a different distribution between weekends and weekdays. Our analysis indicated that these differences could not be determined by the distribution of weekends in the first two recalls; however, the fourth recall had a significantly higher proportion of weekends than the other recalls. Furthermore, we did not identify differences in nutrient intakes between weekends and weekdays (Table 3). Similarly, studies performed in other countries reported that the day of the week had little impact on the variance of reported values [4,28]. Recently, Gibson et al. discussed many causes of misreporting and measurement errors in self-administered 24-h recalls [6]. In this study, efforts were made to minimize this bias by ensuring specialized training performed by one experienced tutor. Nevertheless, the first recall was performed during a face-to-face visit, while the others were performed via telephone. The validity and relative reliability of face-to-face versus telephone 24-h recalls were found to be similar in several older studies [30,31,32,33], but more recently, Brassard et al. [34] noticed, using a web based method for measuring intake versus face-to-face interviews, higher reported intakes in the web-based method. Several publications have presented higher levels in attentional bias from food cues in individuals with overweight and obesity compared to normal weight individuals. Most of the results are consistent with the possibility of the attrition of attentional bias through several types of interventions including the modified food Stroop task, visual dot-probe tasks, the attentional network task and one-back visual recognition tasks, and even passive picture presentation [12]. In our sample, after the enrolment visit and first reporting of the 24-h recall, a reduction in food cues endogenous activation, leading to a reduced intake of food after this timepoint, while an effect of unknown duration might be another explanation of our findings.
Although the weekend/weekday discrepancies had been considered in previous studies on children [35,36], young women [37], middle life women [38], or the general population [39], to the best of our knowledge, this assessment has not been previously conducted in people with obesity, when looking at the differences between the order of recalls. Several publications agreed that weekend diet was lower in quality for both men and women [40,41,42]. The trend observed in men (Table 3) was similar to other results already published, suggesting that weekend intakes were higher than weekday intakes, but not necessarily reaching statistical significance [38,39,40]. For females, no difference was observed between weekdays and weekends, a result that is in contrast to results published in other studies, possibly suggesting cultural differences [38,39].

4.4. Controlling for Systematic Bias across First Time versus Repeated and Face-to-Face versus Phone Call 24-h Dietary Recalls

The differences reported in this study (Table 2 and Figure 1) between the first and second recalls and first and fourth, suggested a possible bias that required in-depth investigation. The exclusion of the first recall led to a decrease in the mean reported of several nutrients, but not for energy, nor macronutrients when compared to averages across all four recalls, with small size effects. The alternate exclusion of the second and fourth recalls led to an increase in mean reported energy and intakes for many nutrients when compared to averages across all four recalls, with small or small to medium size effects. In this context, three issues were considered: (1) If a systematic bias exists in the reported values of one specific ordered recall, and this bias cannot be ascertained to other known factors, should this recall be included in further analyses? (2) If this specific second recall is eliminated from the calculations, how does this change the reported energy and nutrient intakes that are considered further in the subsequent analyses? Our study suggests that the exclusion of the recall identified with order-specific bias would significantly change the reported intakes, and this could potentially create further methodological issues when intake data would be used for further analyses (Table 4); and (3) Could these differences be seen in the context of switching between face-to-face acquisition of intake and telephone interview? Although others have compared these methods for the general population, women, or a rural population, this has not been conducted so far in individuals with obesity.
This study also identified lower intakes for several micronutrients (vitamin C, calcium, folates, potassium, or fiber), which were specific for either the second or fourth recalls (Table 2 and Figure 2). Due to the design of our study, it is difficult to speculate whether such differences were truly systematic and specific to the order of recalls, or if, within the FDR limits, these were spurious. It is important to point out that the first recall, having the higher estimates for several variables, was the only one performed on site, face-to-face, while all other three were performed over the phone. These differences could be seen in the context of switching between face-to-face acquisition of intake and telephone interviews. Although others have compared these methods for general population, women, or a rural population, this has not been conducted so far in individuals with obesity [33]. Since the first recall had higher values than recalls 2 and 4 for various nutrients, this possibility of bias induced by different means of communication cannot be excluded. This potential bias could point toward carefully considering the means of reporting and communicating with participants in a particular cultural context.

4.5. Suggestions for Improvement of Repeated 24-h Dietary Recalls Method

In order to improve the overall quality of ordered 24-h recalls used to capture the energy and nutrient intakes and to reduce the error observed between ordered 24-h recalls, our study suggested the possibility of systematic differences in the reported intakes for energy and macronutrients, which can be specific between recalls, with the first recall having potentially higher estimates for some nutrients and energy intakes. Whether these differences are due to true different intakes in the context of random error or due to reporting bias, this study indicates that repeated 24-h recalls can inherently present systematic differences between specific recalls. In our study, these differences were specifically between session 1 versus sessions 2 or 4.
To overcome this potential bias, we suggest that care should be taken starting from the design phase through the analysis phase of the study. A preliminary analysis should be conducted to identify whether a certain time point has significant differences from all other time points and overview potential sources of bias or other reasons for this finding.
One of the limitations of this study was that the true intake of nutrients was not assessed, nor were biomarkers of available nutrients available, so the true cause of the differences found for the second and fourth time points could not be identified. Another limitation was that the study did not use a control sample and, therefore, one cannot ascertain whether such differences were specific or not to individuals with obesity and associated morbidities.

5. Conclusions

This study identified that adults with obesity reported different energy and nutrient intakes between session 1, and sessions 2 and 4, respectively. Significant decreases in reported intakes were identified when comparing the mean intakes of all four 24-h recalls with mean intakes when each of the first, second, third, and fourth 24-h recall were excluded from the mean, suggesting that the first recall (also the only one performed on site, face-to-face) could be a significant point of bias. Therefore, when considering whether to further use the data obtained from repeated 24-h recalls, preliminary analysis of potential differences between time points should identify whether session-specific bias exists, possibly related to using different means of reporting or communication (e.g., face-to-face versus reporting by telephone).

Author Contributions

Conceptualization, C.L.S. and M.D.N.; Methodology, M.D.N. and M.P.; Validation, C.L.S., I.T.P. and S.P.; Formal analysis, C.L.S.; Investigation, A.S.; Data curation, A.C.-E.; Resources, N.A.; Writing—original draft preparation, C.L.S.; Writing—review and editing, M.D.N., A.C.-E. and M.P.; Project administration, M.P.; Funding acquisition, M.D.N. All authors have read and agreed to the published version of the manuscript.

Funding

This research was funded by a Competitivity Operational Program (POC) from the Romanian Ministry of European Investment and Projects, Project title “Use of nutrigenomic models for the personalized treatment with medical foods in obese people” (NutriGen, ClinicalTrials.gov, NCT02837367) 2016–2019, SMIS no: 104852, 91/09.09.2016, ID P_37-684.

Institutional Review Board Statement

The study received ethics approval from the Scientific Research Ethics Committee Board of the Victor Babes University of Medicine and Pharmacy Timisoara (number 06/20.06.2016) and was conducted in accordance with the Helsinki Declaration. Before any study procedure, all participants signed the informed consent.

Informed Consent Statement

Informed consent was obtained from all subjects involved in the study.

Data Availability Statement

The datasets used and/or analyzed during the current study are available from the corresponding author on reasonable request.

Acknowledgments

This work was performed at the Center of Genomic Medicine University of Medicine and Pharmacy “Victor Babes”. We thank Nutritio (https://nutritioapp.com/ accessed 22 September 2021) for all the support provided for this project.

Conflicts of Interest

The authors declare no conflict of interest. The funders had no role in the design of the study; in the collection, analyses, or interpretation of data; in the writing of the manuscript, or in the decision to publish the results.

References

  1. Conway, J.M.; Ingwersen, L.A.; Vinyard, B.T.; Moshfegh, A.J. Effectiveness of the US Department of Agriculture 5-step multiple-pass method in assessing food intake in obese and nonobese women. Am. J. Clin. Nutr. 2003, 77, 1171–1178. [Google Scholar] [CrossRef] [PubMed] [Green Version]
  2. Conway, J.M.; Ingwersen, L.A.; Moshfegh, A.J. Accuracy of dietary recall using the USDA five-step multiple-pass method in men: An observational validation study. J. Am. Diet. Assoc. 2004, 104, 595–603. [Google Scholar] [CrossRef] [PubMed]
  3. Crispim, S.P.; de Vries, J.H.M.; Geelen, A.; Souverein, O.W.; Hulshof, P.J.M.; Lafay, L.; Rousseau, A.-S.; Lillegaard, I.T.L.; Andersen, L.F.; Huybrechts, I.; et al. Two non-consecutive 24 h recalls using EPIC-Soft software are sufficiently valid for comparing protein and potassium intake between five European centres—Results from the European Food Consumption Validation (EFCOVAL) study. Br. J. Nutr. 2011, 105, 447–458. [Google Scholar] [CrossRef] [PubMed]
  4. Stote, K.S.; Radecki, S.V.; Moshfegh, A.J.; Ingwersen, L.A.; Baer, D.J. The number of 24 h dietary recalls using the US Department of Agriculture’s automated multiple-pass method required to estimate nutrient intake in overweight and obese adults. Public Health Nutr. 2011, 14, 1736–1742. [Google Scholar] [CrossRef] [PubMed] [Green Version]
  5. Jackson, K.A.; Byrne, N.M.; Magarey, A.M.; Hills, A.P. Minimizing random error in dietary intakes assessed by 24-h recall, in overweight and obese adults. Eur. J. Clin. Nutr. 2008, 62, 537–543. [Google Scholar] [CrossRef] [PubMed] [Green Version]
  6. Gibson, R.S.; Charrondiere, U.R.; Bell, W. Measurement Errors in Dietary Assessment Using Self-Reported 24-h Recalls in Low-Income Countries and Strategies for Their Prevention. Adv. Nutr. 2017, 8, 980–991. [Google Scholar] [CrossRef] [Green Version]
  7. Thompson, F.E.; Kirkpatrick, S.I.; Krebs-Smith, S.M.; Reedy, J.; Schap, T.E.; Subar, A.F.; Wilson, M.M. The National Cancer Institute’s Dietary Assessment Primer: A Resource for Diet Research. J. Acad. Nutr. Diet. 2015, 115, 1986–1995. [Google Scholar] [CrossRef] [Green Version]
  8. Ferrari, P.; Slimani, N.; Ciampi, A.; Trichopoulou, A.; Naska, A.; Lauria, C.; Veglia, F.; Buenode-Mesquita, H.B.; Ocke, M.C.; Brustad, M.; et al. Evaluation of under- and overreporting of energy intake in the 24-h diet recalls in the European Prospective Investigation into Cancer and Nutrition (EPIC). Public Health Nutr. 2002, 5, 1329–1345. [Google Scholar] [CrossRef] [Green Version]
  9. Novotny, J.A.; Rumpler, W.V.; Riddick, H.; Hebert, J.R.; Rhodes, D.; Judd, J.T.; Baer, D.J.; McDowell, M.; Briefel, R. Personality characteristics as predictors of underreporting of energy intake on 24-h dietary recall interviews. J. Am. Diet. Assoc. 2003, 103, 1146–1151. [Google Scholar] [CrossRef]
  10. Johansson, G.; Wikman, Å.; Åhrén, A.-M.; Hallmans, G.; Johansson, I. Underreporting of energy intake in repeated 24-h recalls related to gender, age, weight status, day of interview, educational level, reported food intake, smoking habits and area of living. Public Health Nutr. 2001, 4, 919–927. [Google Scholar] [CrossRef] [Green Version]
  11. Ard, J.D.; Desmond, R.A.; Allison, D.B.; Conway, J.M. Dietary restraint and disinhibition do not affect accuracy of 24-h recall in a multiethnic population. J. Am. Diet. Assoc. 2006, 106, 434–437. [Google Scholar] [CrossRef] [PubMed]
  12. Hendrikse, J.J.; Cachia, R.L.; Kothe, E.J.; McPhie, S.; Skouteris, H.; Hayden, M.J. Attentional biases for food cues in overweight and individuals with obesity: A systematic review of the literature. Obes. Rev. 2015, 16, 424–432. [Google Scholar] [CrossRef] [PubMed]
  13. Smith, E.; Treffiletti, A.; Bailey, P.E.; Moustafa, A.A. The effect of attentional bias modification training on food intake in overweight and obese women. J. Health Psychol. 2020, 25, 1511–1521. [Google Scholar] [CrossRef] [PubMed]
  14. Zhang, S.; Cui, L.; Sun, X.; Zhang, Q. The effect of attentional bias modification on eating behavior among women craving high-calorie food. Appetite 2018, 129, 135–142. [Google Scholar] [CrossRef] [PubMed]
  15. Șerban, C.L.; Sima, A.; Hogea, C.M.; Chiriță-Emandi, A.; Perva, I.T.; Vlad, A.; Albai, A.; Nicolae, G.; Putnoky, S.; Timar, R.; et al. Assessment of Nutritional Intakes in Individuals with Obesity under Medical Supervision. A Cross-Sectional Study. Int. J. Environ. Res. Public Health 2019, 16, 3036. [Google Scholar] [CrossRef] [PubMed] [Green Version]
  16. Software for Dietitians and Nutritionists: Nutrition Analysis, Meal Planning, Communication. Available online: https://nutritioapp.com/ (accessed on 5 April 2019).
  17. Serafim, V.; Tiugan, D.-A.; Andreescu, N.; Mihailescu, A.; Paul, C.; Velea, I.; Puiu, M.; Niculescu, M.D. Development and Validation of a LC–MS/MS-Based Assay for Quantification of Free and Total Omega 3 and 6 Fatty Acids from Human Plasma. Molecules 2019, 24, 360. [Google Scholar] [CrossRef] [Green Version]
  18. Phillips, D.L.; Pirkle, J.L.; Burse, V.W.; Bernert, J.T.; Henderson, L.O.; Needham, L.L. Chlorinated hydrocarbon levels in human serum: Effects of fasting and feeding. Arch. Environ. Contam. Toxicol. 1989, 18, 495–500. [Google Scholar] [CrossRef]
  19. False Discovery Rate Online Calculator|Tools. Available online: https://tools.carbocation.com/FDR (accessed on 10 October 2019).
  20. Fritz, C.O.; Morris, P.E.; Richler, J.J. Effect size estimates: Current use, calculations, and interpretation. J. Exp. Psychol. Gen. 2012, 141, 2–18. [Google Scholar] [CrossRef] [Green Version]
  21. Heitmann, B.L.; Lissner, L. Dietary underreporting by obese individuals—Is it specific or non-specific? BMJ 1995, 311, 986–989. [Google Scholar] [CrossRef] [Green Version]
  22. Lopes, T.S.; Luiz, R.R.; Hoffman, D.J.; Ferriolli, E.; Pfrimer, K.; Moura, A.S.; Sichieri, R.; Pereira, R.A. Misreport of energy intake assessed with food records and 24-h recalls compared with total energy expenditure estimated with DLW. Eur. J. Clin. Nutr. 2016, 70, 1259–1264. [Google Scholar] [CrossRef]
  23. Moshfegh, A.J.; Rhodes, D.G.; Baer, D.J.; Murayi, T.; Clemens, J.C.; Rumpler, W.V.; Paul, D.R.; Sebastian, R.S.; Kuczynski, K.J.; Ingwersen, L.A.; et al. The US Department of Agriculture Automated Multiple-Pass Method reduces bias in the collection of energy intakes. Am. J. Clin. Nutr. 2008, 88, 324–332. [Google Scholar] [CrossRef] [PubMed]
  24. Subar, A.F.; Kipnis, V.; Troiano, R.P.; Midthune, D.; Schoeller, D.A.; Bingham, S.; Sharbaugh, C.O.; Trabulsi, J.; Runswick, S.; Ballard-Barbash, R.; et al. Using intake biomarkers to evaluate the extent of dietary misreporting in a large sample of adults: The OPEN study. Am. J. Epidemiol. 2003, 158, 1–13. [Google Scholar] [CrossRef] [PubMed]
  25. Poslusna, K.; Ruprich, J.; de Vries, J.H.M.; Jakubikova, M.; van’t Veer, P. Misreporting of energy and micronutrient intake estimated by food records and 24 h recalls, control and adjustment methods in practice. Br. J. Nutr. 2009, 101, S73–S85. [Google Scholar] [CrossRef] [PubMed] [Green Version]
  26. Rossato, S.L.; Fuchs, S.C. Handling random errors and biases in methods used for short-term dietary assessment. Rev. Saúde Pública 2014, 48, 845–850. [Google Scholar] [CrossRef] [Green Version]
  27. Validation|Dietary Assessment Primer. Available online: https://dietassessmentprimer.cancer.gov/profiles/recall/validation.html (accessed on 3 August 2020).
  28. Arab, L.; Wesseling-Perry, K.; Jardack, P.; Henry, J.; Winter, A. Eight Self-Administered 24-h Dietary Recalls Using the Internet are Feasible in African Americans and Caucasians: The Energetics Study. J. Am. Diet. Assoc. 2010, 110, 857–864. [Google Scholar] [CrossRef] [PubMed] [Green Version]
  29. Whybrow, S.; Horgan, G.W.; Macdiarmid, J.I. Self-reported food intake decreases over recording period in the National Diet and Nutrition Survey. Br. J. Nutr. 2020, 124, 586–590. [Google Scholar] [CrossRef] [PubMed] [Green Version]
  30. Galasso, R.; Panico, S.; Celentano, E.; Del Pezzo, M. Relative validity of multiple telephone versus face-to-face 24-h dietary recalls. Ann. Epidemiol. 1994, 4, 332–336. [Google Scholar] [CrossRef]
  31. Tran, K.M.; Johnson, R.K.; Soultanakis, R.P.; Matthews, D.E. In-person vs Telephone-administered Multiple-pass 24-h Recalls in Women: Validation with Doubly Labeled Water. J. Am. Diet. Assoc. 2000, 100, 777–783. [Google Scholar] [CrossRef]
  32. Bogle, M.; Stuff, J.; Davis, L.; Forrester, I.; Strickland, E.; Casey, P.H.; Ryan, D.; Champagne, C.; McGee, B.; Mellad, K.; et al. Validity of a telephone-administered 24-h dietary recall in telephone and non-telephone households in the rural Lower Mississippi Delta region. J. Am. Diet. Assoc. 2001, 101, 216–222. [Google Scholar] [CrossRef]
  33. Brustad, M.; Skeie, G.; Braaten, T.; Slimani, N.; Lund, E. Comparison of telephone vs face-to-face interviews in the assessment of dietary intake by the 24 h recall EPIC SOFT program--the Norwegian calibration study. Eur. J. Clin. Nutr. 2003, 57, 107–113. [Google Scholar] [CrossRef] [Green Version]
  34. Brassard, D.; Laramée, C.; Robitaille, J.; Lemieux, S.; Lamarche, B. Differences in Population-Based Dietary Intake Estimates Obtained From an Interviewer-Administered and a Self-Administered Web-Based 24-h Recall. Front. Nutr. 2020, 7, 137. [Google Scholar] [CrossRef] [PubMed]
  35. Rothausen, B.W.; Matthiessen, J.; Hoppe, C.; Brockhoff, P.B.; Andersen, L.F.; Tetens, I. Differences in Danish children’s diet quality on weekdays v. weekend days. Public Health Nutr. 2012, 15, 1653–1660. [Google Scholar] [CrossRef] [PubMed] [Green Version]
  36. Rothausen, B.W.; Matthiessen, J.; Andersen, L.F.; Brockhoff, P.B.; Tetens, I. Dietary patterns on weekdays and weekend days in 4-14-year-old Danish children. Br. J. Nutr. 2013, 109, 1704–1713. [Google Scholar] [CrossRef] [Green Version]
  37. Czlapka-Matyasik, M.; Lonnie, M.; Wadolowska, L.; Frelich, A. “Cutting Down on Sugar” by Non-Dieting Young Women: An Impact on Diet Quality on Weekdays and the Weekend. Nutrients 2018, 10, 1463. [Google Scholar] [CrossRef] [PubMed] [Green Version]
  38. Jahns, L.; Conrad, Z.; Johnson, L.K.; Scheett, A.J.; Stote, K.S.; Raatz, S.K. Diet Quality Is Lower and Energy Intake Is Higher on Weekends Compared with Weekdays in Midlife Women: A 1-Year Cohort Study. J. Acad. Nutr. Diet. 2017, 117, 1080–1086.e1. [Google Scholar] [CrossRef] [PubMed]
  39. An, R. Weekend-weekday differences in diet among U.S. adults, 2003–2012. Ann. Epidemiol. 2016, 26, 57–65. [Google Scholar] [CrossRef] [PubMed]
  40. Haines, P.S.; Hama, M.Y.; Guilkey, D.K.; Popkin, B.M. Weekend eating in the United States is linked with greater energy, fat, and alcohol intake. Obes. Res. 2003, 11, 945–949. [Google Scholar] [CrossRef] [PubMed]
  41. Yang, P.H.W.; Black, J.L.; Barr, S.I.; Vatanparast, H. Examining differences in nutrient intake and dietary quality on weekdays versus weekend days in Canada. Appl. Physiol. Nutr. Metab. 2014, 39, 1413–1417. [Google Scholar] [CrossRef]
  42. Racette, S.B.; Weiss, E.P.; Schechtman, K.B.; Steger-May, K.; Villareal, D.T.; Obert, K.A.; Holloszy, J.O. Influence of Weekend Lifestyle Patterns on Body Weight. Obesity 2008, 16, 1826–1830. [Google Scholar] [CrossRef] [PubMed]
Figure 1. Differences in energy and macronutrient intakes between four evaluations of 24-h intakes (N = 388 individuals with obesity) Legend: (a) energy intake (Kcal/day); (b) protein intake (g/day); (c) fat intake (g/day); (d) carbohydrate intake (g/day). (*) significantly lower compared to the initial evaluation (after FDR correction).
Applsci 12 02728 g001
Figure 2. Differences in micronutrient intakes between four evaluations of 24-h intakes (N = 388 individuals with obesity). Legend: (a) vitamin C intake (mg /day); (b) calcium intake (mg/day); (c) folates intake (µg/day); (d) potassium intake (g/day). (*) significantly lower compared to the initial evaluation (after FDR correction).
Applsci 12 02728 g002
Table 1. Baseline measurements.
CharacteristicsMale (n1 = 189)Female (n2 = 197)Total (n = 386)
Age (years) *54.0 (29.0)57.0 (19.0)56.0 (23.0)
BMI (kg/m2) *33.9 (14.2)36.7 (14.7)35.2 (14.7)
Abdominal circumference (cm) *119.0 (30.0)117.0 (27.5)118.0 (29.0)
TSL (g/L) *6.9 (5.2)7.0 (5.5)7.0 (5.4)
Diabetes mellitus **123 (65.1%)148 (75.1%)271 (70.2%)
Type II diabetes mellitus **107 (56.6%)137 (69.5%)244 (68.7%)
Hypercholesterolemia **132 (69.8%)139 (70.6%)271 (63.2%)
Hypertriglyceridemia **59 (31.2%)37 (18.9%)96 (24.9%)
Arterial hypertension **112 (60.5%)130 (66.3%)242 (63.5%)
Hepatic steatosis **43 (22.8%)54 (27.4%)97 (25.1%)
Values represent * median (interquartile range) or ** number (percentage); * Mann–Whitney test; ** chi-square test; values in bold denote statistically significant differences between sex groups, TSL = total serum lipids.
Table 2. Mean intakes of energy and of 36 macro- and micronutrients from 24-h dietary recalls (n = 388 individuals with obesity).
NutrientsMean of First 24-h
Recall and 95% CI of the Mean
Mean of Second 24-h Recall and 95% CI of the MeanMean of Third 24-h Recall and 95% CI of the MeanMean of Fourth 24-h
Recall and 95% CI of the Mean
Energy (kcal)1641.71557.7–1725.71480.41401.2–1559.51578.31498.5–1658.11561.61475.7–1647.6
Protein (g)78.174.3–82.074.470.2–78.676.372.3–80.377.473.3–81.5
Fat (g)68.063.4–72.662.257.8–66.664.760.2–69.265.761.0–70.4
Carbohydrates (g)182.1172.0–192.2161.5152.4–170.6174.5165.2–183.8166.9157.0–176.8
Vitamin C (mg)74.065.0–83.057.650.6–64.658.250.5–65.955.148.8–61.4
Vitamin D (IU)67.658.6–76.665.652.8–78.582.365.7–99.070.258.8–81.6
Vitamin A (µg)602.4480.1–724.7599.0490.1–708.0594.0480.2–707.8499.6412.8–586.3
Iron (mg)12.311.5–13.011.310.5–12.011.811.0–12.511.410.6–12.2
Calcium (mg)1078.21002.4–1153.9931.2864.5–998.01013.9945.4–1082.3955.4889.6–1021.1
Magnesium (mg)241.8225.5–258.2223.2208.3–238.0224.7211.3–238.0216.6202.1–231.0
Total water (g)2704.52590.5–2818.52528.82426.1–2631.52664.32567.6–2760.92615.82510.2–2721.4
Fiber (g)17.316.3–18.415.414.4–16.416.215.0–17.315.814.6–16.9
Vitamin K (µg)96.778.4–115.078.064.5–91.476.663.1–90.070.560.2–80.8
Thiamine (mg)1.51.4–1.61.41.3–1.51.41.3–1.51.41.3–1.5
Riboflavin (mg)1.31.2–1.41.21.2–1.31.31.2–1.41.21.1–1.2
Niacin (mg)17.216.0–18.416.815.5–18.217.015.7–18.316.215.1–17.4
Vitamin B6 (mg)1.41.3–1.51.41.2–1.51.31.2–1.41.31.2–1.4
Folates (µg)300.7278.2–323.3260.1239.2–280.9268.9248.2–289.7251.3232.9–269.6
Vitamin B12 (µg)3.63.0–4.13.93.2–4.54.03.4–4.73.83.2–4.4
Pantothenic acid (mg)4.13.8–4.33.93.6–4.24.03.7–4.23.63.4–3.9
Betaine (mg)32.014.6–49.514.911.6–18.218.99.1–28.714.111.4–16.7
Choline (mg)250.3234.0–266.6224.7206.7–242.7245.0226.5–263.5253.3234.0–272.6
Copper (mg)1.00.9–1.10.90.9–1.00.90.9–1.00.90.8–1.0
Fluor (µg)444.1380.6–507.6386.2329.8–442.6403.4344.6–462.2336.3282.9–389.8
Phosphor (mg)952.4896.7–1008.0886.5831.3–941.7917.4864.5–970.2884.5829.2–939.7
Manganese (mg)2.01.8–2.22.41.1–3.72.01.6–2.32.11.5–2.8
Selenium (µg)80.575.0–85.978.072.3–83.682.176.6–87.778.072.6–83.4
Zinc (mg)7.16.6–7.56.76.2–7.36.76.3–7.26.66.1–7.2
Potassium (mg)2327.12221.2–2432.92081.41978.7–2184.02179.72077.9–2281.52153.82040.4–2267.3
Sodium (mg)3428.53195.0–3662.13072.62860.6–3284.53246.33039.0–3453.63212.73005.2–3420.3
EPA (mg)0.00.0–0.00.00.0–0.10.00.0–0.10.00.0–0.0
DHA (mg)0.10.0–0.10.10.0–0.10.10.1–0.10.10.0–0.1
Vitamin E (g)4.84.4–5.34.84.4–5.34.54.1–4.94.33.9–4.7
LA (g)3.12.5–3.62.72.2–3.23.22.8–3.73.12.6–3.6
ALA (g)0.30.2–0.40.30.2–0.30.30.3–0.40.30.3–0.4
Fatty acids total saturated (g)24.022.1–25.921.419.7–23.122.620.8–24.422.520.7–24.3
Sugars total (g)52.748.5–56.946.342.5–50.149.444.7–54.144.340.3–48.3
Means are calculated using a general linear model—repeated measures design with gender as between subjects’ factor and Sidak adjustment. Values in bold are statistical significantly lower compared to the first evaluation after false discovery rate adjustment.
Table 3. Weekend (one 24-h estimated intake) vs. weekday (mean of three 24-h estimated intakes) values for nutrient intakes stratified by sex (N = 388 individuals with obesity).
NutrientsMalesFemales
WeekendWeekdayWeekendWeekday
Mean95% Confidence IntervalMean95% Confidence IntervalMean95% Confidence IntervalMean 95% Confidence Interval
Energy (kcal)1989.21841.2–2137.31807.81704.2–1911.51305.11232.8–1377.41288.01219.5–1356.5
Protein (g)95.388.9–101.687.483.0–91.965.160.9–69.464.160.5–67.6
Fat (g)84.876.7–92.976.771.3–82.053.649.5–57.851.948.1–55.7
Carbohydrates (g)206.2188.3–224.0193.2181.7–204.7146.9137.6–156.2147.5139.3–155.6
Vitamin C (mg)64.452.7–76.171.963.6–80.253.945.3–62.652.546.8–58.3
Vitamin D (IU)90.169.3–110.887.973.8–101.955.544.2–66.855.347.0–63.5
Vitamin A (µg)545.8432.6–659.0693.3570.9–815.6410.3344.4–476.2523.6443.2–604.0
Iron (mg)14.012.6–15.313.312.5–14.19.58.7–10.210.19.5–10.8
Calcium (mg)1113.41002.3–1224.41122.31044.3–1200.3798.7722.3–875.1901.2835.9–966.5
Magnesium (mg)263.8240.1–287.5261.3244.6–278.0188.7171.9–205.5194.4182.2–206.6
Total water (g)2811.32646.3–2976.42854.12734.9–2973.22397.82264.4–2531.22432.92329.2–2536.6
Fiber (g)18.816.7–20.918.217.1–19.413.612.6–14.614.213.3–15.2
Vitamin K (µg)80.963.6–98.297.982.0–113.771.053.2–88.866.955.4–78.3
Thiamine (mg)1.71.6–1.91.61.5–1.71.21.1–1.21.21.1–1.3
Riboflavin (mg)1.41.3–1.61.41.3–1.51.00.9–1.11.11.0–1.2
Niacin (mg)21.019.0–23.119.518.2–20.913.912.6–15.113.912.8–14.9
Vitamin B6 (mg)1.71.6–1.91.61.5–1.71.11.0–1.21.11.0–1.2
Folates (µg)305.7276.2–335.2318.0293.9–342.1209.7190.4–229.1233.9216.7–251.1
Vitamin B12 (µg)4.43.6–5.34.84.1–5.43.02.3–3.83.02.5–3.4
Pantothenic acid (mg)4.54.1–4.94.34.1–4.63.43.1–3.63.53.3–3.7
Betaine (mg)19.614.2–25.023.013.2–32.814.610.7–18.619.06.5–31.5
Choline (mg)308.8278.5–339.1277.2257.0–297.5211.3192.9–229.7201.1187.3–214.9
Copper (mg)1.11.0–1.21.11.0–1.10.90.8–0.90.80.8–0.9
Fluor (µg)422.4335.7–509.2442.4373.4–511.3356.1285.7–426.5347.9289.3–406.4
Phosphor (mg)1112.41024.1–1200.71042.4976.8–1108.0762.9708.5–817.4769.7723.0–816.4
Manganese (mg)2.31.9–2.62.11.9–2.42.41.1–3.62.01.1–2.9
Selenium (µg)101.092.4–109.692.987.3–98.665.359.3–71.365.060.3–69.7
Zinc (mg)8.37.5–9.17.97.4–8.45.85.2–6.35.65.3–6.0
Potassium (mg)2551.52372.8–2730.23832.93566.6–4099.31983.51862.5–2104.52630.12463.3–2796.9
Sodium (mg)4003.63674.3–4332.82417.12294.1–2540.12655.42450.5–2860.31916.91828.8–2005.1
EPA (mg)0.00.0–0.10.00.0–0.10.00.0–0.10.00.0–0.0
DHA (mg)0.10.1–0.10.10.1–0.10.10.0–0.10.00.0–0.1
Vitamin E (g)5.34.5–6.05.14.7–5.64.33.6–4.94.13.8–4.4
LA (g)3.62.8–4.43.12.5–3.63.12.5–3.72.82.3–3.3
ALA (g)0.40.3–0.50.40.3–0.50.30.2–0.30.20.2–0.3
Fatty acids total saturated (g)29.226.0–32.326.624.4–28.717.415.8–18.918.517.0–20.1
Sugars total (g)52.044.7–59.452.647.4–57.844.039.7–48.244.240.7–47.7
Wilcoxon signed rank test was used between weekend–weekday comparisons per each gender, using false discovery rate adjustment, ALA—alpha-linolenic acid, EPA—eicosapentaenoic acid, DHA—docosahexaenoic acid, LA—linoleic acid.
Table 4. Effect size and statistical significance of the mean differences between four 24-h recalls and three 24-h recalls (after exclusion of each of the four 24-h recall) (N = 388 individuals with obesity).
NutrientsDifference between Mean of Four 24-h Recall and Mean of Three 24-h Recall after Exclusion of:
First 24-h RecallSecond 24-h RecallThird 24-h RecallFourth 24-h Recall
Size Effect rp-ValueSize Effect rp-ValueSize Effect rp-ValueSize Effect rp-Value
Energy (kcal)0.120.0180.21<0.001 *0.020.7380.050.312
Protein (g)0.030.5280.130.010 *0.040.4020.000.951
Fat (g)0.070.1590.150.003 *0.060.2160.070.179
Carbohydrates (g)0.120.0230.24<0.001 *0.000.9520.100.040
Vitamin C (mg)0.110.0340.160.001 *0.18<0.001 *0.18<0.001 *
Vitamin D (IU)0.080.1280.26<0.001 *0.010.9000.120.021 *
Vitamin A (µg)0.020.7400.050.3550.100.0610.25<0.001 *
Iron (mg)0.090.0760.160.001 *0.030.5060.140.005 *
Calcium (mg)0.110.0340.18<0.001 *0.020.6660.130.008 *
Magnesium (mg)0.070.1760.110.029 *0.050.2920.150.004 *
Total water (g)0.090.0750.110.028 *0.040.3760.020.735
Fiber (g)0.140.006 *0.18<0.001 *0.060.2550.130.010 *
Vitamin K (µg)0.060.2580.170.001 *0.150.003 *0.20<0.001 *
Thiamine (mg)0.080.1310.110.0320.090.0880.120.016 *
Riboflavin (mg)0.080.1390.100.0560.040.4310.22<0.001 *
Niacin (mg)0.010.7960.080.1350.060.2560.080.117
Vitamin B6 (mg)0.010.8770.080.1370.100.0560.060.252
Folates (µg)0.160.002 *0.19<0.001 *0.090.0800.180.001 *
Vitamin B12 (µg)0.140.004 **0.170.001 *0.080.0950.120.014 *
Pantothenic acid (mg)0.050.2870.060.2160.030.5640.18<0.001 *
Betaine (mg)0.050.3520.27<0.001 *0.19<0.001 *0.19<0.001 *
Choline (mg)0.010.7900.24<0.001 *0.060.2340.010.900
Copper (mg)0.060.2270.120.020 *0.030.5210.18<0.001 *
Fluor (µg)0.060.2590.100.0510.070.1840.22<0.001 *
Phosphor (mg)0.070.1540.110.027 *0.020.6420.110.032 *
Manganese (mg)0.000.9220.120.015 *0.010.8600.19<0.001 *
Selenium (µg)0.010.7750.070.1690.000.9400.060.206
Zinc (mg)0.070.1880.090.0710.050.3080.110.025 *
Potassium (mg)0.160.001*0.20<0.001 *0.060.2650.080.121
Sodium (mg) 0.060.2760.170.001 *0.050.3710.040.433
EPA (mg)0.25<0.001 **0.19<0.001 *0.150.002 *0.160.002 *
DHA (mg)0.24<0.001 **0.20<0.001 *0.18<0.001 *0.160.002 *
Sugars total (g)0.100.0510.150.004 *0.050.3100.19<0.001 *
Vitamin E (g)0.010.8850.080.1180.100.0480.18<0.001 *
Fatty acids total saturated (g)0.070.1800.19<0.001 *0.060.2260.090.068
LA (g)0.120.0140.23<0.001 *0.040.4510.090.062
ALA (g)0.180.001 **0.27<0.001 *0.050.3490.110.027 *
Wilcoxon signed rank test, r = size effect. Significant differences after false discovery rate correction are marked in bold; * negative differences; ** positive differences; ALA—alpha-linolenic acid, EPA—eicosapentaenoic acid, DHA—docosahexaenoic acid, LA—linoleic acid.
Publisher’s Note: MDPI stays neutral with regard to jurisdictional claims in published maps and institutional affiliations.

