Article

A Comparative Study of Different Sorbents in the Context of Direct Air Capture (DAC): Evaluation of Key Performance Indicators and Comparisons

Department of Chemical Engineering, Imperial College London, South Kensington, London SW7 2AZ, UK
*
Author to whom correspondence should be addressed.
Appl. Sci. 2022, 12(5), 2618; https://doi.org/10.3390/app12052618
Submission received: 26 January 2022 / Revised: 24 February 2022 / Accepted: 1 March 2022 / Published: 3 March 2022
(This article belongs to the Special Issue Advances in Carbon Dioxide Removal Technologies)

Abstract

:
Direct air capture can be based on an adsorption system, and the used sorbent (chemisorbents or physisorbents) influences process. In this work, two amine-functionalized sorbents, as chemisorbents, and three different metal organic frameworks, as physisorbents, are considered and compared in terms of some key performance indicators. This was carried out by developing a mathematical model describing the adsorption and desorption stages. An independent analysis was carried out in order to verify data reported in the literature. Results show that the equilibrium loading is a critical parameter for adsorption capacity, energy consumption, and cost. The considered metal organic frameworks are characterized by a lower equilibrium loading (10−4 mol/kg) compared to chemisorbents (10−1 mol/kg). For this reason, physisorbents have higher overall energy consumptions and costs, while capturing a lower amount of carbon dioxide. A reasonable agreement is found on the basis of the operating conditions of the Climeworks company, modelling the use of the same amine cellulose-based sorbent. The same order of magnitude is found for total costs (751 USD/tonneCO2 for our analysis, compared to the value of 600 USD/tonneCO2 proposed by this company).

1. Introduction

Global warming and climate change are being caused by the increase in greenhouse gases, primarily carbon dioxide (CO2), in the atmosphere. CO2 emissions were estimated to be more than 33 Gtons in 2018 [1]. In order to achieve the “2 °C target” proposed by the Intergovernmental Panel on Climate Change (IPCC), CO2 may need to be captured at a rate of 25 Gt/yr in 2050 [2]. About half of these emissions are due to diffuse sources, belonging to the transport sector and small sources (homes and offices) [3].
CO2 can be captured by using a negative emission technology such as Direct Air Capture (DAC), proposed first as a mitigation option by Lackner in 1999 [4,5,6]. By using this technology, the captured CO2 can be verifiably removed from the atmosphere. Potential technologies include Direct Air Carbon Capture and Storage (DACCS) processes, or the CO2 could potentially be used in a Direct Air Carbon Capture and Utilization (DACCU) system [7,8,9].
Direct Air Capture technologies might include absorption, adsorption, mineral carbonation, membrane, photocalysis, cryogenic separation, electrochemical approaches, and electrodialysis [4,10,11,12,13,14,15]. However, among these, absorption and adsorption are the most mature and most investigated in the literature [4].
For defined advantages of adsorption system, potential applications for CO2 capture using this technology are growing significantly and this work is focused on this technology addressing the relative merits of different sorbents (among physisorbents and chemisorbents), from a performance point of view, regarding capacity, energy efficiency, and economic viability [16,17].
For physisorption, only a physical interaction occurs between CO2 and surface sorbent, weak Van Der Waals forces are established, and low CO2 adsorption capacities are exhibited, owing to the relatively low adsorption heat [18]. Potential sorbents include zeolites, activated carbons, metal-organic frameworks (MOFs), and other new materials (e.g., boron nitride nanosheets and nanotubes) [10,19].
Particular interest has recently been paid towards MOFs, as underlined by publications growing rapidly in the last decade [20,21,22,23,24,25,26]. In fact, MOFs have a specific surface area much higher than other porous materials such as activated carbons and zeolites with values up to 7140 m2/g [27,28].
Chemisorption involves a chemical reaction between CO2 and surface sorbent, for example, an amine functionalized sorbent, making the CO2 capture capacity larger [29,30]. Amine-functionalized sorbents are divided in three different classes [4]. In class I, there is a physical impregnation of amines on a porous support. In class II, amines are covalently bonded on the walls of porous support, while in class III, amine monomers are polymerized in situ, resulting in a polyamine structure bonded to the walls of support.
Chemisorbents are investigated in more detail than MOFs for air capture, due to their high uptake capacity and selectivity, resilience to humidity (which has a positive effect on CO2 capture), and the possibility of regeneration under relatively mild conditions [3,10].
Generally, research in this field has explored and optimized adsorption capacities, kinetics and regenerability for amine-functionalized sorbents individually [31,32,33,34,35,36] and this is also the case for MOFs [37,38,39,40,41].
Experimentally, as shown in Table 1, it has been found that for amine-based sorbents of class I, CO2 uptakes can be up to 3.36 molCO2/kg of sorbent for a polyethylenimine (PEI) functionalized hierarchical bimodal meso/microporous silica support in the presence of 19% of relative humidity [32]. A mixture of PEI and poly(ethylene glycol) (PEG) impregnated on a fumed silica support has been reported in Meth et al. [42] with an adsorption capacity of 6.8 × 10⁻¹ molCO2/kg. Brilman and Veneman [43] considered a mixture of tetraethylenepentamine (TEPA) and PEI, obtaining a CO2 uptake of 2.5 molCO2/kg, using temperature swing adsorption for regeneration. Other amines which have been investigated are: poly(propylenimine) (PPI) [33,44] and poly(allylamine) (PAA) [45].
For amine-based sorbents of class II, CO2 uptakes of up to 2.13 molCO2/kg and 3.89 molCO2/kg have been obtained, respectively for 3-aminopropylmethyldiethoxysilane (APDES) grafted onto nanofibrillated cellulose (NFC) [46] and hydrazine (H2N4) onto Mg2(dobpdc) [47]. Good adsorption capacities are also reported in the work of Belmabkhout et al. [30], Ng et al. [48], and Choi et al. [40], respectively of 1.4 molCO2/kg for triaminesilane (TRI) onto MCM-41, 1.39 molCO2/kg for N-(2-aminoethyl)-3-aminopropylmethyldimethoxysilane (AEAPDMS) onto NFC and 1.5 for ethylenediamine (ED) grafted onto Mg/DOBDC.
Lower CO2 uptakes are measured for amine-functionalized sorbents of class III. In total, 1.78 molCO2/kg and 1.68 molCO2/kg are shown in the work of Choi et al. [49] and Abhilash et al. [36]. In the first case, aziridine is considered with silica support, while in the second case, 3-aminopropyl triethoxysilane (APTMS) is evaluated in hybrid silica material.
Similar experimental analyses have been carried out for MOFs, showing adsorption capacities to be lower compared to those of amine-based sorbents, as in Table 2. Capacities of 0.18 molCO2/kg for SIFSIX-3-Ni [50], 0.05 molCO2/kg for HKUST-1 [39], and 0.14 for Mg-MOF-74 [51] have been measured.
These experimental analyses are complemented by mathematical models, which are able to replicate the process cycles, explore operating conditions not investigated in experimental work, and save time and cost for screening, development, and optimization [52]. More importantly, modeling can carry out economic and energetic analysis to evaluate costs and energy consumption, including the thermal energy required for the desorption stage and the electrical energy for fans blowing air through the air sorbent contactor.
Moreover, other key performance indicators (KPIs) can also be evaluated by using mathematical models, with the aim to compare, screen, and select the best scenarios.
Estimates of costs and energy consumptions for main DAC technologies, and in particular for adsorption systems are reported by Fasihi et al. [53]. Here, electricity requirements can range between 150 and 300 kWhel/tonneCO2 for amine-based sorbents, and up to 1420 kWhel/tonneCO2 for MOFs. On the other hand, thermal energy of between 1170 and 2000 kWhth/tonneCO2 is required. Regarding costs for adsorption, as reported in Table 3, Fasihi et al. [53] suggest a value between 63 and 86 USD/tonneCO2 obtainable by 2040.
The expected cost for the technology in the future is lower than those evaluated by others in the literature for the present day. Kulkarni and Sholl [54] report a cost of CO2 capture of 43–494 USD/tonneCO2, while Zhang et al. [18] suggest a cost between 91 and 227 USD/tonneCO2 (not including capital costs for equipment). Sinha et al. [55] estimate a cost of capture of 60–190 USD/tonneCO2 (without discounting cash flows, and assuming a self-contained sorbent). However, these analyses reported in the literature are conducted with different assumptions for energy inputs, different output conditions (pressure and CO2 purity), and without transparency [53].
Estimates provided by companies are also present in the literature. Generally, these companies suggest a low cost, but such estimates need to be considered in the context that the companies are in the process of commercializing the technology [2]. Climeworks is expecting to reduce the cost from 600 USD/tonneCO2 to 100 USD/tonneCO2 by 2030, while a more optimistic forecast is proposed by Global Thermostat, with suggested costs of 15–50 USD/tonneCO2 for the near future [53]. Such costs appear to be unrealistic.
From the considered literature analysis, it is evident that there is a gap to conduct an independent and complete analysis to evaluate some important KPIs, such as costs (operating and capital) and energy consumption of a number of important DAC technologies, including chemisorption and physisorption, based on the design of DAC process. Of the two, physisorption has hitherto received less attention from the research community. The work of Sabatino et al. [58] reports a comparison between some MOFs and amine-functionalized sorbents to evaluate costs and energy consumptions; however, their research is not based on design calculation but multi-objective optimization without any correlation between design parameters. Other research on adsorption technology are concerned with the sensitivity analysis of operating parameters [59,60], regeneration methodology [61], new adsorbent bed [62], and thermodynamics [63].
This proposed work, following a design procedure, compares the theoretical performance and techno-economics of two amine-functionalized sorbents, SI-AEATPMS ([N-(2-aminoethyl)-3-aminopropyl]trimethoxysilane (AEATPMS) grafted on silica gel) and APDES-NFC-FD (3-aminopropylmethyldiethoxysilane (APDES) on nanofibrillated cellulose (NFC)), in addition to three different MOFs (MIL-101, MOF-177, MOF-5), with the aim to capture CO2 from dry air, by using an adsorption system based on temperature swing for regeneration.
We are supposing conditions without the relative humidity of air due to limitations in the literature data for the selected sorbents. In any case, this assumption reduces the energy consumption of the desorption stage for chemisorbents and to ensure a higher capture efficiency for physisorbents.
SI-AEATPMS and APDES-NFC-FD are considered because they were suggested by the Climeworks company for DAC systems. MOF-5, MOF-177, and MIL-101 are taken into account because they have already been used in the literature for carbon dioxide capture with good performances and advantages compared to other sorbents (high adsorption capacity, thermally stable, and good strength to withstand pressures) [64,65]. As the most investigated in the literature and in real applications for CO2 capture, these sorbents can provide a good representation of the whole families of sorbents. The chemisorbents and physisorbents are analyzed and compared in terms of the previously mentioned KPIs (electricity and thermal energy consumption, costs and amount of CO2 captured or CO2 productivity), and against data provided by the Climeworks company for the first “commercial” plant in the world, used as a case study. The defined KIPs are chosen because they suggest the techno-economic feasibility of the process. A mathematical model describing the adsorption and desorption stage is developed, to allow an independent analysis.

2. Mathematical Modelling

2.1. Sorbents and Adsorbent Bed

Here, the MOFs (MIL-101, MOF-5 and MOF-177) (physisorbents) are compared against two amine-functionalized chemisorbents which have been suggested by Climeworks to be of interest. In particular, the APDES-NFC-FD sorbent is used by this company in its plant located in Switzerland. These amine-based sorbents are: SI-AEATPMS ([N-(2-aminoethyl)-3-aminopropyl]trimethoxysilane (AEATPMS) grafted on silica gel) and APDES-NFC-FD (3-aminopropylmethyldiethoxysilane (APDES) onto nanofibrillated cellulose (NFC)), both belonging to class 2.
MOFs are considered because of their high porosity, ordered and well-characterized porous structures, and adjustable chemical functionality which makes them potentially very attractive for CO2 adsorption [66]. These properties are purported to allow them to capture and release CO2 with fast kinetics and high reversibility over many cycles. Little data are present in the literature about CO2 capture using these kinds of sorbents. In contrast, amine-functionalized sorbents are selected for study because their strong bonds with CO2 allow significant uptake at low CO2 partial pressure [4].
The selected sorbents are produced through synthesis routes described in the literature, as follows.
The synthesis of MOF-5 starts with a reaction between Zn(NO3)2·6H2O and 1,4 benzene dicarboxylic acid in N,N″-dimethylformamide solvent at 373 K [67]. After cooling, the mother liquor was decanted from the crystalline material, and the white solid was washed with dimethylformamide [68]. Properties such as the BET specific surface area, average particle size, and micropore volume have been evaluated and reported by Zacharia et al. [69], and are respectively 3570 m2/g, 2 μm, and 1.25 cm3/g.
MOF-177 can be obtained through a room temperature technique, mixing benzenetribenzoic acid and zinc acetate dehydrate with diethylformamide. The obtained compound was filtered, washed with diethylformamide, then chloroform was added to remove impurities. After that, the MOF was thermally activated under vacuum at 393 K [70]. Pore textural properties were provided by Saha and Deng [71]: BET specific surface area, pore diameter, and pore volume are, respectively, 1218 m2/g, 14.4 Å, and 0.748 cm3/g.
For the synthesis of chromium terephthalate metal–organic framework (MIL101) a mixture of benzene-1,4-dicarboxylic acid, chromium(III) nitrate nonahydrate, hydrogen fluoride, and water was heated at 493 K, forming a green crystalline powder. After a natural cooling, the obtained material was filtered to separate the MIL-101 powder [72]. This MOF is characterized by a high BET surface area (>3000 m2/g), a large pore diameter (29–34 Å), and a huge pore volume (≈2 cm3/g) [73].
The SI-AEATPMS sorbent has been synthetized by drying silica gel beads inside a natural convection oven at 383 K, before loading with AEATPMS, in a two-neck flask equipped with a reflux condenser. The mixture was heated at 423 K in a silicone oil bath for 3 h. After cooling to 298 K, the solid product was washed in diethyl ether, and dried in ambient air for 24 h [74]. BET surface area, pore volume, and average pore size were 216 m2/g, 0.65 cm3/g, and 9.6 nm.
The other amine-functionalized sorbent, APDES-NFC-FD, has been obtained by adding APDES to NFC hydrogel to obtain a suspension of 10% w/w of APDES, and incubated for 2 h. This compound was then added dropwise into liquid N2 to produce a freeze-dried frozen granulate. The obtained material was then subjected to thermal treatment at 393 K under N2 flow in a natural convection oven. The final grains had a BET surface area of 12.2 m2/g, [75].
Data regarding particle and density diameter, and bed porosity for the considered MOFs are reported in Table 4, while the same parameters for amine-based sorbents are shown in Table 5.
For the air contactor, the assumptions in Table 6 are made, based on those reported by Climeworks [78]. The company has a plant with 18 adsorbent unit beds, 3 rows of beds with 6 bed units each. At any given time, some collector units are capturing CO2, while others are releasing CO2, meaning that the overall plant operates continuously. In this work, we modelled a single-unit adsorbent bed, considering the air flow rate of one collector. Moreover, in the Climeworks plant, the sorbent is arranged in at least two stacked layers [79]. Each layer could be considered as a very short, packed bed. The void fraction takes into account the void between each layer and among particle sorbents. This justifies our assumption to model the air contactor as a packed bed.
The single module has an area footprint excl. options of 20 m2, with a height of 3.2 m. In total, 180 kg/day of CO2 are fed with an air flow rate of 2.86 m3/s (the CO2 concentration in the air is 400 ppm).

2.2. Model Equations

The simulation model is based on a gas phase and adsorbed phase material balance, requiring one partial differential equation and one ordinal differential equation to be taken into account. The Maple tool was used for the solution of this equation system. Overall, the following assumptions are made for the analyzed system: the gas phase follows the idea of gas laws due to the low partial pressure, radial gradients are neglected, the bed is isothermal (due to the low partial pressures and concentrations of the adsorbable component, neglecting heat of adsorption and velocity [80]), constant bed porosity and physical properties, negligible N2 and H2O adsorption compared to CO2 (due to the low partial pressure and ideal conditions, interactions between molecules are neglected, then the adsorption can be considered as a single component, while we are assuming that water is removed before the adsorption as defined above), and the linear driving force (LDF) model is used for adsorption kinetics. Regeneration of the sorbent is conducted by changing the bed temperature, i.e., a Temperature Swing Adsorption (TSA) process, as the scheme in Figure 1.
The gas phase material balance for CO2 is described by the 1D axial dispersed plug flow model, as in the following equation [81] (see Equation (1)):
c c o 2 t = v g a s · c c o 2 z + D z · 2 c c o 2 z 2 1 ε ε   · ρ p · d q d t
where Dz is the axial dispersion coefficient (m2/s), z is the axial coordinate (m), vgas is the interstitial gas velocity (m/s), t is time (s), ε is the bed void fraction, q is the loading (mol/kg), CCO2 is the CO2 gas-phase concentration (mol/m3), and ρp is the particle density (kg/m3). The axial dispersion coefficient is evaluated by the following correlation [82] (Equation (2)):
D z = ( 0.45 + 0.55 · ε ) · D m + 0.35 · R p · v g a s
with Dm being the molecular diffusivity of CO2 in air (m2/s), ε the bed void fraction, vgas the gas velocity (m/s), and Rp the particle radius (m).
The behavior of the adsorbed phase is described by a linear driving force approximation, as in the following equation [83] (Equation (3)):
d q d t = k l · ( q * q )
where kl is the LDF mass transfer coefficient or adsorption time constant (s−1), q* is the equilibrium adsorbed amount (mol/kg) while q and t are, respectively, the loading (mol/kg) and the time (s) as defined before. According to this approximation, the adsorption rate is proportional to a linear gradient between the adsorbed amount on the sorbent and the amount adsorbed in equilibrium with the bulk concentration [52]. The mass transfer rate is evaluated by the film, microporous and microporous resistances of gases through the porous material as expressed by (see Equation (4)) [27]:
1 k l = R p · q o * 3 · k f · C o + R p 2 · q o * 15 · ε p · D e · C o + r c 2 15 · D c                  
where, Rp is the particle radius (m), Dc is the diffusivity in the micropore (m2/s), De is the effective diffusivity (m2/s), kf is the film mass-transfer coefficient (m/s), rc is the microparticle radius (m), εp is the particle porosity, and qo* (mol/m3) is the equilibrium adsorbed phase concentration at the inlet concentration Co (mol/m3). The film mass transfer coefficient is evaluated from Sherwood number as follows [81] (see Equations (5) and (6)):
S h = 2 + 1.1 · R e 0.6 · S c 0.33
k f = S h · D m d p
where Sh is the Sherwood number, Re is the Reynold number, Sc is the Schmidt number, Dm is the molecular diffusivity (m2/s), and dp is the particle diameter (m). The correlation is verified for a range of Reynold number between 3 and 104, with values of dimensionless group in Table S1 of Supporting Information. Using these correlations, the values of kl for MOF-177 at 298 K and 373 K are, respectively, 1.49 × 10⁻¹ s−1 and 1.69 × 10⁻¹ s−1. For MOF-5 this parameter is 0.019 s−1 at 298 K and 3.3 × 10⁻² s−1 at 373 K. For MIL-101, the adsorption time constant is of 3.3 × 10⁻² s−1 at 298 K and 7.5 × 10⁻² s−1 at 373 K. The SI-AEATPMS sorbent has a value of kl of 4 × 10⁻⁴ s−1 at 298 K and 5 × 10⁻⁴ s−1 at 383 K, while for the APDES-NFC-FD sorbent the same parameter has a value of 3.8 × 10⁻³ s−1 at 298 K and 5.7 × 10⁻³ at 373 K.
Different adsorption equilibrium isotherms have here been fitted according to the experimental data from the literature at different temperatures.
For MOFs sorbents, equilibrium isotherms are described by the single site Langmuir model [65,75,84] utilizing the following relations (see Equations (7) and (8)):
q * = q s a t · b · P c o 2 1 + b · P c o 2
b = b o · e Δ H c o 2 R · T              
with qsat being the maximum adsorbed amount or monolayer capacity (mol/kg), q* the adsorbed amount in equilibrium (mol/kg), PCO2 the CO2 partial pressure (bar), b the adsorption constant as a function of temperature (1/bar), R the universal gas constant (J/molK), ΔHCO2 the CO2 adsorption enthalpy (J/mol), T the temperature (K), and bo the adsorption constant at infinite dilution independent of temperature (1/bar). These above data are reported for each MOF in Table 7.
Equations (7) and (8) are used to describe the adsorption and desorption phases, evolving at two different temperatures: the adsorption is carried out at 298 K, while the desorption takes place at 373 K.
For the SI-AEATPMS sorbent, the adsorption stage, considered at 298 K, is described by the Freundlich isotherm model, as in the following relation [74] (see Equation (9)):
q * = 1.001 · P c o 2 1 8.758
with PCO2 being the CO2 partial pressure (bar) and q* the adsorbed amount in equilibrium (mol/kg). The desorption stage, taking place at 383 K, is, on the other hand, defined (within the literature used) by the Langmuir model as in Equations (7) and (8), with a value for qsat of 0.295 mol/kg and a value for b parameter of 16.1 1/bar [74]. The transition to the Langmuir model from the Freundlich one occurs in the temperature range of 343–383 K, because adsorbate–adsorbate interactions are insignificant above this temperature [86].
The Toth model is used to describe the adsorption and desorption stages, respectively, at 298 K and 373 K, for the APDES-NFC-FD sorbent, as defined in the following correlations [65] (see Equations (10)–(13)):
q * = n s · b · P c o 2 ( 1 + ( b · P c o 2 ) t ) 1 t    
b = b o · e Δ H c o 2 , o R · T o ( T o T 1 )                      
n s = n s o · e χ · ( 1 T T o )                          
t = t o + α · ( 1 T o T )                      
with PCO2 being the CO2 partial pressure (bar), q* the adsorbed amount in equilibrium (mol/kg), T the temperature in K, and ΔHCO2,o the negative of the isosteric heat of adsorption at zero fractional loading (J/mol), To the reference temperature of 296 K, ns (mol/kg) and b (1/bar) the constants in the equation, which are a function of temperature, referring, respectively, to the maximum adsorption capacity and adsorption affinity, while t characterizes the system heterogeneity; to, bo (1/bar), and nso (mol/kg) are the Toth parameters at the reference temperature, while α and χ are dimensionless constants. Table 8 shows the value of each parameter [74].
To solve the partial differential equation, initial and boundary conditions are first required. For the ordinary differential equation describing the loading only one initial condition is fixed. These boundary conditions are different for the adsorption and desorption stages. For the adsorption stage, the following initial and boundary conditions are considered (see Equations (14)–(16)):
c c o 2 = q = 0         t = 0    
c c o 2 = c c o 2 ,   i n l e t             z = 0 ,   t > 0
c o 2 z = 0               z = L ,   t > 0          
For the desorption stage, these relations are set as initial conditions (see Equations (17) and (18)):
c c o 2 = c c o 2 ,   i n l e t     t = 0        
q = q i n l e t     t = 0
On the other hand, the following boundary conditions are utilized for the regeneration stage (see Equations (19) and (20)) (the supply of CO2 is stopped during the desorption):
c c o 2 = 0           z = 0 ,   t > 0  
c o 2 z = 0               z = L ,   t > 0              

2.3. Energy Consumption

Energy consumption includes the electrical energy for fans, and the thermal energy for sorbent regeneration. The fan power is calculated by Equation (21) using the Ergun equation as in Equation (22) for the evaluation of pressure drop over the bed [3,80,87] (see Equations (21) and (22)):
P f = 2.72 · 10 5 Q · Δ P μ f · μ m  
Δ P L = 150 · μ · v g a s d p 2 · ( 1 ε ) 2 ε 3 + 1.75 · ρ g a s · v g a s 2 d p · ( 1 ε ) ε 3
where Q is the fan volume (m3/h), ΔP is the pressure drop (cm of water column in Equation (21) and Pa in Equation (22)), Pf is the fan power (kW), L is the bed height (m), μ is the gas viscosity (Pas), vgas is the gas velocity (m/s), ε is the bed void fraction, ρgas is the gas density (kg/m3), dp is the sorbent diameter (m), μf is the fan efficiency, and μm is the motor efficiency.
Thermal energy for regeneration is evaluated according to Equation (23) [18,88,89,90,91]:
Q r = 1 q w · c p , s · ( T d e T a d ) + Δ H c o 2        
where Qr is the thermal regeneration energy (J/mol), qw is the working capacity of sorbent, being the difference between the loading at the end of adsorption and desorption stage (mol/kg), Cp,s is the specific heat capacity of sorbent (J/kgK), Tad and Tde are the adsorption and desorption temperatures, respectively (K), and ΔHCO2 is the absolute value of heat of adsorption (J/mol). The overall thermal energy considers the sensible heat and adsorption heat. The sensible heat required to elevate the adsorbent to the desorption temperature while the second term represents the latent heat needed to break the bond between the carbon dioxide and the adsorbent for regeneration.

2.4. Economic Analysis

Total costs, as the sum of annualized capital (CAPEX) and operating (OPEX) costs, were evaluated according to the procedure suggested by Peter and Timmerhaus for a fluid–solid process type with a detailed factorial estimate [92]. Day zero costs are calculated in terms of fixed capital investment (direct and indirect costs, contractor’s fee and contingency) and working capital, while annualized capital costs are evaluated considering a lifetime for the process of 20 years, with an interest rate of 10%. Installation, instrumentation and control, piping, electrical, buildings, yards improvements, service facilities, and land are considered among direct costs and as a percentage of total equipment costs. Engineering and supervision, construction expenses are for indirect costs and as a percentage of total equipment costs.
The equipment costs of an adsorbent bed and fan are calculated from Matches [93], considering carbon steel as the material. The used cost calculator provides an order of magnitude that is useful for a comparison of different processes as carried out in this work and inputs for the cost evaluation are reported in Table S2 of Supporting Information.
These costs are based on 2014, then are adjusted for inflation using the following correlation adopted from the Chemical Engineering Plant Cost Index (CEPCI) (see Equation (24)) [3]:
C o s t 2021 C o s t 2014 = C E P C I 2021 C E P C I 2014
where the values of CEPCI2014 and CEPCI2021 are, respectively, 576.1 and 655.9 [94]. A location factor is assumed for CAPEX, assuming that the plant is located in Switzerland. The updated location factor from 1993 [83] to 2021 is 0.58 [84]. OPEX are evaluated as the sum of direct production costs (raw materials and utilities and others as a percentage of capital costs such as maintenance and repairs, operating supplies, patent and royalty), fixed charges (depreciation, local taxes, insurance as a percentage of capital costs), administrative costs, distribution and selling costs, and research and development costs all evaluated as a percentage of the overall production cost.
For the calculation of OPEX, the process is assumed to be fully automated (which indicates that the costs are a base level), while the costs of sorbents, cooling water, waste heat, and electricity are shown in Table 9. Waste heat and electricity are provided by a municipal waste incinerator (MWI), as for the Climeworks plant. The price of MOFs is set to 1.95 USD/kg (the best-case scenario cost for a synthetic sorbent, assuming an efficient scalability of production) while the price of cooling water is of 0.08 USD/m3 [95]. Electricity has a cost of 0.1 USD/kWh [96], while waste heat costs 0.024 USD/kWh [96]. SI-AEATPMS sorbent has a cost of 1.3 USD/kg, while the other, amine-based sorbent has a price of 1.16 USD/kg (these costs are weighted on raw material mass fractions and raw material costs). It is assumed that all adsorbents have a lifetime of 5 years. Currently sorbents used in industry (such as zeolites, activated carbons, and silicas and aluminas) show lifetimes of 7–10 years, while for MOFs a lifetime of 5 years has been defined [95]. For this reason, we are adopting a conservative estimation on the existing knowledge, although the cycle numbers per day can be different among different sorbents.

3. Results and Discussion

Firstly, the model was validated by using the experimental data for an adsorber at the lab scale reported in the work of Wurzbacher [74], with the experimental setup as in Figure 2. In this work, CO2 is captured from air (CO2 concentration between 400 and 440 ppm) with the SI-AEATPMS sorbent (50 cm3) at 298 K. The air flow rate is of 2 × 10⁻⁵ m3/s, with 0–40% of relative humidity. Adsorber diameter and height are 40 mm, ensuring small pressure drops. The steel adsorbent bed is contained in a water bath for heating and cooling, during adsorption and desorption stages. Hot water at 75–95 °C is used for the regeneration stage, while cooling water at 20 °C is used for the cooling stage. All operating conditions are regulated by electronic controllers. At the equilibrium condition, adsorption and desorption times are 24 h and 2 h, respectively.
This means that the entire bed is in equilibrium with the feed in about 24 h, as obtained by our mathematical model and shown in the breakthrough curve of Figure S1 in the Supporting Information. This demonstrates good agreement between experimental and simulated results, validating our mathematical model.

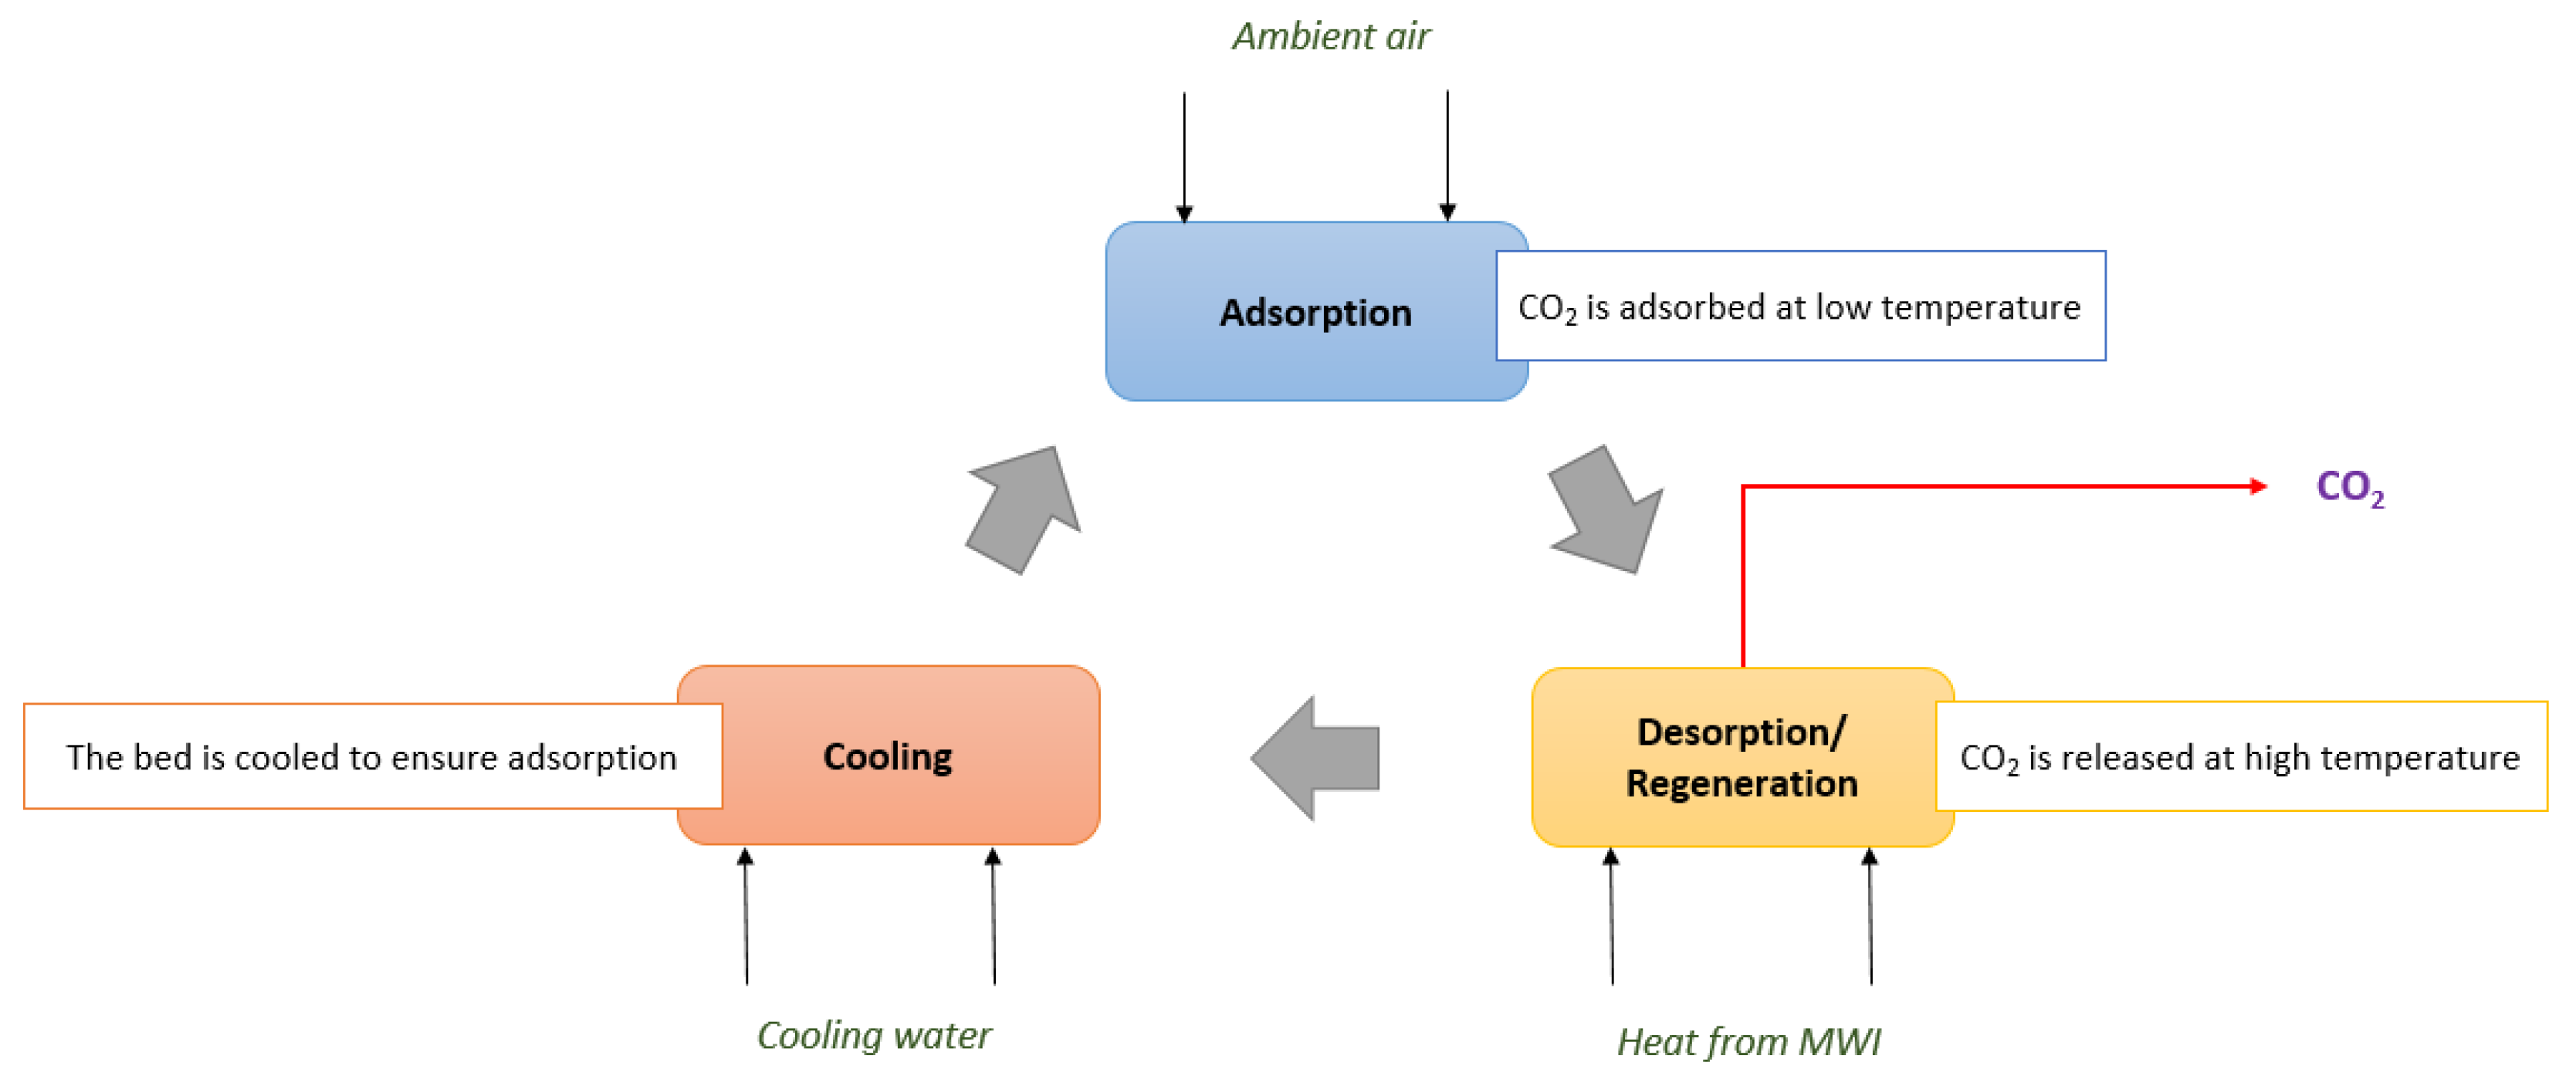
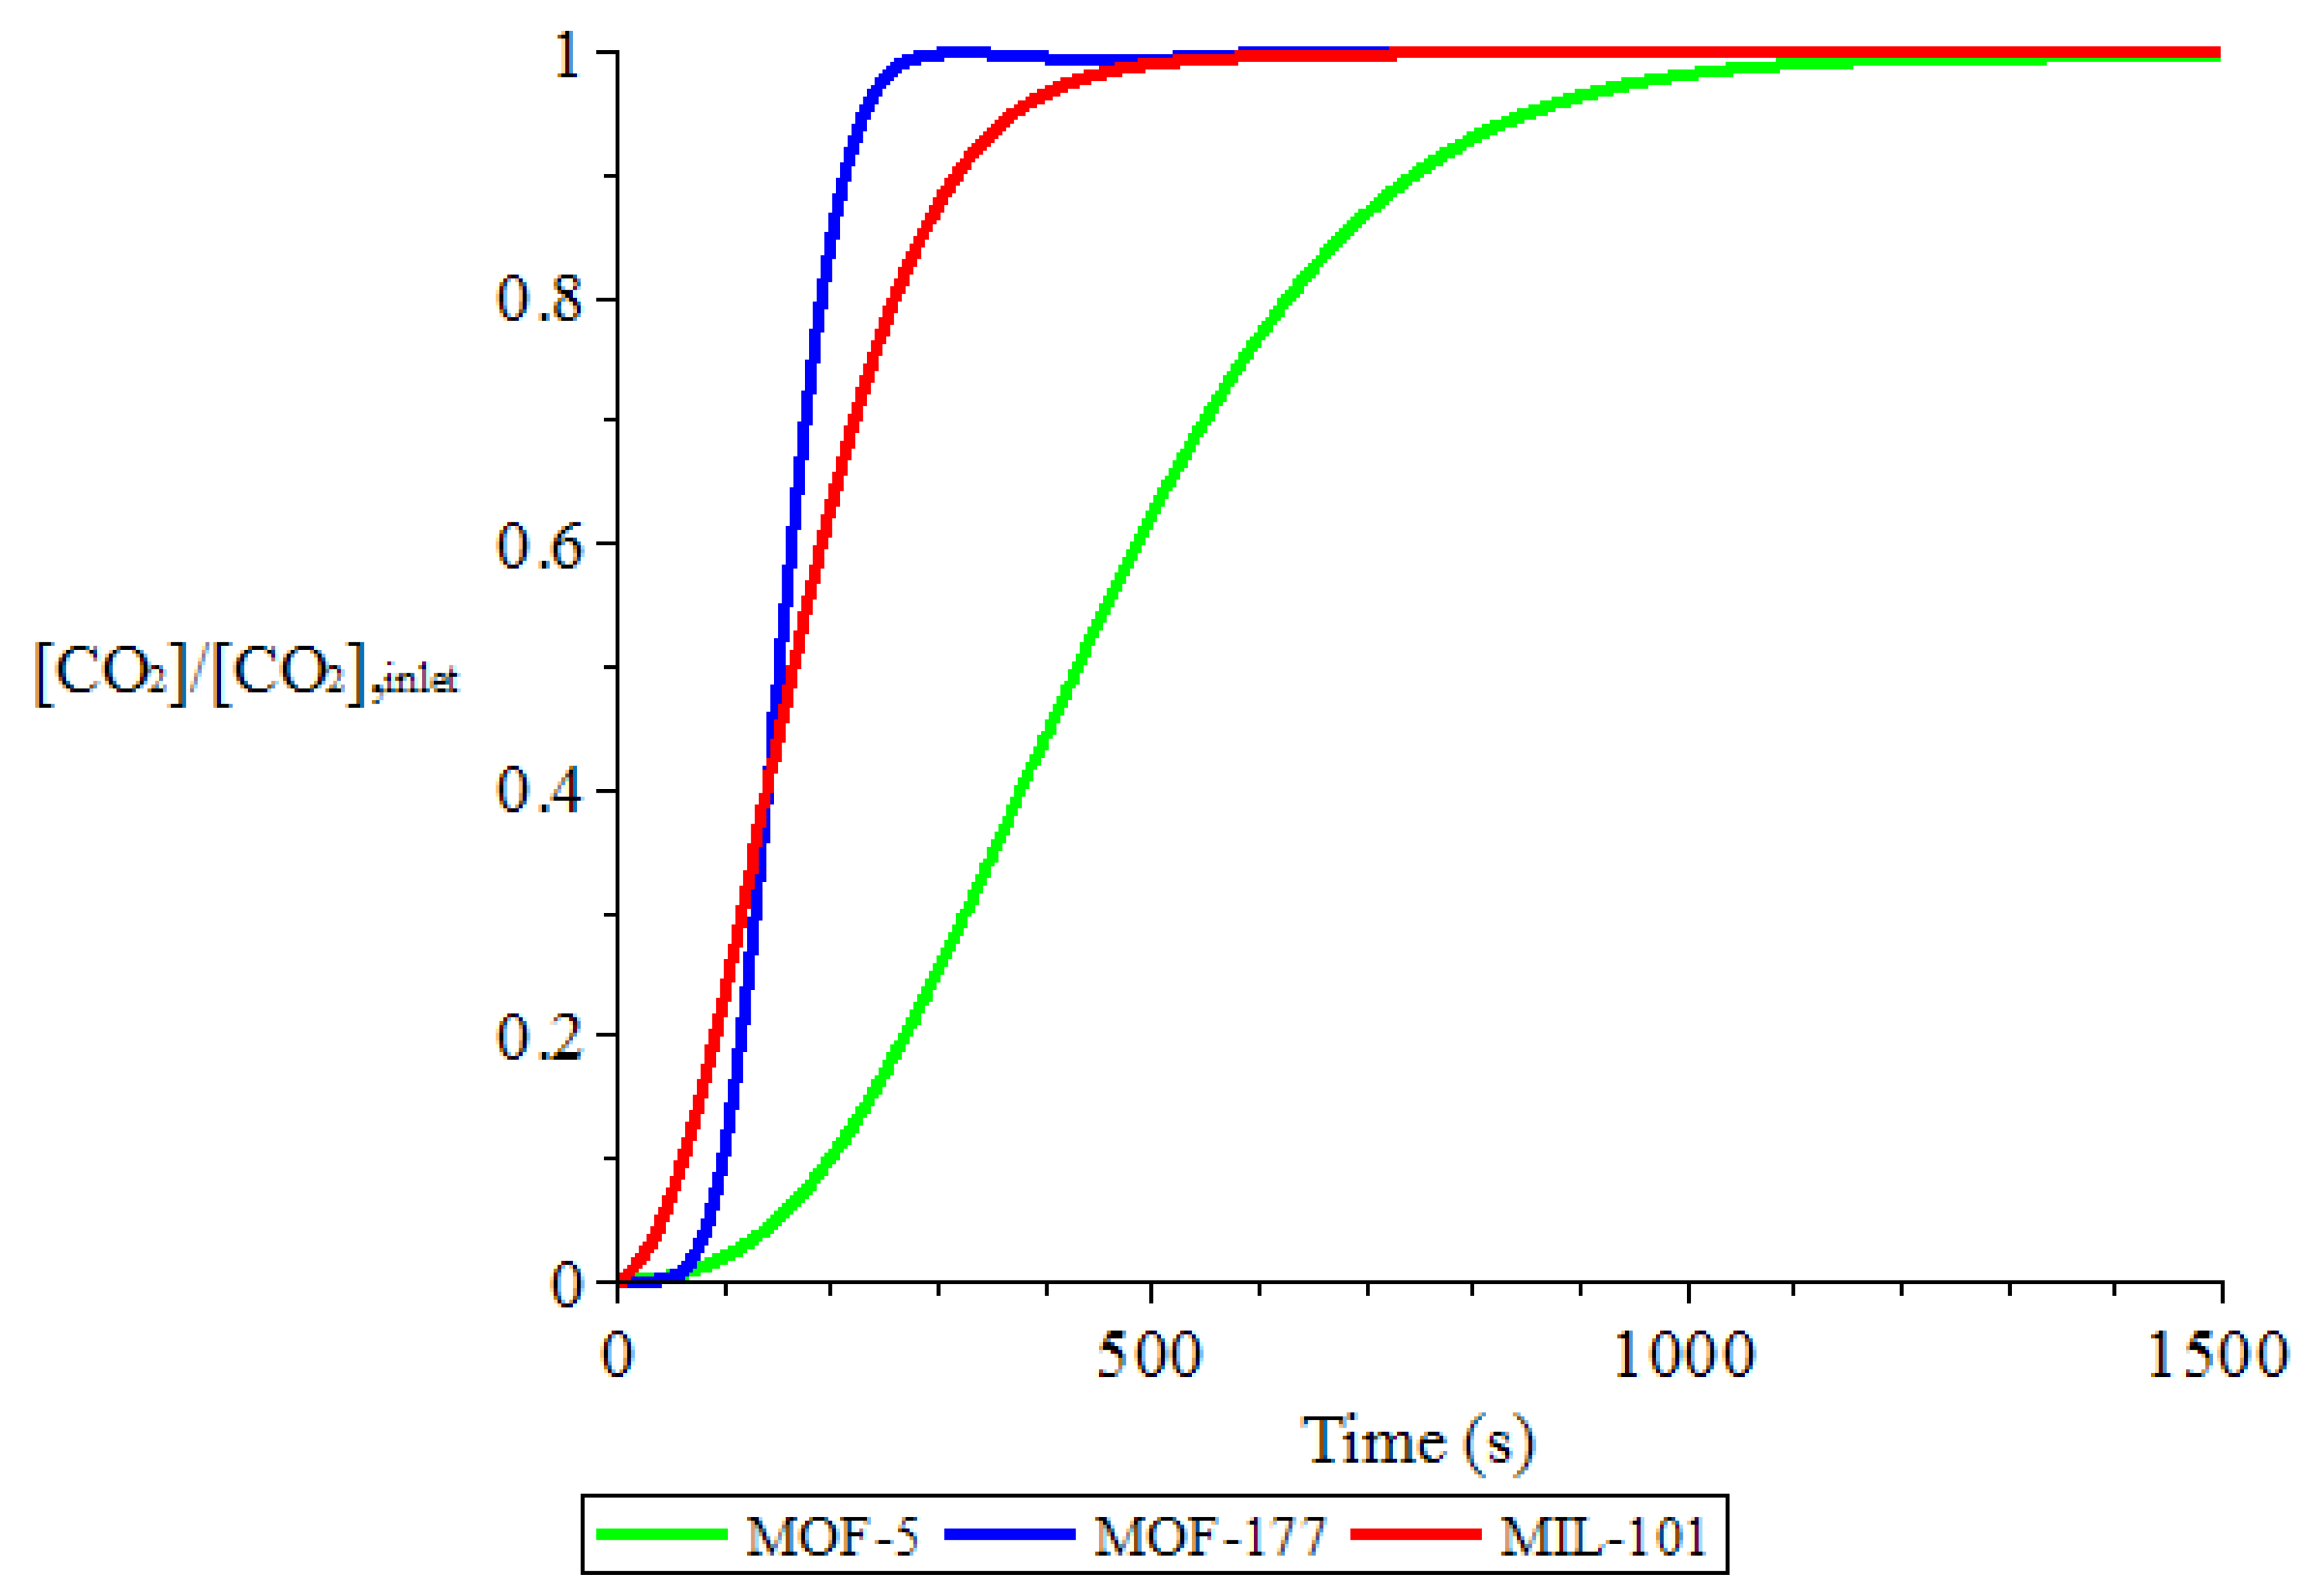
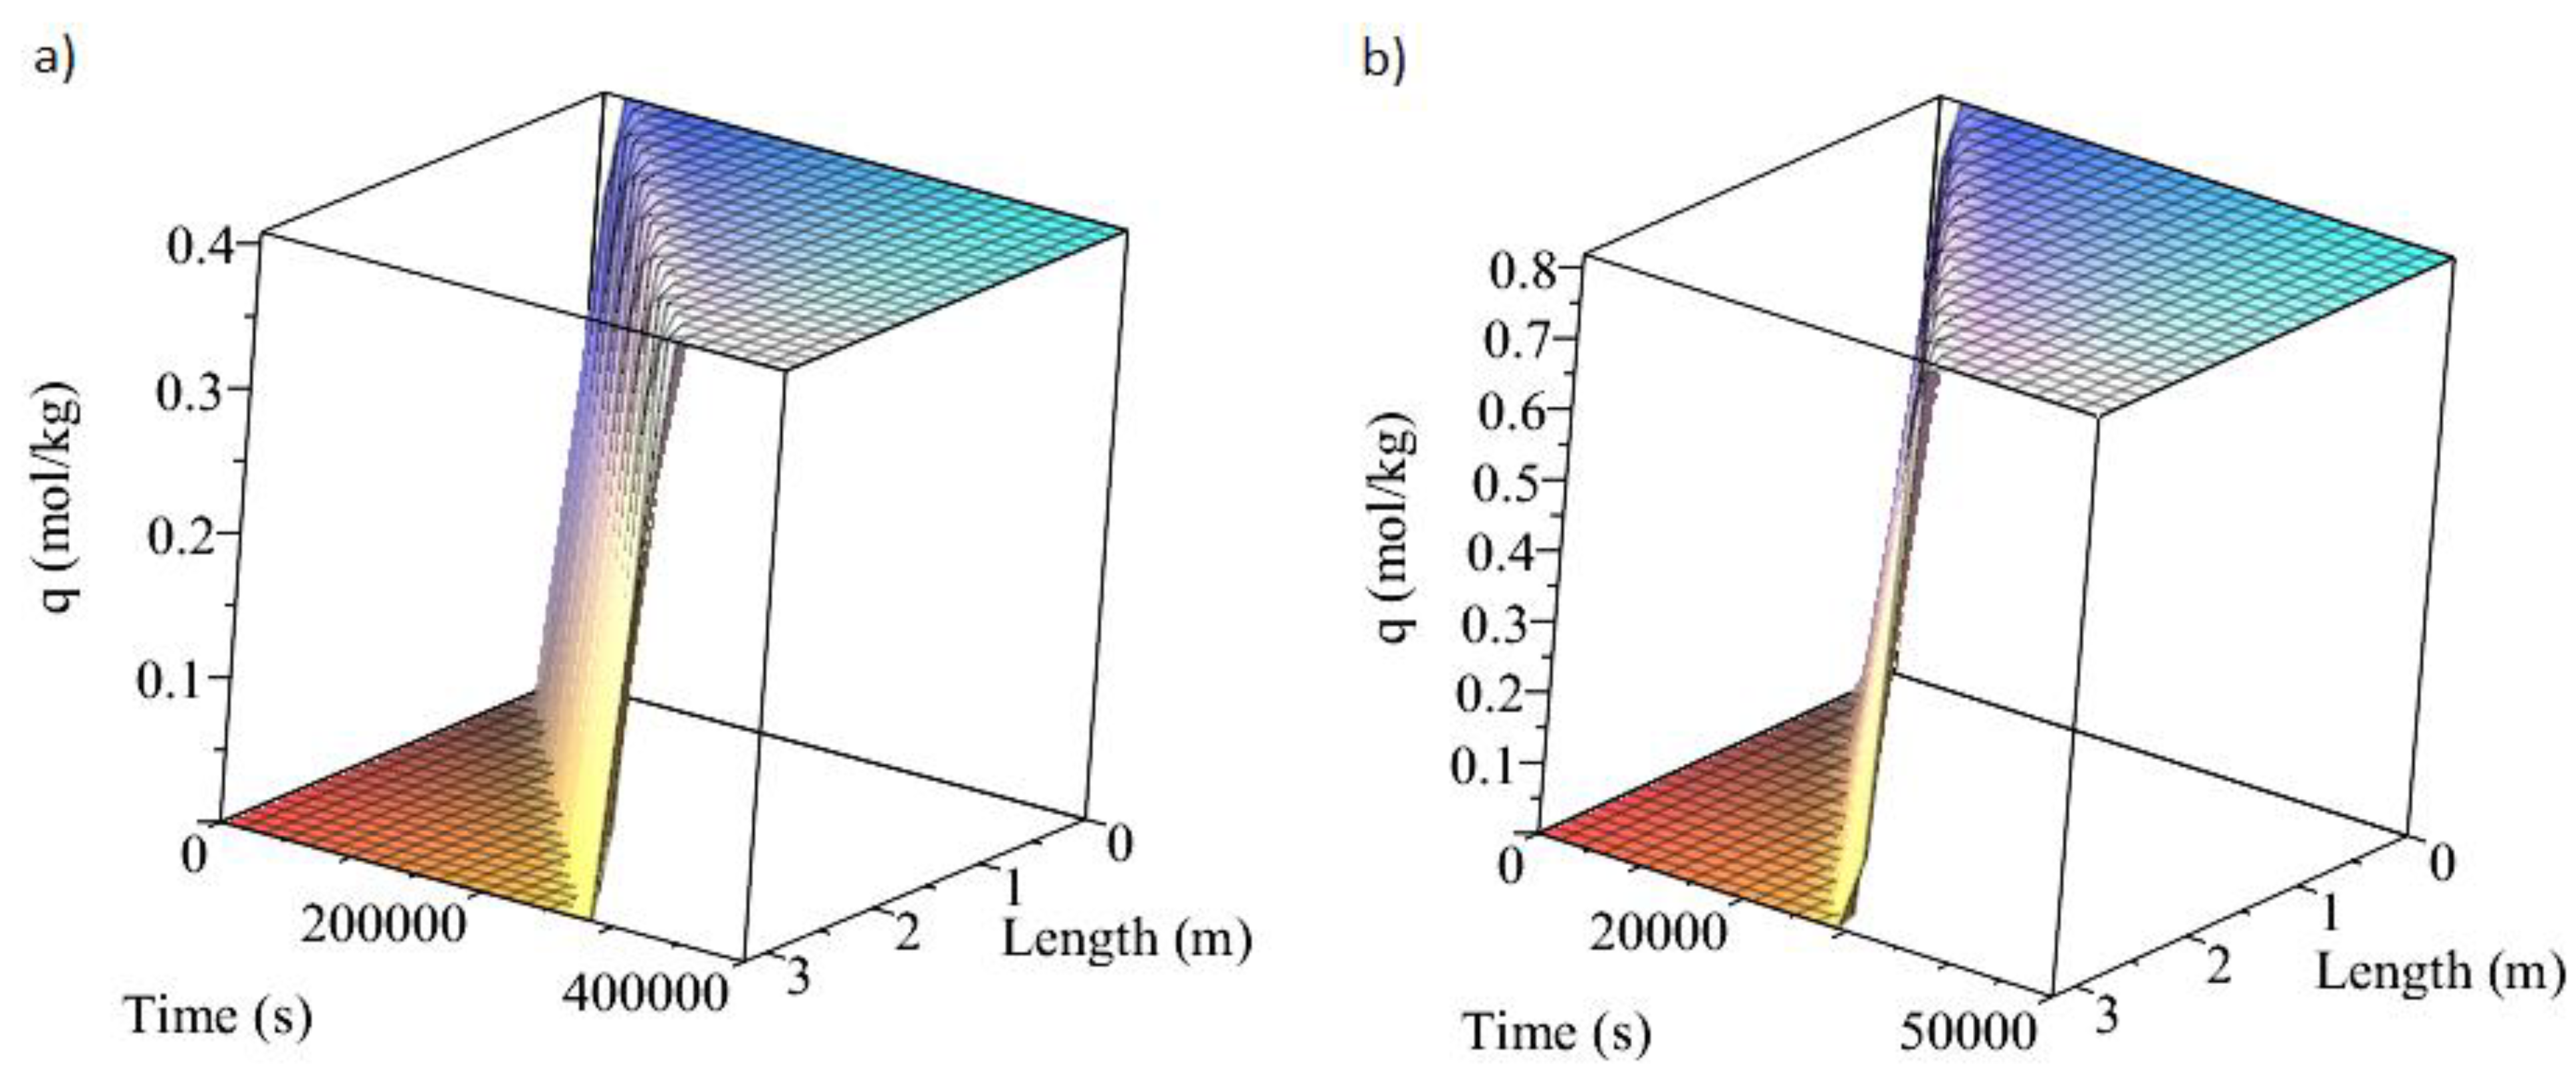
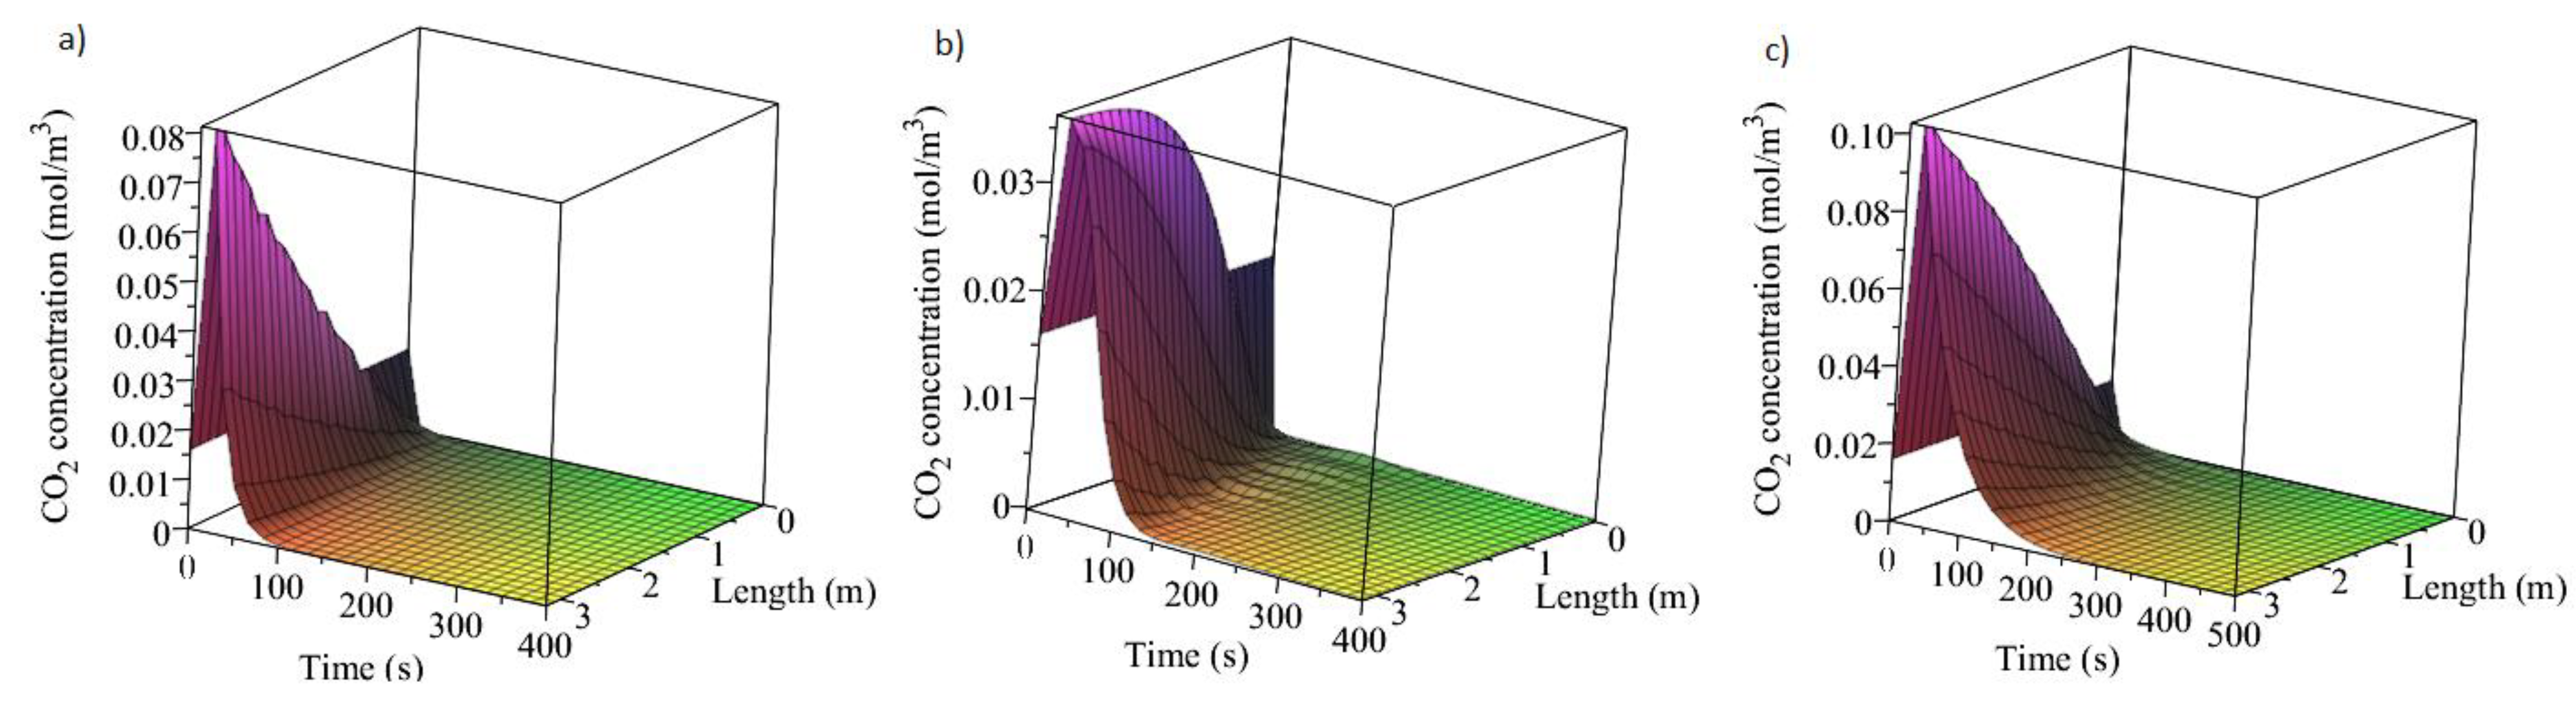
3.1. Adsorption and Desorption Curves of DAC Systems

The mathematical model provides the breakthrough curves for the adsorption of CO2, for the considered chemisorbents and physisorbents. As already mentioned, these plots show the ratio between CO2 concentration at the bed outlet and the CO2 feed concentration, as a function of time. Figure 3 shows these trends for MOFs.
Overall, in each Figure, three different sections can be identified as a function of time. At first, the concentration is zero because the step function of CO2 has not passed the end of the air contactor. After a defined time (the breakthrough time, where the outlet CO2 concentration rises to 5% of the inlet CO2 concentration), the concentration increases because CO2 reaches the end of the adsorber, and the sorbent continues to capture CO2 until it is in equilibrium with the feed. An adsorption front moves along the bed with time, defining a mass transfer zone. Finally, the sorbent does not capture any more CO2, because the entire bed is in equilibrium with the CO2 in the feed. No additional mass transfer occurs between gas and solid phases. This is defined here as the equilibration time (outlet concentration is 95% of the inlet CO2 concentration) [98]. The difference between breakthrough and equilibration times defines the length of the mass transfer zone. Generally, this value depends on the value of the mass transfer rate: a higher mass transfer rate creates a shorter mass transfer zone [98]. The higher mass transfer rates imply lower mass transfer resistance, and a higher rate of adsorption [99]. Our results show that the shortest mass transfer zone of 146.2 s is present for MOF-177 with the highest mass transfer rate of 1.49 × 10⁻¹ s−1. The greatest mass transfer zone of 703.5 s is present for MOF-5 due to the lowest mass transfer rate, of 1.9 × 10⁻² s−1. On the other hand, for MIL-101 a mass transfer zone of 331.2 s is obtained, for which the value of kl is of 3.3 × 10⁻² s−1.
These results suggest that the dynamic capacity of the adsorbent bed with MOF-177 is higher than other sorbents. Reducing the dynamic mass transfer zone increases the dynamic capacity of the bed [100]. Higher values of kl, as for MOF-177, allow a steeper curve compared to others, suggesting that the bed is being utilized more efficiently [101].
Figure 3 also suggests that the bed with MIL-101 sorbent has a very low residence time (the time that the air has spent inside the adsorber), as also reported in the work of Sinha et al. [55] for a MIL-101-based sorbent.
Breakthrough curves for amine-based sorbents are shown in Figure 4.
The same three sections are present. However, a greater mass transfer zone is present for these chemisorbents compared the previous sorbents, due to a lower mass rate constant of 4 × 10⁻⁴ s−1 for the silica gel-based sorbent, and of 3.8 × 10⁻³ s−1 for the cellulose-based sorbent. In fact, the mass transfer zone for the SI-AEATPMS is around 14,380 s, while for APDES-NFC-FD it is 1915 s. A higher mass transfer resistance is present in chemisorbents. A steeper breakthrough curve in these last sorbents is due to a higher bed porosity, the effect of which is studied in the work of Papurello et al. [97]. However, even though chemisorbents are characterized by lower adsorption time constants, the breakthrough curve is shifted to later times, suggesting a stronger affinity between the adsorbent and CO2 [102]. Since a chemical reaction occurs, a greater adsorption capacity is present, as shown in Figure 5 and Figure 6, reporting, respectively, the trend of loading for physisorbents and chemisorbents as a function of time and length of adsorbent bed. The loading is defined as the adsorbed CO2 and sorbent mass ratio, then it is depending on the adsorbent length.
Lower values of equilibrium loading are apparent for MOFs. For MOF-177, MOF-5, and MIL-101 this parameter is, respectively, 0.00043 mol/kg, 0.00093 mol/kg, and 0.00039 mol/kg. On the other hand, for SI-AEATPMS and APDES-NFC-FD the equilibrium loading is, respectively, 0.4 mol/kg and 0.85 mol/kg.
The above discussion is related to the adsorption stage, when CO2 is captured by sorbent. Heating is provided for desorption, as in a TSA process. Figure 7 shows CO2 concentration as a function of time and length for MOFs, while Figure 8 reports the same parameter for chemisorbents.
It is possible to see that the CO2 concentration starts from a value corresponding to the inlet concentration of 0.016 mol/m3, has a maximum close to the inlet of bed and after that, it decreases towards zero, as also reported in the work of Morales–Ospino et al. [82]. The maximum value is due to the impact of heating when the bed is still saturated with CO2. The loading starts from the value at the inlet condition and has a decreasing trend.

3.2. KPI: CO2 Productivity of DAC Systems

From the previously discussed curves, related to the adsorption and desorption stages, it is possible to find adsorption and desorption times, the full cycle time, and then the CO2 productivity (amount of CO2 captured). The adsorption and desorption times are for a 90% approach to equilibrium and are in agreement with data reported in the literature [17,74].
The required mass of the sorbent is calculated knowing the volume and porosity of bed and particle density [103]. With all of this information, it is possible to evaluate the average single pass recovery, Rc, and the amount of captured CO2. The average single pass recovery is defined as the ratio between the difference of CO2 at the inlet and outlet of the bed and CO2 at the inlet (in terms of mole). The adsorption time can also be calculated as the ratio between the 90% of equilibrium loading and mass sorbent product and the average single pass recovery and CO2 mole in the feed product [104]. Then, the value of Rc can be obtained by iteration to a self-consistent value.
The full cycle time (including adsorption and desorption times), average single pass recovery, the mass of the sorbent, and captured CO2 are evaluated for each sorbent as reported in Table 10.
Due to a higher adsorption capacity, as discussed above, chemisorbents are able to capture a greater amount of CO2: 6.43 kgCO2/h and 6.66 kgCO2/h, respectively, for the silica gel-based sorbent and the cellulose-based sorbent, compared to physisorbents. The MOFs MIL-101, MOF-177, and MOF-5 capture, respectively, 3.96 kg CO2/h, 4.5 kgCO2/h, and 4 kgCO2/h. The best performances of MOF-177 and APDES-NFC-FD among the physisorbents and chemisorbents are due to a lower mass transfer zone, and are underlined by a greater amount of captured CO2, and then by a higher value of the average single pass recovery, which is 0.89 for the cellulose-based sorbent and 0.59 for MOF-177.
Adsorption and desorption times are higher for amine-functionalized sorbents. Additionally, the higher value for the SI-AEATPMS sorbent compared to the other amine-based sorbent is due to the higher amine content of the APDES-NFC-FD sorbent [105]. In fact, results show that a full cycle for the silica gel-based sorbent is 89.2 h (305,500 s for the adsorption time and 16,650 for the desorption time), while only 9.53 h (32,560 s for the adsorption time and 1845 s for the desorption time) are required for the cellulose-based sorbent. For MOFs, full cycle times are lower than 1 h: the lowest value is for MOF-177 for which this parameter is 0.09 h (214 s for the adsorption time and 106 s for the desorption time). For this reason, the number of cycles per day is higher using physisorbent: MOF-177 conducts 271 cycles/day, while 0.3 cycles/day are needed for SI-AEATPMS sorbent.
Overall, amine-functionalized sorbents capture 152 kgCO2/day (APDES-NFC-FD sorbent) and 147 kgCO2/day (SI-AEATPMS), while MIL-101, MOF-177, and MOF-5 capture, respectively, 73 kgCO2/day, 72 kgCO2/day, and 68 kgCO2/day.

3.3. KPIs: Energy Consumption and Cost of DAC Systems

As explained previously, energy consumption includes the electrical energy for fans blowing air inside the bed, and thermal energy for the regeneration. Table 11 shows the amount of energy required for each sorbent.
It is possible to underline why physisorbents are characterized by higher values of energy consumption in terms of both electrical and thermal energy. The electrical energy demand is higher for MOFs due to higher pressure drop and lower amount of captured CO2 per day, compared to systems using amine-functionalized sorbents. The required electricity energy for MOFs and amine-functionalized sorbents is comparable with the values reported by Fasihi et al. [53] in their work. In our research, the electricity consumption for MIL-101, MOF-177, and MOF-5 are, respectively, 1540 kWhel/tonneCO2, 1350 kWhel/tonneCO2, and 1520 kWhel/tonneCO2. The amine-based sorbents exhibit lower values: 357 kWhel/tonneCO2 and 299 kWhel/tonneCO2, respectively, for SI-AEATPMS and APDES-NFC-FD.
Particular consideration is required for the thermal energy to regenerate the sorbent. No data of this parameter are present for MOFs capturing CO2 from air in the literature.
For amine-functionalized sorbents, values similar to those reported by Fasihi et al. [53], Elfving et al. [106], and Wijesiri et al. [3] are obtained: 1884 kWhth/tonneCO2 for the silica gel-based sorbent and 1427 kWhth/tonneCO2 for the cellulose-based sorbent.
However, higher values are obtained for physisorbents, ranging from 494,000 kWhth/tonneCO2 for MOF-5 to 1,300,000 for MOF-177 (due to the sensible heating requirements for the sorbent). These greater values are due to a very low working capacity for MOFs, ranging from 0.00084 mol/kg for MOF-5 to 0.00035 mol/kg for MIL-101 under atmospheric concentration of CO2. Working capacity depends on the equilibrium loading, this is then a critical parameter for the design of adsorption processes. This is an important finding in the context of MOFs.
Moreover, it is evident that DAC facilities using MOFs are impracticable due the huge amount of thermal energy requirement. This is true not only for an energetic point of view but also for an environmental aspect because additional CO2 would be emitted by the MWI to produce the heat energy needed to regenerate the adsorbent.
For DAC processes based on amine-functionalized sorbents, a life cycle assessment analysis is suggested to account for the additional emissions of MWI.
Economic analysis is carried out with the evaluation of CAPEX and OPEX for each process with different sorbents. Table S3 shows the analysis of capital costs for different adsorbent beds, starting from the evaluation of equipment (adsorber and fan) costs. For the adsorber, the mass of the shell of carbon steel is calculated according to the relation provided by Towler and Sinnott [107] and equal to 1200 kg. For the fan, the impeller diameter is evaluated to be 0.38 m [108]. Overall, CAPEX is determined by the sum of working capital and fixed capital investment, working capital assumed to be 15% of total capital investment.
Results show that for all sorbents, annualized capital costs are 11500 USD/year, while the CAPEX cost breakdown is reported in Figure S2. Specific capital costs are lower for amine-functionalized sorbents: 214 USD/tonneCO2 for the cellulose-based sorbent and 221 USD/tonneCO2 for the silica gel-based sorbent. For MIL-101, MOF-177, and MOF-5, specific capital costs are, respectively, 446 USD/tonneCO2, 447 USD/tonneCO2, and 479 USD/tonneCO2.
The evaluation of operating costs is reported in Table S4 while the OPEX breakdown cost in reported in Figures S3–S7. Here, the OPEX is different for each adsorbent bed, and higher operating costs are required for physisorbents due to higher costs for utilities, especially cooling water (since a greater amount of cooling water is required to remove the greater overall amount of heat that is required for the regeneration step) and thermal energy. Specific OPEX for SI-AEATPMS and APDES-NFC-FD are, respectively 7.756 USD/tonneCO2 and 5.537 USD/tonneCO2. On the other hand, for MIL-101, MOF-177, and MOF-5 these costs are 66,100 USD/tonneCO2, 38,900 USD/tonneCO2, and 15,800 USD/tonneCO2.
Overall, total costs are 751 USD/tonneCO2 for the cellulose-based sorbent, 977 USD/tonneCO2 for the silica gel-based sorbent, 66,600 USD/tonneCO2 for the MIL-101 sorbent, 39,400 USD/tonneCO2 for the MOF-177 sorbent, and 16,300 USD/tonneCO2 for the MOF-5 sorbent.
The economic analysis suggests that operating costs have the highest influence on total costs for all investigated systems, especially for those using MOFs.
In particular, the contribution of OPEX and CAPEX on total costs is, respectively, 72% and 28% for the system using the cellulose-based sorbent, 77% and 23% for the system using the silica gel-based sorbent, 99% and 1% for the process using MIL-101 and MOF-177, and 97% and 3% for the system using MOF-5.
For the capture system using the SI-AEATPMS sorbent, the cost of cooling water is significant, suggesting the use of free air for the cooling stage in order to reduce costs. Another significant contribution is from the maintenance and repairs cost, which is evaluated as 2% of the fixed capital investment. This cost could be reduced by using equipment with another material that with a lower carbon content could allow lower costs.
For the capture system using the APDES-NFC-FD sorbent, the maintenance and repair cost is the most significant element OPEX; hence, the use of another material for equipment could help in cost reduction. The cooling water cost has a great influence on OPEX too.
Overall, for processes using amine-functionalized sorbents, it is suggested to use alternative materials of construction and use free air for cooling.
For capture systems based on MOF-5 and MOF-177, the cost for the required thermal energy is the most significant, while for the process capturing CO2 using MIL-101 the cost of cooling water has the highest contribution, although the cost of thermal energy is great too. This suggests that a reduction in costs could be achieved by using air as a cooling medium (as already done in the Antecy Company) and improving the sorbent efficiency of MOFs in terms of loading, which is a critical parameter, as mentioned before. Future research should be focused on improving the efficiency of these new materials, still under study and characterized by unprecedented chemical and structural tunability.
Moreover, from the economic analysis we found that the lowest total cost is for the process using the chemisorbent APDES-NFC-FD, while the highest cost is for the process using the physisorbent MIL-101.
According to the previous considerations (OPEX with the highest influence on total costs with direct production costs as the main contribution as in Figures S4–S7), we can say that the total costs can range according to the price of significant utilities and raw materials in the market, for the capture system using the silica gel-based sorbent and MOFs.
For the process based on the cellulose sorbent, fixed charges have the highest influence on OPEX so we expect that total costs can range ±20%.
In any case, total costs for amine-based sorbents are in agreement with the order of magnitude estimated by House et al. [109] for DAC systems up to 1000 $/tonCO2.
The consideration is for other costs reported in the literature and revised by the work of Fasihi et al. [53]. These reported costs are of a few hundred dollars per tonne of CO2 and are based on different assumptions [3,98]. In particular, a few hundred dollars per tonne of captured CO2 are estimated by Kulkarni and Sholl [54], Zhang et al. [18], and Sinha et al. [55]. However, Krekel et al. [110] report in their work that once capital costs are considered, the total capture cost increases significantly.
Particular attention should be placed on the use of MOFs, since due to higher operating costs caused by the very low working capacity, these are very expensive for CO2 capture from air and are not recommended. Future research should be focused on the development of MOFs that ensure higher values of loading. This could be achieved by adding special compounds. This solution could make MOFs suitable for CO2 capture.

3.4. Comparison with Climeworks Data

Climeworks has developed a DAC plant at semi-commercial scale, and uses an amine-functionalized cellulose chemisorbent, as discussed here. The geometry of the adsorbent bed is the same as that used in our calculation. Overall, results show a good agreement between operating conditions and energy consumptions evaluated by us for the APDES-NFC-FD sorbent with those reported proposed by this DAC Company.
The duration of a full cycle is lower for Climeworks and in the range of 4–6 h, because only the adsorption of CO2 is considered in our model, whereas some humidity is present in the real air flow rate. However, experimental analyses show that after 5 h adsorption time, the CO2 uptake curves are still on an upwards path, while the corresponding H2O curves have reached a steady state for all relative humidity values [105]. This explains why Climeworks utilizes a shorter cycle.
For other operating parameters, no significant differences are present. In fact, for Climeworks the amount of captured CO2 is 135 kgCO2/day, with an average single pass recovery of 0.9. Regarding the energetic consumption, the proposed electrical energy consumption is between 200 kWhel/tonneCO2 and 450 kWhel/tonneCO2. The required thermal energy consumption is 1500–2000 kWhth/tonneCO2.
Regarding the economic analysis, our total cost (751 USD/tonneCO2) is the same order of magnitude of that proposed by Climework (600 USD/tonneCO2) [111].
Moreover, our calculated total cost can be higher than that estimated when humidity is present in the air. In fact, as reported in Wurzbacher et al. [104], the energy consumption for the regeneration can increase up to 20% when the relative humidity increases from 20% to 80%.

4. Conclusions

An independent analysis is developed in this research work to evaluate some KPIs (energy consumption, CO2 productivity, and costs) of a DAC processes, based on adsorption using different sorbents. In particular, chemisorbents (two amine-functionalized sorbents, SI-AEATPMS and APDES-NFC-FD) and physisorbents (three MOFs: MIL-101, MOF-5, and MOF-177) are compared.
For this purpose, a mathematical model describing adsorption and desorption stages is developed for each sorbent.
Results show that MOFs are characterized by a very low equilibrium loading and hence a very low working capacity in comparison to chemisorbents. For MIL-101, MOF-177, and MOF-5 this last parameter is, respectively, 0.00035 mol/kg, 0.00039 mol/kg, and 0.00084 mol/kg. On the other hand, for SI-AEATPMS and APDES-NFC-FD working capacity is, respectively, 0.367 mol/kg and 0.771 mol/kg.
The equilibrium loading is a critical parameter because it influences the adsorption capacity, energy consumption, and cost. Better results are found for the adsorption processes using amine-functionalized sorbents. For the cellulose-based sorbent, 152 kgCO2/day are captured, consuming 299 kWhel/tonneCO2 of electrical energy and 1427 kWhth/tonneCO2 of thermal energy at an overall total cost of 751 USD/tonneCO2. For MOF-177, the amount of captured CO2, electrical energy and thermal energy consumptions, and total costs are, respectively, 72 kgCO2/day, 1350 kWhel/tonCO2, 1,300,000 kWhth/tonCO2, and 39,400 USD/tonneCO2. It is evident that the huge amount of thermal energy requirement makes the processes based on MOFs impracticable.
This independent analysis shows that costs reported in the literature appear to be with the same order of magnitude of our analysis. A comparison with the Climeworks Company (using the APDES-NFC-FD sorbent) shows a good agreement with KPIs, and total cost. Higher costs are expected when humidity is in the air.
It is important to note that we are assuming here the availability of industrial waste heat—should this not be available, costs will be somewhat higher (22%, when a traditional boiler is used for heating, considering a cost for heat of 0.165 USD/kWh [112]. Suggestions to reduce costs are provided. It was found that for systems using amine-functionalized sorbents, the use of air for the cooling stage and cheaper materials for equipment could reduce OPEX and therefore overall costs. For processes using MOFs, more research should be focused to improve their loading allowing a lower cost for thermal energy. The use of air for cooling could reduce costs too.

Supplementary Materials

The following supporting information can be downloaded at: https://www.mdpi.com/article/10.3390/app12052618/s1, Figure S1: Breakthrough curve (CO2 concentration at the outlet/CO2 concentration at the inlet) for the experi-mental apparatus used in Wurzbacher (2015); Figure S2: Breakdown of the main contributions (cut-off 5%) to CAPEX for all adsorbent beds; Figure S3: Breakdown of the main contributions (cut-off 5%) to OPEX for the adsorbent beds with APDES-NFC-FD; Figure S4: Breakdown of the main contributions (cut-off 5%) to OPEX for the adsorbent beds with SI-AEATPMS; Figure S5: Breakdown of the main contributions (cut-off 5%) to OPEX for the adsorbent beds with MIL-101; Figure S6: Breakdown of the main contributions (cut-off 5%) to OPEX for the adsorbent beds with MOF-177; Figure S7: Breakdown of the main contributions (cut-off 5%) to OPEX for the adsorbent beds with MOF-5. Table S1: Dimensionless number values of the mathematical model; Table S2: Inputs used in Matches calculator for cost analysis; Table S3: CAPEX of different adsorbent beds; Table S4: OPEX of different adsorbent beds.

Author Contributions

Conceptualization, P.S.F., G.L. and N.S.; methodology, G.L. and N.S.; formal analysis, G.L.; investigation, G.L.; writing—original draft preparation, G.L.; writing—review and editing, P.S.F. and N.S.; supervision, P.S.F. and N.S.; funding acquisition, P.S.F. and N.S. All authors have read and agreed to the published version of the manuscript.

Funding

This research was funded by the Hadley Trust.

Institutional Review Board Statement

Not applicable.

Informed Consent Statement

Not applicable.

Data Availability Statement

UKCCSRC data repository.

Acknowledgments

This work was supported by the Hadley Trust.

Conflicts of Interest

The authors declare no conflict of interest.

References

  1. IEA. 2020. Available online: https://www.iea.org/data-and-statistics/?country=WORLD&fuel=CO2%20emissions&indicator=TotCO2 (accessed on 1 November 2020).
  2. Bui, M.; Adjiman, C.S.; Bardow, A.; Anthony, E.J.; Boston, A.; Brown, S.; Fennell, P.S.; Fuss, S.; Galindo, A.; Hackett, L.A.; et al. Carbon capture and storage (CCS): The way forward. Energy Environ. Sci. 2018, 11, 1062–1176. [Google Scholar] [CrossRef] [Green Version]
  3. Wijesiri, R.P.; Knowles, G.P.; Yeasmin, H.; Hoadley, A.F.A.; Chaffee, A.L. Technoeconomic Evaluation of a Process Capturing CO2 Directly from Air. Processes 2019, 7, 503. [Google Scholar] [CrossRef] [Green Version]
  4. Sanz-Pérez, E.; Murdock, C.R.; Didas, S.A.; Jones, C.W. Direct Capture of CO2 from Ambient Air. Chem. Rev. 2016, 116, 11840–11876. [Google Scholar] [CrossRef]
  5. Zhu, X.; Ge, T.; Yang, F.; Wang, R. Design of steam-assisted temperature vacuum-swing adsorption processes for efficient CO2 capture from ambient air. Renew. Sustain. Energy Rev. 2020, 137, 110651. [Google Scholar] [CrossRef]
  6. Lackner, K.S.; Ziock, H.J.; Grimes, P. Carbon Dioxide Extraction from Air: Is It an Option? Los Alamos National Lab.: Los Alamos, NM, USA, 1999. [Google Scholar]
  7. Fuss, S.; Lamb, W.F.; Callaghan, M.W.; Hilaire, J.; Creutzig, F.; Amann, T.; Beringer, T.; de Oliveira Garcia, W.; Hartmann, J.; Khanna, T.; et al. Negative emissions—Part 2: Costs, potentials and side effects, Environ. Res. Lett. 2018, 13, 063002. [Google Scholar] [CrossRef] [Green Version]
  8. Kar, S.; Sen, R.; Goeppert, A.; Prakash, G.K.S. Integrative CO2 Capture and Hydrogenation to Methanol with Reusable Catalyst and Amine: Toward a Carbon Neutral Methanol Economy. J. Am. Chem. Soc. 2018, 140, 1580–1583. [Google Scholar] [CrossRef]
  9. Bos, M.J.; Kersten, S.R.A.; Brilman, D.W.F. Wind power to methanol: Renewable methanol production using electricity, electrolysis of water and CO2 air capture. Appl. Energy 2020, 264, 114672. [Google Scholar] [CrossRef]
  10. Shi, X.; Xiao, H.; Azarabadi, H.; Song, J.; Wu, X.; Chen, X.; Lackner, K.S. Sorbents for the Direct Capture of CO2 from Ambient Air. Angew. Chem. Int. Ed. 2020, 59, 6984–7006. [Google Scholar] [CrossRef]
  11. Sabatino, F.; Mehta, M.; Grimm, A.; Gazzani, M.; Gallucci, F.; Kramer, G.J.; Annaland, M.V.S. Evaluation of a Direct Air Capture Process Combining Wet Scrubbing and Bipolar Membrane Electrodialysis. Ind. Eng. Chem. Res. 2020, 59, 7007–7020. [Google Scholar] [CrossRef]
  12. Eisaman, M.D.; Schwartz, D.E.; Amic, S.; Larner, D.L.; Zesch, J.; Torres, F.; Littau, K. Energy-Efficient Electrochemical CO2 Capture from the Atmosphere. In Proceedings of the 2009 Clean Technology Conference and Trade Show, Houston, TX, USA, 3−7 May 2009. [Google Scholar]
  13. Kelemen, P.B.; McQueen NWilcox, J.; Renforth, P.; Dipple, G.; Vankeuren, A.P. Engineered carbon mineralization in ultramafic rocks for CO2 removal from air: Review and new insights. Chem. Geol. 2020, 550, 119628. [Google Scholar] [CrossRef]
  14. von Hippel, T. Thermal Removal of Carbon Dioxide from the Atmosphere: Energy Requirements and Scaling Issues. Clim. Change 2018, 148, 491–501. [Google Scholar] [CrossRef] [Green Version]
  15. Adamu, A.; Abegão, F.R.; Boodhoo, K. Process intensification technologies for CO2 capture and conversion—A review. BMC Chem. Eng. 2020, 2, 2. [Google Scholar] [CrossRef]
  16. Realmonte, G. Direct Air Capture and Negative Emission Technologies in Deep Mitigation Pathways. Master’s Thesis, Politecnico of Milano, Milan, Italy, 2017. [Google Scholar]
  17. Qasem, N.A.A.; Ben-Mansour, R. Adsorption breakthrough and cycling stability of carbon dioxide separation from CO2/N2/H2O mixture under ambient conditions using 13X and Mg-MOF-74. Appl. Energy 2018, 230, 1093–1107. [Google Scholar] [CrossRef]
  18. Zhang, W.; Liu, H.; Sun, C.; Drage, T.C.; Snape, C.E. Capturing CO2 from ambient air using a polyethyleneimine–silica adsorbent in fluidized beds. Chem. Eng. Sci. 2014, 116, 306–316. [Google Scholar] [CrossRef]
  19. Shekhah, O.; Belmabkhout, Y.; Chen, Z.; Guillerm, V.; Cairns, A.; Adil, K.; Eddaoudi, M. Made-to-order metal-organic frameworks for trace carbon dioxide removal and air capture. Nat. Commun. 2014, 5, 4228. [Google Scholar] [CrossRef] [Green Version]
  20. Bahamon, D.; Díaz-Márquez Pablo Gamallo, A.; Vega, L.F. Energetic evaluation of swing adsorption processes for CO2 capture in selected MOFs and zeolites: Effect of impurities. Chem. Eng. J. 2018, 342, 458–473. [Google Scholar] [CrossRef] [Green Version]
  21. Li, J.-R.; Ma, Y.; McCarthy, M.C.; Sculley, J.; Yu, J.; Jeong, H.-K.; Balbuena, P.B.; Zhou, H.-C. Carbon dioxide capture-related gas adsorption and separation in metal-organic frameworks. Coord. Chem. Rev. 2011, 255, 1791–1823. [Google Scholar] [CrossRef]
  22. Li, J.R.; Sculley, J.; Zhou, H.C. Metal-organic frameworks for separations. Chem. Rev. 2012, 112, 869–932. [Google Scholar] [CrossRef]
  23. Gaikwad, S.; Kim, Y.; Han, S. Enhanced CO2 capture capacity of amine-functionalized MOF-177 metal organic framework. J. Environ. Chem. Eng. 2021, 9, 105523. [Google Scholar] [CrossRef]
  24. Demir, H.; Keskin, S. Hypothetical yet Effective: Computational Identification of High-performing MOFs for CO2 Capture. Comput. Chem. Eng. 2022, 55, 101811. [Google Scholar] [CrossRef]
  25. Al-Rowaili, F.N.; Zahid, U.; Onaizi, S.; Khaled, M.; Jamal, A.; Al-Mutairi, E.M. A review for Metal-Organic Frameworks (MOFs) utilization in capture and conversion of carbon dioxide into valuable products. J. CO2 Util. 2021, 53, 101715. [Google Scholar] [CrossRef]
  26. Gaikwad, S.; Kim, S.-J.; Han, S. CO2 capture using amine-functionalized bimetallic MIL-101 MOFs and their stability on exposure to humid air and acid gases. Microporous Mesoporous Mater. 2018, 277, 253–260. [Google Scholar] [CrossRef]
  27. Ben-Mansour, R.; Qasem, N.A.A.; Antar, M.A. Carbon dioxide adsorption separation from dry and humid CO2/N2 mixture. Comput. Chem. Eng. 2018, 117, 221–235. [Google Scholar] [CrossRef]
  28. NovoMOF. 2021. Available online: https://blog.novomof.com/blog/gas-separation-zeolites-vs-mofs (accessed on 1 March 2021).
  29. Yu, J.; Chuang, S.S.C. The Role of Water in CO2 Capture by Amine. Ind. Eng. Chem. Res. 2017, 56, 6337–6347. [Google Scholar] [CrossRef]
  30. Belmabkhout, Y.; Serna-Guerrero, R.; Sayari, A. Amine-bearing mesoporous silica for CO2 removal from dry and humid air. Chem. Eng. Sci. 2010, 65, 3695–3698. [Google Scholar] [CrossRef]
  31. Goeppert, A.; Zhang, H.; Czaun, M.; May, R.B.; Prakash, G.K.S.; Olah, G.A.; Narayanan, S.R. Easily Regenerable Solid Adsorbents Based on Polyamines for Carbon Dioxide Capture from the Air. ChemSusChem 2014, 7, 1386–1397. [Google Scholar] [CrossRef] [PubMed]
  32. Kwon, H.T.; Sakwa-Novak, M.A.; Pang, S.; Sujan, A.R.; Ping, E.W.; Jones, C.W. Aminopolymer-Impregnated Hierarchical Silica Structures: Unexpected Equivalent CO2 Uptake under Simulated Air Capture and Flue Gas Capture Conditions. Chem. Mater. 2019, 31, 5229–5237. [Google Scholar] [CrossRef]
  33. Sarazen, M.L.; Sakwa-Novak, M.A.; Ping, E.W.; Jones, C.W. Effect of different acid initiators on branched poly(propyleneimine) synthesis and CO2 sorption performance. ACS Sustain. Chem. Eng. 2019, 7, 7338–7345. [Google Scholar] [CrossRef]
  34. Wagner, A.; Steen, B.; Johansson, G.; Zanghellini, E.; Jacobsson, P.; Johansson, P. Ran Carbon Dioxide Capture from Ambient Air Using Amine-Grafted Mesoporous Adsorbents. Int. J. Spectrosc. 2013, 2013, 690186. [Google Scholar] [CrossRef] [Green Version]
  35. Potter, M.E.; Cho, K.M.; Lee, J.J.; Jones, C.W. Role of Alumina Basicity in CO2 Uptake in 3-Aminopropylsilyl-Grafted Alumina Adsorbents. ChemSusChem 2017, 10, 2192–2201. [Google Scholar] [CrossRef] [PubMed]
  36. Abhilash, K.A.S.; Deepthi, T.; Sadhana, R.A.; Benny, K.G. Functionalized Polysilsesquioxane-Based Hybrid Silica Solid Amine Sorbents for the Regenerative Removal of CO2 from Air. ACS Appl. Mater. Interfaces 2015, 7, 17969–17976. [Google Scholar] [CrossRef] [PubMed]
  37. Lee, W.R.; Hwang, S.Y.; Ryu, D.W.; Lim, K.S.; Han, S.S.; Moon, D.; Choi, J.; Hong, C.S. Diamine-Functionalized Metal−organic Framework: Exceptionally High CO2 Capacities from Ambient Air and Flue Gas, Ultrafast CO2 Uptake Rate, and Adsorption Mechanism. Energy Environ. Sci. 2014, 7, 744–751. [Google Scholar] [CrossRef]
  38. McDonald, T.M.; Lee, W.R.; Mason, J.A.; Wiers, B.M.; Hong, C.S.; Long, J.R. Capture of Carbon Dioxide from Air and Flue Gas in the Alkylamine-Appended Metal–Organic Framework mmen-Mg2(dobpdc). J. Am. Chem. Soc. 2012, 134, 7056–7065. [Google Scholar] [CrossRef] [PubMed]
  39. Kumar, A.; Madden, D.G.; Lusi, M.; Chen, K.-J.; Daniels, E.A.; Curtin, T.; Perry, J.J.; Zaworotko, M.J. Direct Air Capture of CO2 by Physisorbent Materials. Angew. Chem. Int. Ed. 2015, 54, 14372–14377. [Google Scholar] [CrossRef]
  40. Choi, S.; Watanabe, T.; Bae, T.-H.; Sholl, D.S.; Jones, C.W. Modification of the Mg/DOBDC MOF with Amines to Enhance CO2 Adsorption from Ultradilute Gases. J. Phys. Chem. Lett. 2012, 3, 1136–1141. [Google Scholar] [CrossRef] [PubMed]
  41. Pirngruber, G.D.; Hamon, L.; Bourrelly, S.; Llewellyn, P.L.; Lenoir, E.; Guillerm, V.; Serre, C.; Devic, T. A Method for Screening the Potential of MOFs as CO2 Adsorbents in Pressure Swing Adsorption Processes. ChemSusChem 2012, 5, 762–776. [Google Scholar] [CrossRef] [PubMed]
  42. Meth, S.; Goeppert, A.; Prakash, G.K.S.; Olah, G.A. Silica Nanoparticles as Supports for Regenerable CO2 Sorbents. Energy Fuels 2012, 26, 3082–3090. [Google Scholar] [CrossRef]
  43. Brilman, D.W.F.; Veneman, R. Capturing atmospheric CO2 using supported amine sorbents. Energy Procedia 2013, 37, 6070–6078. [Google Scholar] [CrossRef] [Green Version]
  44. Pang, S.H.; Jue, M.L.; Leisen, J.; Jones, C.W.; Lively, R.P. PIM-1 as a solutionprocessable “molecular basket” for CO2 capture from dilute sources. ACS Macro Lett. 2015, 4, 1415–1419. [Google Scholar] [CrossRef]
  45. Chaikittisilp, W.; Khunsupat, R.; Chen, T.T.; Jones, C.W. Poly(allylamine)–Mesoporous Silica Composite Materials for CO2 Capture from Simulated Flue Gas or Ambient Air. Ind. Eng. Chem. Res. 2011, 50, 14203–14210. [Google Scholar] [CrossRef]
  46. Gebald, C.; Wurzbacher, J.A.; Borgschulte, A.; Zimmermann, T.; Steinfeld, A. Single-Component and Binary CO2 and H2O Adsorption of Amine-Functionalized Cellulose. Environ. Sci. Technol. 2014, 48, 2497–2504. [Google Scholar] [CrossRef]
  47. Liao, P.-Q.; Chen, X.-W.; Liu, S.-Y.; Li, X.-Y.; Xu, Y.-T.; Tang, M.; Rui, Z.; Ji, H.; Zhang, J.-P.; Chen, X.-M. Putting an ultrahigh concentration of amine groups into a metal–organic framework for CO2 capture at low pressures. Chem. Sci. 2016, 7, 6528–6533. [Google Scholar] [CrossRef] [PubMed] [Green Version]
  48. Ng, Y.C.; Yang, L.; Jovanovic, Z.R. The Development and Validation of a Closed-Loop Experimental Setup for Investigating CO2 and H2O Coadsorption Kinetics under Conditions Relevant to Direct Air Capture. Ind. Eng. Chem. Res. 2018, 57, 13987–13998. [Google Scholar] [CrossRef]
  49. Choi, S.; Drese, J.H.; Eisenberger, P.M.; Jones, C.W. Application of Amine-Tethered Solid Sorbents for Direct CO2 Capture from the Ambient Air. Environ. Sci. Technol. 2011, 45, 2420–2427. [Google Scholar] [CrossRef]
  50. Shekhah, O.; Belmabkhout, Y.; Adil, K.; Bhatt, P.M.; Cairns, A.J.; Eddaoudi, M. A facile solvent-free synthesis route for the assembly of a highly CO2 selective and H2S tolerant NiSIFSIX metal–organic framework. Chem. Commun. 2015, 51, 13595–13598. [Google Scholar] [CrossRef] [PubMed] [Green Version]
  51. Caskey, S.R.; Wong-Foy, A.G.; Matzger, A.J. Dramatic Tuning of Carbon Dioxide Uptake via Metal Substitution in a Coordination Polymer with Cylindrical Pores. J. Am. Chem. Soc. 2008, 130, 10870–10871. [Google Scholar] [CrossRef]
  52. Al-Janabi, N.; Vakili, R.; Kalumpasut, P.; Gorgojo, P.; Siperstein, F.R.; Fan, X.; McCloskey, P. Velocity variation effect in fixed bed columns: A case study of CO2 capture using porous solid adsorbents. AIChE J. 2018, 64, 2189–2197. [Google Scholar] [CrossRef] [Green Version]
  53. Fasihi, M.; Efimova, O.; Breyer, C. Techno-economic assessment of CO2 direct air capture plants. J. Clean. Prod. 2019, 224, 957–980. [Google Scholar] [CrossRef]
  54. Kulkarni, A.R.; Sholl, D.S. Analysis of Equilibrium-Based TSA Processes for Direct Capture of CO2 from Air. Ind. Eng. Chem. Res. 2012, 51, 8631–8645. [Google Scholar] [CrossRef]
  55. Sinha, A.; Darunte, L.A.; Jones, C.W.; Realff, M.J.; Kawajiri, Y. Systems Design and Economic Analysis of Direct Air Capture of CO2 through Temperature Vacuum Swing Adsorption Using MIL-101(Cr)-PEI-800 and mmen-Mg2(dobpdc) MOF Adsorbents. Ind. Eng. Chem. Res. 2017, 56, 750–764. [Google Scholar] [CrossRef]
  56. Viebahn, P.; Scholz, A.; Zelt, O. The Potential Role of Direct Air Capture in the German Energy Research Program—Results of a Multi-Dimensional Analysis. Energies 2019, 12, 3443. [Google Scholar] [CrossRef] [Green Version]
  57. Kintisch, E. Can Sucking CO2 Out of the Atmosphere Really Work? 2019. Available online: https://www.technologyreview.com/s/531346/can-sucking-co2-out-of-the-atmosphere-really-work/ (accessed on 25 July 2019).
  58. Sabatino, F.; Grimm, A.; Gallucci, F.; van Sint Annaland, M.; Kramer, G.J.; Gazzani, M. A comparative energy and costs assessment and optimization for direct air capture technologies. Joule 2021, in press. [Google Scholar]
  59. Schellevis, H.; van Schagen, T.; Brilman, D. Process optimization of a fixed bed reactor system for direct air capture. Int. J. Greenh. Gas Control 2021, 110, 103431. [Google Scholar] [CrossRef]
  60. Miao, Y.; He, Z.; Zhu, X.; Izikowitz, D.; Li, J. Operating temperatures affect direct air capture of CO2 in polyamine-loaded mesoporous silica. Chem. Eng. J. 2021, 426, 131875. [Google Scholar] [CrossRef]
  61. van Schagen, T.; van der Wal, P.; Brilman, D. Development of a novel, through-flow microwave-based regenerator for sorbent-based direct air capture. Chem. Eng. J. Adv. 2021, 9, 100187. [Google Scholar] [CrossRef]
  62. Drechsler, C.; Agar, D.W. Simulation and optimization of a novel moving belt adsorber concept for the direct air capture of carbon dioxide. Comput. Chem. Eng. 2019, 126, 520–534. [Google Scholar] [CrossRef]
  63. Zhao, R.; Liu, L.; Zhao, L.; Deng, S.; Li, S.; Zhang, Y.; Li, H. Thermodynamic exploration of temperature vacuum swing adsorption for direct air capture of carbon dioxide in buildings. Energy Convers. Manag. 2019, 183, 418–426. [Google Scholar] [CrossRef]
  64. Qasem, N.; Ben-Mansour, R.; Habib, M.A. An efficient CO2 adsorptive storage using MOF-5 and MOF-177. Appl. Energy 2018, 210, 317–326. [Google Scholar] [CrossRef]
  65. Montazerolghaem, M.; Aghamiri, S.F.; Talaie, M.R.; Tangestaninejad, S. A comparative investigation of CO2 adsorption on powder and pellet forms of MIL-101. J. Taiwan Inst. Chem. Eng. 2017, 72, 45–52. [Google Scholar] [CrossRef]
  66. Zhao, Z.; Li, Z.; Lin, J. Adsorption and Diffusion of Carbon Dioxide on Metal−Organic Framework (MOF-5). Ind. Eng. Chem. Res. 2009, 48, 10015–10020. [Google Scholar] [CrossRef]
  67. Poirier, E.; Chahine, R.; Bénard, P.; Lafi, L.; Dorval-Douville, G.; Chandonia, P.A. Hydrogen Adsorption Measurements and Modeling on Metal-Organic Frameworks and Single-Walled Carbon Nanotubes. Langmuir 2006, 22, 8784–8789. [Google Scholar] [CrossRef]
  68. Peedikakkal, A.M.P.; Al-Betar, A.R.; Al-Mousa, A.H. Conductivity Enhancement of Mofs via Development of Mofpolymer Composite Material. U.S. Patent 20200291045A1, 17 September 2020. [Google Scholar]
  69. Zacharia, R.; Fernando Gomez, L.; Chahine, R.; Cossement, D.; Benard, P. Thermodynamics and kinetics of CH4/CO2 binary mixture separation by metal-organic frameworks from isotope exchange and adsorption breakthrough. Microporous Mesoporous Mater. 2018, 263, 165–172. [Google Scholar] [CrossRef]
  70. Viditha, V.; Rao, M.V.; Srilatha, K.; Himabindu, V.; Yerramilli, A. A study on metal organic framework (MOF-177) synthesis, characterization and hydrogen adsorption –desorption cycles. Int. J. Energy Environ. 2013, 4, 127–132. [Google Scholar]
  71. Saha, D.; Deng, S. Synthesis, characterization and hydrogen adsorption in mixed crystals of MOF-5 and MOF-177. Int. J. Hydrogen Energy 2009, 34, 2670–2678. [Google Scholar] [CrossRef]
  72. Férey, G.; Mellot-Draznieks, C.; Serre, C.; Millange, F.; Dutour, J.; Surblé, S.; Margiolaki, I. A Chromium Terephthalate-Based Solid with Unusually Large Pore Volumes and Surface Area. Science 2005, 309, 2040–2042. [Google Scholar] [CrossRef] [PubMed]
  73. Bhattacharjee, S.; Chena, C.; Ahn, W.S. Chromium terephthalate metal–organic framework MIL-101: Synthesis, functionalization, and applications for adsorption and catalysis. RSC Adv. 2014, 4, 52500. [Google Scholar] [CrossRef]
  74. Wurzbacher, J.A. Development of a Temperature-Vacuum Swing Process for CO2 Capture from Ambient Air. Ph.D. Thesis, ETH Zurich, Zurich, Switzerland, 2015. [Google Scholar]
  75. Eyitope. Modelling of CO2 Using Metal Organic Frameworks. Master’s Thesis, King Fahd University, Dhahran, Arabia Saudita, 2015. [Google Scholar]
  76. Kaskel, S. The Chemistry of Metal Organic Frameworks; Wiley: Hoboken, NJ, USA, 2016. [Google Scholar]
  77. Goyal, P.; Purdue, M.; Farooq, S. Adsorption and Diffusion of N2 and CO2 and Their Mixture on Silica Gel. Ind. Eng. Chem. Res. 2019, 58, 19611–19622. [Google Scholar] [CrossRef]
  78. Climeworks. 2020. Available online: www.climeworks.com (accessed on 1 December 2020).
  79. Gebald, C.; Piatkowski, N.; Ruesch, T.; Wurzbacher, J.A. Low-Pressure Drop Structure of Particle Adsorbent Bed for Adsorption Gas Separation Process. WO Patent 2014/170184 Al, 23 October 2014. [Google Scholar]
  80. Buijs, W.; de Flart, S. Direct Air Capture of CO2 with an Amine Resin: A Molecular Modeling Study of the CO2 Capturing Process. Ind. Eng. Chem. Res. 2017, 56, 12297–12304. [Google Scholar] [CrossRef]
  81. Knox, J.C.; Ebner, A.D.; LeVan, M.D.; Coker, R.F.; Ritter, J.A. Limitations of Breakthrough Curve Analysis in Fixed-Bed Adsorption. Ind. Eng. Chem. Res. 2016, 55, 4734–4748. [Google Scholar] [CrossRef] [PubMed] [Green Version]
  82. Morales-Ospino, R.; Santiago, R.G.; Siqueira, R.M.; de Azevedo, D.C.S.; Bastos-Neto, M. Assessment of CO2 desorption from 13X zeolite for a prospective TSA process. Adsorption 2020, 26, 813–824. [Google Scholar] [CrossRef]
  83. Perry, R.H. Perry’s Chemical Engineerings’ Handbook; McGraw-Hill: New York, NY, USA, 1999. [Google Scholar]
  84. Poundsterlinglive. 2021. Available online: https://www.poundsterlinglive.com/bank-of-england-spot/historical-spot-exchange-rates/usd/USD-to-CHF-1993 (accessed on 1 July 2021).
  85. Mason, J.A.; Sumida, K.; Herm, Z.R.; Krishna, R.; Long, J.R. Evaluating metal–organic frameworks for post-combustion carbon dioxide capture via temperature swing adsorption. Energy Environ. Sci. 2011, 4, 3030–3040. [Google Scholar] [CrossRef]
  86. Zhang, Z.; Huang, S.; Xian, S.; Xi, H.; Li, Z. Adsorption Equilibrium and Kinetics of CO2 on Chromium Terephthalate MIL-101. Energy Fuels 2011, 25, 835–842. [Google Scholar] [CrossRef]
  87. Keller, J.U. Gas Adsorption Equilibria: Experimental Methods and Adsorptive Isotherms; Springer: New York, NY, USA, 2005. [Google Scholar]
  88. Yu, Q.; Brilman, D.W.F. Design strategy for CO2adsorption from ambient air using a supported amine based sorbent in a fixed bed reactor. Energy Procedia 2017, 114, 6102–6114. [Google Scholar] [CrossRef]
  89. Zhang, W.; Liu, H.; Sun, Y.; Cakstins, J.; Sun, C.-G.; Snape, C. Parametric study on the regeneration heat requirement of an amine-based solid adsorbent process for post-combustion carbon capture. Appl. Energy 2016, 168, 394–405. [Google Scholar] [CrossRef]
  90. Wurzbacher, J.A.; Gebald, C.; Steinfeld, A. Separation of CO2 from air by temperature-vacuum swing adsorption using diamine-functionalized silica gel. Energy Environ. Sci. 2011, 4, 3584–3592. [Google Scholar] [CrossRef]
  91. Huck, J.M.; Lin, L.-C.; Berger, A.H.; Shahrak, M.N.; Martin, R.L.; Bhown, A.S.; Haranczyk, M.; Reuter, K.; Smit, B. Evaluating different classes of porous materials for carbon capture. Energy Environ. Sci. 2014, 7, 4132–4146. [Google Scholar] [CrossRef]
  92. Peter, M.S.; Timmerhaus, K.D. Plant Design and Economics for Chemical Engineering; McGraw-Hill: New York, NY, USA, 1991. [Google Scholar]
  93. Matches. 2020. Available online: http://www.matche.com/equipcost/Default.html (accessed on 1 December 2020).
  94. Towerling Skills. 2021. Available online: https://www.toweringskills.com/financial-analysis/cost-indices/ (accessed on 1 July 2021).
  95. Danaci, D.; Bui, M.; Mac Dowell, N.; Petit, C. Exploring the limits of adsorption-based CO2 capture using MOFs with PVSA—from molecular design to process economics. Mol. Syst. Des. Eng. 2019, 5, 212–231. [Google Scholar] [CrossRef]
  96. Bauer, C.; Cox, B.; Heck, T.; Zhang, X. Potentials, Costs and Environmental Assessment of Electricity Generation Technologies; PSI, Technology Assessment Group: Villigen, Switzerland, 2019. [Google Scholar]
  97. SDH. 2017. Available online: https://www.solar-district-heating.eu/switzerland-plans-for-solar-district-heating-pilot-system/ (accessed on 13 May 2021).
  98. Gebelman, A. Adsorption Basics: Part 1. 2017. Available online: https://www.aiche.org/sites/default/files/docs/pages/adsorption_basics_part_1.pdf (accessed on 1 December 2020).
  99. Papurello, D.; Gandiglio, M.; Lanzini, A. Experimental Analysis and Model Validation on thePerformance of Impregnated Activated Carbons for the Removal of Hydrogen Sulfide (H2S) from Sewage Biogas. Processes 2019, 7, 548. [Google Scholar] [CrossRef] [Green Version]
  100. Patel, S.M. Evaluation of Mass Transfer Rate in Column of Small Lilsx Particle. Master’s Thesis, Cleveland State University, Cleveland, OH, USA, 2017. [Google Scholar]
  101. Bahrun, M.H.V.; Bono, A.; Dzilrazman, N.K.; Kamin, Z. Recovery of Minor Palm Oil Compounds Using Packed Bed Adsorption Column. J. Bahan Alam Terbarukan 2020, 9, 21–29. [Google Scholar] [CrossRef]
  102. Naksusuk, S.; Tangsathitkulchai, C. Carbon Dioxide Capture in a Fixed Bed of Coconut Shell Activated Carbon Impregnated With Sodium Hydroxide: Effects of Carbon Pore Texture and Alkali Loading. Eng. J. 2019, 23, 29–48. [Google Scholar] [CrossRef]
  103. Pirngruber, G.D.; Leinekugel-Le-Cocq, D. Design of a Pressure Swing Adsorption Process for Postcombustion CO2 Capture. Ind. Eng. Chem. Res. 2013, 52, 5985–5996. [Google Scholar] [CrossRef]
  104. Smith, R. Chemical Process Design and Integration; McGraw Hill: New York, NY, USA, 2005. [Google Scholar]
  105. Wurzbacher, J.A.; Gebald, C.; Piatkowski, N.; Steinfeld, A. Concurrent Separation of CO2 and H2O from Air by a Temperature-Vacuum Swing Adsorption/Desorption Cycle. Environ. Sci. Technol. 2012, 46, 9191–9198. [Google Scholar] [CrossRef] [PubMed]
  106. Elfvinga, J.; Kauppinena, J.; Jegoroffa, M.; Ruuskanenb, V.; Järvinenb, L.; Sainioc, T. Experimental comparison of regeneration methods for CO2 concentration from air using amine-based adsorbent. Chem. Eng. J. 2021, 404, 126337. [Google Scholar] [CrossRef]
  107. Towler, G.; Sinnott, R.K. Chemical Engineering Design: Principles, Practice and Economics of Plant and Process Design; BH: Oxford, UK, 2012. [Google Scholar]
  108. Primo, J. 2012. Available online: https://pdhonline.com/courses/m385/m385content.pdf (accessed on 1 December 2020).
  109. House, K.Z.; Baclig, A.C.; Ranjan, M.; van Nierop, E.A.; Wilcox, J.; Herzog, H.J. Economic and energetic analysis of capturing CO2 from ambient air. Proc. Natl. Acad. Sci. USA 2011, 108, 20428–20433. [Google Scholar] [CrossRef] [Green Version]
  110. Krekel, D.; Samsun, R.C.; Peters, R.; Stolten, D. The separation of CO2 from ambient air—A techno-economic assessment. Appl. Energy 2018, 218, 361–381. [Google Scholar] [CrossRef]
  111. Carbonbrief. 2020. Available online: www.carbonbrief.org/swiss-company-hoping-capture-1-global-co2-emissions-2025 (accessed on 1 December 2020).
  112. Narula, K.; Filho, F.D.O.; Chambers, J.; Romano, E.; Hollmuller, P.; Patel, M.K. Assessment of techno-economic feasibility of centralised seasonal thermal energy storage for decarbonising the Swiss residential heating sector. Renew. Energy 2020, 161, 1209–1225. [Google Scholar] [CrossRef]
Figure 1. Operating principle of TSA process.
Applsci 12 02618 g001
Figure 2. Diagram of the experimental setup used for the validation of the mathematical model [74].
Applsci 12 02618 g002
Figure 3. Breakthrough curves (CO2 concentration at the outlet/CO2 concentration at the inlet) for physisorbents.
Applsci 12 02618 g003
Figure 4. Breakthrough curves (CO2 concentration at the outlet/CO2 concentration at the inlet) for chemisorbents.
Applsci 12 02618 g004
Figure 5. Loading for physisorbents: (a) MIL-101, (b) MOF-177, and (c) MOF-5.
Applsci 12 02618 g005
Figure 6. Loading for chemisorbents: (a) SI-AEATPMS sorbent and (b) APDES-NFC-FD sorbent.
Applsci 12 02618 g006
Figure 7. CO2 concentration during the desorption step for physisorbents: (a) MIL-101, (b) MOF-177, and (c) MOF-5.
Applsci 12 02618 g007
Figure 8. CO2 concentration during the desorption step for chemisorbents: (a) SI-AEATPMS sorbent and (b) APDES-NFC-FD sorbent.
Applsci 12 02618 g008
Table 1. CO2 uptakes of some amine-functionalized sorbents.
SupportAmineConditionsCon. CO2
(ppm)
Adsorption Capacity
(molCO2/kgsorbent)
Reference
Class I
Hierarchical bimodal meso/microporous silicaPEI303 K, 19% relative humidity4003.36Kwon et al. [28]
Fumed silicaPEI + PEG323 K3606.8 × 10−1Meth et al. [38]
Silica and polymethylmethacrylateTEPA308 K4002.50Brilman and Veneman [39]
SBA-15PPI prepared by HClO4303 K4003.1 × 10−1Sarazen et al. [29]
SBA-15PPI prepared by HBr303 K4002.5 × 10−1Sarazen et al. [29]
SBA-15PPI prepared by HCl303 K4001.5 × 101Sarazen et al. [29]
SBA-15PPI prepared by Ch3SO3H303 K4001.7 × 10−1Sarazen et al. [29]
Microporous polymerPEI308 K4002 × 10−1Pang et al. [40]
Mesocellular foamPAA298 K4006.3 × 10−1Chaikittisilp et al. [41]
Mesocellular foamPEI298 K4006.1 × 10−1Chaikittisilp et al. [41]
Mesocellular foamPEI298 K4004.4 × 10−1Chaikittisilp et al. [41]
Class II
Nanofibrillated celluloseAPDES296 K, relative humidity4002.13Gebald et al. [42]
Mg2(dobpdc)H2N4298 K4003.89Liao et al. [43]
MCM-41TRI298 K, 67% relative humidity3001.40Belmabkhout et al. [26]
Nanofibrillated celluloseAEAPDMS298 K, 40% relative humidity5061.39Ng et al. [44]
Mg/DOBDCED298 K4001.50Choi et al. [36]
Class III
SBA-15Aziridine298 K4001.78Choi et al. [45]
Hybrid silica materiaAPTMS303 K, relative humidity4001.68Abhilash et al. [32]
Table 2. Adsorption capacity of some physisorbents from ambient air at 49% of relative humidity.
PhysisorbentAdsorption Capacity
(mol/kgsorbent)
Reference
CO2H2O
SIFSIX-3-Ni1.8 × 10−15.17Shekhah et al. [50]
HKUST-15 × 10−29.89Kumar et al. [39]
Mg-MOF-741.4 × 10−19.50Caskey et al. [51]
Table 3. Estimated costs for adsorption technology.
Literature Work/TeamActual Cost
(USD/tonneCO2)
Future Cost
(USD/tonneCO2)
Fasihi et al. [53] 6.3 × 101–8.6 × 101
Kulkarni and Sholl [54]4.3 × 101–4.94 × 10²
Zhang et al. [18]9.1 × 101–2.27 × 10²
Sinha et al. [55]6 × 101–1.9 × 10²
Viebahn [56] (Climeworks)6 × 1021 × 102
Kintisch [57] (Global Thermostat) 1.5 × 101–5 × 101
Table 4. Main data for MOFs.
MIL 101
Particle diameter3.8 × 10−3mEyitope [75]
Particle density6.2 × 102kg/m3Ferey et al. [72]
Bed porosity4.4 × 10−1
MOF-177
Particle diameter3.8 × 10−3mEyitope [75]
Particle density4.3 × 102kg/m3Kaskel [76]
Bed porosity4.4 × 10−1 Qasem et al. [64]
MOF-5
Particle diameter3.8 × 10−3mEyitope [75]
Particle density6.21 × 102kg/m3Qasem et al. [64]
Bed porosity4.4 × 10−1
Table 5. Main data for amine-functionalized sorbents.
SI-AEATPMS
Particle diameter2 × 10−3mGoyal et al. [77]
Particle density1.31 × 103kg/m3Goyal et al. [77]
Bed porosity6 × 10−1
APDES-NFC-FD
Particle diameter5 × 10−3mWurzbacher [73]
Particle density5.54 × 101kg/m3Wurzbacher [73]
Bed porosity5 × 10−1
Table 6. Data of one adsorbent bed unit.
Area footprint excl. options2 × 101m2
Height3.2m
CO2 flow rate, inlet1.8 × 102kg/day
YCO2, inlet4 × 10−4
Air flow rate, inlet2.86m3/s
Table 7. Langmuir parameters for MOF sorbents.
MOF-177
qsat1.03 × 101mol/kgMason et al. [84]
bo2.51 × 10−121/PaMason et al. [84]
ΔHCO2−1.4 × 10⁴J/molQasem et al. [64]
MOF-5
qsat4.8 × 10mol/kgEyitope [75]
bo8.06 × 10−101/PaEyitope [75]
ΔHCO2−3.4 × 10⁴J/molEyitope [75]
MIL-101
qsat (298 K) 3.32 × 101mol/kgMontazerolghaem et al. [65]
b (298 K)3 × 10⁻²¹/barMontazerolghaem et al. [65]
qsat (373 K)3 × 10⁻⁵mol/kgMontazerolghaem et al. [65]
b (373 K)7.32 × 10²¹/barMontazerolghaem et al. [65]
ΔHCO2−1.63 × 10⁴J/molZhang et al. [85]
Table 8. Toth parameters for APDES-NFC-FD sorbent [74].
bo2.25 × 1041/bar
ΔHCO26 × 104J/mol
to4.22 × 10−1
α9.49 × 10⁻¹
nso1.97mol/kg
χ2.37
Table 9. Variable operating costs.
MOF-51.95USD/kgDanaci et al. [95]
MOF-1771.95USD/kgDanaci et al. [95]
MIL-1011.95USD/kgDanaci et al. [95]
SI-AEATPMS 1.30USD/kg
APDES-NFC-FD1.16USD/kg
Cooling water8 × 10−2USD/m3Danaci et al. [95]
Electricity from MWI1 × 10−1USD/kWhBauer et al. [96]
Waste heat from MWI2.4 × 10−2USD/kWhSDH [97]
Table 10. Main results from adsorption and desorption stages.
SorbentMIL-101MOF-177MOF-5SI-AEATPMSAPDES-NFC-FD
Mass of the sorbent (kg)2.22 × 1041.54 × 1042.23 × 1043.36 × 1041.77 × 103
Average single pass recovery5.2 × 10−15.9 × 10−15.3 × 10−18.6 × 10−18.9 × 10−1
Adsorption time (s)3.2 × 1022.14 × 1027.49 × 1023.06 × 1053.26 × 104
Desorption time (s)9.9 × 1011.6 × 1023.15 × 1021.67 × 1041.85 × 103
Full cycle time (h)1.2 × 10−19 × 10−22.9 × 10−18.92 × 1019.53
Number of cycles/day2.07 × 1022.71 × 1028.15 × 1013 × 10−12.5
Captured CO2 (kg/h)3.964.54.006.436.66
Captured CO2 (kg/cycle)3.5 × 10−12.6 × 10−18.3 × 10−1546 × 1026.03 × 101
Captured CO2 (kg/day)7.3 × 1017.2 × 1016.8 × 1011.47 × 1021.52 × 102
Table 11. Energy consumptions for different adsorbent beds.
SorbentMIL-101MOF-177MOF-5SI-AEATPMSAPDES-NFC-FD
Regeneration modeTSATSATSATSATSA
Regeneration temperature (K)3.73 × 1023.73 × 1023.73 × 1023.83 × 1023.73 × 102
Pressure drop (Pa)1.94 × 1031.94 × 1031.94 × 1037.34 × 1026.36 × 102
Electrical energy (kWhel/tonneCO2)1.54 × 1031.35 × 1031.52 × 1033.57 × 1022.99 × 102
Working capacity (mol/kg)3.5 × 10−43.9 × 10−48.4 × 10−43.67 × 10−17.71 × 10⁻¹
Regeneration energy (kWhth/tonneCO2)1.07 × 1061.3 × 1064.94 × 1051.88 × 1031.4 × 103
Publisher’s Note: MDPI stays neutral with regard to jurisdictional claims in published maps and institutional affiliations.

