Article

One-Step Fabrication of Nickel-Electrochemically Reduced Graphene Oxide Nanocomposites Modified Electrodes and Application to the Detection of Sunset Yellow in Drinks

by
Quang-Trung Nguyen
1,
Truong-Giang Le
2,
Philippe Bergonzo
3,4,* and
Quang-Thuan Tran
1,*
1
Center for Research and Technology Transfer (CRETECH), Vietnam Academy of Science and Technology (VAST), 18 Hoang Quoc Viet, Hanoi 11300, Vietnam
2
Institute of Chemistry, Vietnam Academy of Science and Technology (VAST), 18 Hoang Quoc Viet, Cau Giay District, Hanoi 11300, Vietnam
3
Electronic and Electrical Engineering Department, University College London, London WC1E 7JE, UK
4
Seki Diamond Systems, San Jose, CA 95131, USA
*
Authors to whom correspondence should be addressed.
Appl. Sci. 2022, 12(5), 2614; https://doi.org/10.3390/app12052614
Submission received: 12 January 2022 / Revised: 16 February 2022 / Accepted: 23 February 2022 / Published: 3 March 2022
(This article belongs to the Section Nanotechnology and Applied Nanosciences)

Abstract

:
This work describes a straightforward method using one-step preparation of graphene/nickel nanocomposite materials from low-cost materials including graphene oxide and nickel metal. Repetitive CVs lead to the simultaneous deposition of metallic nickel nanoparticles and reduced graphene oxide sheets onto glassy carbon electrode. The obtained nanocomposite-modified surfaces were characterised by cyclic voltammetry, differential pulse voltammetry and field emission scanning electron microscopy. The result demonstrated the ability to produce nickel nanoparticles with a small size of about 20 nm, uniformly dispersed on a graphene oxide matrix. The ERGO-NiNP nanocomposite could be used as a sensor material exhibiting high performance; it is used here in order to detect Sunset Yellow (SY) and for quantification in complex media. The sensor enables rapid quantification of SY with a good linearity (R2 = 0.996) in the range of 10–1000 nM, together with a low detection limit of 3.7 nM (equivalent to 1.7 µg L−1) and a high sensitivity up to 7 µA/µM. The sensor also displays high reliability with a RSD value = 1.08 (n = 10) and good reusability (signal response variation below 5% after 5 detection/cleaning cycles). Finally, we demonstrate how this GCE/ERGO-NiNP sensor can be used for the successful determination of SY in commercial soft drink samples with an acceptable deviation below 6.4% when compared to HPLC method.

1. Introduction

Sunset yellow (SY) is a dye extensively used in the preparation of several types of food including soft drinks, candies, cheese, cake, ice-cream, canned juice, sauce, etc. It is a synthetic dye composed of an azo group with aromatic rings that can cause mutagenic and carcinogenic risks in humans [1,2,3]. Its use in foods is already banned in a few countries such as the USA, Norway and Finland. An effective method for SY determination is highly necessary for improving food safety control. For conventional techniques used to quantify SY analysis, one can refer to UV-VIS absorption [4,5] fluorescence [6], Raman [7] spectroscopies, and liquid chromatography [8,9] with varying levels of complexity and accuracy. In this context, electrochemical techniques offer the advantage that they can be used directly in the medium to test, with little preparation, thus simplifying the detection protocol in order to offer a rapid response and portable analysis. The challenge is therefore to develop electrodes enabling high sensitivity and accuracy.
Graphene appears as an excellent supporting material owing to its unique electronic properties and large specific surface area [10]. Therefore, it has attracted great attention for various fields such as electronics [11], supercapacitors [12], nanocomposite materials [13] and especially in electrochemical/biosensors [14,15,16]. Prior to the fabrication of graphene-based sensors, a direct electrochemical reduction exhibits a straightforward route to reduce graphene oxide (GO) into electrochemically reduced GO (ERGO) from GO suspensions [17]. However, graphene nanosheets tend towards the formation of irreversible agglomerates that could cause dramatic deterioration of the sheet’s properties due to strong planar stacking of graphene layers. These will impede the continuous pathway for electron/photon transport and thus restrict widespread applications [18,19]. In recent years, effective strategies have been proposed to separate graphene sheets by adding stabilizers such as surfactants [20,21], ionic liquids [22,23], and polymers [24]. Inorganic nanoparticles based on metals and metallic oxides, being relatively stable and robust with respect to the above agents, have become promising candidates as stabilizers for improving the electrochemical performance of graphene-modified sensors. Furthermore, the fabrication of metallic nanoparticle–graphene nanohybrids can benefit from the synergic effect of both nanomaterials for applications [25,26]. Various metallic species have been successfully proposed for incorporation into graphene-based materials for electroanalytical applications, varying from the precious metals AuNPs [27,28,29], Au-Pd [30], Pt [31], and Ag [32] to the transition metal oxides Cu2O [33,34], CuO [35,36], Mn3O4 [37], Fe3O4 [38], TiO2 [39,40], CeO2 [41], ZnO [42], and ZrO2 [43]. However, graphene-based sensors are usually elaborated using Reduced Graphene Oxide (RGO) obtained via chemical reduction using toxic reducing agents, thus causing serious problems for human health and the environment. Therefore, effective and eco-friendly techniques enabling the preparation of graphene-based hybrid nanocomposites are highly recommended. In this context, electrochemical techniques exhibit several advantages for the preparation of graphene-metal nanocomposites with various benefits: (i) it can be achieved via a one-step process from a graphene oxide–ion metal mixture; it is green and fast without the use of any toxic chemical agents; (ii) the method is easily controllable by fine-tuning of electrochemical parameters; and (iii) it enables the direct preparation of a nanocomposite directly deposited onto a substrate and ready to use as an electrode.
By tuning the electrochemical protocol, a variety of nanocomposite materials have been prepared for applications such as PtNPs-graphene for methanol oxidation in fuel cell applications [44]; MnO2 nanowall-graphene, Ni(OH)2NPs-graphene, MoS2-graphene for supercapacitors [45,46]. They can be used as BiNPs-graphene for the electrochemical detection of lead metal in pore water samples [47]; CuNPs-graphene and AgNPs-graphene for hydrogen peroxide detection [48]; ZnONPs-graphene for the photocatalytic removal of organic pollutants [49]; and AuNPs-graphene for the electroanalytical detection of dopamine, ascorbic and uric acids [28,29]. Moreover, metallic nickel/nickel oxide nanoparticle materials have attracted tremendous attention due to their high electrochemical stability and electrocatalytic activity while remaining low-cost materials. The nickel/graphene nanocomposites were also found to be high-performance materials with which to fabricate sensitive electrochemical sensors such as those for the detection of glucose [50,51,52], methanol [53], and ethanol [24]. However, these methods were mainly focused on two-step electrochemical synthesis protocols of graphene-nickel nanomaterials with a structure of two separated layers. This motivates the search for alternative routes, enabling a more straightforward approach to the fabrication of graphene–nickel nanocomposites.
This work reports on an alternative method enabling the one-step preparation of nickel nanoparticles/reduced graphene oxide nanocomposite materials for the rapid determination of SY. In fact, one investigation has already proposed such an approach in order to prepare graphene–nickel nanocomposites with a structure of alternating layers of metal oxide nanoparticles and ERGO sheets; those developments were used towards the electroanalytical detection of 2,4,6-trinitrophenol [54]. By using a simple electrochemical deposition process onto glassy carbon substrate, a graphene oxide/nickel nanocomposite-modified carbon surface can be obtained and applied as an electrochemical, ready-to-use platform for sensing applications. The procedure described herein is particularly robust. The morphology of the obtained nanocomposite films was analysed using FE-SEM microscopy and its electrochemical performances were carefully characterised using Cyclic Voltammetry (CV), and Differential Pulse Voltammetry (DPV) techniques. The result demonstrated that such GCE/ERGO-NiNP sensors could be used for successful determination of SY in complex media such as soft drink samples. The prepared ERGO/NiNP nanocomposite appears as a promising platform to enable the fabrication of sensitive, fast, and accurate electrochemical sensors for analytical applications.

2. Materials and Methods

2.1. Reagents

The sunset yellow SY (90.5%) was supplied by LGC standard, Dr. Ehrenstorfer GmbH, Germany. Nickel chloride hydrate (NiCl2.6H2O), lithium perchlorate (LiClO4 99%), potassium hexacyanoferrate (II) trihydrate (K4Fe(CN)6.3H2O), potassium hexacyanoferrate (III) (K3Fe(CN)6), and potassium chloride (KCl) were obtained from Sigma Aldrich. All chemical agents are analytical grade and used as received without further purification. Deionised water (18.2 Ω) was used from a purification system (Milli-Q Integral 3). Graphene oxide (GO) was previously synthesized following modified Hummer methods as described in detail elsewhere [55].

2.2. Electrochemical Measurements

Electrochemical measuring was carried out with a conventional three-electrode system using a CIMPS electrochemical workstation (Zahnner). A Pt wire and a saturated calomel reference electrode (SCE) were used as counter and reference electrodes respectively, while glassy carbon electrodes (3 mm diameter) modified with ERGO or ERGO-NiNP nanocomposites material are the working electrodes. The DPV signals were registered from 0 to 0.9 V/SCE after 2 min of accumulation at 0V/SCE. The DPV measurements were recorded using experimental parameters at scan rate of 20 mV s−1, step potential of 6 mV, pulse amplitude of 30 mV, pulse width of 120 ms, integration time of 60 ms. of deposited onto ITO surface (2 × 1 cm2) was used for deposition of ERGO or ERGO-NiNP layers for morphology characterisation using field emission scanning electron microscopy (FE-SEM, Hitachi S4800).

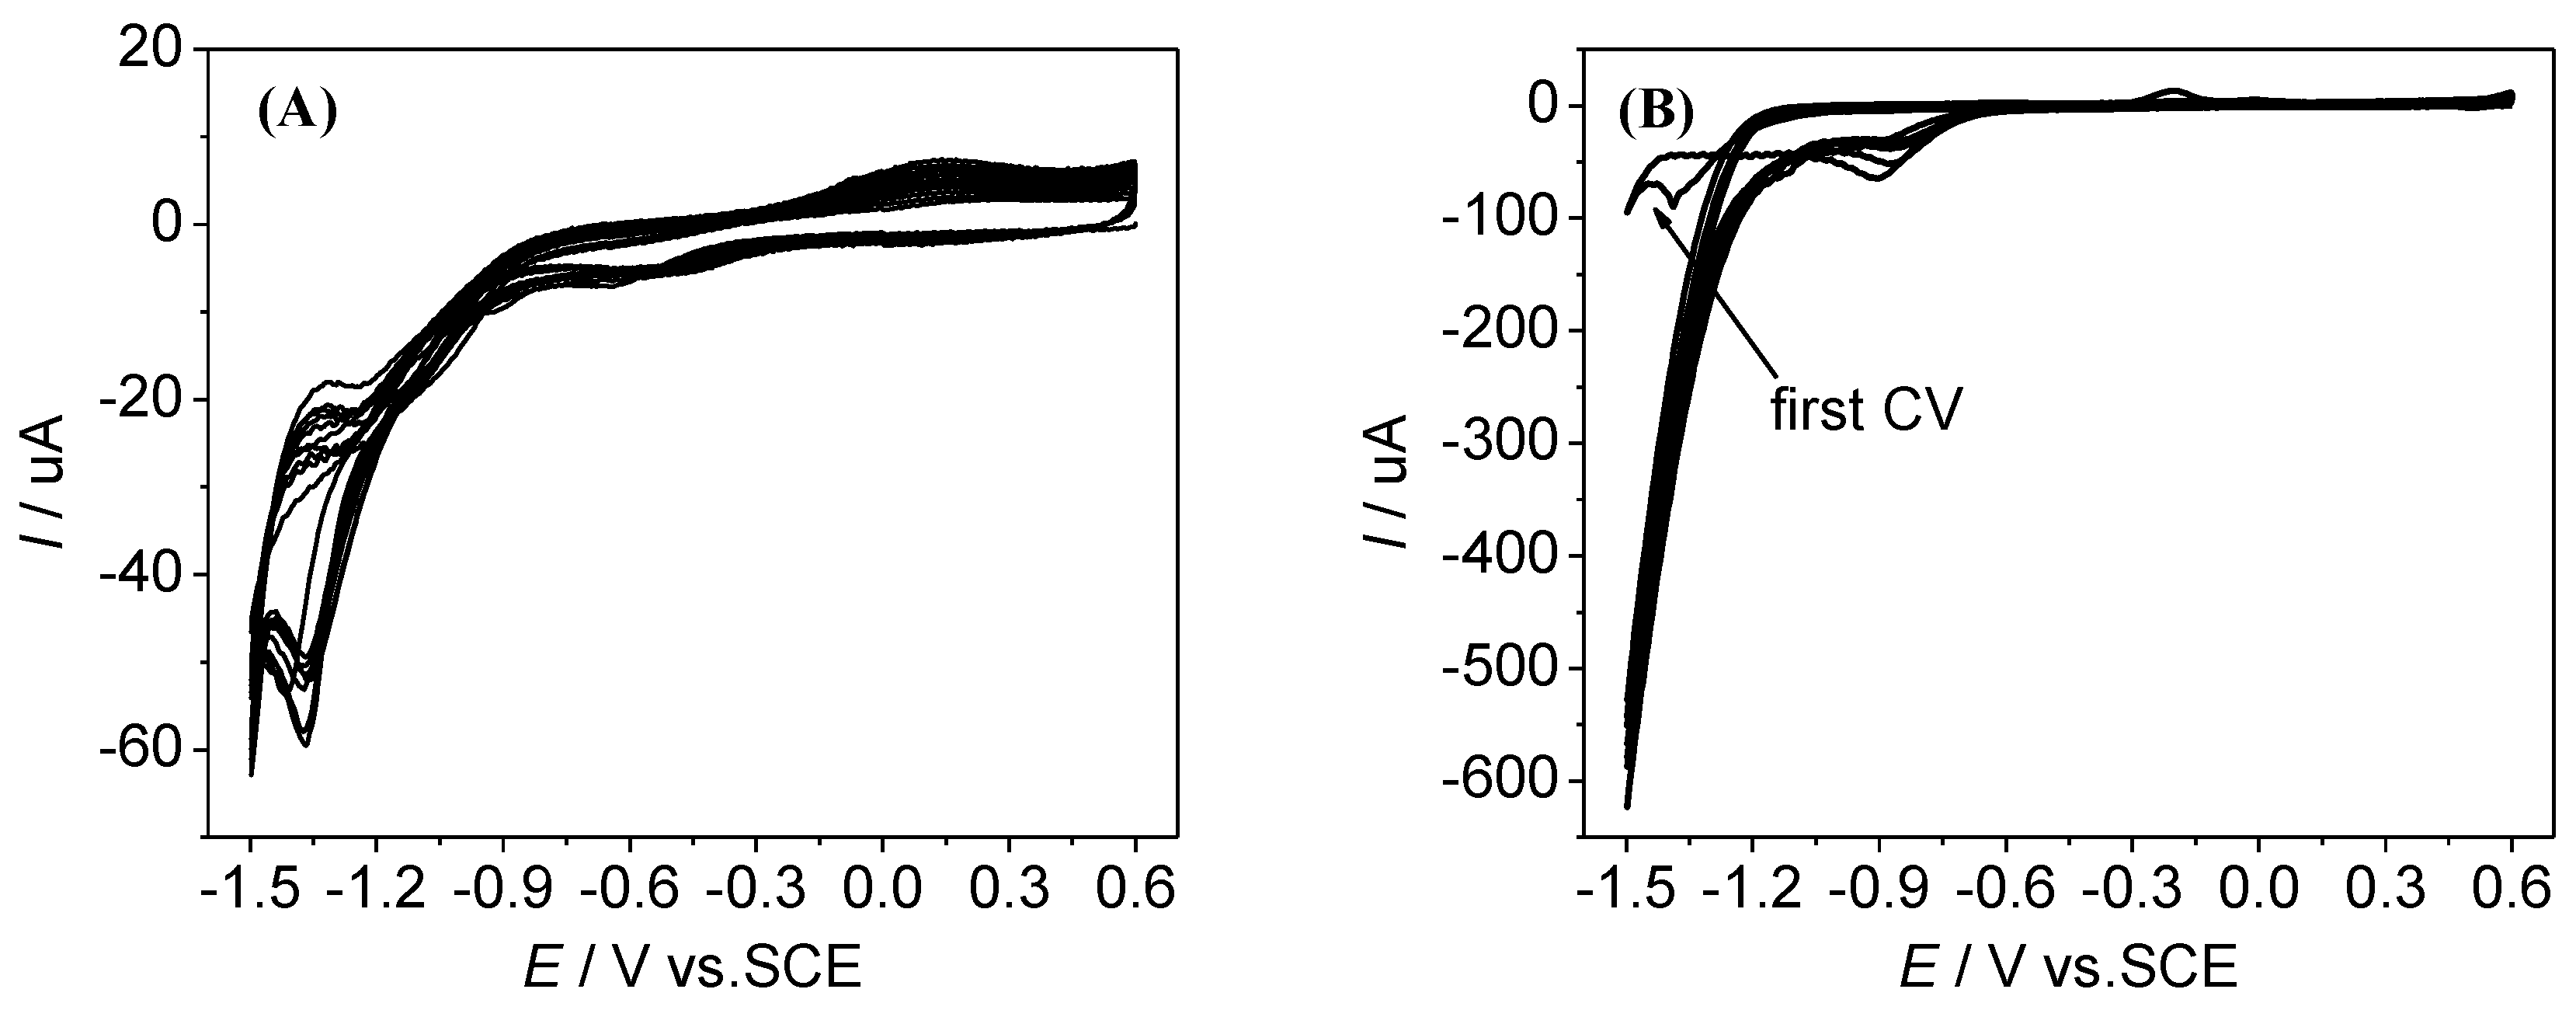
2.3. Electrochemical Preparation of Nickel/Graphene-Modified Electrodes (GCE/ERGO-NiNPs)

The prepared GO solid powder was firstly dispersed in deionised water (8.0 mL, 1 mg mL−1) using ultra-sonication for 1 h. This suspension was subsequently centrifuged and decanted to eliminate graphite flakes. LiClO4 salt was added into a GO solution, which was sonicated for 15 min in order to reach a 0.2 M concentration in the resulting electrolyte. In addition, 0.5 mM NiCl2 nickel salt was added to the GO + LiClO4 solution from diluted NiCl2 solution (0.05 M) under gentle stirring to make the final solution for electrodeposition. Prior to modification, the GCE electrodes were thoroughly polished with DP-Nap 1 µm polishing paper (Struers) and cleaned via ultra-sonication in acetone and water for 5 min. Afterwards, the ERGO and nickel/nickel oxide nanoparticle composite-modified GCE (denoted as GCE/ERGO-NiNP) was prepared using the cyclic voltammetry method (10 scans) between 0.6 to −1.5 V/SCE in GO + NiCl2 suspension that was purged with argon bubbling under magnetic stirring. For comparison, an ERGO-modified electrode (denoted as GCE/ERGO) was prepared using the same method from a dispersion of GO without NiCl2 salt.

2.4. Sample Preparation and Detection

Electrolyte solutions with different pH values (pH = 3–8) were prepared using 0.1 M acetate buffer (pH = 3, 4, 5) and 0.1 M phosphate buffer (pH = 6, 7, 8). A standard solution (10−4 M) was prepared daily from the SY compound. Prior to detection, the soft drink samples were treated by simple filtration with a membrane syringe (KX Nylon membrane, 13 mm, 0.22 μm, Kinesis). Then, the sample was diluted in the buffer for electrochemical analysis. In parallel, SY contents in real samples were also determined using HPLC [55] for comparison.

3. Results and Discussion

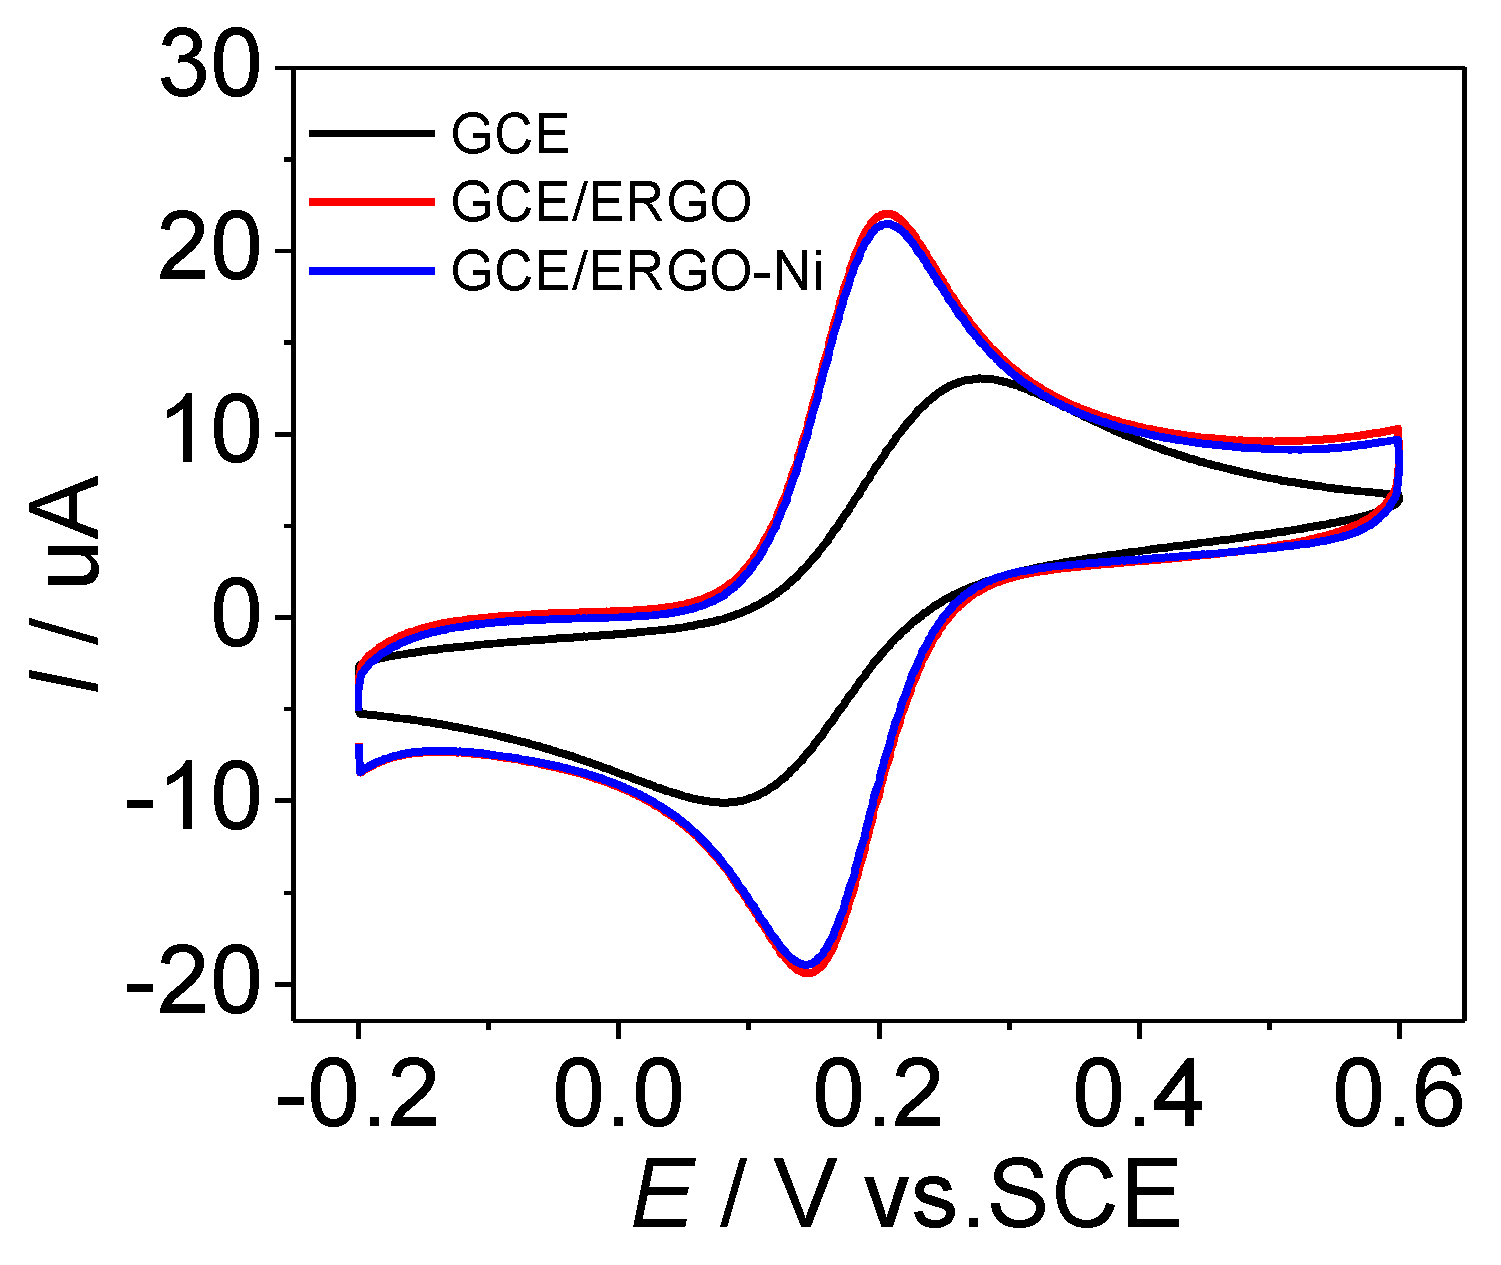
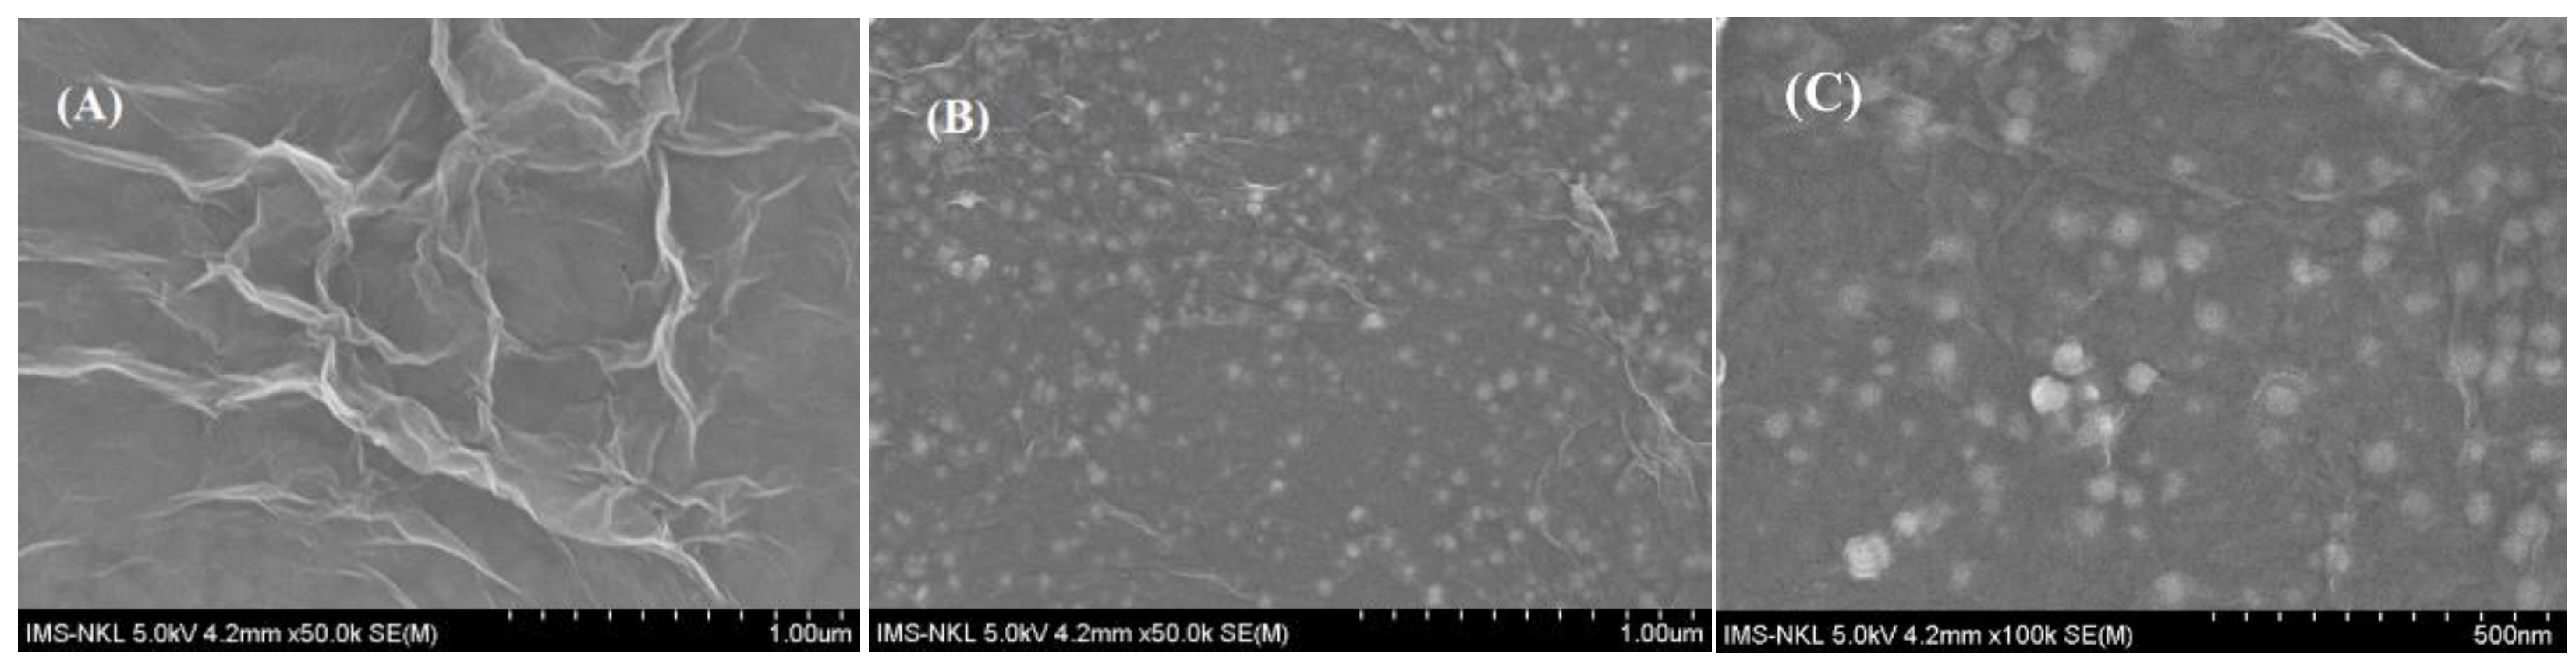
3.1. Preparation and Characterization of ERGO-NiNP Film-Modified Electrode

The modified electrodes were prepared using a simple electrochemical reduction consisting of 10 successive CV scans in the graphene oxide solution without or with NiCl2 salt. The CV of GO solution exhibits three characteristic signals, two reduction peaks at −0.5 and −1.35 V/ECS and one oxidation peak at 0.15 V/ECS (Figure 1A). The repetitive reduction process led to the electrodeposition of electrochemically reduced graphene oxide films on the GCE surface (denoted as GCE/ERGO) following the previously described procedure [55]. The CV of the GO solution containing NiCl2 salt displays significant changes (Figure 1B). The first CV scan shows the characteristic signals for GO reduction-oxidation processes along with two additional signals: one oxidation peak at −0.2 V/SCE and one reduction peak at −0.8 V/SCE. Both additional signals could be assigned to the reduction/oxidation of nickel and leading to the deposition of Ni metal nanoparticles (see Equation (1)) along with reduced graphene oxide (see Electronic Supporting Information Figure S1). The second CV scan displays the characteristic signal of nickel reduction at −0.8 V/SCE and a very high current in the cathodic region overlapping the peak of GO reduction (current value increases by 5-fold). This dramatic increase in the current is proposed to be due to a hydrogen evolution reaction catalysed by electrodeposited nickel metal after the first CV scan. Thus, the generated hydroxyl group reacts with Ni2+ ions to Ni(OH)2 precipitates that could probably be decomposed into NiO compounds following Equations (2) and (3) [52,53]. In fact, Tao et al. [56] demonstrated that electrodeposited nickel nanoparticles exhibited high catalytic activity towards hydrogen evolution. It could be proposed that this process led to the deposition of reduced graphene oxide and nickel nanocomposite materials (including Ni and NiO nanoparticles) onto electrode surfaces (denoted ERGO-NiNP nanocomposite). No more significant changes for the following CVs scans (from 3–10th) are noted, suggesting that the ERGO-NiNP nanocomposite is continuously formed and deposited for the following successive scans. These observations indicate that a simple cycling potential method could allow both synthesis and deposition of ERGO-NiNP nanocomposites onto GCE surfaces.
Ni2+ + 2e− → Ni nanoparticle
Ni2+ + 2H2O → Ni(OH)2 + H2
Ni(OH)2 → NiO + H2O
FE-SEM characterization confirmed the deposition of ERGO and ERGO-NiNP films. In fact, ERGO films exhibit a crumpled lamellar structure of graphene nanosheets (Figure 2A) while ERGO-NiNP films present homogenous dispersion of nickel nanoparticles of size 20–30 nm into the graphene matrix and present a structure of alternating layers of metal nanoparticles and reduced graphene oxide layers (Figure 2B). From the EDX spectrum, the peak of C and Ni originating from ERGO-NiNP nanocomposite onto the ITO substrate could be seen (see Electronic Supporting Information Figure S2). Further characterisation of ERGO-NiNPs onto the ITO plate was performed by the XRD method. However, we observed that the main signals correspond to the ITO phase. It was not possible to clearly identify the phase of electrodeposited metallic nickels, probably because deposited nickel particle layers are too thin with respect to the ITO substrate (see Electronic Supporting Information Figure S3). Increasing the nickel phase by increasing the number of CV scans to 2 folds (20 scans) do not even allow the identification of the exact state of the deposited nickel materials. Finally, based on SEM images, the described electrodeposition method enables simultaneous preparation of graphene and nickel nanocomposite materials in which the nickel metallic nanoparticles exhibited small size and were well dispersed into the graphene matrix film.
The modified electrode surfaces are further characterized using cyclic voltammetry using K3Fe(CN)6/K4Fe(CN)6 as a couple redox probe (Figure 3). The CVs display the characteristic signals of Fe(III)/Fe(II) couple. Remarkably, peak currents were increased along with smaller peak-to-peak separations after the modification process. The peak-to-peak separation values (ΔEp = Epa–Epc where Epa and Epc are the anodic and cathodic peak potentials, respectively) are estimated to be approximately 64 mV for both ERGO and ERGO-NiNP-modified surfaces with the respect to 120 mV of the GCE electrode. Furthermore, the electrochemically active surface areas (ECSA) calculated according to the Randles-Sevcik equation were estimated to be 0.075, 0.165 and 0.157 cm2 corresponding to GCE, GCE/ERGO and GCE/ERGO-NiNPs respectively (See Electronic Supporting Information Figure S4). The value for the GCE surface is very close to the geometric value of 0.071 cm2, indicating good reliability of this estimation. The modified surfaces exhibited a significant enhancement of ECSA values up to 2.2- and 2.1-fold for ERGO and ERGO-NiNP-modified surfaces with respect to GCE surface. Surprisingly, a slightly lower ECSA is obtained for ERGO-NiNP compared to ERGO. As observed via the FE-SEM images, the introduction of nickel results in more compact ERGO films, and thus potentially lower electrochemical activity than ERGO single films. This observation could be considered a reasonable explanation for the slightly lower ECSA of ERGO-NiNP-modified surfaces. These results clearly demonstrate the successful preparation of ERGO and ERGO-NiNP-modified surfaces with enhanced surface area and good conductivity of both nickel and graphene nanomaterials.
The electrochemical behaviours of SY on the modified electrodes were studied using CV and DPV techniques. Voltammograms display a well-defined peak at E = 0.735 V/SCE with a peak-to-peak separation ΔEp = Epa–Epc equal to 30 mV for both GCE/ERGO and GCE/ERGO-NiNP surfaces (Figure 4A). Thus, the number of electrons transferred in the redox reaction could be estimated at 60/ΔEp = 2 for a reversible redox reaction. This observation indicates that the electrochemical oxidation of SY onto graphene-modified GCE electrodes is a reversible process [57]. Compared to GCE, the modified surfaces lead to a remarkable enhancement of the SY signal, with an even better signal on ERGO-NiNPs (Figure 4A). DPV experiments exhibit a clear effect of the different surfaces (Figure 4B). The DPV signal shows a peak of 0.3 µA at 0.77 V for the bare GCE. Current intensities are significantly increased up to 3.3 and 5.4 µA for ERGO and ERGO-NiNP-modified surfaces respectively, approximately improved by 11- and 18-fold. It could be proposed that the NiNPs of nanocomposite materials induce higher affinity to adsorb SY with respect to ERGO materials, and this leads to higher DPV current responses than on ERGO-modified electrodes. Furthermore, oxidation peak potentials of SY are negatively shifted to 0.74 V/SCE for ERGO and ERGO-NiNP-modified surfaces. ERGO-NiNP nanocomposite-modified surfaces led to a significant improvement in SY sensitivity due to the combination of the excellent properties of graphene with the nickel nanoparticles in the composite that provide high surface area and conductivity. This result confirms that the incorporation of nickel metal into the ERGO matrix improves the adsorption capacity for SY and thus enhances the oxidation as observed from other investigations [54]. Since GCE/ERGO-NiNPs exhibited the most efficient electrochemical surface activity toward SY detection, it was used as the working electrode for the sensing experiments below.

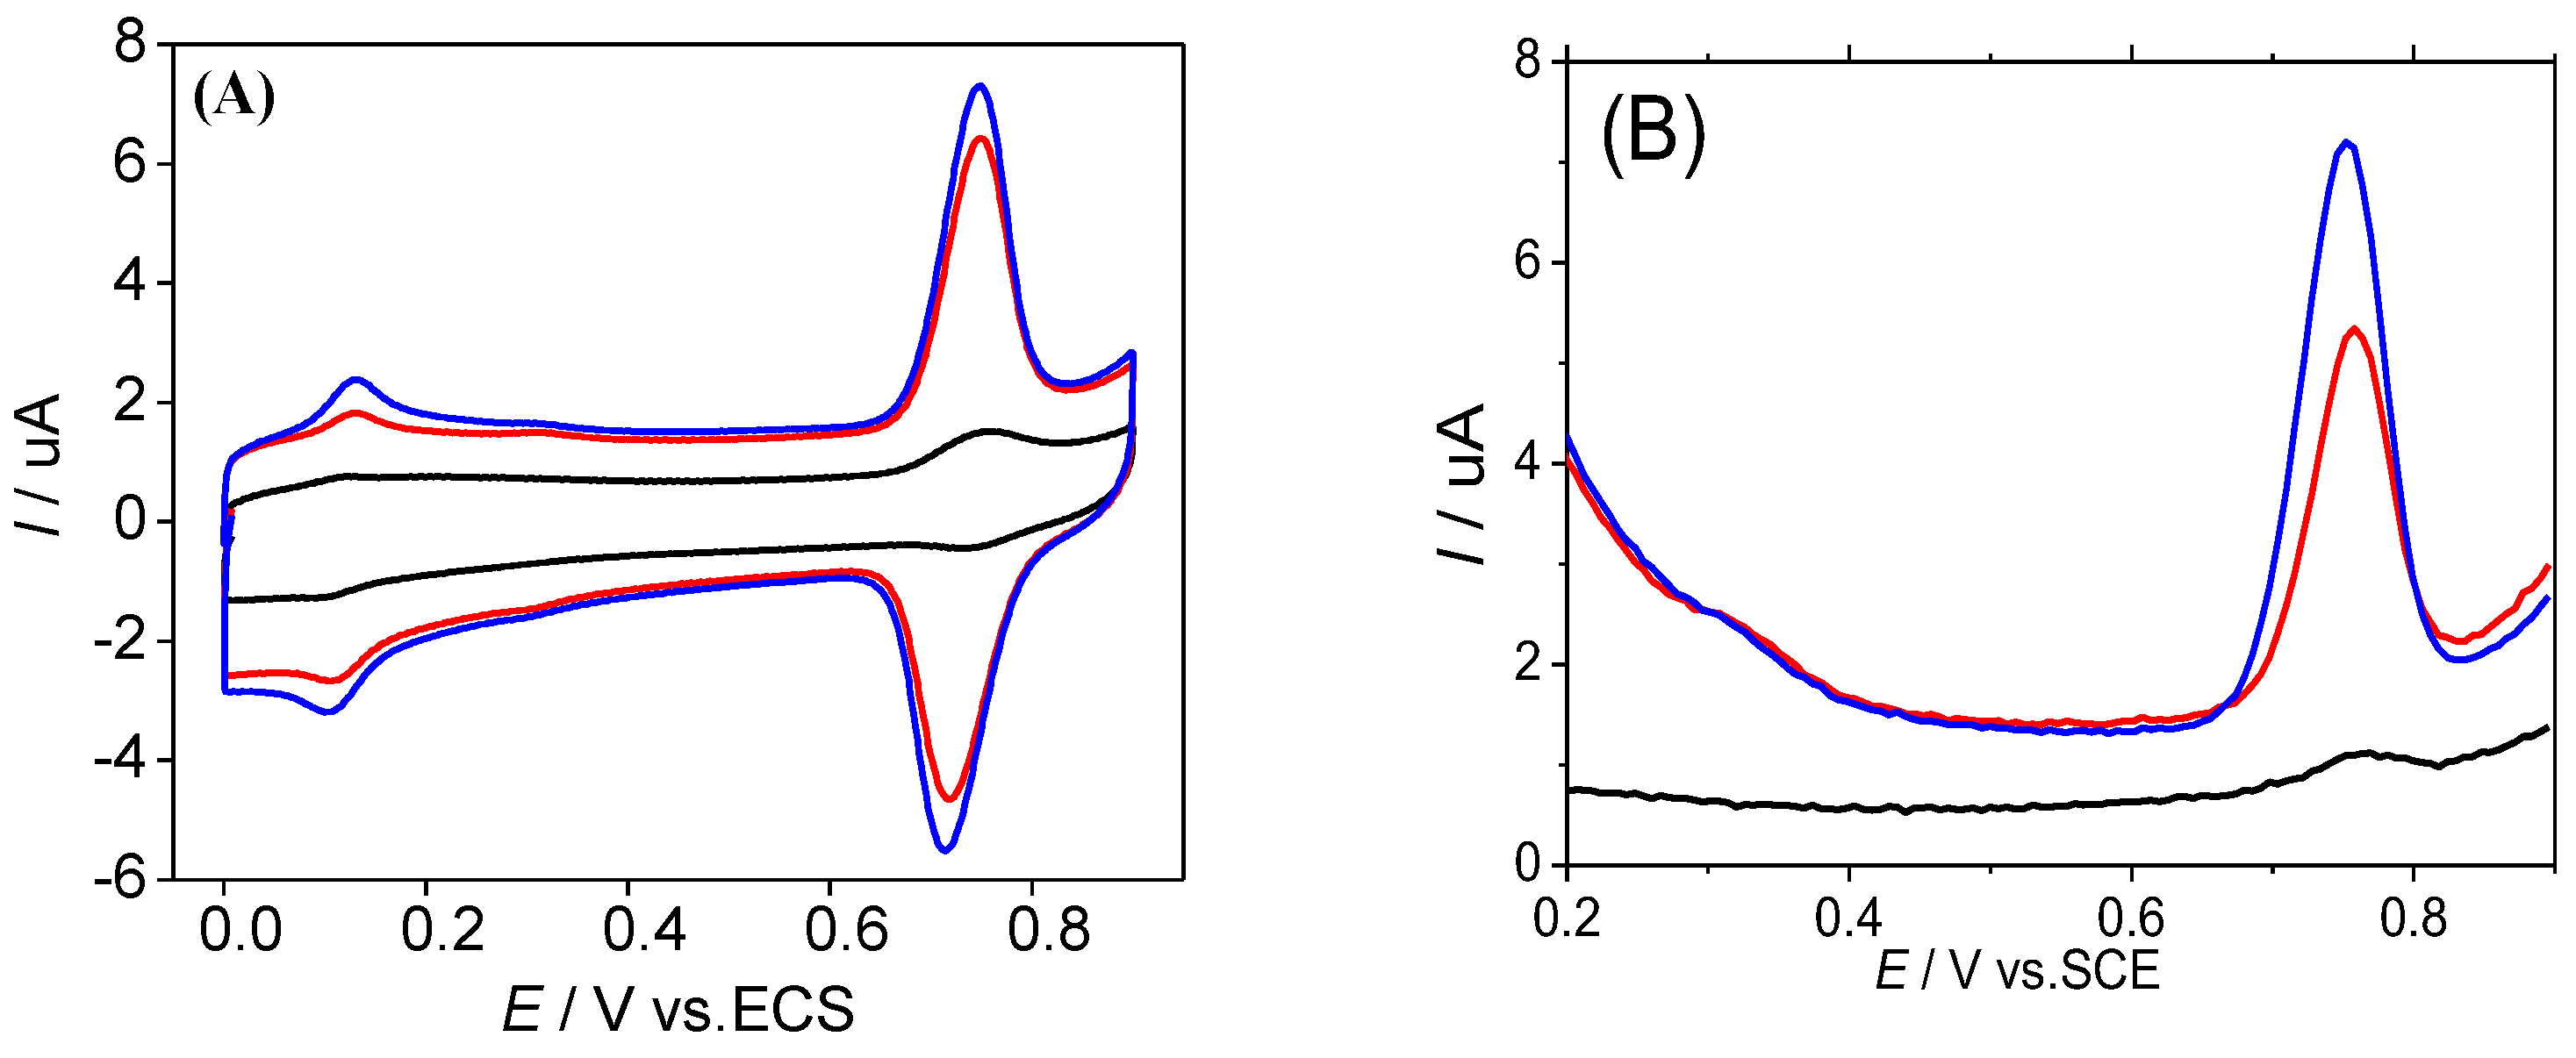
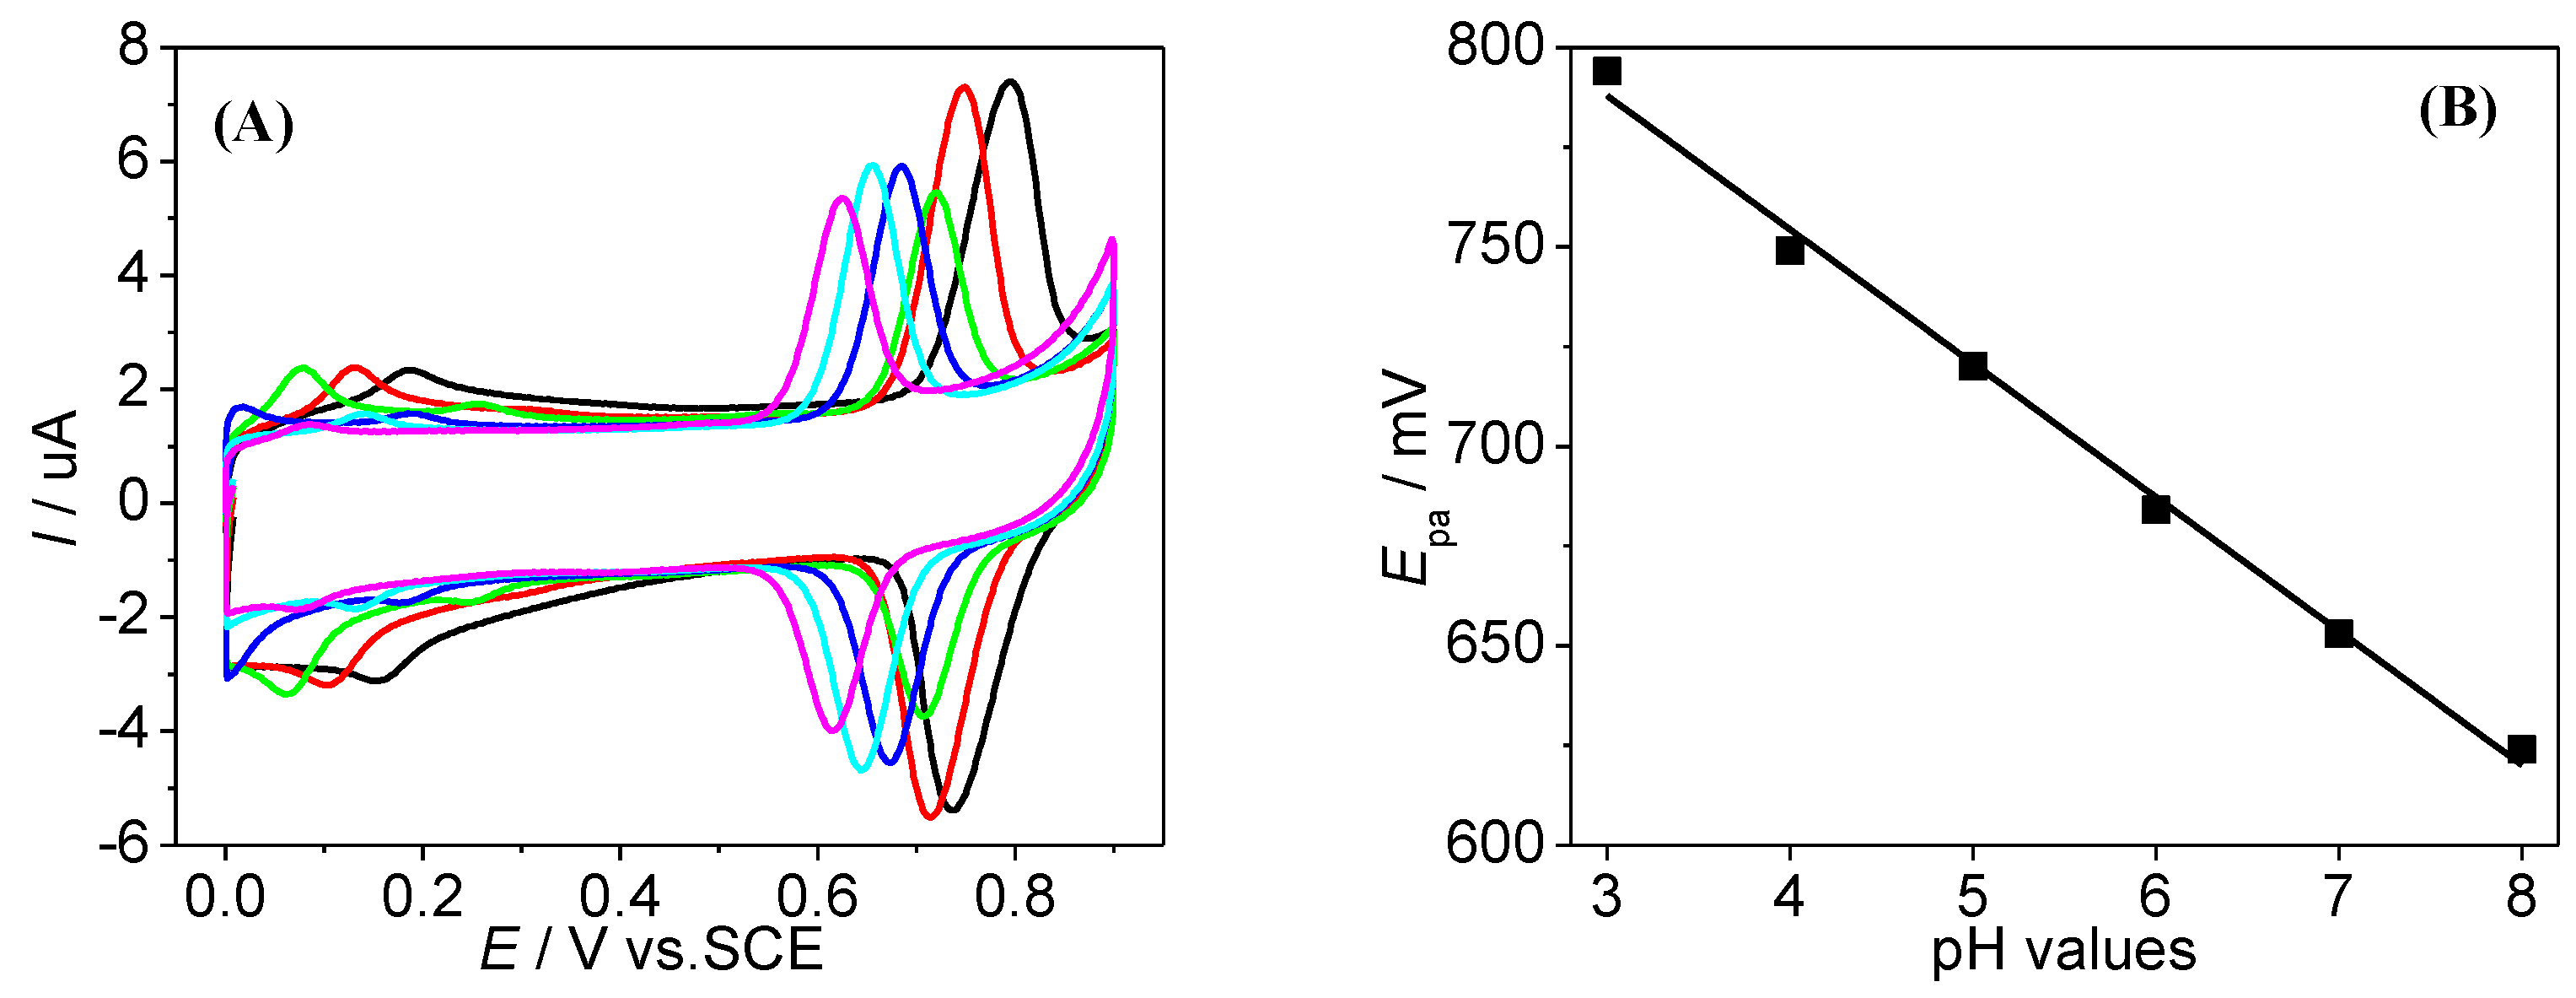
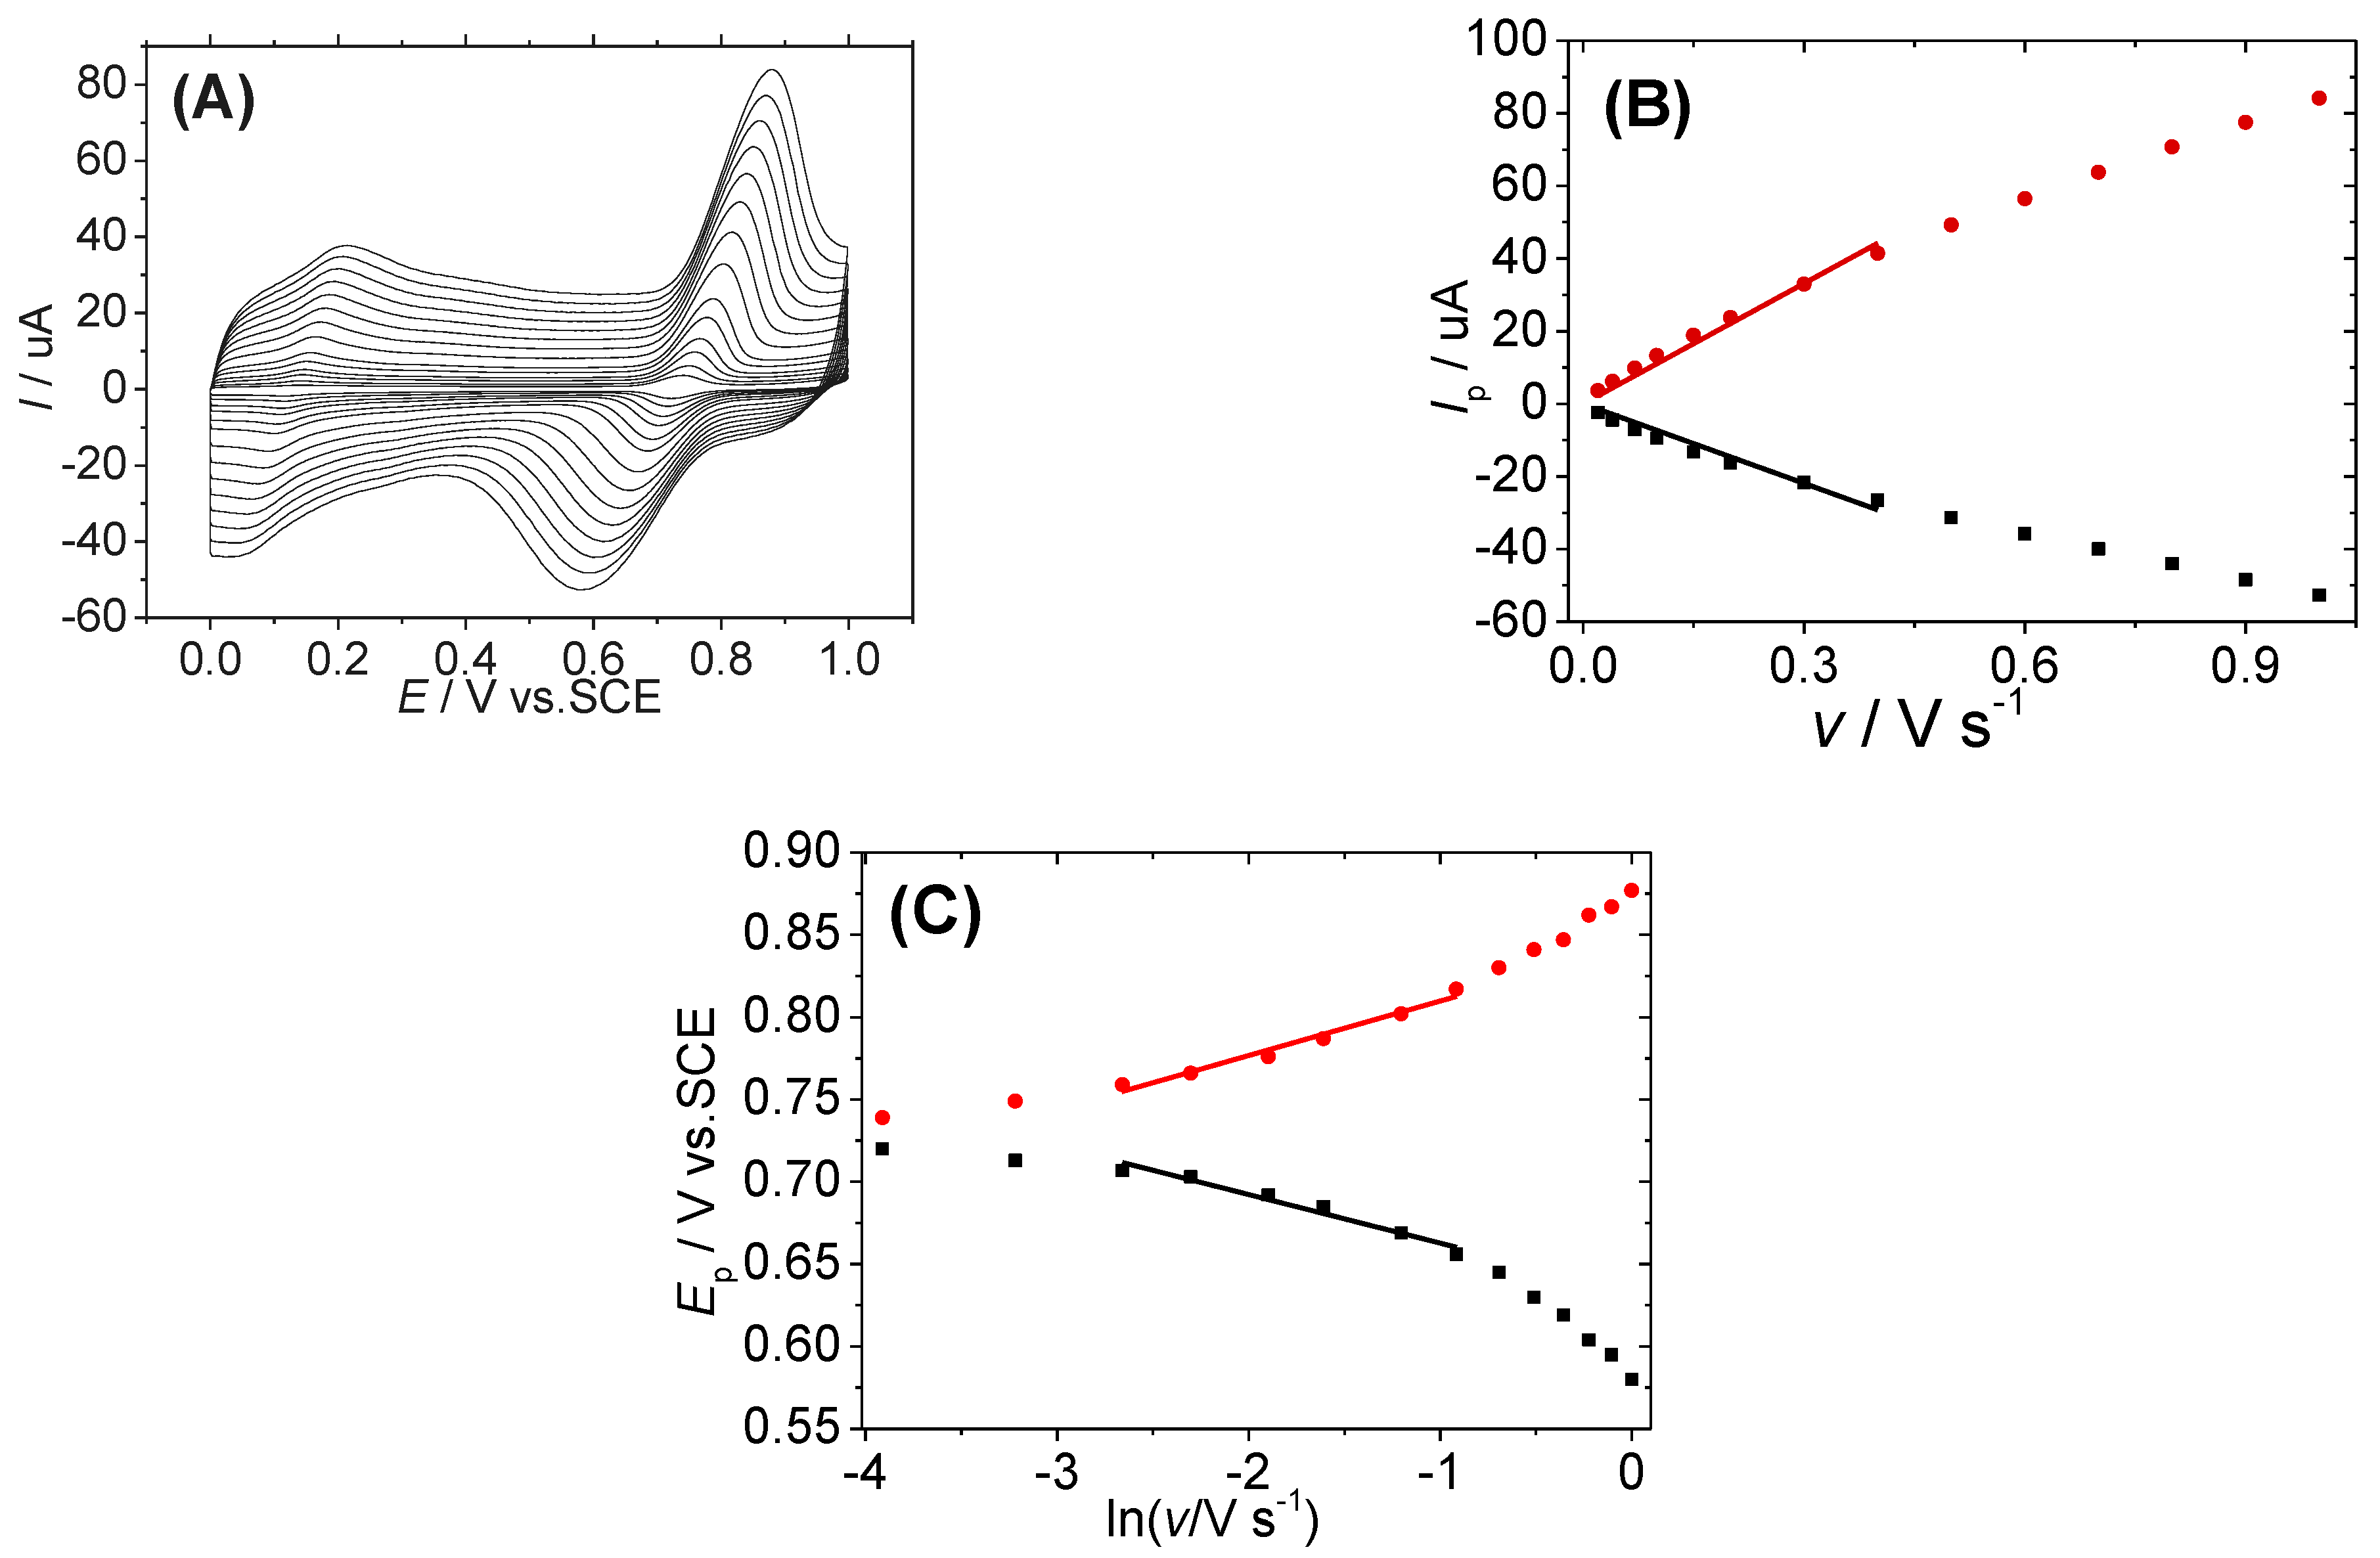
3.2. Electrochemical Behaviors of the SY onto GCE/ERGO-NiNPs Surface

The effect of the pH value on the electrochemical response was studied using the CV method in buffer solutions with pH values ranging from 3 to 8. The intensity of the current corresponding to the SY anodic peak changes with pH, and is obtained at its highest value for a pH = 4.0 (Figure 5A). This pH value is selected as an optimized buffer solution for further investigations. Otherwise, both anodic and cathodic peak potentials are decreased with an increase in pH. This result indicates the oxidation mechanism of SY involving electron transfers coupled with proton exchange. The anodic peak potential was linearly changed to pH value following the equation (Figure 5B):
Epa (mV) = (−33.5 ± 1.2) × pH + (888.5 ± 6.6) (R2 = 0.995).
The slope of the 33.5 mV pH−1 unit is estimated to a half of the theoretical Nernstian value of 59 mV pH−1, indicating that the proton/electron ratio involved in the SY oxidation reaction is approximately being to 0.5.
The effect of the scan rate on the response of 10 µM SY on the GCE/ERGO-NiNPs is investigated. The CVs show that the peaks exhibit an increase in the currents and shift with respect to the formal potential toward increasing the scan rate (Figure 6A). This behaviour is involved in the kinetics of the electrochemical process. The anodic and cathodic peak currents are linearly varied to the scan rate 0.02–0.4 V s−1 following the equation:
Ipa (µA) = (110.5 ± 3.62) × v
Ipc (µA) = (−73.0 ± 3.42) × v
The current increases slowly over the range of 0.5–1.0 V s−1 and deviates from linearity (Figure 6B). This observation indicates that the mechanism of the electrochemical process of SY was changed gradually from an adsorption to a diffusion process. Such a property is in good agreement with some previous works which used ionic liquid functionalised reduced graphene oxide-AuNPs and polypyrrole-carbon nanotube nanocomposite-modified electrodes [22,58]. Using Laviron’s theory, the peak potentials were plotted towards the logarithm of the scan rate, leading to two linear lines over the range 0.07–0.4 V s−1 using the following equations (Figure 6C):
Epa (V) = (0.0315 ± 0.0020) × lnv(V s−1) + (0.839 ± 0.0037)
Epc = (−0.0279 ± 0.0022) × lnv(V s−1) + (0.0637 ± 0.0042)
From these slope values, the values of n and α were estimated at 1.73 and 0.55 following equations RT/(1-α)nF and –RT/αnF for anodic and cathode lines, respectively. From the intercept of these linear lines (vi), the apparent electron transfer rate constant kET was calculated to 1.65 s−1 following equation kET = (1-α)nFvi/RT. These results suggest that the oxidation mechanism of SY on GCE/ERGO-NiNPs involves two electrons and one proton [58]. This result is in good agreement with recent research thoroughly investigating the electrochemical oxidation pathway of SY by using theoretical calculations and spectro-electrochemical analyses [59]; our previous studies were also based on using GCE/ERGO-modified electrodes [55]. Hence, the electrochemical oxidation mechanism of SY onto GCE/ERGO-NiNPs was proposed thorough two consecutive electro-transfer processes separated by a chemical deprotonation (denoted as an E1CE2 mechanism) (Scheme 1). Normally, it is expected that the oxidation potential of a second electron be higher than the first one. However, in this case, only one peak could be observed by CV measurement. In fact, the second electron transfer process comes from proton release from –OH group that could does not increase the oxidation potential with respect to the first electron transfer.

3.3. Optimisation of DPV Parameters for SY Detection

The DPV parameters were systematically examined in 0.5 uM SY in acetate buffer (pH = 4) for an accumulation time of 2 min at 0 V/ECS. The result demonstrates that DPV responses could be obtained with the following optimized parameters: a scan rate v of 20 mV s−1, step potential of 6 mV, step width of 300 ms, pulse amplitude of 30 mV, pulse width of 120 ms and integration time of 60 ms (see Electronic Supporting Information Figures S5–S7). Since the electrochemical process implies the adsorption of SY onto the GCE/ERGO-NiNP surface, it is interesting to consider the effect of accumulation time on potential accumulation. The SY signals were significantly increased in the first two minutes, and slightly improved for further accumulation times (see Electronic Supporting Information Figure S8). This result indicates that GCE/ERGO-NiNPs display a high adsorption capacity. Considering sensitivity and measuring duration, a 2 min accumulation time is acceptable as it leads to a good SY response. The influence of the accumulation potential value is also examined. The result shows that the SY DPV response is almost independent of accumulation potential. Thus, an accumulation potential of 0V/ECS is used for further measurements.

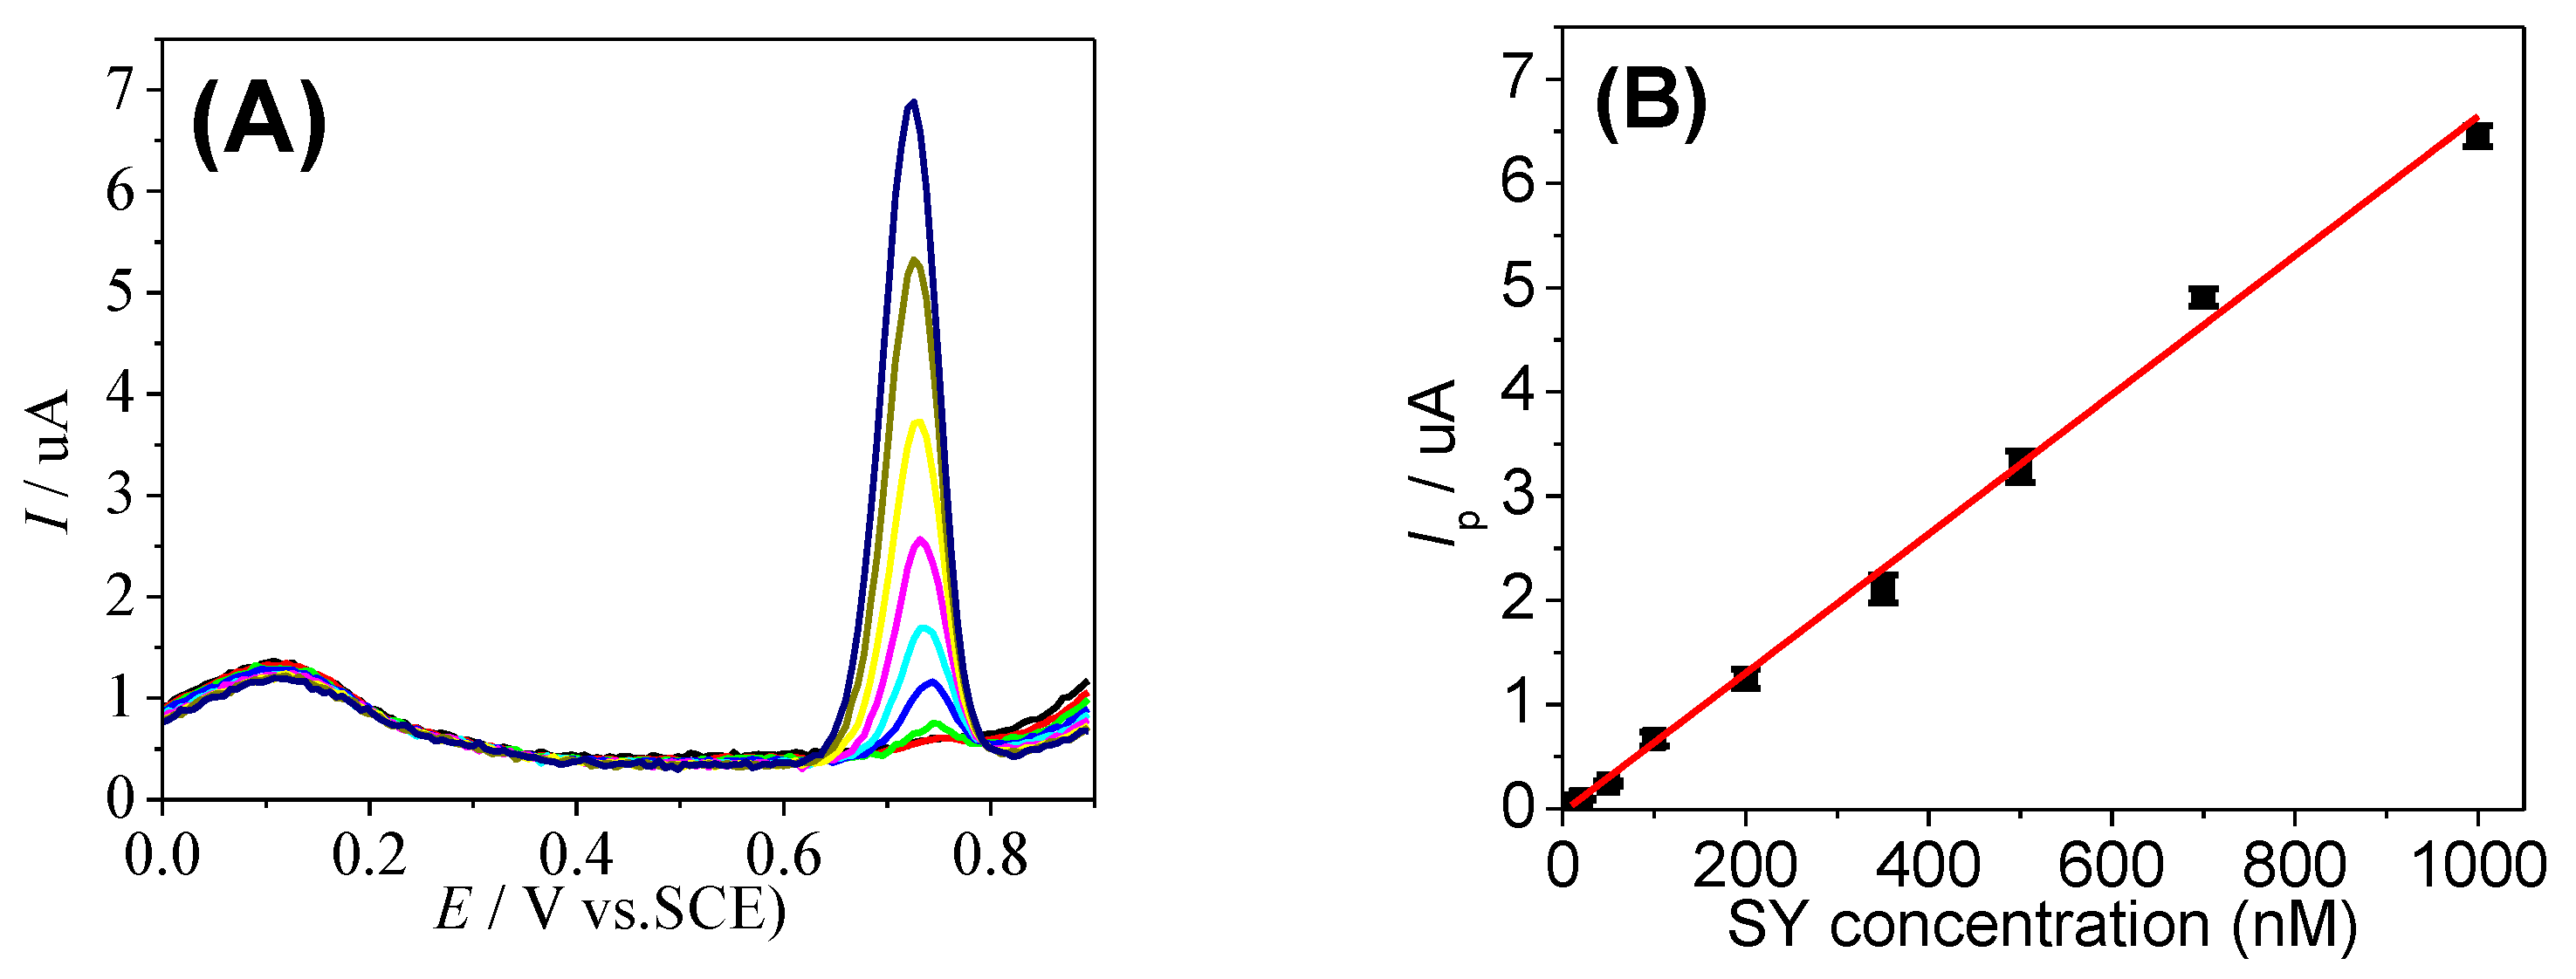
3.4. SY Detection Using GCE/ERGO-NiNPs Electrode

DPV measurements using GCE/ERGO-NiNPs electrodes were carried out at different SY concentrations from 10–1000 nM (Figure 7A). The plot of SY response versus concentration represents a linear variation following the equation Ip (uA) = (0.0066 ± 0.0001) × C (nM)–(0.031 ± 0.014) (R2 = 0.996) (Figure 7B). The limit of detection (LOD) was calculated to be 3.7 nM from linear regression in a limited range from 20–200 nM following Equation (9) [60].
LOD = 3 × Sy/b
where Sy represents the standard deviation of the response, and b is the slope of the calibration curve for a limited range from 10–200 nM.
The performance of this sensor is compared with some of the recent reported electrodes for SY quantification (see Table 1). It suggests that the GCE/ERGO-NiNP sensor exhibits good performance with a low LOD and a high sensitivity of 7 µA/µM with respect to other modified electrodes such as GCE/ERGO-AuNPs (1.5 µA/µM), GCE/ZnO-cysteic acid (2.4 µA/µM), and GCE/GO-MWCNT (0.63 µA/µM).

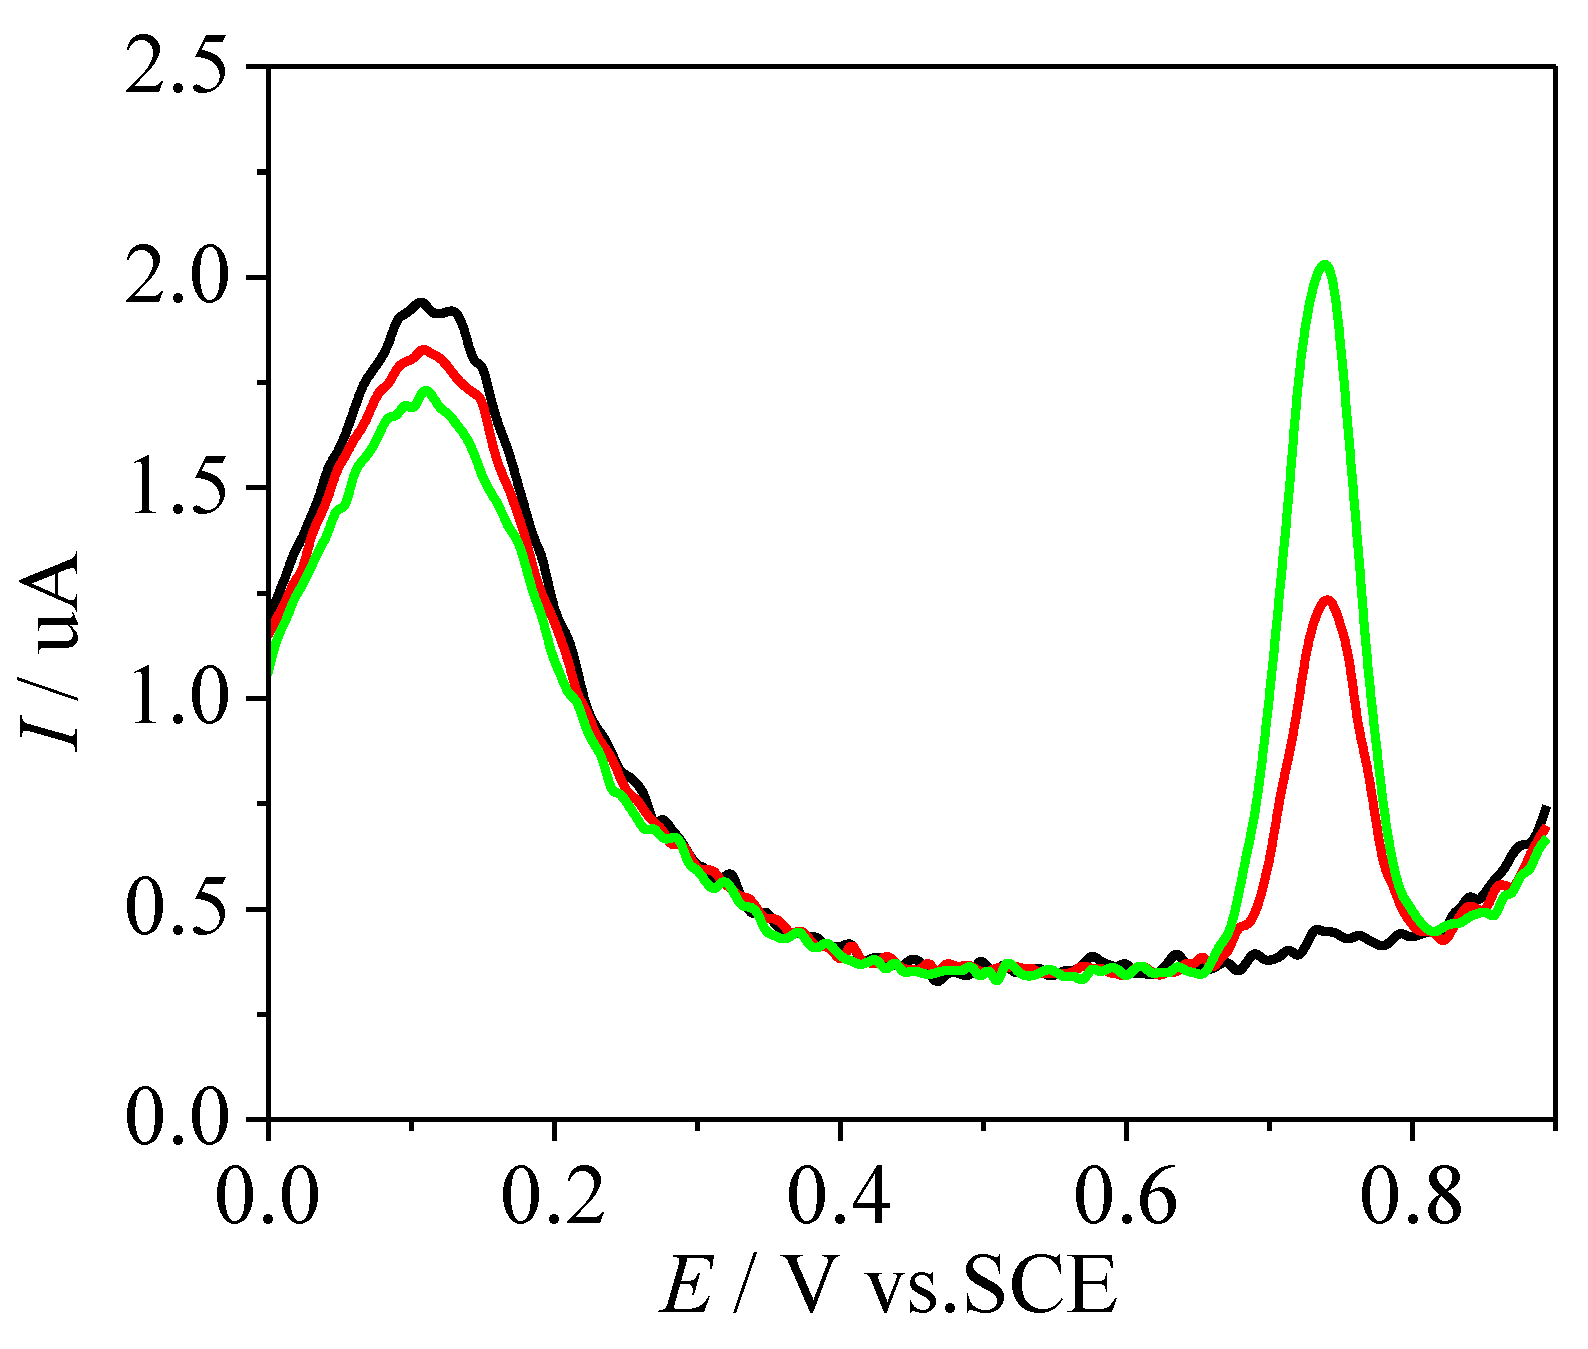
3.5. Stability and Anti-Interference Ability

The reliability of the GCE/ERGO-NiNPs is evaluated from repetitive DPV measurements (n = 10) in acetate buffer pH 4 + 0.5 µM SY (see Electronic Supporting Information Figure S9A). The Relative Standard Deviation (RSD) value, calculated at 1.08%, indicates the excellent repeatability of the modified electrodes. This electrochemical sensor was maintained in pH 4 buffer for stability measurements. The DPV measurements show almost no change in the SY response after 24 h. The signal current was decreased at 70% after 48 h (see Electronic Supporting Information Figure S9B). The result shows that modified electrodes exhibit acceptable stability within 2 days. Nevertheless, this sensor could be efficiently reused after the cleaning process by a simple cycling potential in 0.5 M H2SO4 (five cycles) solution. The response of the sensor exhibits no significant change below 5% after five repetitive detection/cleaning cycles, suggesting high reusability (see Electronic Supporting Information Figure S9C). Selectivity is also an important characteristic for a sensor; the anti-interference ability of the electrochemical sensor has been evaluated for 0.5 µM SY acetate buffer with the addition of some potential conventional additives in soft drinks. The result demonstrates that 100-fold concentrations of glucose, sodium citrate and acid ascorbic, KCl, NaCl, CaCl2, do not result in a significant change to SY response (below 5%), indicating a good selectivity of this sensor toward these interferents (see Electronic Supporting Information Figure S9D).

3.6. Practical Application

The analytical applicability of the GCE/ERGO-NiNP sensor is examined for SY determination in drink samples collected from a local market. A small volume of each drink (7 µL of Mirinda, 35 uL of Samurai, 70 µL of Number 1 and 35 µL of Sting) was spiked in acetate buffer at pH 4 (7 mL). DPV measurements were typically displayed for determining the SY concentration in the Mirinda sample (Figure 8). In fact, the DPV of diluted samples in buffer using GCE/ERGO-Ni exhibited a characteristic peak at 0.74 V/SCE of SY compound. After adding SY standard solution, the identified peak current is considerably increased, indicating the detection of SY in the sample. The accuracy of this assay is evaluated by the standard addition method. All analytical results were presented in Table 2. The obtained recovery values, varying between 91.8 ÷ 108.3%, are satisfactory. Each sample is determined three times, leading to RSD values lower than 6.48%, indicating the good precision of the method. Finally, SY concentrations in the same soft drinks were also controlled comparatively, using HPLC measurements as described elsewhere [55]. The results obtained were compared between HPLC and those from our sensors, and were in extremely good agreement with a very small deviation, below 6.4%, indicating that GCE/ERGO-NiNP-modified surfaces represent a very promising platform with low costs, simple preparation and good accuracy for sensing applications.

4. Conclusions

A novel and highly sensitive sensor based on ERGO/NiNP nanocomposite material-modified electrodes was developed for SY determination. The method, using cyclic voltammetry techniques, is a particularly robust process. Starting from low-cost graphene oxide and nickel salt materials, a repetitive cyclic potential scan rapidly leads to the deposition of ERGO/NiNP nanocomposites onto the GCE surface, ready to use for sensing applications. The FE-SEM images confirm a homogeneous deposition of nickel and ERGO nanostructured materials, in which nickel nanoparticles present a very uniform distribution with an average size of 20–30 nm into the ERGO matrix. The ERGO-NiNP-modified surfaces exhibit remarkably high performance for SY detection with a low detection limit of 3.7 nM and high sensitivity of 7 µA/µM, which matched the HPLC probed value with low relative error. The prepared GCE/ERGO-NiNP sensor could be cleaned and reused for multi-measurements even in real samples. This work demonstrated that electrochemical techniques present an efficient route for the fabrication of graphene/metal nanocomposite materials. This ERGO-NiNP nanocomposite presents great potential for developing reliable and portable sensors for on-site monitoring of toxics in food and the environment.

Supplementary Materials

The following supporting information can be downloaded at: https://www.mdpi.com/article/10.3390/app12052614/s1, Figure S1. First and second CVs (scan rate = 50 mV s−1) of GCE in 0.1 M LiClO4 containing 1 mg ml−1 GO + 0.5 mM NiCl2. Figure S2. EDX of ERGO-NiNPs deposited onto ITO substrate using 10 CV scans between +0.6 ÷ −1.5V/SCE in 0.1 M LiClO4 electrolyte solution containing 1 (mg mL−1) GO + 0.5 mM NiCl2. Figure S3. XRD pattern of ERGO-NiNPs deposited onto ITO substrate using 10 CV scans between +0.6 ÷ −1.5V/SCE in 0.1 M LiClO4 electrolyte solution containing 1 (mg mL−1) GO + 0.5 mM NiCl2. Figure S4. Cyclic voltammograms of GCE, GCE/ERGO and GCE/ERGO-NiNPs in 0.1 mM KCl + 1 mM K3Fe(CN)6/K4Fe(CN)6 with the scan rate varying from 20 to 400 mV s−1 namely, 20 (black), 50 (red), 100 (green), 200 (blue), 300 (cyan), 400 (magenta) mV s−1. And (B) Variation of the peak currents towards square root of the scan rate. Figure S5. DPV of GCE/ERGO-NiNPs surface in acetate buffer pH 4 + 0.5 µM SY at different scan rates from v = 10–35 mV.s−1 (Es varying from 5 to 17.5 mV; ts = 500 ms; Ep = 50 mV; tp = 200 ms, Idt = 100 ms). Accumulation time of 2 minutes at 0 V/SCE. Figure S6. DPV of GCE/ERGO-NiNPs surface in acetate buffer pH 4 + 0.5 µM SY at scan rate v = 20 mV s−1 with different step potentials from Es = 4–12 mV, ts/tp/Ep/Idt = 10/4/1/2. Accumulation time of 2 minutes at 0 V/ECS. Figure S7. DPV of GCE/ERGO-NiNPs surface in acetate buffer pH 4 + 0.5 µM SY at scan rate v = 20 mV s−1, Es = 6 mV, ts = 300 ms, and tp = 120 ms, accumulation time of 2 minutes at 0 V/ECS: (A) Ep = 30 mV at different Idt = 20–100 ms. (B) Idt = 60 ms at different Ep = 5–35 mV. Figure S8. DPV responses of GCE/ERGO-NiNPs modified electrode in acetate buffer pH 4 + 0.5 uM SY using optimsed DPV parameters with scan rate v = 20 mV s−1, Es = 6 mV, ts = 300 ms, Ep = 30 mV, tp = 120 ms and Idt = 60 ms: (A) variation of accumulation time at a potential accumulation of 0 V/SCE (B) variation of potential accumulation with accumulation time of 2 minutes. Error bar represents the standard deviation for three successive measurements. Figure S9. DPV response of the GCE/ERGO-NiNPs sensor in acetate buffer pH 4 + 0.5 uM SY under optimized conditions: v = 20 mV s−1, Es = 6 mV, ts = 300 ms, Ep = 30 mV; tp = 120 ms and Idt = 60 ms, accumulation time of 2 minutes at 0 V/ECS. (A) Repetitive measuring (B) storage stability in buffer solution (C) repetitive measuring/cleaning cycles (D) with the presence of 100-folds concentration KCl, NaCl, acid ascobic (AA), glucose (Glu) and sodium citrate (SC).

Author Contributions

Conceptualization, Q.-T.N. and Q.-T.T.; methodology, Q.-T.T.; software, T.-G.L.; validation, T.-G.L. and Q.-T.T.; formal analysis, Q.-T.N.; investigation, T.-G.L. and P.B.; resources, Q.-T.N.; data curation, Q.-T.N.; writing—original draft preparation, Q.-T.N.; writing—review and editing, Q.-T.T. and P.B.; visualization, T.-G.L.; supervision, Q.-T.T.; project administration, T.-G.L.; funding acquisition, T.-G.L. All authors have read and agreed to the published version of the manuscript.

Funding

This research was funded by Vietnam National Foundation for Science and Technology Development (NAFOSTED) under grant number 104.06–2017.45 for funding support.

Institutional Review Board Statement

Not applicable.

Informed Consent Statement

Not applicable.

Acknowledgments

The authors would like to thank Corinne Lagrost for critical reading of the article.

Conflicts of Interest

The authors declare that they have no conflict of interest.

References

  1. Feng, J.; Cerniglia, C.E.; Chen, H. Toxicological significance of azo dye metabolism by human intestinal microbiota. Front. Biosci. 2018, 4, 568–586. [Google Scholar]
  2. Dwivedi, K.; Kumar, G. Genetic Damage Induced by a Food Coloring Dye (Sunset Yellow) on Meristematic Cells of Brassica campestris L. J. Environ. Public Health 2015, 2015, 319727. [Google Scholar] [CrossRef] [PubMed] [Green Version]
  3. Gomes, K.M.S.; de Oliveira, M.V.G.A.; Carvalho, F.R.; Menezes, C.C.; Peron, A.P. Citotoxicity of food dyes Sunset Yellow (E-110), Bordeaux Red (E-123), and Tatrazine Yellow (E-102) on Allium cepa L. root meristematic cells. Food Sci. Technol. 2013, 33, 218–223. [Google Scholar] [CrossRef] [Green Version]
  4. Llamas, N.E.; Garrido, M.; di Nezio, M.S.; Band, B.S.F. Second order advantage in the determination of amaranth, sunset yellow FCF and tartrazine by UV-vis and multivariate curve resolution-alternating least squares. Anal. Chim. Acta 2009, 655, 38–42. [Google Scholar] [CrossRef] [PubMed]
  5. Zeynali, K.A.; Manafi-Khoshmanesh, S. Simultaneous spectrophotometric determination of sunset yellow and quinoline yellow in a single step. J. Chin. Chem. Soc. 2015, 62, 772–779. [Google Scholar] [CrossRef]
  6. Yuan, Y.; Zhao, X.; Qiao, M.; Zhu, J.; Liu, S.; Yang, J.; Hu, X. Determination of sunset yellow in soft drinks based on fluorescence quenching of carbon dot. Spectrochim. Acta A 2016, 167, 106–110. [Google Scholar] [CrossRef]
  7. Zhu, Y.; Zhang, L.; Yang, L. Designing of the functional paper-based surface-enhanced raman spectroscopy substrates for colorants detection. Mater. Res. Bull. 2015, 63, 199–204. [Google Scholar] [CrossRef]
  8. Alp, H.; Bas, D.; Yas, A.; Yaylı, N.; Ocak, M. Simultaneous Determination of Sunset Yellow FCF, Allura Red AC, Quinoline Yellow WS, and Tartrazine in Food Samples by RP-HPLC. J. Chem. 2018, 2018, 6486250. [Google Scholar] [CrossRef]
  9. Zou, T.; He, P.; Yasen, A.; Li, Z. Determination of seven synthetic dyes in animal feeds and meat by high performance liquid chromatography with diode array and tandem mass detectors. Food Chem. 2013, 138, 1742–1748. [Google Scholar] [CrossRef]
  10. Huang, X.; Yin, Z.; Wu, S.; Qi, X.; He, Q.; Zhang, Q.; Yan, Q.; Boey, F.; Zhang, H. Graphene-based materials: Synthesis, characterization, properties, and applications. Small 2011, 7, 1876–1902. [Google Scholar] [CrossRef]
  11. Yang, J.; Hu, P.; Yu, G. Perspective of graphene-based electronic devices: Graphene synthesis and diverse applications. APL Mater. 2019, 7, 020901. [Google Scholar] [CrossRef] [Green Version]
  12. Lemine, A.S.; Zagho, M.M.; Altahtamouni, T.M.; Bensalah, N. Graphene a promising electrode material for supercapacitors—A review. Int. J. Energy Res. 2018, 42, 4284–4300. [Google Scholar] [CrossRef]
  13. Perreault, F.; de Faria, A.F.; Elimelech, M. Environmental applications of graphene-based nanomaterials. Chem. Soc. Rev. 2015, 44, 5861–5896. [Google Scholar] [CrossRef] [PubMed]
  14. Shao, Y.; Wang, J.; Wu, H.; Liu, J.; Aksay, I.A.; Lin, Y. Graphene based electrochemical sensors and biosensors: A review. Electroanalysis 2010, 22, 1027–1036. [Google Scholar] [CrossRef]
  15. Rowley-Neale, S.J.; Randviir, E.P.; Dena, A.S.A.; Banks, C.E. An overview of recent applications of reduced graphene oxide as a basis of electroanalytical sensing platforms. Appl. Mater. Today 2018, 10, 218–226. [Google Scholar] [CrossRef]
  16. Cinti, S.; Arduini, F. Graphene-based screen-printed electrochemical (bio)sensors and their applications: Efforts and criticisms. Biosens. Bioelectron. 2017, 89, 107–122. [Google Scholar] [CrossRef]
  17. Chen, L.; Tang, Y.; Wang, K.; Liu, C.; Luo, S. Direct electrodeposition of reduced graphene oxide on glassy carbon electrode and its electrochemical application. Electrochem. Commun. 2011, 13, 133–137. [Google Scholar] [CrossRef]
  18. Kung, C.; Lin, P.; Xue, Y.; Akolkar, R.; Dai, L.; Yu, X. Three dimensional graphene foam supported platinum e ruthenium bimetallic nanocatalysts for direct methanol and direct ethanol fuel cell applications. J. Power Sources 2014, 256, 329–335. [Google Scholar] [CrossRef]
  19. Wang, Z.; Shi, G.; Zhang, F.; Xia, J.; Gui, R.; Yang, M.; Bi, S.; Xia, L.; Li, Y.; Xia, L.; et al. Electrochimica Acta Amphoteric surfactant promoted three-dimensional assembly of graphene micro / nanoclusters to accomodate Pt nanoparticles for methanol oxidation. Electrochim. Acta 2015, 160, 288–295. [Google Scholar] [CrossRef]
  20. Vadukumpully, S.; Paul, J.; Valiyaveettil, S. Cationic surfactant mediated exfoliation of graphite into graphene flakes. Carbon 2009, 47, 3288–3294. [Google Scholar] [CrossRef]
  21. Yu, L.; Shi, M.; Yue, X.; Qu, L. A novel and sensitive hexadecyltrimethyl ammonium bromide functionalized graphene supported platinum nanoparticles composite modified glassy carbon electrode for determination of sunset yellow in soft drinks. Sens. Actuators B Chem. 2015, 209, 1–8. [Google Scholar] [CrossRef]
  22. Wang, M.; Zhao, J. Facile synthesis of Au supported on ionic liquid functionalized reduced graphene oxide for simultaneous determination of Sunset yellow and Tartrazine in drinks. Sens. Actuators B Chem. 2015, 216, 578–585. [Google Scholar] [CrossRef]
  23. Zhao, L.; Zhao, F.; Zeng, B. Preparation and application of sunset yellow imprinted ionic liquid polymer—Ionic liquid functionalized graphene composite film coated glassy carbon electrodes. Electrochim. Acta 2014, 115, 247–254. [Google Scholar] [CrossRef]
  24. Jia, L.; Wang, H. Chemical Preparation and application of a highly sensitive nonenzymatic ethanol sensor based on nickel nanoparticles/Nafion/graphene composite film. Sens. Actuators B Chem. 2013, 177, 1035–1042. [Google Scholar] [CrossRef]
  25. Krishnan, S.K.; Singh, E. A review on graphene-based nanocomposites for electrochemical and fluorescent biosensors. RSC Adv. 2019, 9, 8778–8881. [Google Scholar] [CrossRef]
  26. Thangamuthu, M.; Hsieh, K.Y.; Kumar, P.V. Graphene—And Graphene Oxide-Based Nanocomposite Platforms for Electrochemical Biosensing Applications. Int. J. Mol. Sci. 2019, 20, 2975. [Google Scholar] [CrossRef] [PubMed] [Green Version]
  27. Wang, J.; Yang, B.; Wang, H.; Yang, P.; Du, Y. Highly sensitive electrochemical determination of Sunset Yellow based on gold nanoparticles/graphene electrode. Anal. Chim. Acta 2015, 893, 41–48. [Google Scholar] [CrossRef] [PubMed]
  28. Liu, C.; Wang, K.; Luo, S.; Tang, Y.; Chen, L. Direct electrodeposition of graphene enabling the one-step synthesis of graphene-metal nanocomposite films. Small 2011, 7, 1203–1206. [Google Scholar] [CrossRef]
  29. Lee, C.; Yu, S.H.; Kim, T.H. One-Step Electrochemical Fabrication of Reduced Graphene Oxide/Gold Nanoparticles Nanocomposite-Modified Electrode for Simultaneous Detection of Dopamine, Ascorbic Acid, and Uric Acid. Nanomaterials 2018, 8, 17. [Google Scholar] [CrossRef] [Green Version]
  30. Wang, J.; Yang, B.; Zhang, K.; Bin, D.; Shiraishi, Y.; Yang, P.; Du, Y. Highly sensitive electrochemical determination of Sunset Yellow based on the ultrafine Au-Pd and reduced graphene oxide nanocomposites. J. Colloid Interface Sci. 2016, 481, 229–235. [Google Scholar] [CrossRef]
  31. Dey, R.S.; Raj, C.R. Development of an Amperometric Cholesterol Biosensor Based on Graphene—Pt Nanoparticle Hybrid Material. J. Phys. Chem. C 2010, 114, 21427–21433. [Google Scholar] [CrossRef]
  32. Palanisamy, S.; Karuppiah, C.; Chen, S.M. Direct electrochemistry and electrocatalysis of glucose oxidase immobilized on reduced graphene oxide and silver nanoparticles nanocomposite modified electrode. Colloids Surf. Biointerfaces 2014, 114, 164–169. [Google Scholar] [CrossRef]
  33. He, Q.; Liu, J.; Liu, X.; Li, G.; Deng, P.; Liang, J. Preparation of Cu2O-reduced graphene nanocomposite modified electrodes towards ultrasensitive dopamine detection. Sensors 2018, 18, 199. [Google Scholar] [CrossRef] [PubMed] [Green Version]
  34. He, Q.; Liu, J.; Liu, X.; Xia, Y.; Li, G.; Deng, P. Novel Electrochemical Sensors Based on Cuprous Oxide-Electrochemically Reduced Graphene Oxide Nanocomposites Modified Electrode toward Sensitive. Molecules 2018, 23, 2130. [Google Scholar] [CrossRef] [PubMed] [Green Version]
  35. Hsu, Y.W.; Hsu, T.K.; Sun, C.L.; Nien, Y.T.; Pu, N.W.; Ger, M.D. Synthesis of CuO/graphene nanocomposites for nonenzymatic electrochemical glucose biosensor applications. Electrochim. Acta 2012, 82, 152–157. [Google Scholar] [CrossRef]
  36. Song, J.; Xu, L.; Zhou, C.; Xing, R.; Dai, Q.; Liu, D.; Song, H. Synthesis of Graphene Oxide Based CuO Nanoparticles Composite Electrode for Highly Enhanced Nonenzymatic Glucose Detection. ACS Appl. Mater. Interfaces 2013, 5, 12928–12934. [Google Scholar] [CrossRef]
  37. Yang, S.; Liu, L.; Wang, G.; Li, G.; Deng, D.; Qu, L. One-pot synthesis of Mn3O4 nanoparticles decorated with nitrogen-doped reduced graphene oxide for sensitive nonenzymatic glucose sensing. J. Electroanal. Chem. 2015, 755, 15–21. [Google Scholar] [CrossRef]
  38. Pakapongpan, S.; Poo-Arporn, R.P. Self-assembly of glucose oxidase on reduced graphene oxide-magnetic nanoparticles nanocomposite-based direct electrochemistry for reagentless glucose biosensor. Mater. Sci. Eng. C 2017, 76, 398–405. [Google Scholar] [CrossRef]
  39. Gan, T.; Sun, J.; Meng, W.; Song, L.; Zhang, Y. Electrochemical sensor based on graphene and mesoporous TiO2 for the simultaneous determination of trace colourants in food. Food Chem. 2013, 141, 3731–3737. [Google Scholar] [CrossRef]
  40. He, Q.; Liu, J.; Liu, X.; Xia, Y.; Li, G.; Deng, P.; Liang, J.; Chen, D. Sensitive and Selective Detection of Tartrazine Based on TiO2-Electrochemically Reduced Graphene Oxide Composite-Modified Electrodes. Sensor 2018, 18, 1911. [Google Scholar] [CrossRef] [Green Version]
  41. Radhakrishnan, S.; Kim, S.J. An enzymatic biosensor for hydrogen peroxide based on one-pot preparation of CeO2-reduced graphene oxide nanocomposite. RSC Adv. 2015, 5, 12937–12943. [Google Scholar] [CrossRef]
  42. Dey, R.S.; Raj, C.R. A hybrid functional nanoscaffold based on reduced graphene oxide–ZnO for the development of an amperometric biosensing platform. RSC Adv. 2013, 3, 25858–25864. [Google Scholar] [CrossRef]
  43. Vilian, A.E.; Chen, S.M.; Ali, M.A.; Al-Hemaid, F.M. Direct electrochemistry of glucose oxidase immobilized on ZrO2 nanoparticles-decorated reduced graphene oxide sheets for a glucose biosensor. RSC Adv. 2014, 4, 30358–30367. [Google Scholar] [CrossRef]
  44. Zhou, Y.; Chen, J.; Wang, F.; Sheng, Z.; Xia, X. A facile approach to the synthesis of highly electroactive Pt nanoparticles on graphene as an anode catalyst for direct methanol fuel cells. Chem. Commun. 2010, 46, 5951–5953. [Google Scholar] [CrossRef] [Green Version]
  45. Zhu, C.; Guo, S.; Fang, Y.; Han, L.; Wang, E.; Dong, S. One-Step Electrochemical Approach to the Synthesis of Graphene/MnO2 Nanowall Hybrids. Nano Res. 2011, 4, 648–657. [Google Scholar] [CrossRef]
  46. Zhang, H.; Zhang, X.; Zhang, D.; Sun, X.; Lin, H.; Wang, C. One-Step Electrophoretic Deposition of Reduced Graphene Oxide and Ni(OH)2 Composite Films for Controlled Syntheses Supercapacitor Electrodes. J. Phys. Chem. B 2013, 117, 1616–1627. [Google Scholar] [CrossRef] [PubMed]
  47. Hu, X.; Pan, D.; Lin, M.; Han, H.; Li, F. One-Step Electrochemical Deposition of Reduced Graphene Oxide-Bismuth Nanocomposites for Determination of Lead. ECS Electrochem. Lett. 2015, 4, 43–45. [Google Scholar] [CrossRef] [Green Version]
  48. Moozarm, P.; Meng, P.; Alias, Y. Facile one-step electrochemical deposition of copper nanoparticles and reduced graphene oxide as nonenzymatic hydrogen peroxide sensor. Appl. Surf. Sci. 2017, 413, 56–65. [Google Scholar] [CrossRef]
  49. Henni, A.; Harfouche, N.; Karar, A.; Zerrouki, D.; Perrin, F.X.; Rosei, F. Synthesis of graphene–ZnO nanocomposites by a one-step electrochemical deposition for efficient photocatalytic degradation of organic pollutant. Solid State Sci. 2019, 98, 106039. [Google Scholar] [CrossRef]
  50. Zhang, Y.; Xu, F.; Sun, Y.; Shi, Y.; Li, Z. Assembly of Ni(OH)2 nanoplates on reduced graphene oxide: A two dimensional nanocomposite for enzyme-free glucose sensing. J. Mater. Chem. 2011, 21, 16949–16954. [Google Scholar] [CrossRef]
  51. Zhang, Y.; Xiao, X.; Sun, Y.; Shi, Y.; Dai, H.; Ni, P.; Hu, J.; Li, Z.; Song, Y.; Wang, L. Electrochemical deposition of nickel nanoparticles on reduced graphene oxide film for nonenzymatic glucose sensing. Electroanalysis 2013, 25, 959–966. [Google Scholar] [CrossRef]
  52. Yuan, B.; Xu, C.; Deng, D.; Xing, Y.; Liu, L.; Pang, H.; Zhang, D. Graphene oxide/nickel oxide modified glassy carbon electrode for supercapacitor and nonenzymatic glucose sensor. Electrochim. Acta 2013, 88, 708–712. [Google Scholar] [CrossRef]
  53. Li, S.J.; Xia, N.; Lv, X.L.; Zhao, M.M.; Yuan, B.Q.; Pang, H. A facile one-step electrochemical synthesis of graphene/NiO nanocomposites as efficient electrocatalyst for glucose and methanol. Sens. Actuators B Chem. 2014, 190, 809–817. [Google Scholar] [CrossRef]
  54. Xue, Z.; Yin, B.; Li, M.; Rao, H.; Wang, H.; Zhou, X.; Liu, X.; Lu, X. Direct electrodeposition of well dispersed electrochemical reduction graphene oxide assembled with nickel oxide nanocomposite and its improved electrocatalytic activity toward 2,4,6-Trinitrophenol. Electrochim. Acta 2016, 192, 512–520. [Google Scholar] [CrossRef]
  55. Tran, Q.T.; Phung, T.T.; Nguyen, Q.T.; Le, T.G.; Lagrost, C. Highly sensitive and rapid determination of sunset yellow in drinks using a low-cost carbon material-based electrochemical sensor. Anal. Bioanal. Chem. 2019, 411, 7539–7549. [Google Scholar] [CrossRef]
  56. Tao, S.; Yang, F.; Schuch, J.; Jaegermann, W.; Kaiser, B. Electrodeposition of Nickel Nanoparticles for the Alkaline Hydrogen Evolution Reaction: Correlating Electrocatalytic Behavior and Chemical Composition. ChemSusChem 2018, 11, 948–958. [Google Scholar] [CrossRef]
  57. Bard, A.J.; Faulkner, L.R. Electrochemical Methods, 2nd ed.; John Wiley & Sons: Hoboken, NJ, USA, 2001. [Google Scholar]
  58. Wang, M.; Sun, Q.; Gao, Y.; Yang, X.; Zhao, J. Determination of Sunset yellow in foods based on a facile electrochemical sensor. Anal. Methods 2014, 6, 8760–8766. [Google Scholar] [CrossRef]
  59. Sierra-Rosales, P.; Berríos, C.; Squella, J.A. Experimental and theoretical insights into the electrooxidation pathway of azo-colorants on glassy carbon electrode. Electrochim. Acta 2018, 290, 556–567. [Google Scholar] [CrossRef]
  60. Shrivastava, A.; Gupta, V.B. Methods for the determination of limit of detection and limit of quantitation of the analytical methods. Chronides Young Sci. 2011, 2, 21–25. [Google Scholar] [CrossRef]
  61. Dorraji, P.S.; Jalali, F. Electrochemical fabrication of a novel ZnO/cysteic acid nanocomposite modified electrode and its application to simultaneous determination of sunset yellow and tartrazine. Food Chem. 2017, 227, 73–77. [Google Scholar] [CrossRef]
  62. Qiu, X.; Lu, L.; Leng, J.; Yu, Y.; Wang, W.; Jiang, M.; Bai, L. An enhanced electrochemical platform based on graphene oxide and multi-walled carbon nanotubes nanocomposite for sensitive determination of Sunset Yellow and Tartrazine. Food Chem. 2016, 190, 889–895. [Google Scholar] [CrossRef] [PubMed]
  63. Tang, Y.; Wang, Y.; Liu, G.; Sun, D. Determination of sunset yellow and tartrazine using silver and poly (L-cysteine) composite film modified glassy carbon electrode. Indian J. Chem. 2016, 55, 298–303. [Google Scholar]
  64. Gan, T.; Sun, J.; Wu, Q.; Jing, Q.; Yu, S. Graphene decorated with nickel nanoparticles as a sensitive substrate for simultaneous determination of sunset yellow and tartrazine in food samples. Electroanalysis 2013, 25, 1505–1512. [Google Scholar] [CrossRef]
Figure 1. Ten repetitive CVs at the scan rate v = 50 mV s−1 at GCE electrode in 0.1 M LiClO4 electrolyte solution containing (A) GO and (B) GO + 0.5 mM NiCl2.
Applsci 12 02614 g001
Figure 2. FE-SEM images of nanomaterials electrodeposited onto ITO surface using 10 successive CV scans: (A) ERGO film; (B,C) ERGO-NiNP film at different magnifications.
Applsci 12 02614 g002
Figure 3. CVs at the scan rate at 50 mV s−1) of GCE/ERGO and GCE/ERGO-NiNP-modified electrodes in 1 mM K3Fe(CN)6/K4Fe(CN)6. + 0.1 M KCl solution.
Applsci 12 02614 g003
Figure 4. (A) CVs at the scan rate v = 50 mV s−1 in acetate buffer pH 4 + 10 µM SY and (B) DPVs in pH 4 + 500 nM SY. DPVs parameters: accumulation time of 30 s, potential accumulation of 0 V/SCE, step potential of 6 mV, step width of 300 ms, pulse amplitude of 30 mV, pulse width of 120 ms, integration time of 60 ms. GCE (black), GCE/ERGO (red) and GCE/ERGO-NiNPs (blue).
Applsci 12 02614 g004
Figure 5. (A) CVs at the scan rate v = 50 mV s−1 at GCE/ERGO-NiNP surface of 10 µM SY in buffer solution with different pH values: pH = 3 (black), pH = 4 (red), pH = 5 (green), pH = 6 (blue), pH = 7 (cyan), pH = 8 (magenta). (B) Linear variation of anodic peak potential toward the pH value.
Applsci 12 02614 g005
Figure 6. (A) CVs on GCE/ERGO-NiNP surface of SY 10 µM in pH 4 acetate buffer at various scan rates v in the range of 0.02–1.0 V s−1, (B) Variation of the anodic and cathodic peak currents as a function of the scan rate, (C) Variation of the anodic and cathodic potentials as a function of logarithm of the scan rate ln(v/V s−1).
Applsci 12 02614 g006
Scheme 1. Proposed mechanism for electrochemical oxidation of SY onto GCE/ERGO-NiNPs following an E1CE2 mechanism.
Applsci 12 02614 sch001
Figure 7. (A) DPV responses of GCE/ERGO-NiNP-modified electrode in acetate buffer pH 4 with varying SY concentrations from 10–1000 nM, namely 10, 20, 50, 100, 200, 350, 500, 700 and 1000 nM. (B) Plots of SY response versus SY concentration. Optimised DPV conditions: accumulation times of 2 min at 0 V/ECS, scan rate v = 20 mV s–1, Es = 6 mV, ts = 300 ms, Ep = 30 mV, tp = 120 ms and Idt = 60 ms.
Applsci 12 02614 g007
Figure 8. Typical DPV responses of the GCE/ERGO-NiNPs for SY detection in Mirinda: acetate buffer pH 4 (black), addition of 7 uL Mirinda sample (red), addition of 100 nM SY (green).
Applsci 12 02614 g008
Table 1. Performance of different modified electrodes for SY determination.
ElectrodeLinear Range (nM)LOD (nM)Reference
GCE/ZnO-cysteic acid100–300030[61]
GCE/GO-MWCNT90–800025[62]
GCE/poly(L-cysteine)-Ag100–10.00050[63]
GCE/ERGO-AuNPs2–110.0002[27]
GCE/GN-Ni7.4–4422.2[64]
GCE/GN-CTAB-Pt80–10.0004.2[21]
GCE/rGO/Au-Pd686–331.0001.5[30]
GCE/ERGO-NiNPs10–1.0003.7This work
GCE: glassy carbon electrode, GN: graphene, MWCNT: multi-wall carbon nanotube, ERGO: electrochemically reduced graphene oxide, GO: graphene oxide, rGO: reduced graphene oxide, CTAB: cetyltrimethylammonium bromide.
Table 2. SY detection in soft drink samples using the electrochemical sensor and HPLC methods.
SampleAdded (nM)Expected (nM)Found (nM)RSD (%) (n = 3)Recovery (%)By HPLC (nM)Relative Error (%)
Mirinda 127.82.50 127.60.2
100227.6235.43.85103.3
Samurai 120.54.45 128.8−6.4
100228.8229.34.03100.2
Number 1 111.25.84 109.401.6
100211.2228.96.48108.4
Sting 86.43.93 90.00−6.1
100186.4171.14.1091.8
Publisher’s Note: MDPI stays neutral with regard to jurisdictional claims in published maps and institutional affiliations.

