
Smartphone Sensor-Based Human Locomotion Surveillance System Using Multilayer Perceptron

 ,
,
Abstract
:Featured Application
Abstract
1. Introduction
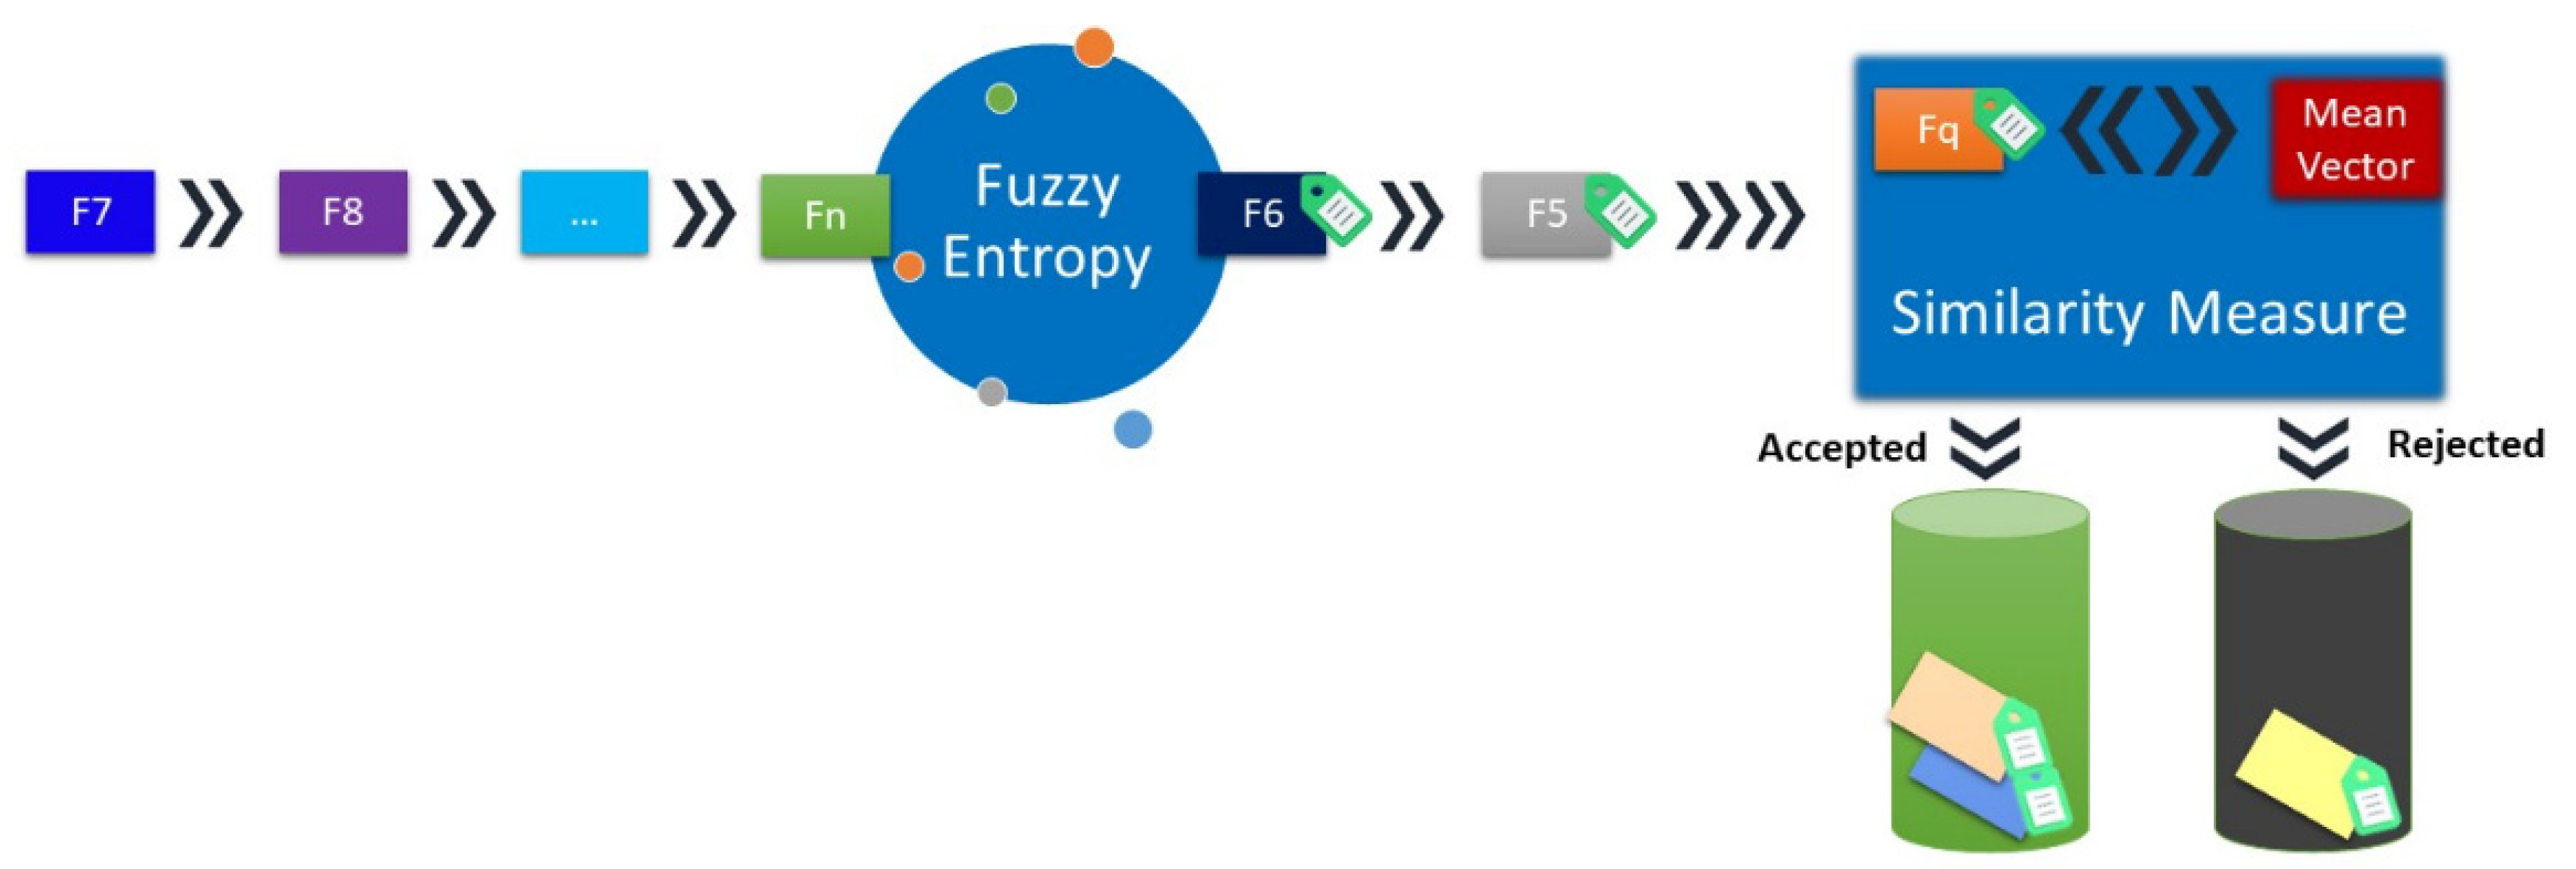
- We implement a feature selection framework based on Lukasiewicz similarity measure (LS) and Luca-measure fuzzy entropy (LFE). Quality features produce more accurate results.
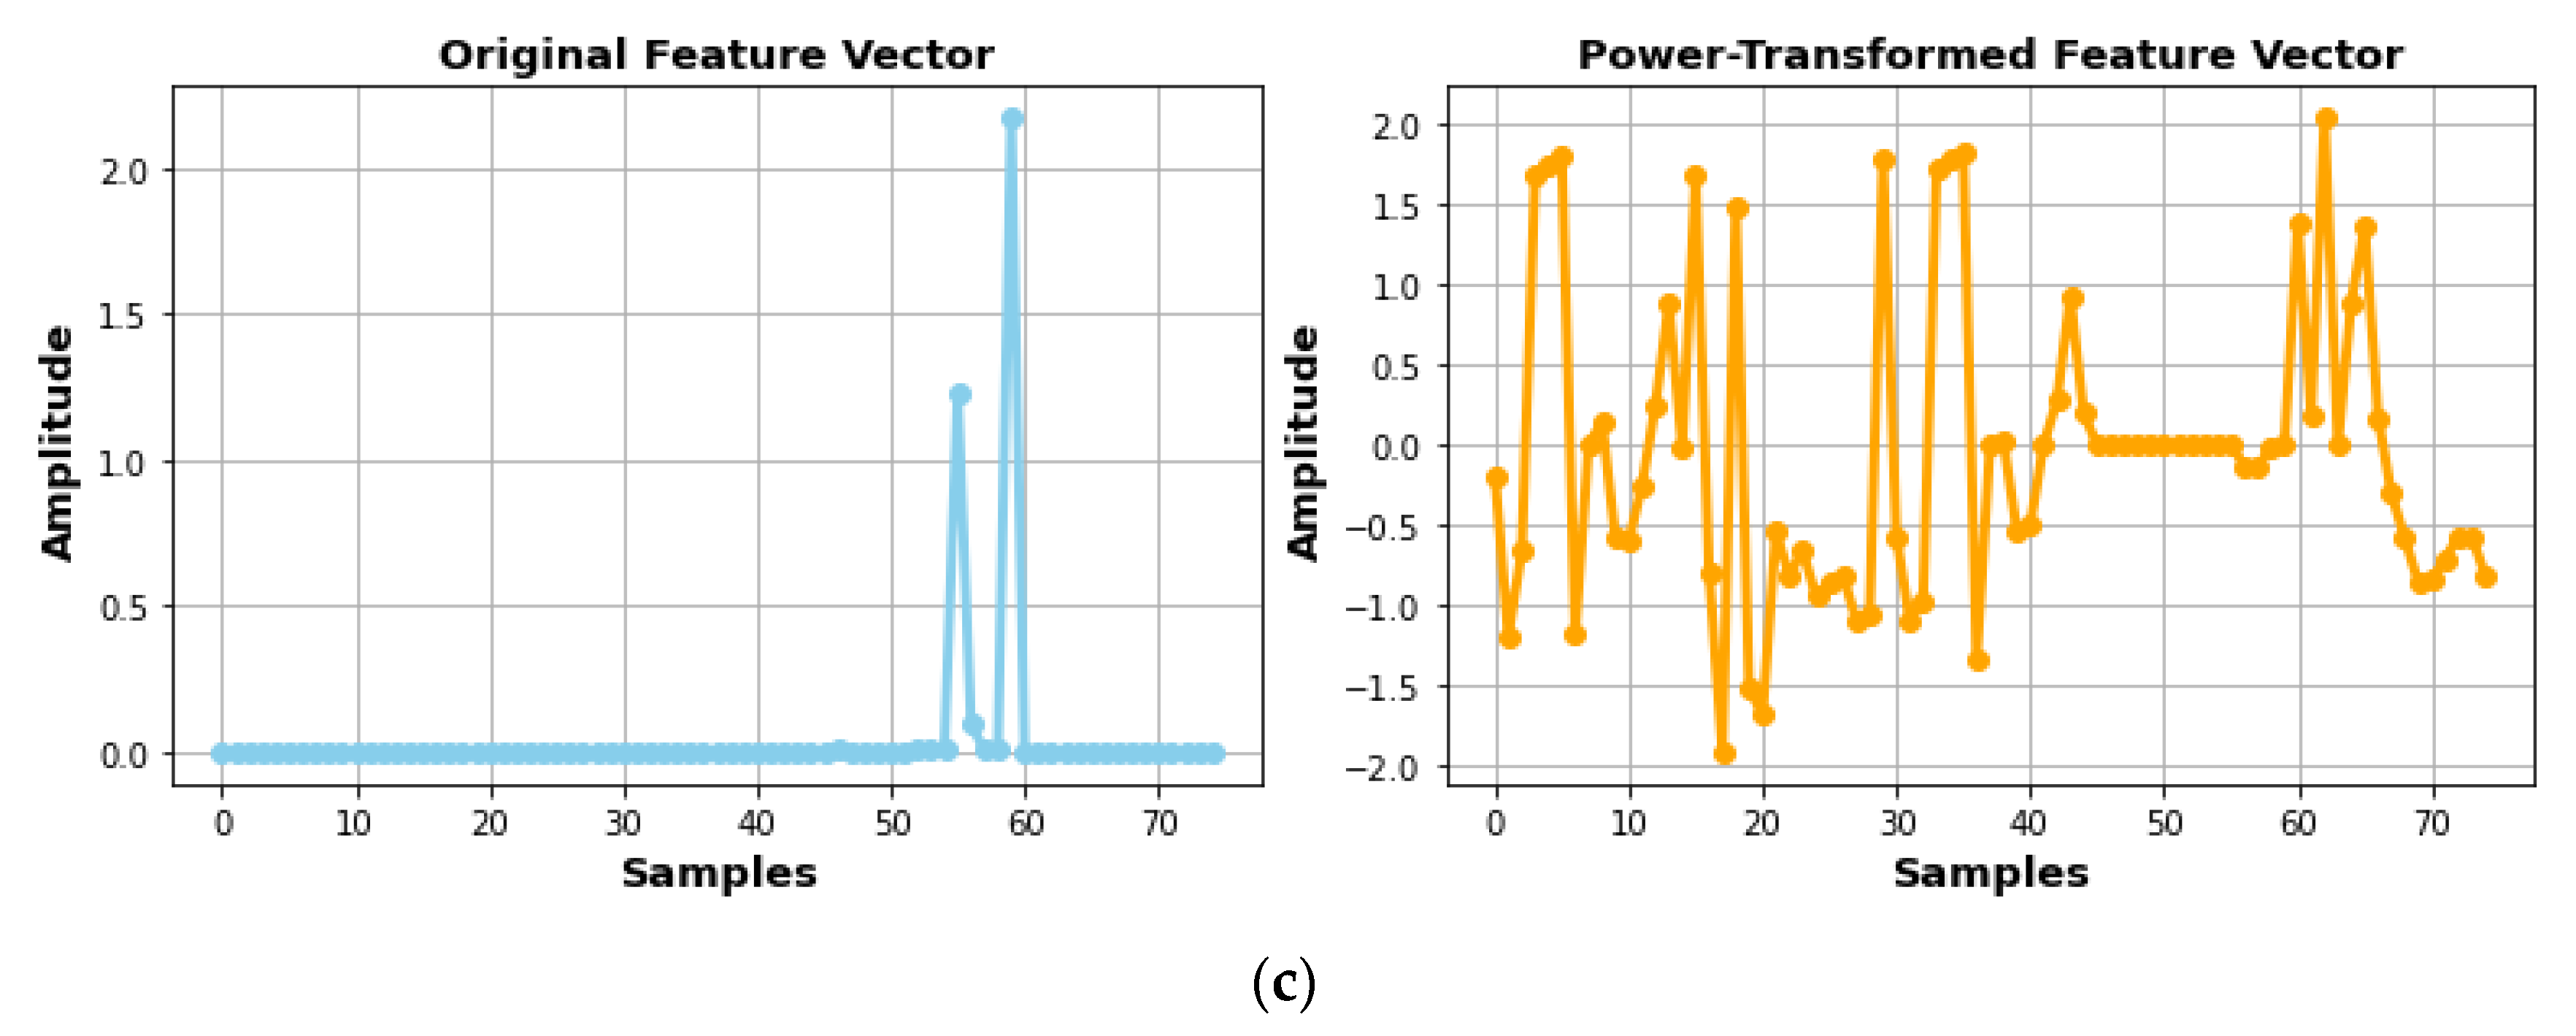
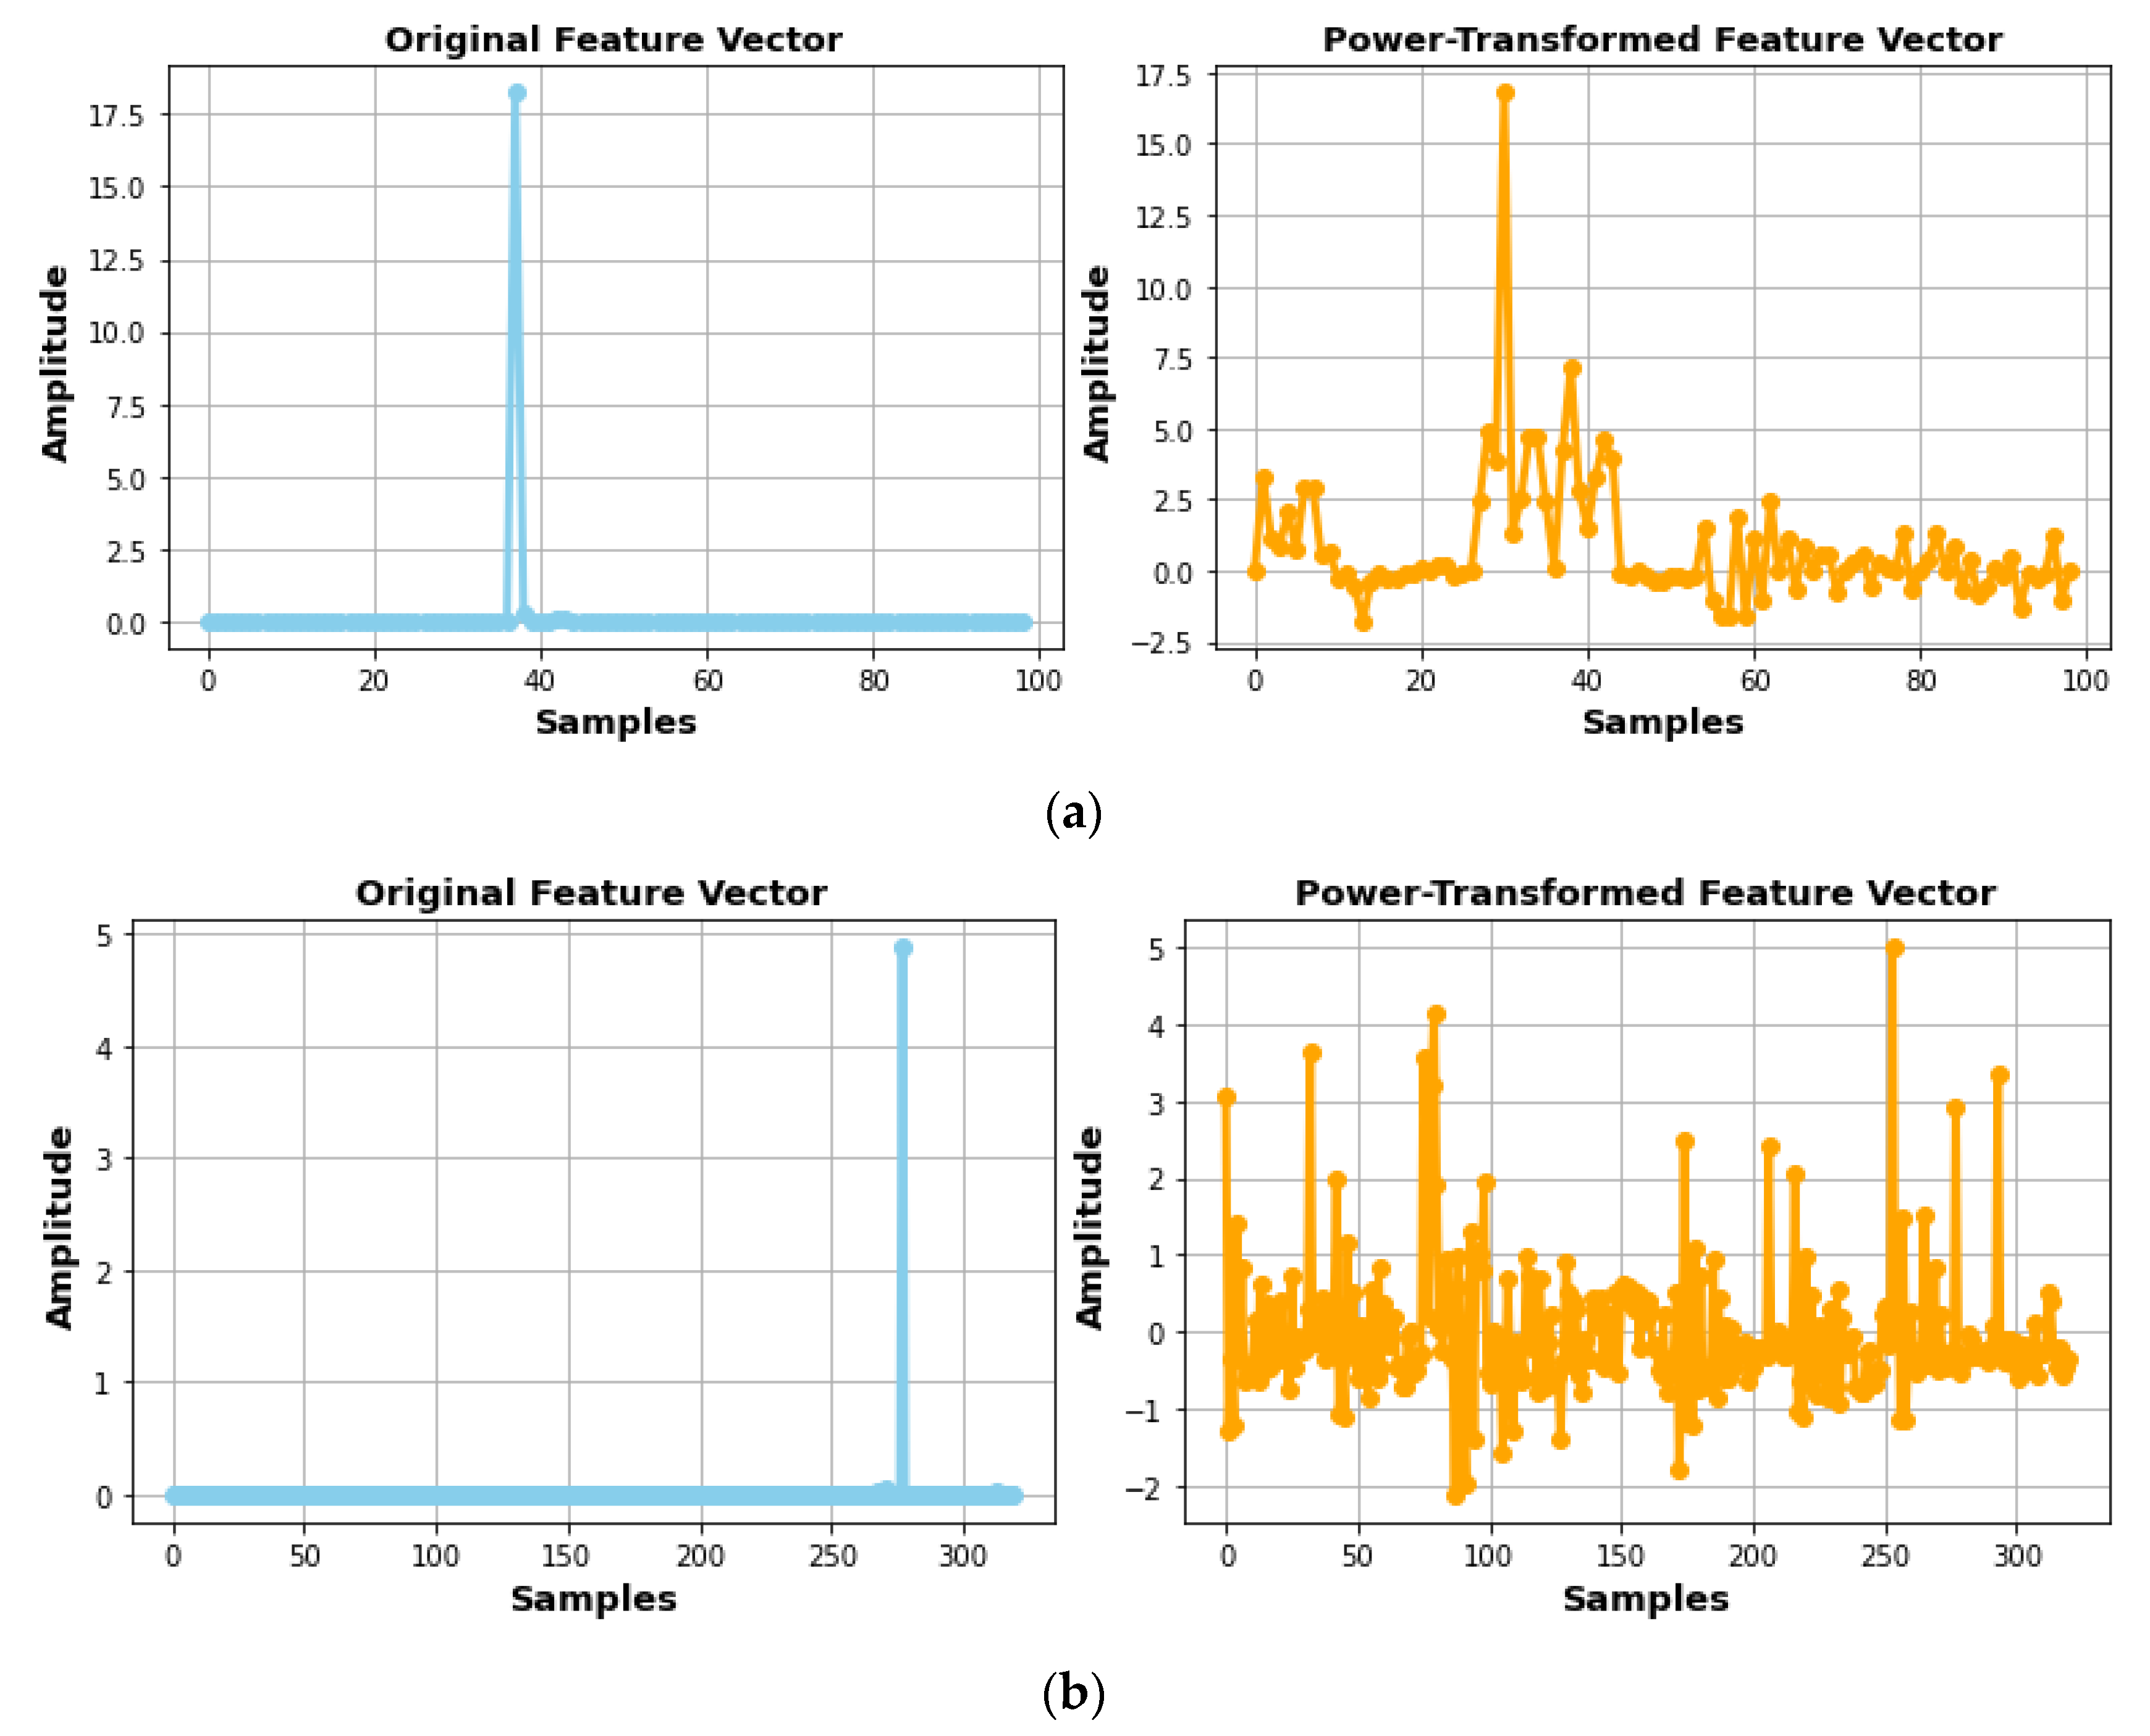
- To optimize the selected features, the Yeo–Johnson power transform is implemented, which brings the data into a sophisticated shape and consequently supports better classification.
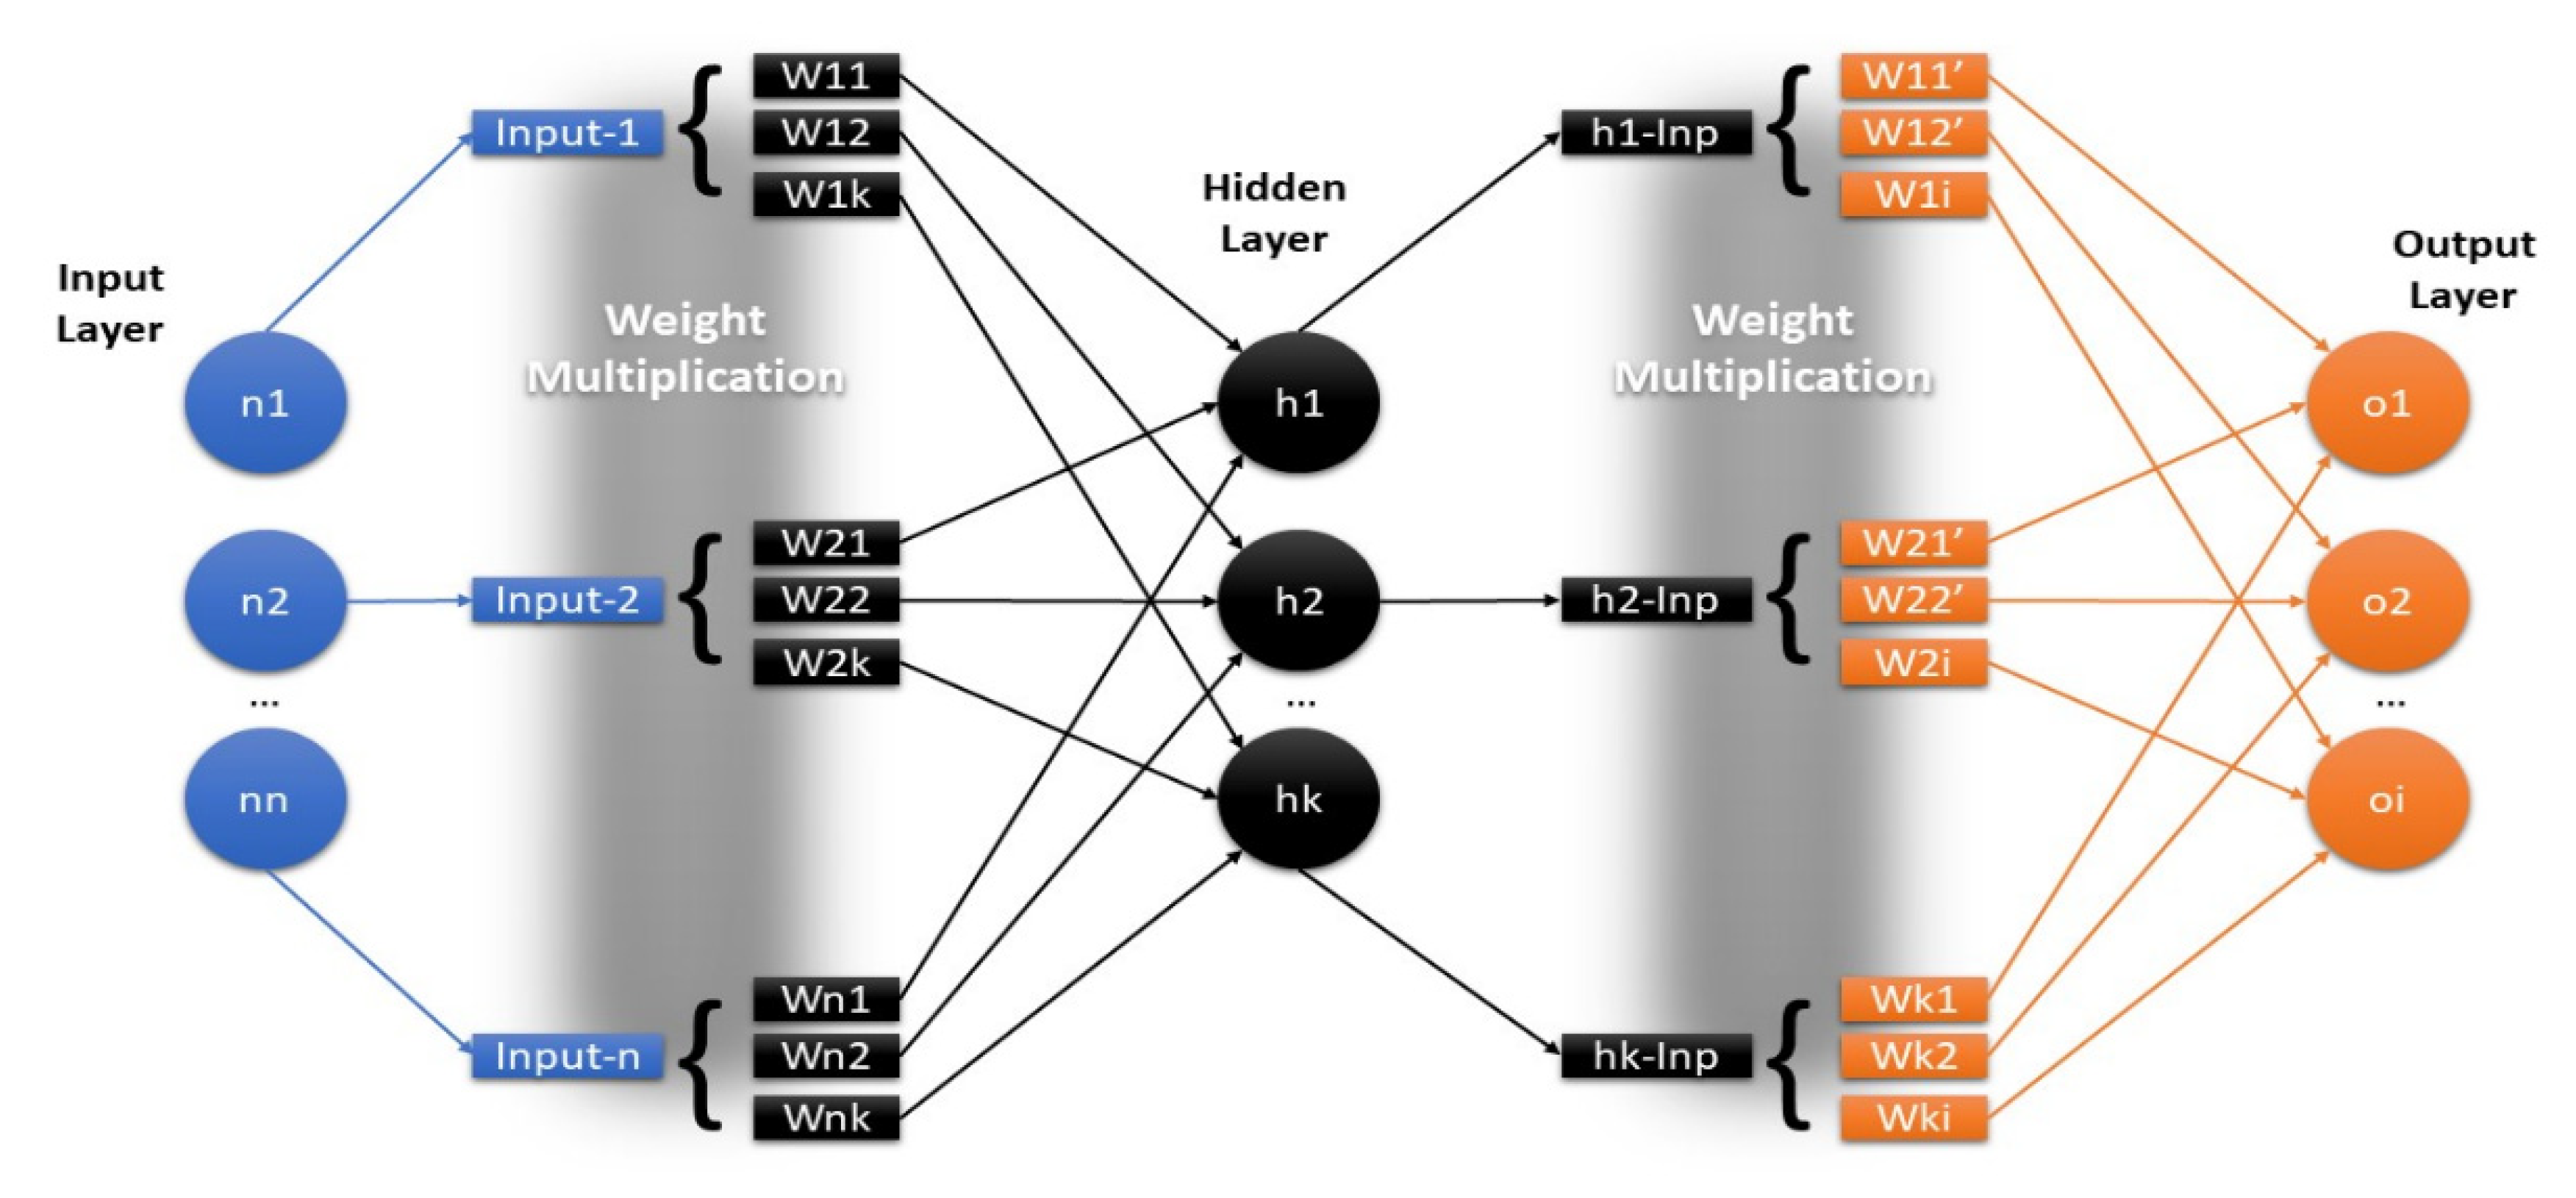
- We implement a multilayer perceptron (MLP) and tune its parameters for the final classification of human locomotion activities.
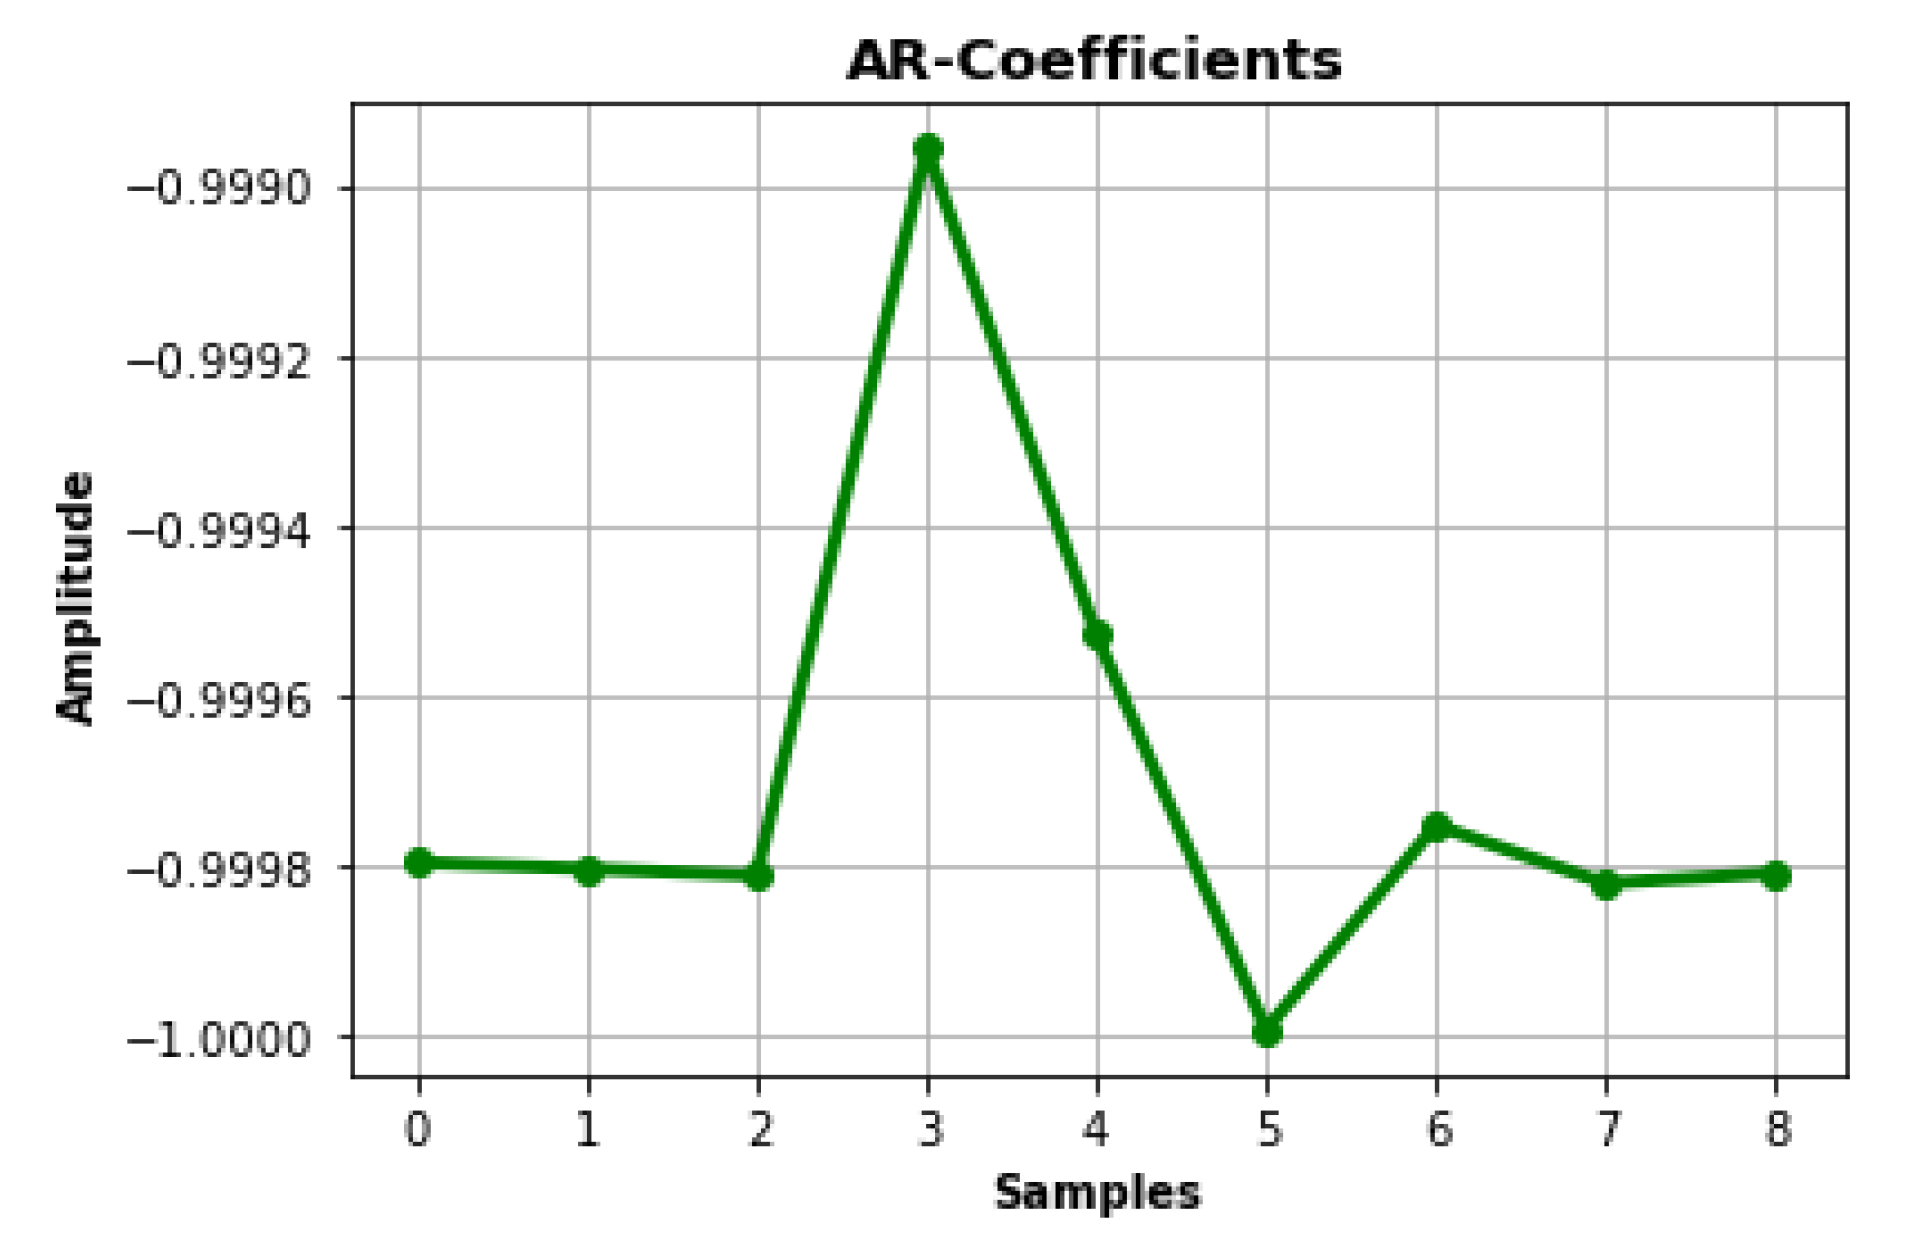
- We introduce novel features to the field of RS-HLAR in the shape of Parseval’s energy and auto-regressive coefficients that have been popularly used in EEG signal and acoustic signal processing, respectively.
2. Related Work
2.1. RS-HLAR Using Inertial Sensors
2.2. RS-HLAR Using Proximity Sensors
3. Materials and Methods
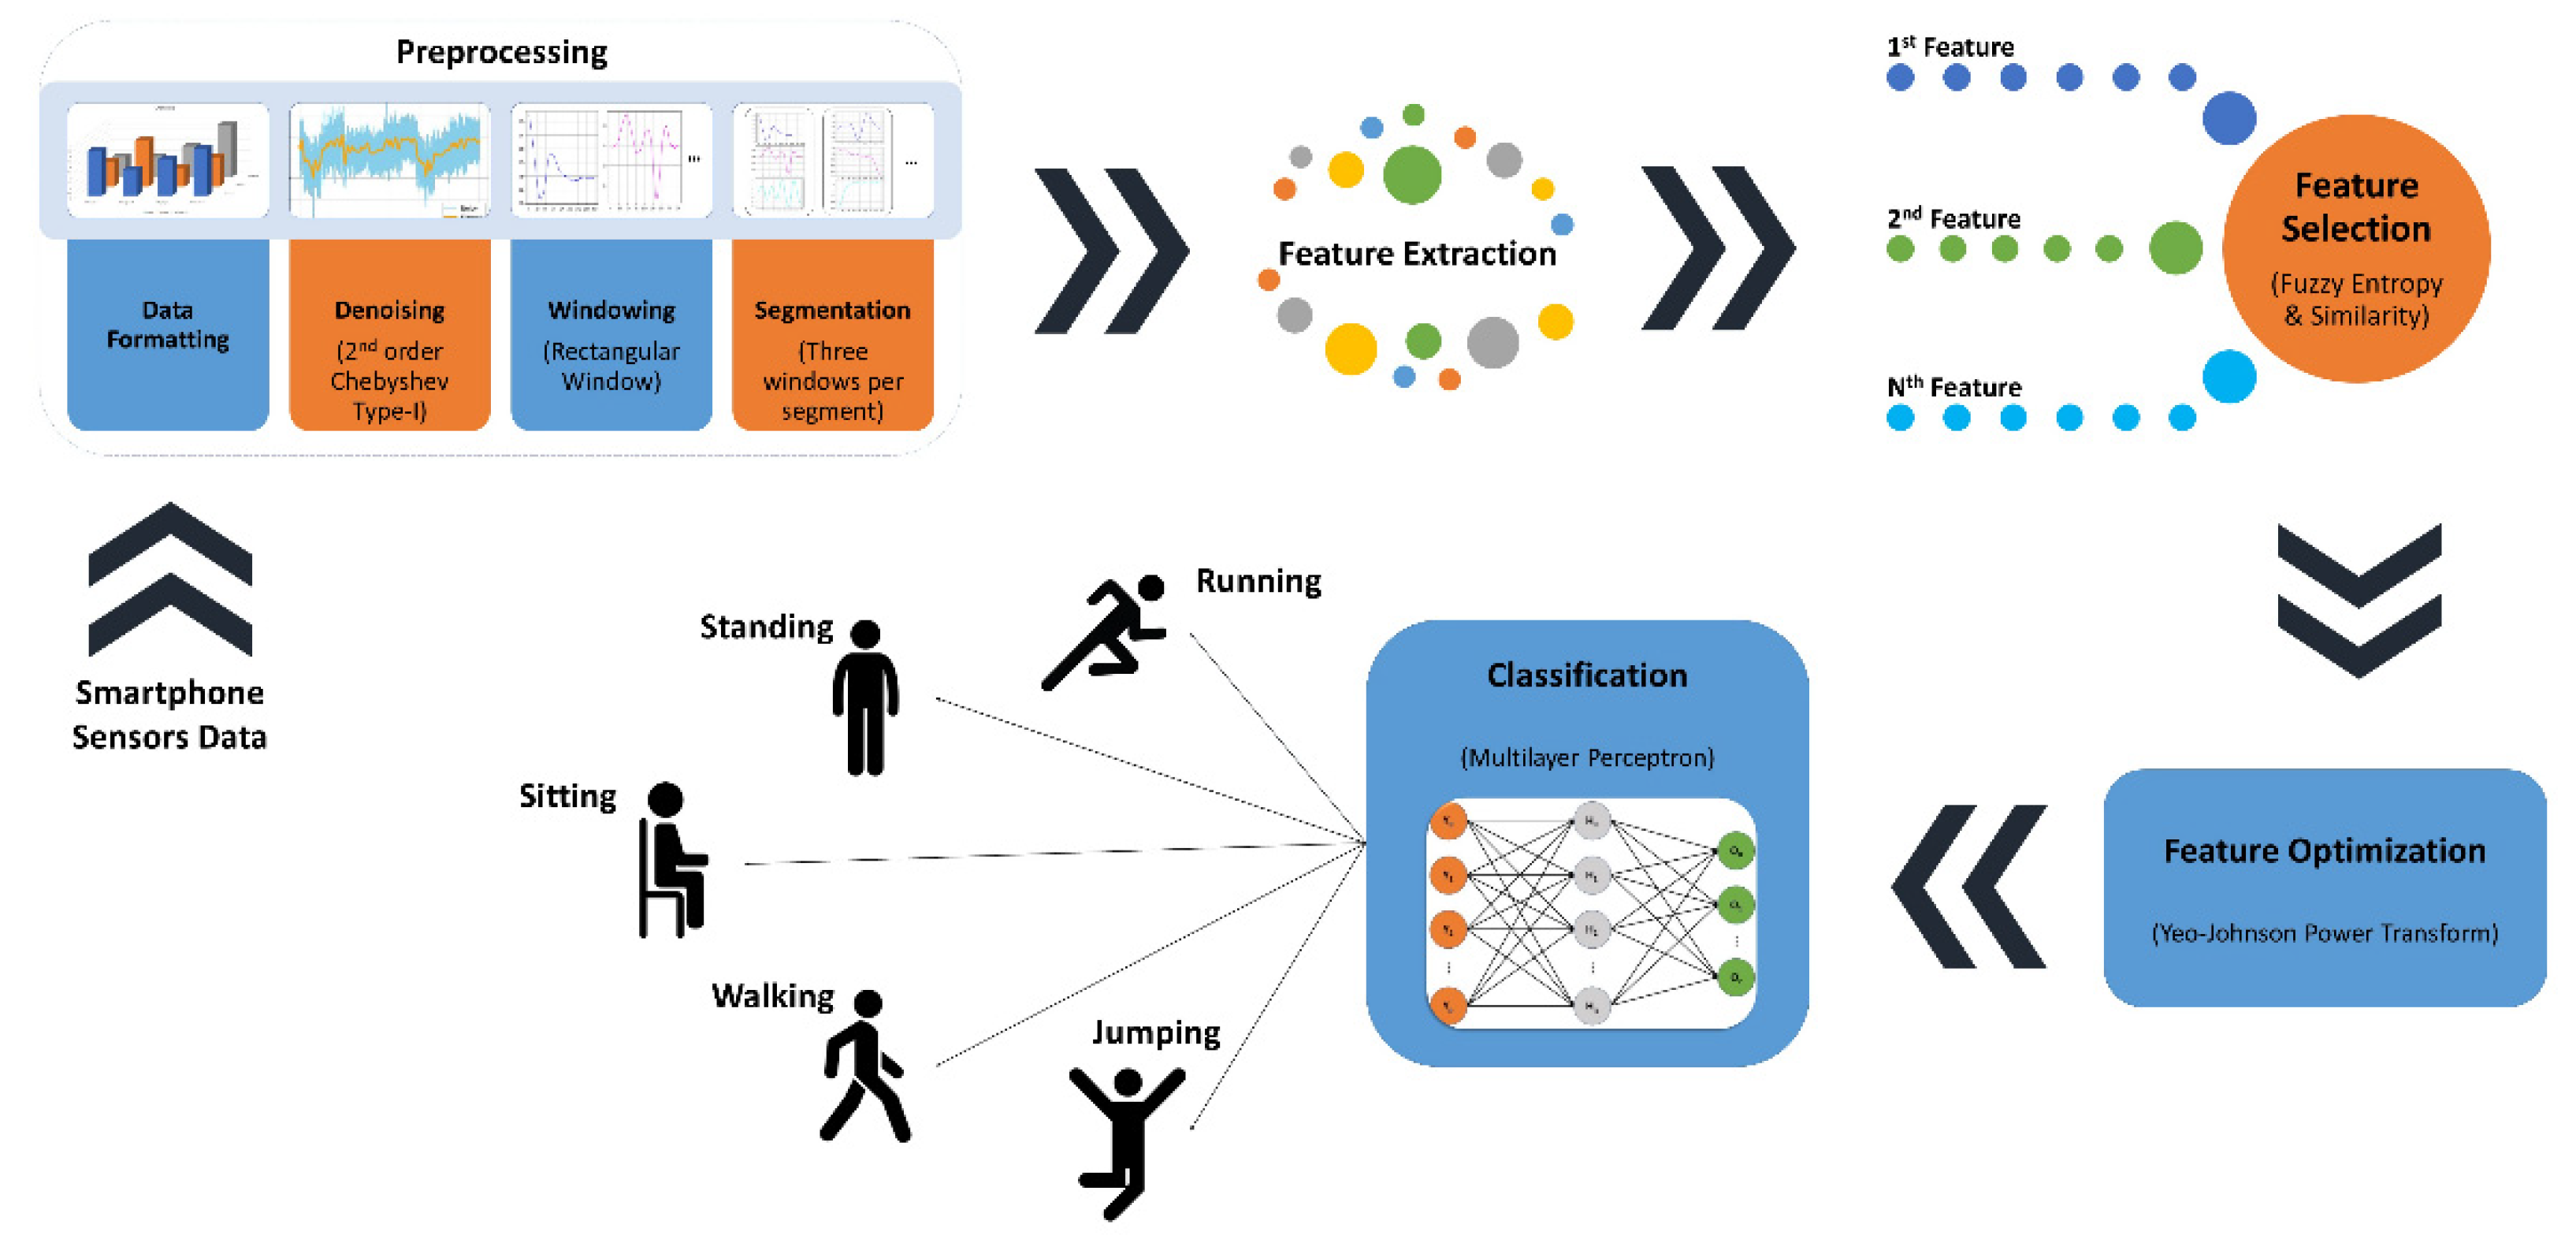
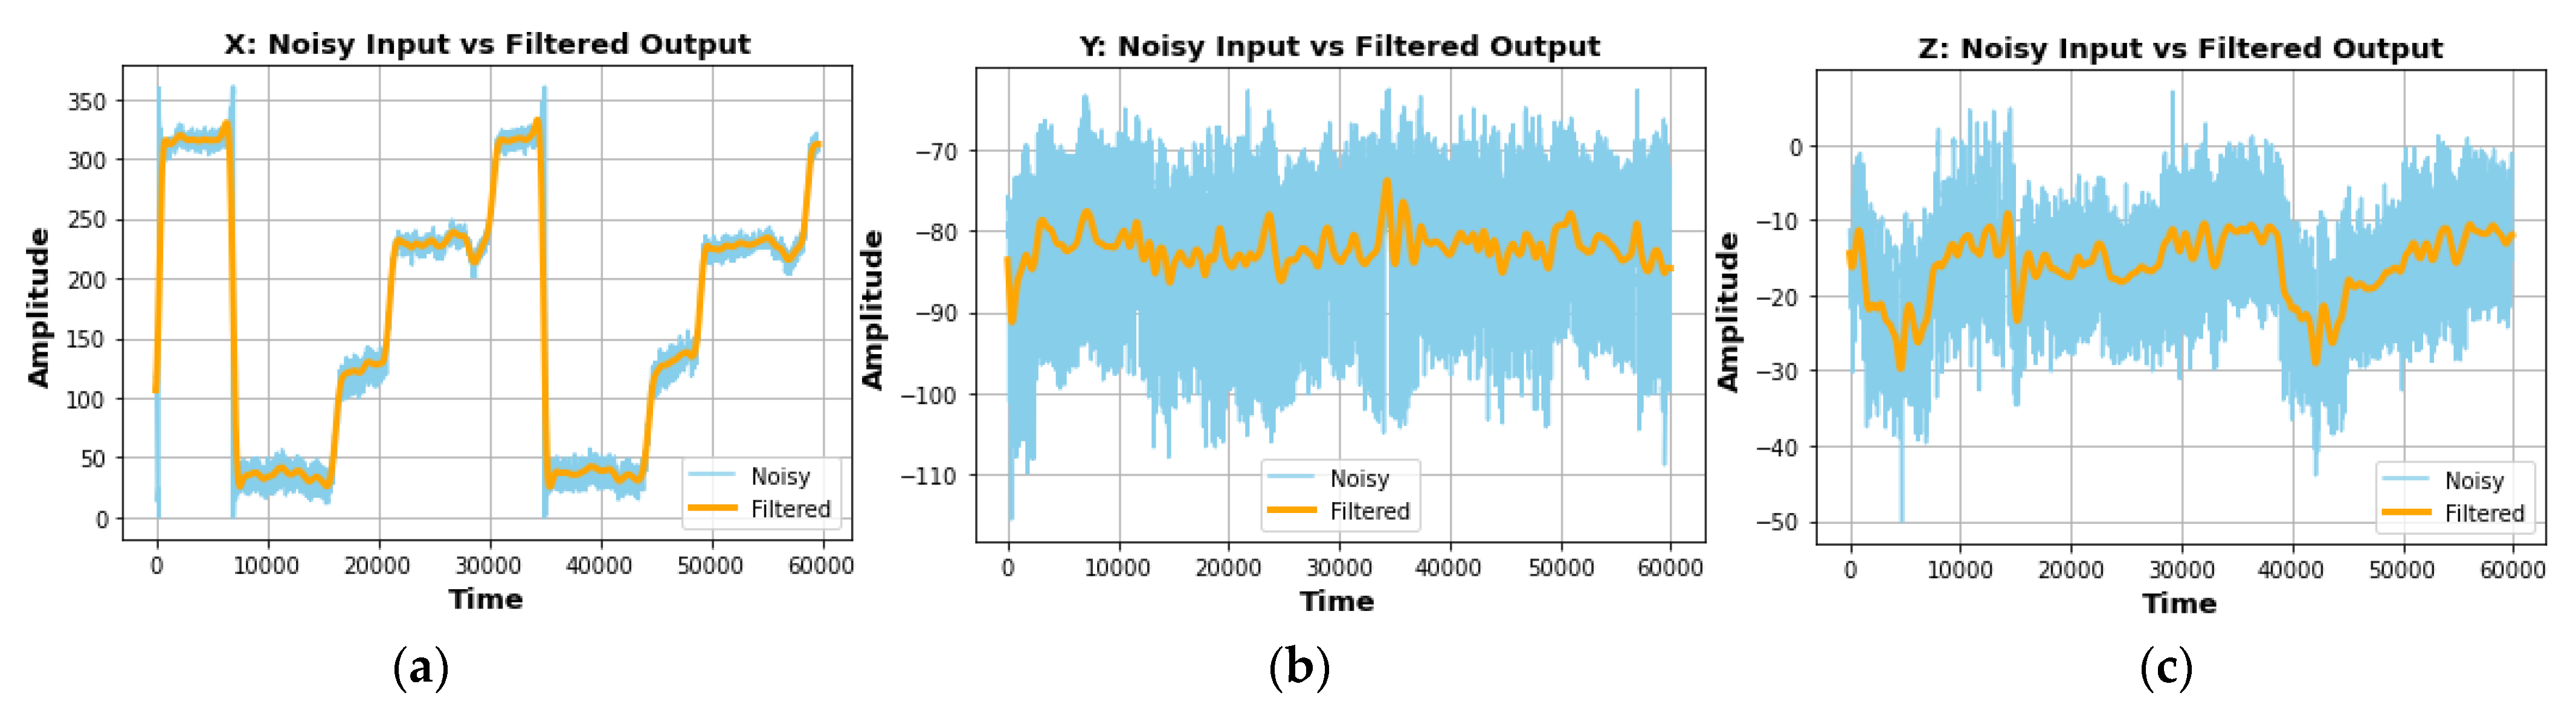
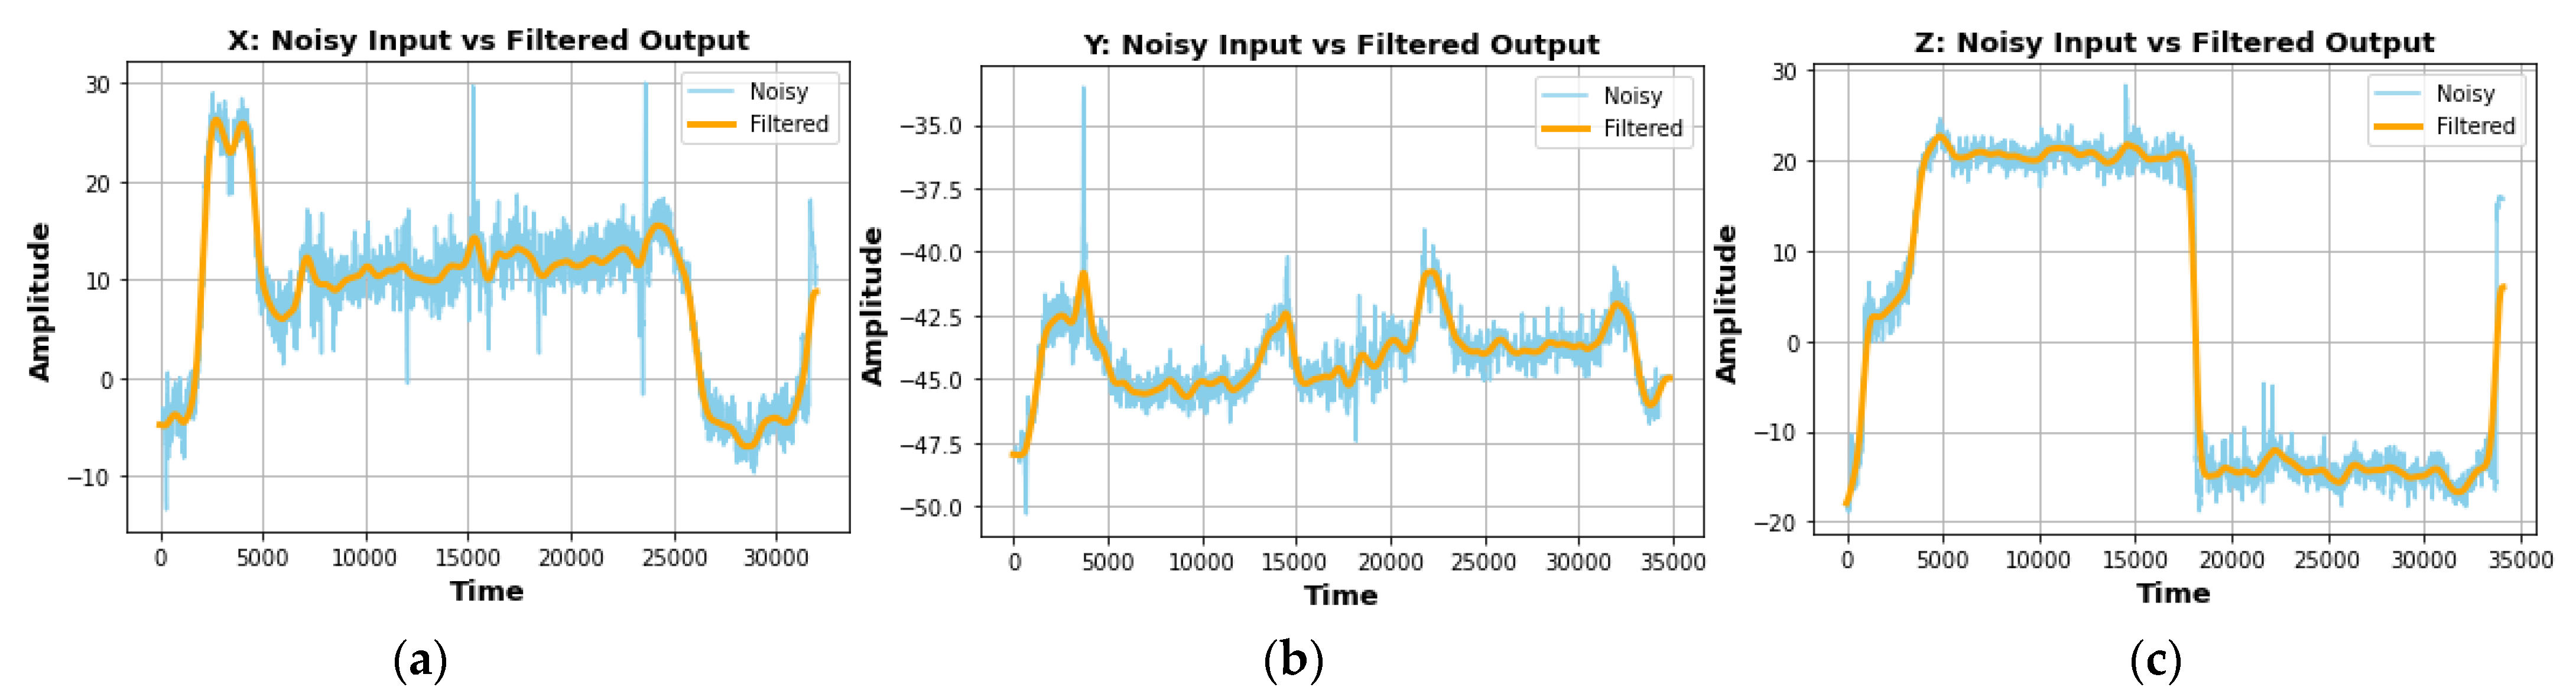
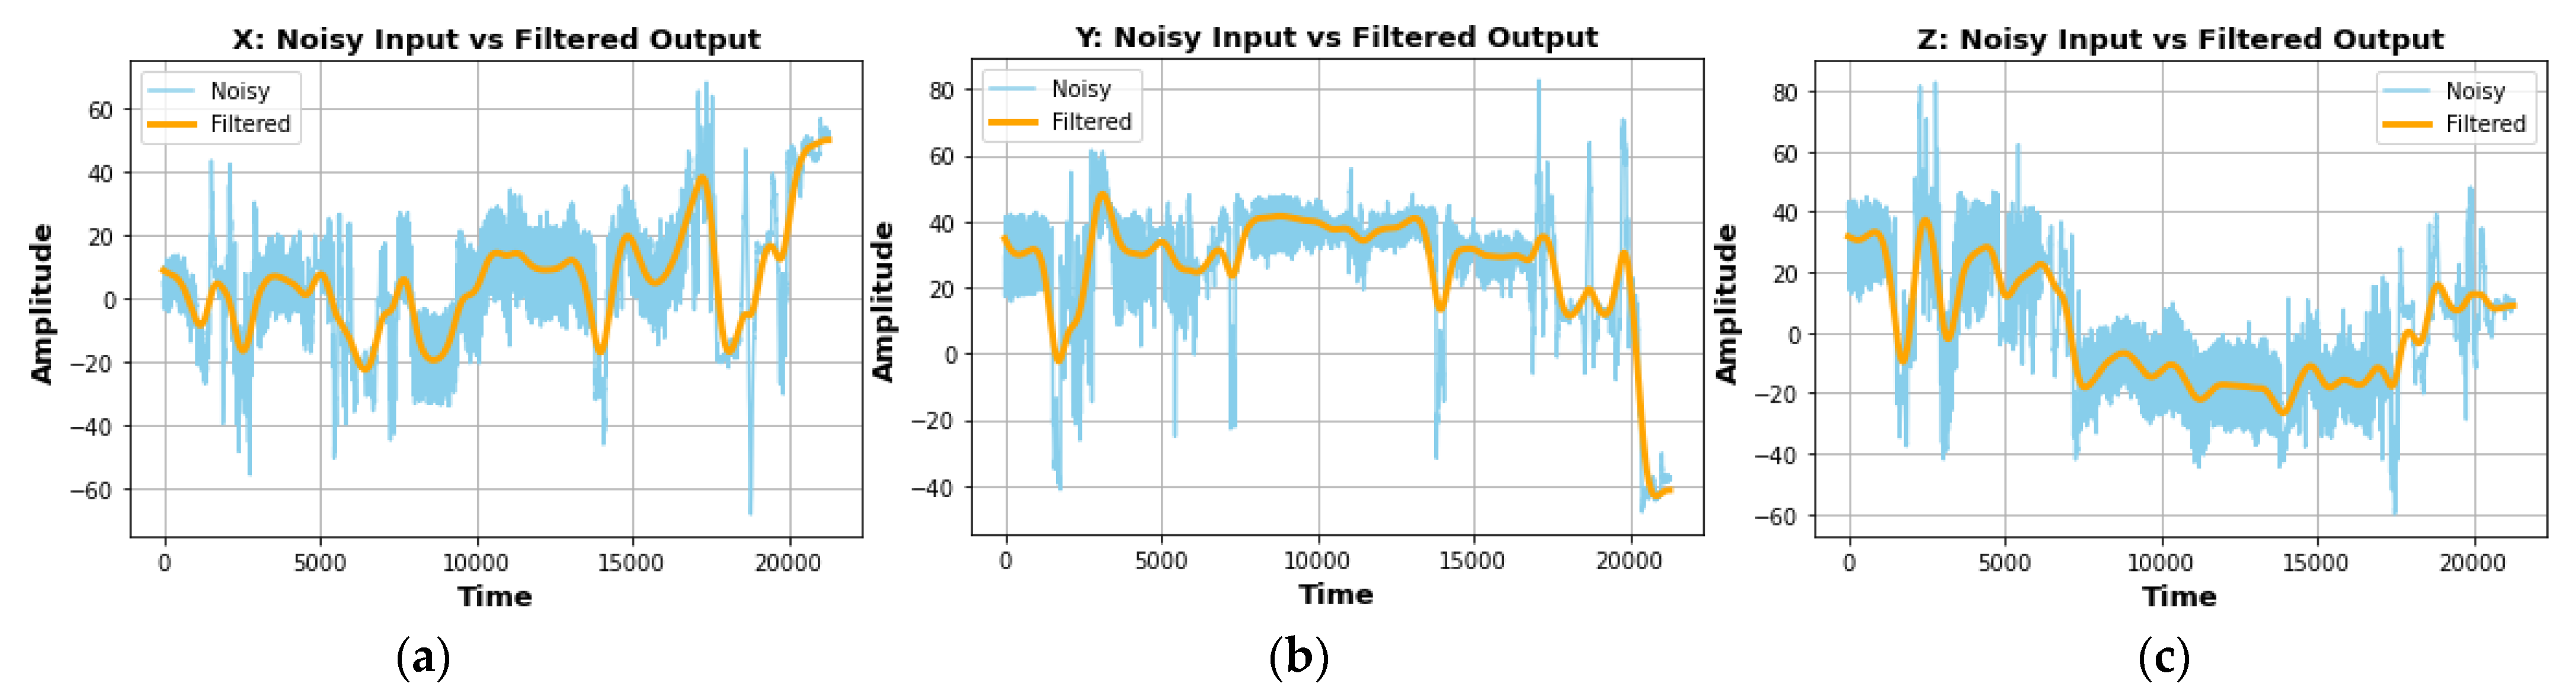
3.1. Preprocessing
3.2. Windowing and Segmentation
3.3. Feature Extraction
3.4. Feature Selection
3.5. Feature Optimization
3.6. Classification
4. Experimental Results
4.1. Datasets Description
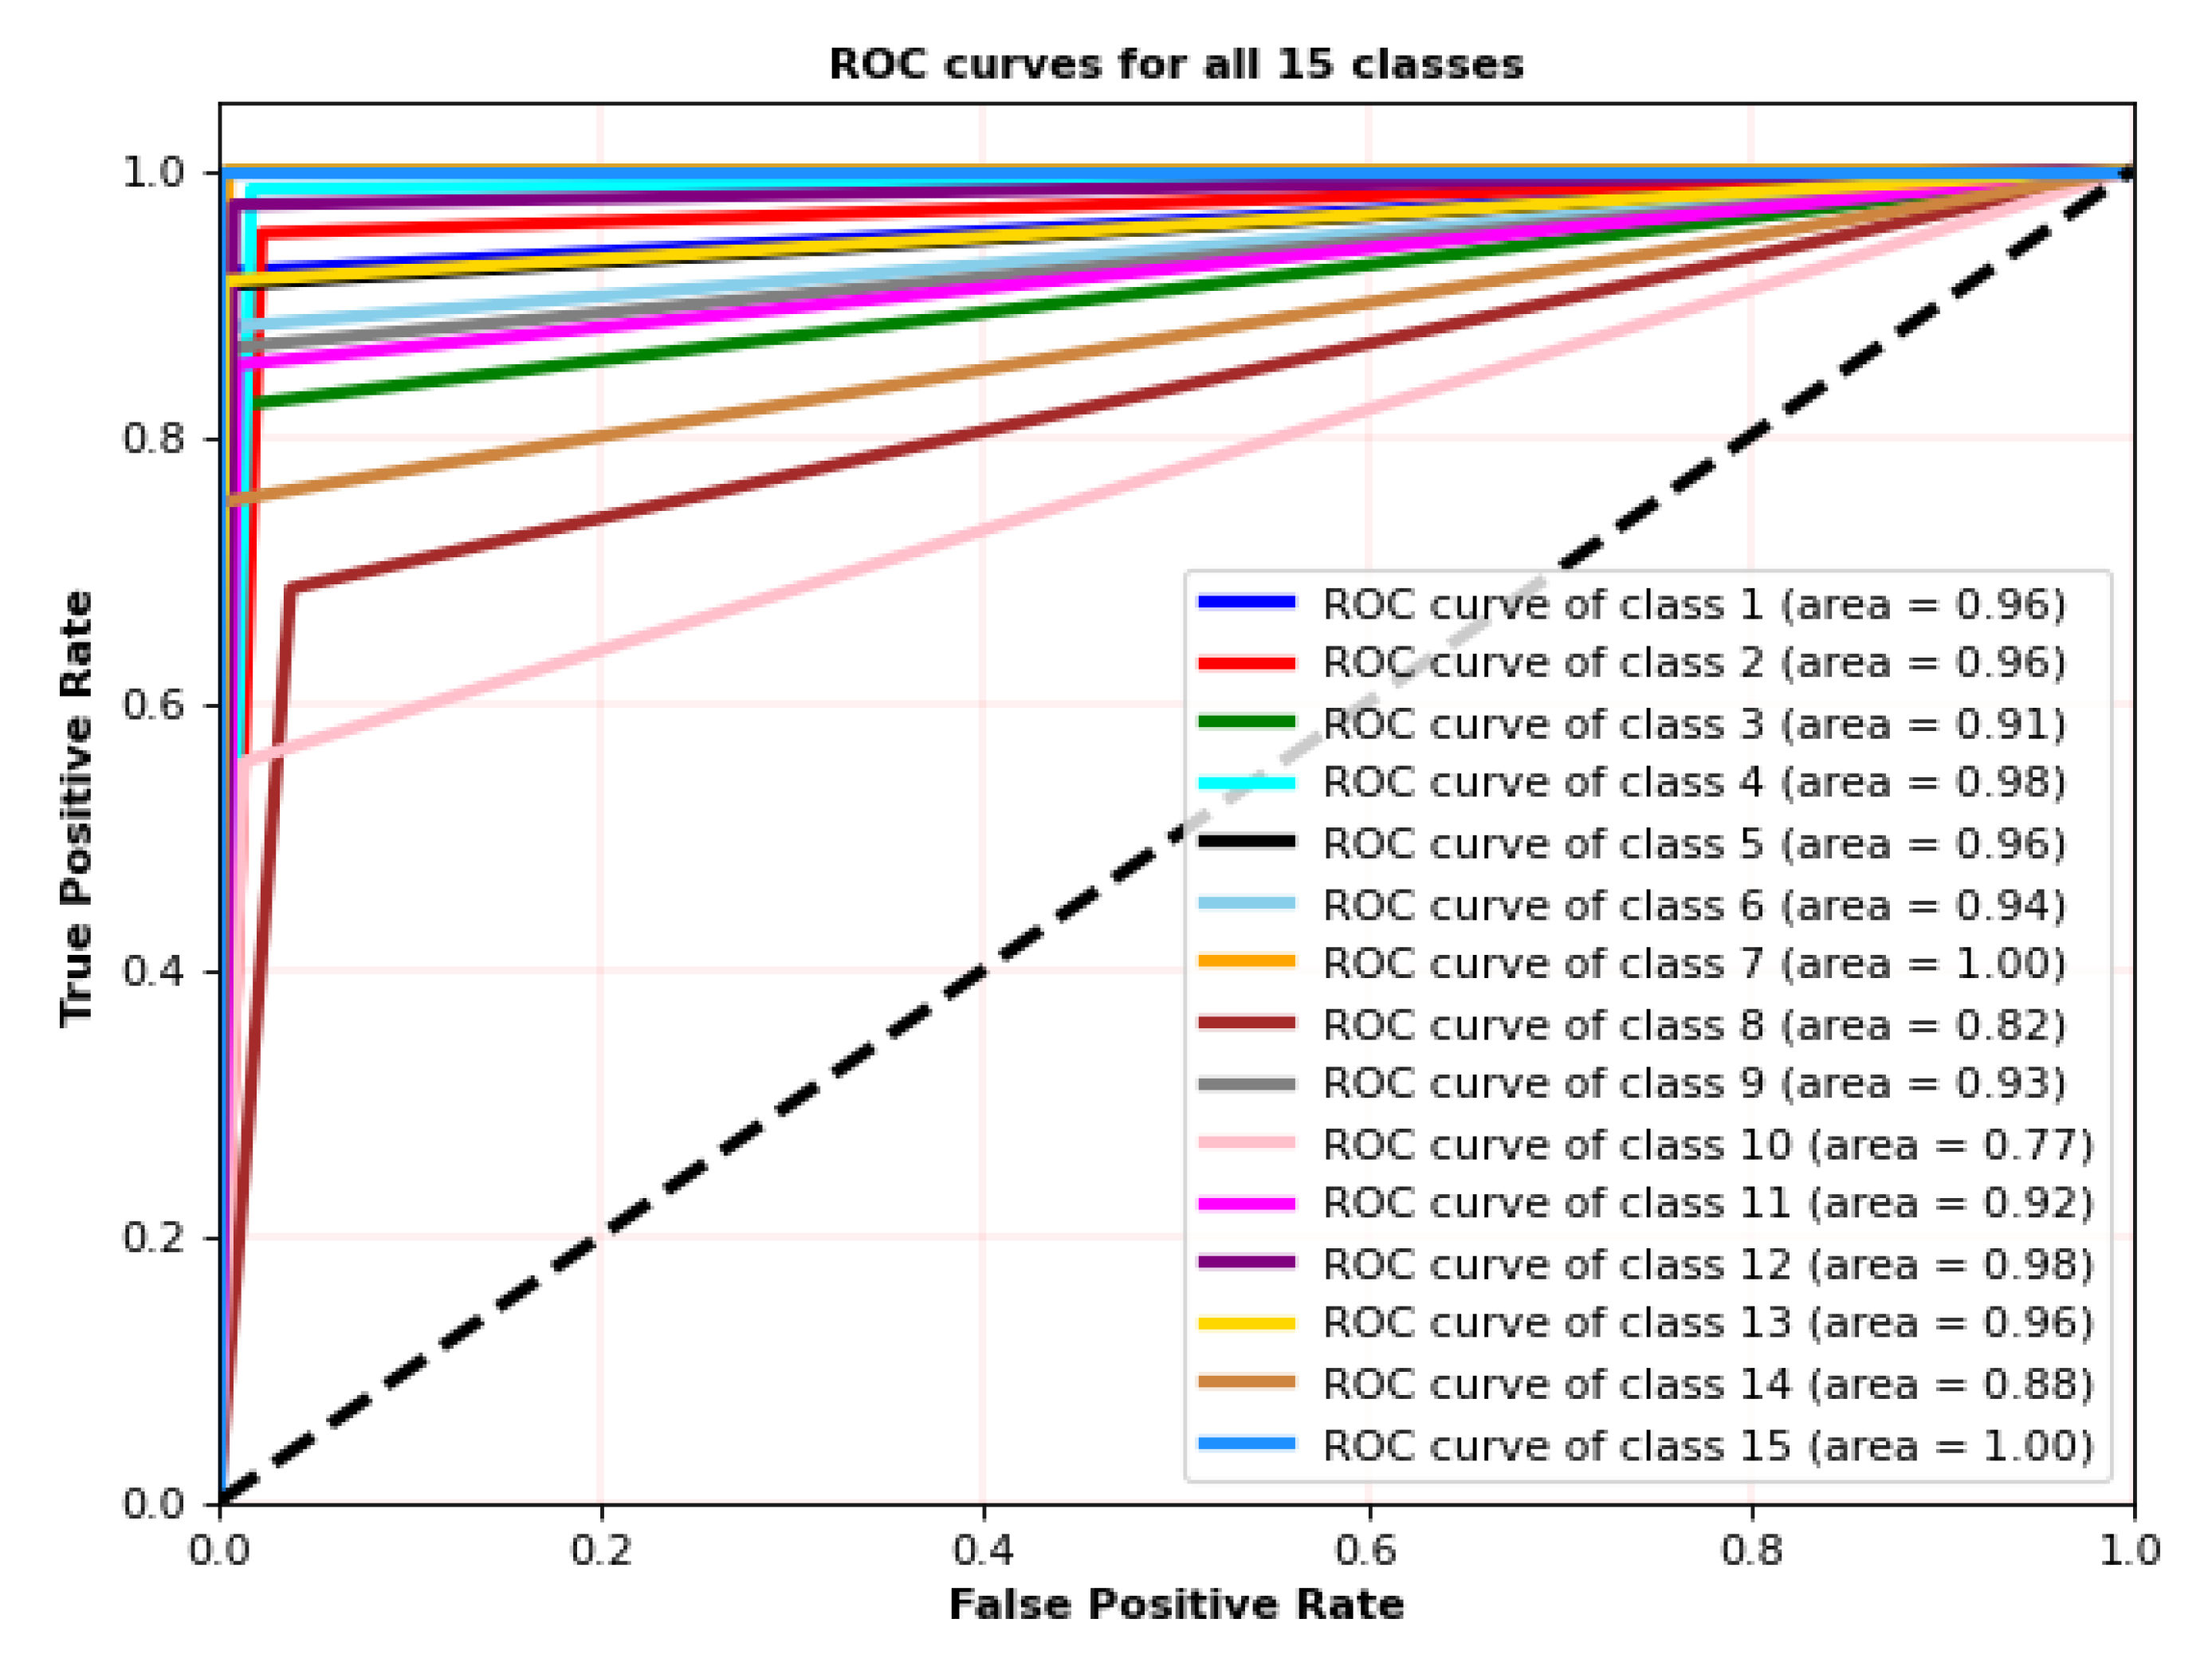
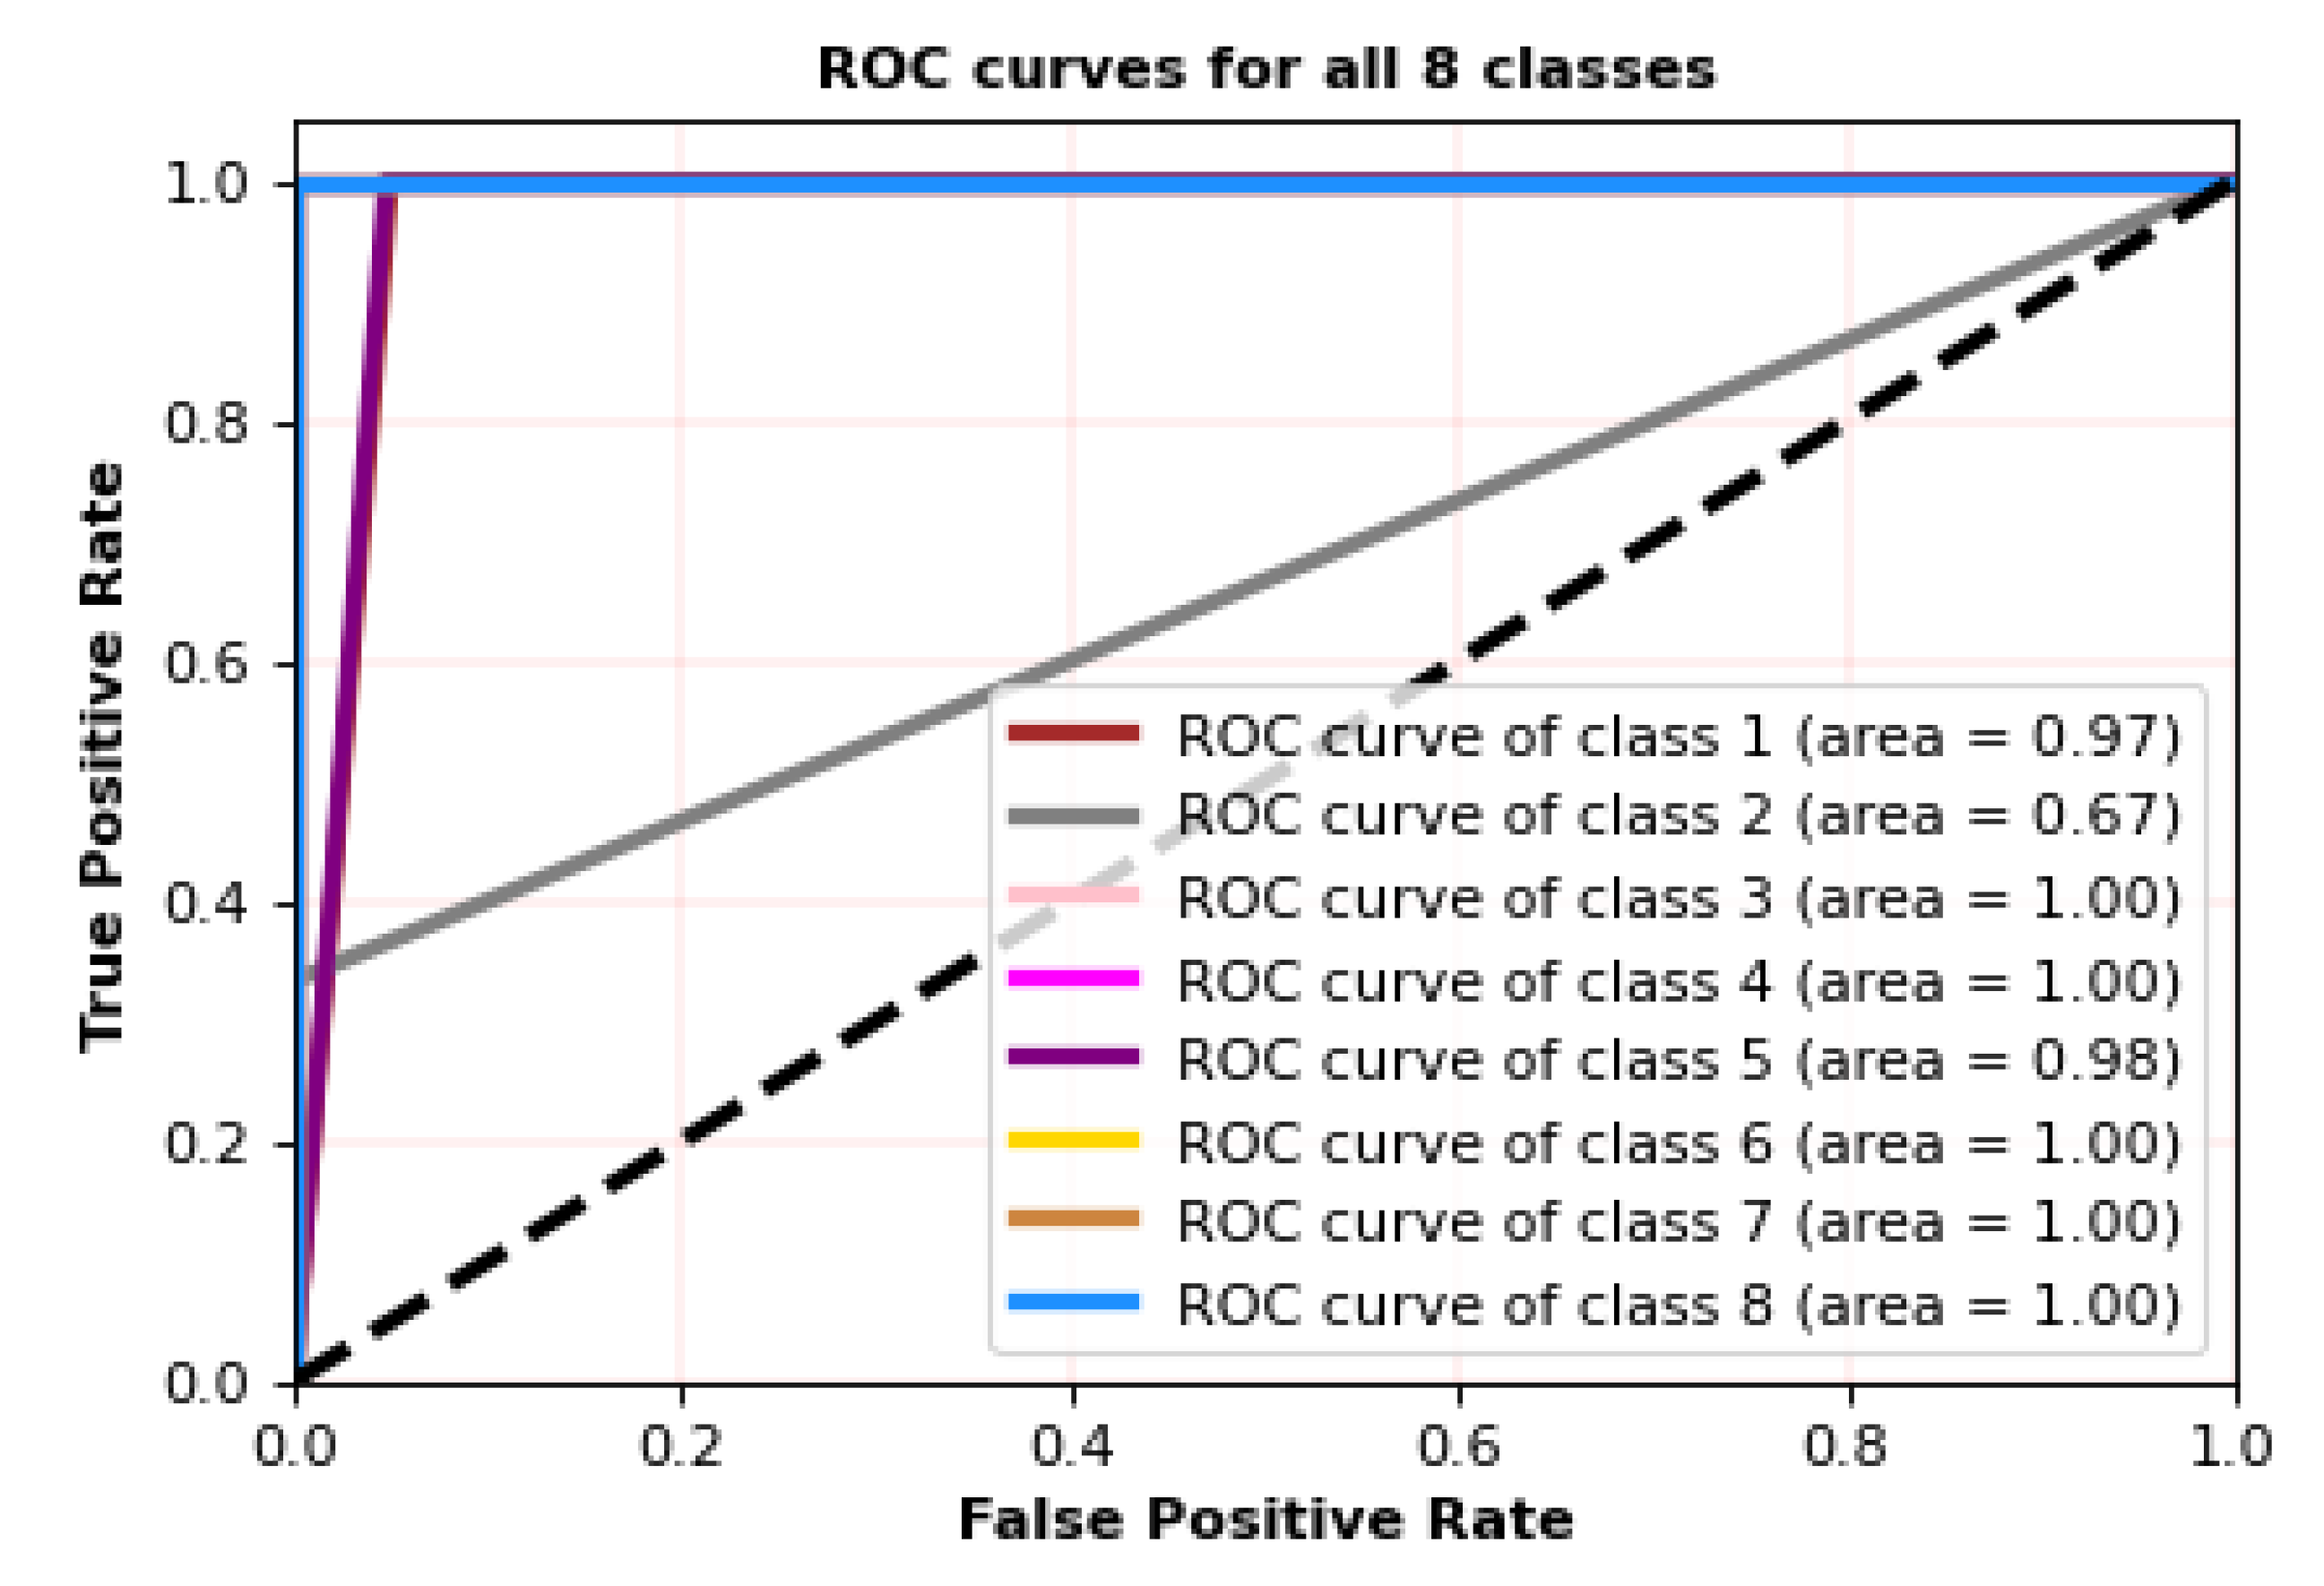
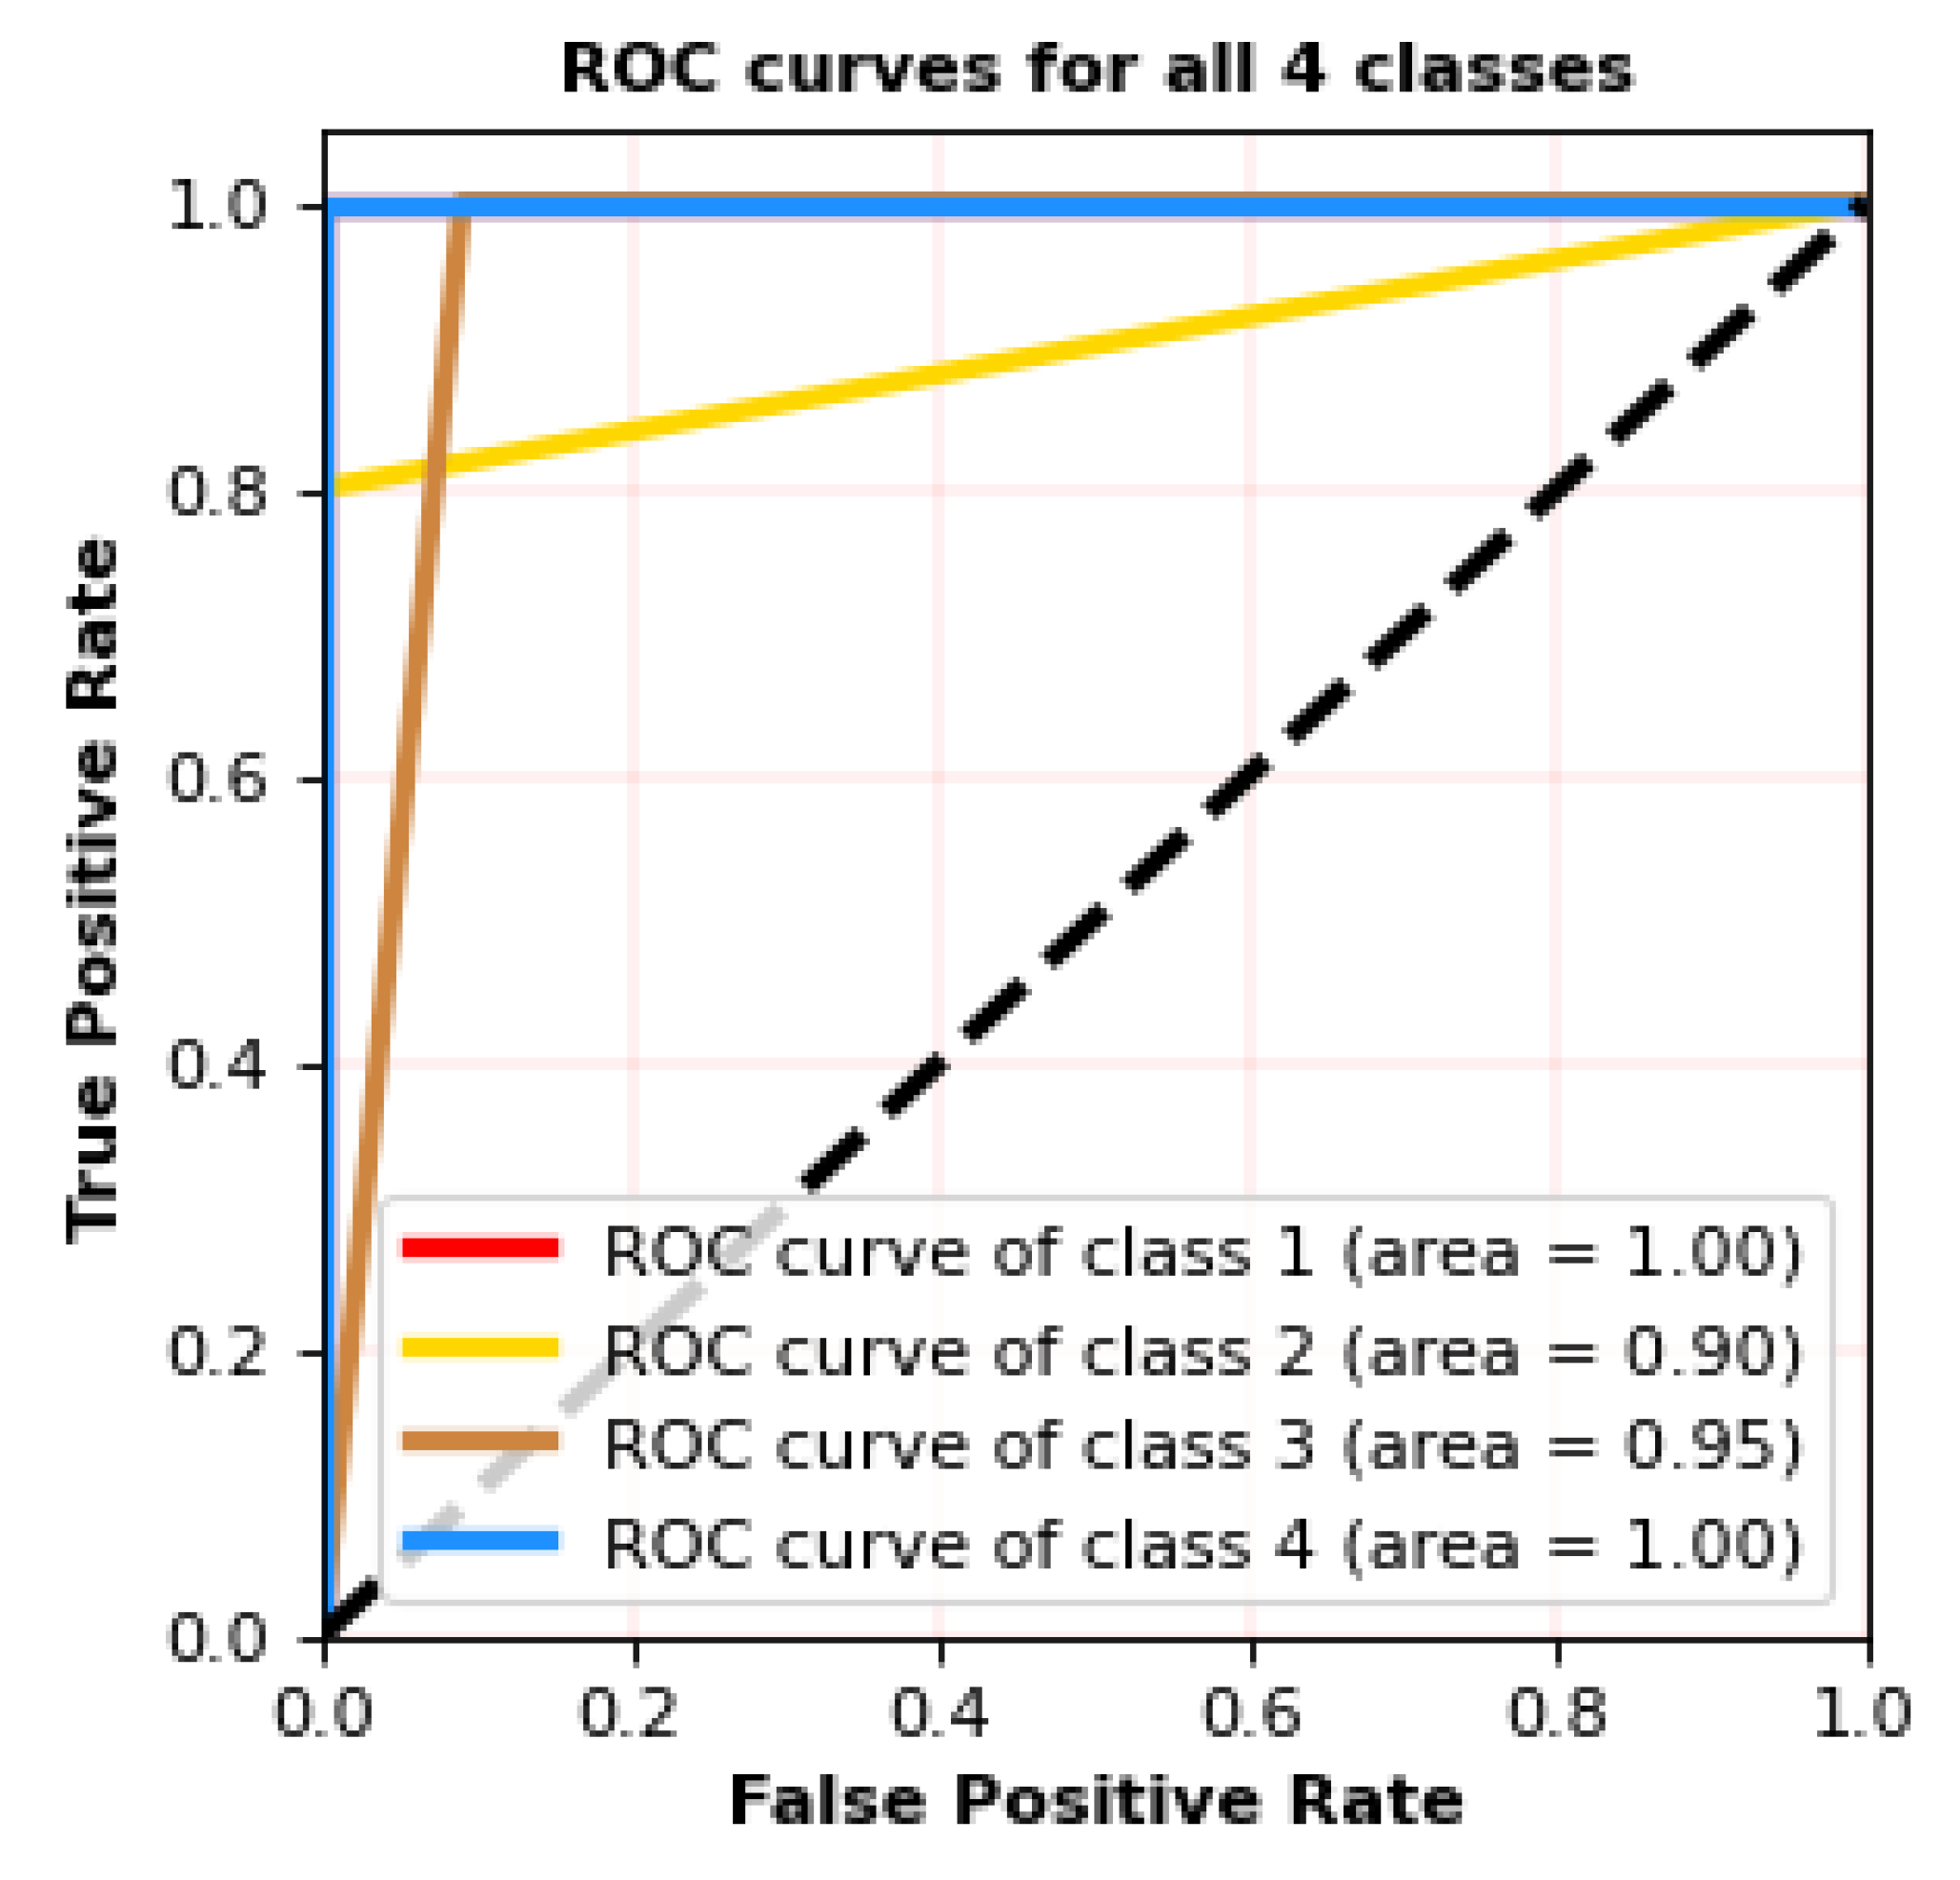
4.2. Experiment I: Receiver Operating Characteristic (ROC) Curves SSRDS
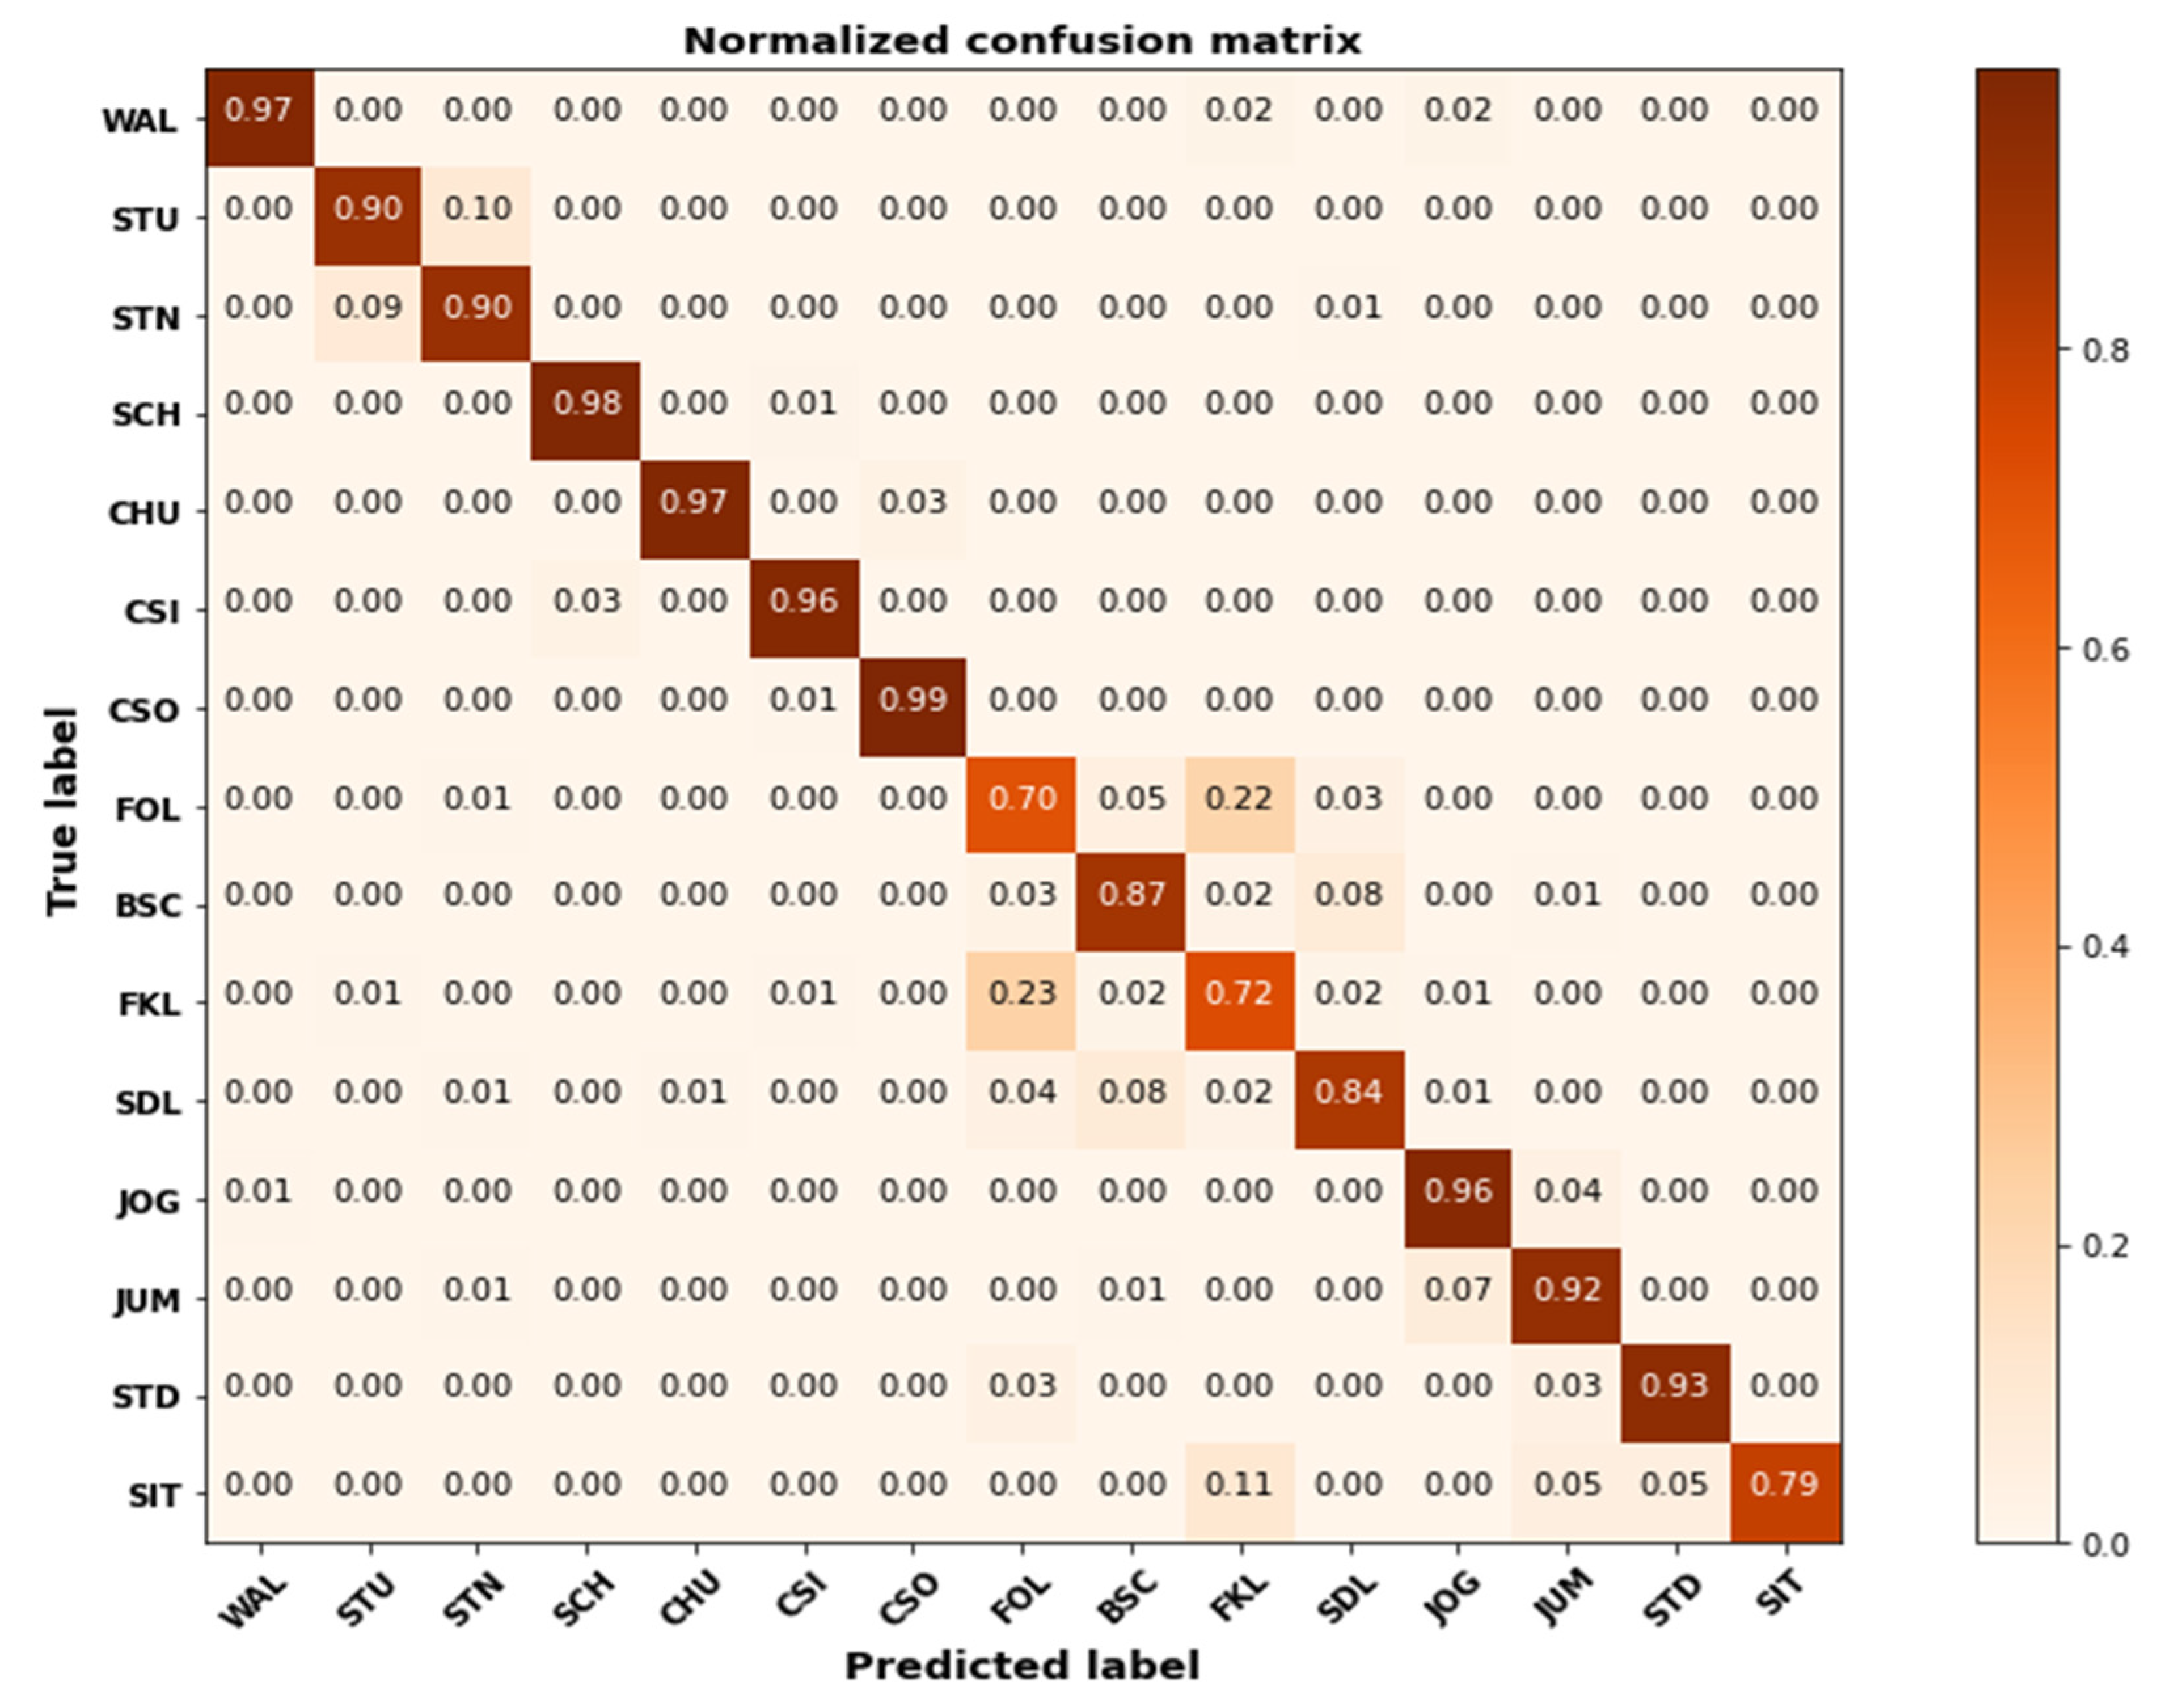
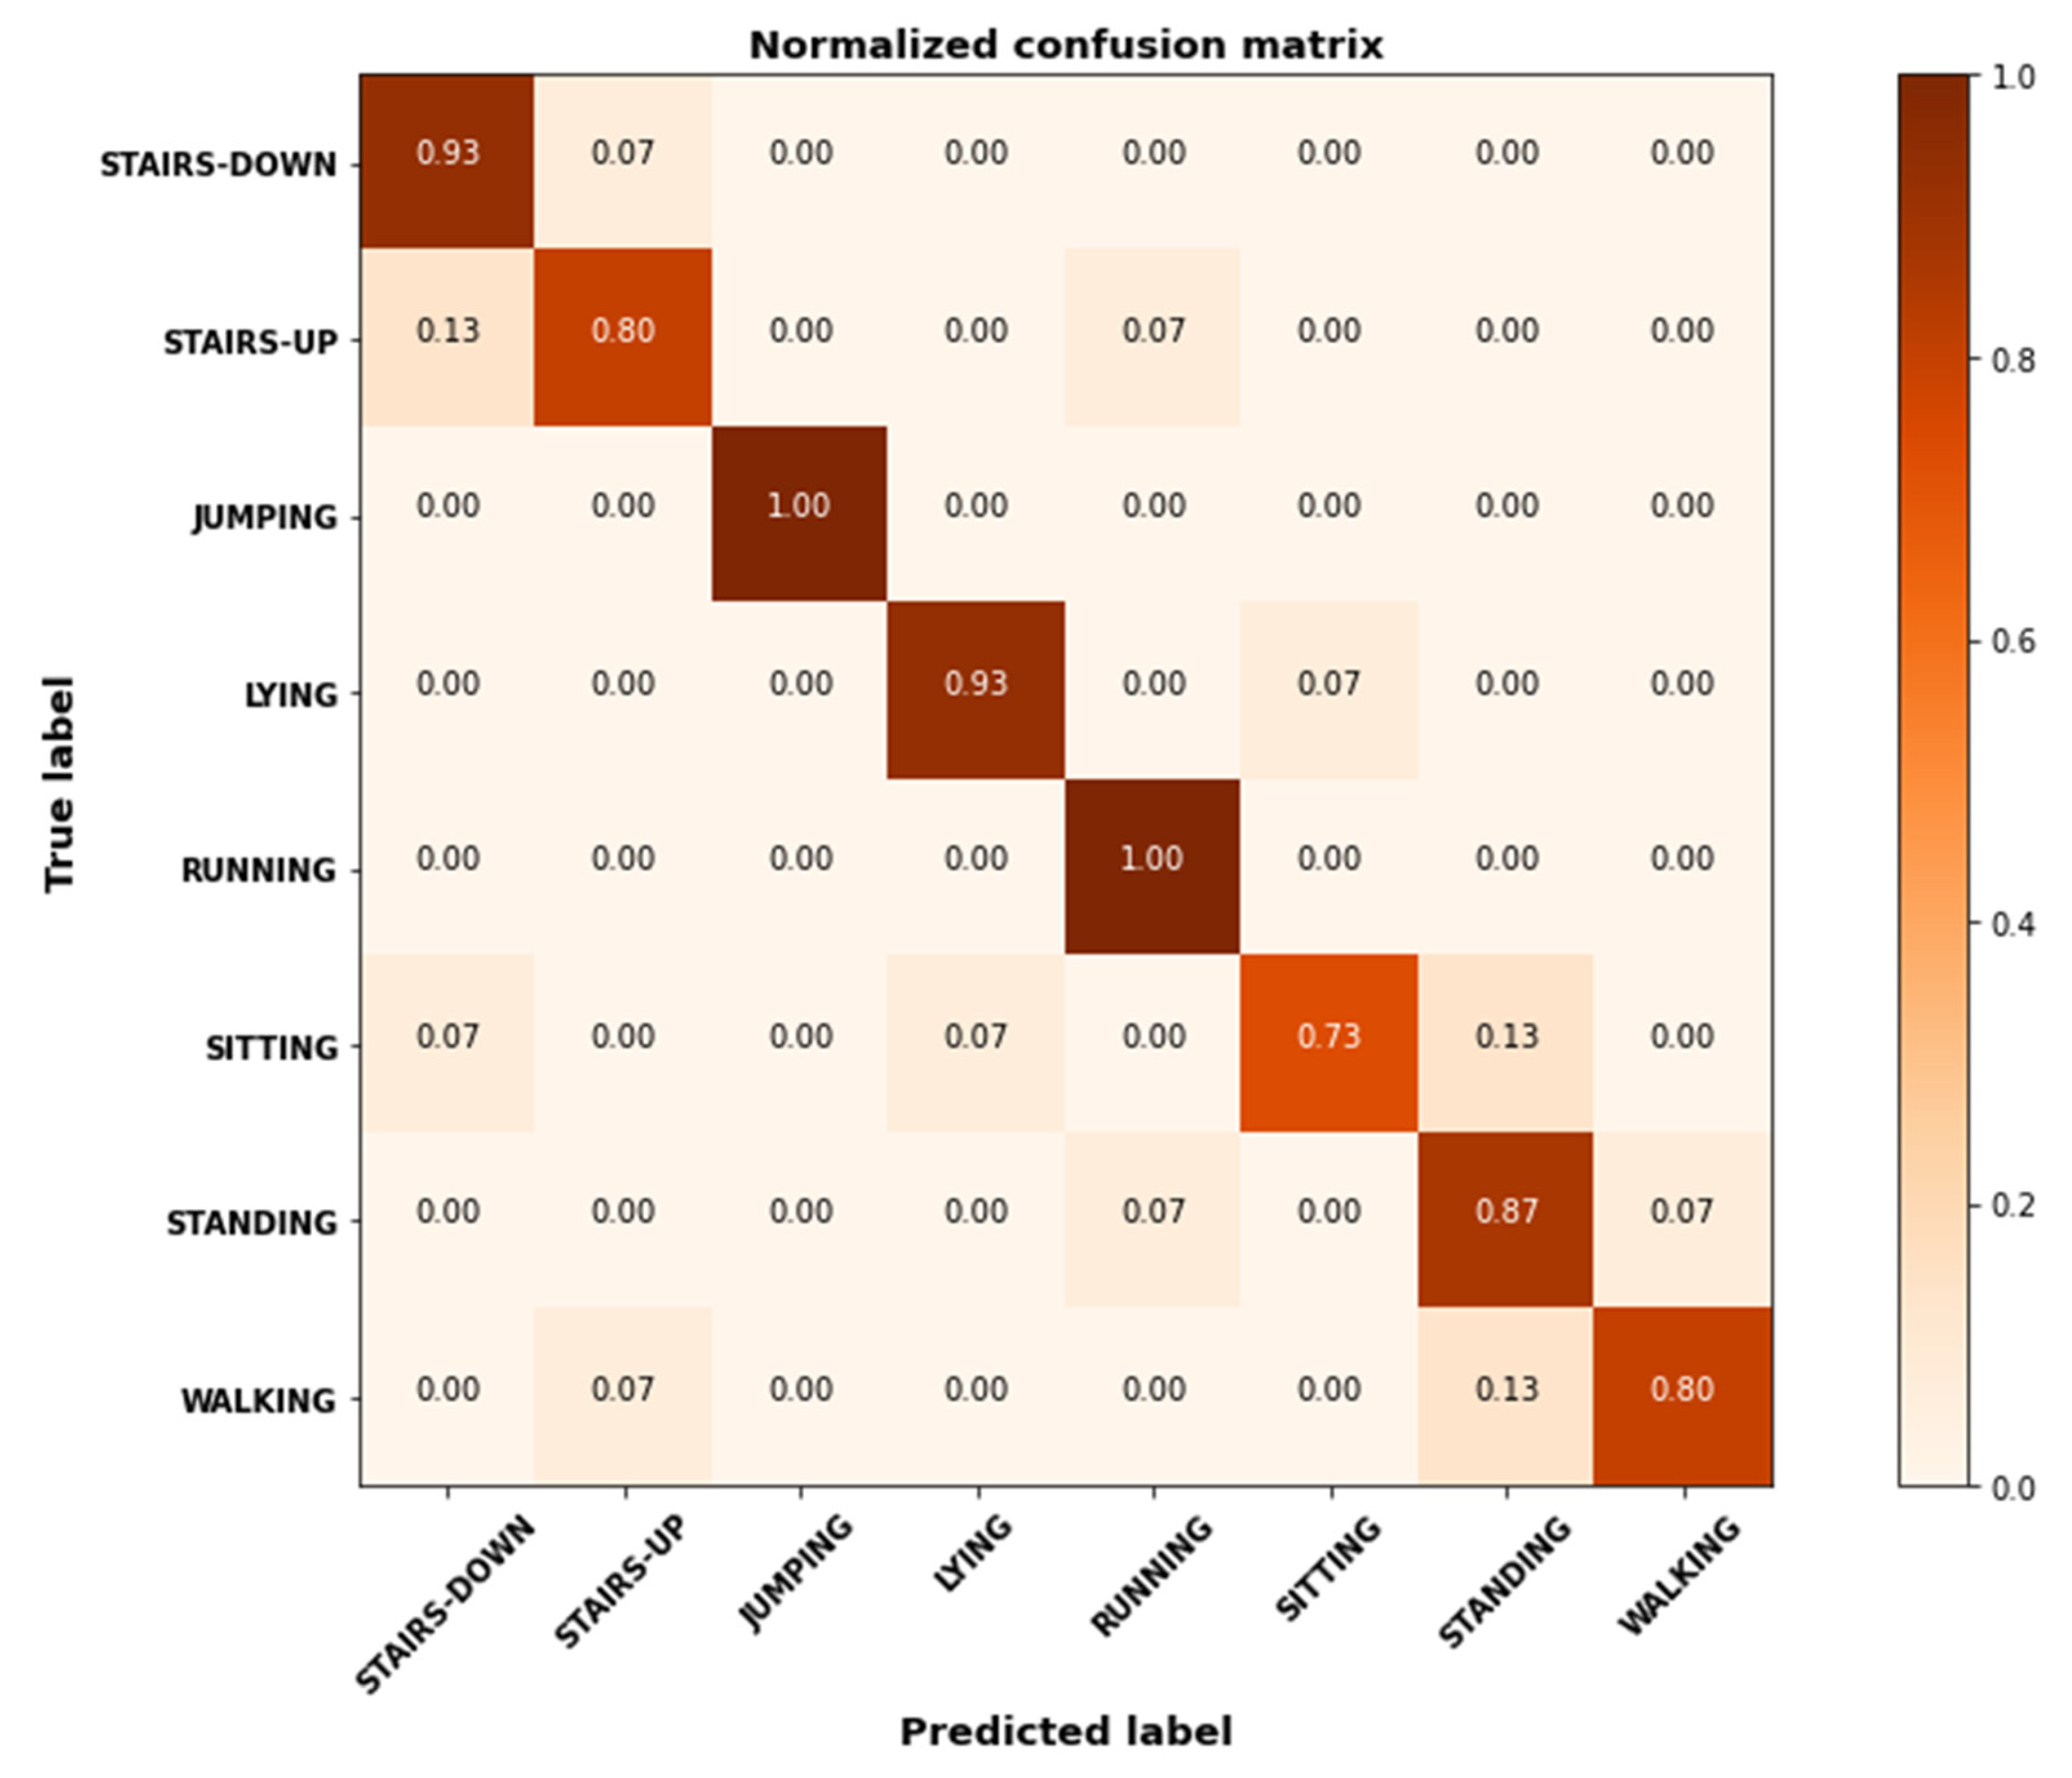
4.3. Experiment II: Individual Locomotion Activity Classification Accuracies
4.4. Experiment III: Comparison with Well-Known Classifiers
4.5. Experiment IV: Comparison with Available State-of-the-Art Techniques
5. Discussion
6. Conclusions
6.1. Research Limitations
6.2. Future Work
Author Contributions
Funding
Conflicts of Interest
References
- Choudhury, N.A.; Moulik, S.; Choudhury, S. Cloud-based Real-time and Remote Human Activity Recognition System using Wearable Sensors. In Proceedings of the 2020 IEEE International Conference on Consumer Electronics—Taiwan (ICCE-Taiwan), Taoyuan, Taiwan, 28–30 September 2020; pp. 1–2. [Google Scholar] [CrossRef]
- Jalal, A.; Lee, S.; Kim, J.; Kim, T. Human activity recognition via the features of labeled depth body parts. In Proceedings of the Smart Homes Health Telematics, Artiminio, Italy, 12–15 June 2012; pp. 246–249. [Google Scholar]
- Jalal, A.; Kim, Y.; Kamal, S.; Farooq, A.; Kim, D. Human daily activity recognition with joints plus body features representation using Kinect sensor. In Proceedings of the IEEE International Conference on Informatics, Electronics and Vision, Fukuoka, Japan, 15–18 June 2015; pp. 1–6. [Google Scholar]
- Damodaran, N.; Schäfer, J. Device Free Human Activity Recognition using WiFi Channel State Information. In Proceedings of the 2019 IEEE SmartWorld, Ubiquitous Intelligence & Computing, Advanced & Trusted Computing, Scalable Computing & Communications, Cloud & Big Data Computing, Internet of People and Smart City Innovation, Leicester, UK, 19–23 August 2019; pp. 1069–1074. [Google Scholar] [CrossRef]
- Jalal, A.; Sharif, N.; Kim, J.T.; Kim, T.-S. Human activity recognition via recognized body parts of human depth silhouettes for residents monitoring services at smart homes. Indoor Built Environ. 2013, 22, 271–279. [Google Scholar] [CrossRef]
- Chelli, A.; Muaaz, M.; Pätzold, M. ActRec: A Wi-Fi-Based Human Activity Recognition System. In Proceedings of the 2020 IEEE International Conference on Communications Workshops (ICC Workshops), Dublin, Ireland, 7–11 June 2020; pp. 1–6. [Google Scholar] [CrossRef]
- Gochoo, M.; Akhter, I.; Jalal, A.; Kim, K. Stochastic remote sensing event classification over adaptive posture estimation via multifused data and deep belief network. Remote Sens. 2021, 13, 912. [Google Scholar] [CrossRef]
- Batool, M.; Jalal, A.; Kim, K. Telemonitoring of Daily Activity Using Accelerometer and Gyroscope in Smart Home Environments. J. Electr. Eng. Technol. 2020, 15, 2801–2809. [Google Scholar] [CrossRef]
- Jalal, A.; Uddin, M.Z.; Kim, T.-S. Depth Video-based Human Activity Recognition System Using Translation and Scaling Invariant Features for Life Logging at Smart Home. IEEE Trans. Consum. Electron. 2012, 58, 863–871. [Google Scholar] [CrossRef]
- Jalal, A.; Quaid, M.A.K.; Sidduqi, M.A. A Triaxial acceleration-based human motion detection for ambient smart home system. In Proceedings of the IEEE International Conference on Applied Sciences and Technology, Islamabad, Pakistan, 8–12 January 2019. [Google Scholar]
- Kim, K.; Jalal, A.; Mahmood, M. Vision-based Human Activity recognition system using depth silhouettes: A Smart home system for monitoring the residents. J. Electr. Eng. Technol. 2019, 14, 2567–2573. [Google Scholar] [CrossRef]
- Tahir, B.; Jalal, A.; Kim, K. Daily life Log Recognition based on Automatic Features for Health care Physical Exercise via IMU Sensors. In Proceedings of the 2021 International Bhurban Conference on Applied Sciences and Technologies (IBCAST), Islamabad, Pakistan, 12–16 January 2021. [Google Scholar]
- Jalal, A.; Kamal, S. Real-Time Life Logging via a Depth Silhouette-based Human Activity Recognition System for Smart Home Services. In Proceedings of the IEEE International Conference on Advanced Video and Signal-based Surveillance, Seoul, Korea, 26–29 August 2014; pp. 74–80. [Google Scholar]
- Jalal, A.; Kamal, S.; Kim, D. A depth video sensor-based life-logging human activity recognition system for elderly care in smart indoor environments. Sensors 2014, 14, 11735–11759. [Google Scholar] [CrossRef]
- Jalal, A.; Quaid, M.A.K.; Hasan, A.S. Wearable Sensor-Based Human Behavior Understanding and Recognition in Daily Life for Smart Environments. In Proceedings of the IEEE conference on International Conference on Frontiers of Information Technology, Islamabad, Pakistan, 17–19 December 2018. [Google Scholar]
- Jalal, A.; Quaid, M.A.; Tahir, S.B.; Kim, K. A study of accelerometer and gyroscope measurements in physical life-log activities detection systems. Sensors 2020, 20, 6670. [Google Scholar]
- Jalal, A.; Batool, M.; Kim, K. Sustainable Wearable System: Human Behavior Modeling for Life-logging Activities Using K-Ary Tree Hashing Classifier. Sustainability 2020, 12, 10324. [Google Scholar] [CrossRef]
- Wei, S.; Wang, J.; Zhao, Z. Poster Abstract: LocTag: Passive WiFi Tag for Robust Indoor Localization via Smartphones. In Proceedings of the IEEE INFOCOM 2020—IEEE Conference on Computer Communications Workshops (INFOCOM WKSHPS), Toronto, ON, Canada, 6–9 July 2020; pp. 1342–1343. [Google Scholar] [CrossRef]
- Madiha, J.; Jalal, A.; Kim, K. Wearable sensors based exertion recognition using statistical features and random forest for physical healthcare monitoring. In Proceedings of the IEEE International Conference on Applied Sciences and Technology, Islamabad, Pakistan, 12–16 January 2021. [Google Scholar]
- Jalal, A.; Batool, M.; Kim, K. Stochastic recognition of physical activity and healthcare using tri-axial inertial wearable sensors. Appl. Sci. 2020, 10, 7122. [Google Scholar] [CrossRef]
- Madiha, J.; Gochoo, M.; Jalal, A.; Kim, K. HF-SPHR: Hybrid features for sustainable physical healthcare pattern recognition using deep belief networks. Sustainability 2021, 13, 1699. [Google Scholar]
- Kalita, S.; Karmakar, A.; Hazarika, S.M. Human Fall Detection during Activities of Daily Living using Extended CORE9. In Proceedings of the 2019 Second International Conference on Advanced Computational and Communication Paradigms (ICACCP), Gangtok, India, 25–28 February 2019; pp. 1–6. [Google Scholar] [CrossRef]
- Golestani, N.; Moghaddam, M. Magnetic Induction-based Human Activity Recognition (MI-HAR). In Proceedings of the 2019 IEEE International Symposium on Antennas and Propagation and USNC-URSI Radio Science Meeting, Atlanta, GA, USA, 7–12 July 2019; pp. 17–18. [Google Scholar] [CrossRef]
- Liu, C.; Ying, J.; Han, F.; Ruan, M. Abnormal Human Activity Recognition using Bayes Classifier and Convolutional Neural Network. In Proceedings of the 2018 IEEE 3rd International Conference on Signal and Image Processing (ICSIP), Shenzhen, China, 13–15 July 2018; pp. 33–37. [Google Scholar] [CrossRef]
- Imran, H.A.; Latif, U. HHARNet: Taking inspiration from Inception and Dense Networks for Human Activity Recognition using Inertial Sensors. In Proceedings of the 2020 IEEE 17th International Conference on Smart Communities: Improving Quality of Life Using ICT, IoT and AI (HONET), Charlotte, NC, USA, 14–16 December 2020; pp. 24–27. [Google Scholar] [CrossRef]
- Hasegawa, T. Smartphone Sensor-Based Human Activity Recognition Robust to Different Sampling Rates. IEEE Sens. J. 2020, 21, 6930–6941. [Google Scholar] [CrossRef]
- Badar, S.; Jalal, A.; Kim, K. Wearable Inertial Sensors for Daily Activity Analysis Based on Adam Optimization and the Maximum Entropy Markov Model. Entropy 2020, 22, 579. [Google Scholar]
- Kamal, S.; Jalal, A.; Kim, D. Depth Images-based Human Detection, Tracking and Activity Recognition Using Spatiotemporal Features and Modified HMM. J. Electr. Eng. Technol. 2016, 11, 1857–1862. [Google Scholar] [CrossRef] [Green Version]
- Quaid, M.A.K.; Jalal, A. Wearable Sensors based Human Behavioral Pattern Recognition using Statistical Features and Reweighted Genetic Algorithm. Multimed. Tools Appl. 2020, 79, 6061–6083. [Google Scholar] [CrossRef]
- Badar, S.; Jalal, A.; Batool, M. Wearable Sensors for Activity Analysis using SMO-based Random Forest over Smart home and Sports Datasets. In Proceedings of the 2020 3rd International Conference on Advancements in Computational Sciences (ICACS), Lahore, Pakistan, 17–19 February 2020. [Google Scholar]
- Jalal, A.; Quaid, M.A.K.; Kim, K. A Wrist Worn Acceleration Based Human Motion Analysis and Classification for Ambient Smart Home System. J. Electr. Eng. Technol. 2019, 14, 1733–1739. [Google Scholar] [CrossRef]
- Gu, F.; Kealy, A.; Khoshelham, K.; Shang, J. User-Independent Motion State Recognition Using Smartphone Sensors. Sensors 2015, 15, 30636–30652. [Google Scholar] [CrossRef]
- Bashar, S.K.; Al Fahim, A.; Chon, K.H. Smartphone Based Human Activity Recognition with Feature Selection and Dense Neural Network. In Proceedings of the 2020 42nd Annual International Conference of the IEEE Engineering in Medicine & Biology Society (EMBC), Montreal, QC, Canada, 20–24 July 2020; pp. 5888–5891. [Google Scholar] [CrossRef]
- Shan, C.Y.; Han, P.Y.; Yin, O.S. Deep Analysis for Smartphone-based Human Activity Recognition. In Proceedings of the 2020 8th International Conference on Information and Communication Technology (ICoICT), Yogyakarta, Indonesia, 24–26 June 2020; pp. 1–5. [Google Scholar] [CrossRef]
- Xie, L.; Tian, J.; Ding, G.; Zhao, Q. Human activity recognition method based on inertial sensor and barometer. In Proceedings of the 2018 IEEE International Symposium on Inertial Sensors and Systems (INERTIAL), Lake Como, Italy, 26–29 March 2018; pp. 1–4. [Google Scholar] [CrossRef]
- Lee, S.-M.; Yoon, S.M.; Cho, H. Human activity recognition from accelerometer data using Convolutional Neural Network. In Proceedings of the 2017 IEEE International Conference on Big Data and Smart Computing (BigComp), Jeju, Korea, 13–16 February 2017; pp. 131–134. [Google Scholar] [CrossRef]
- Azmat, U.; Jalal, A. Smartphone Inertial Sensors for Human Locomotion Activity Recognition based on Template Matching and Codebook Generation. In Proceedings of the 2021 International Conference on Communication Technologies (ComTech), Rawalpindi, Pakistan, 21–22 September 2021; pp. 109–114. [Google Scholar] [CrossRef]
- Mekruksavanich, S.; Jitpattanakul, A. Recognition of Real-life Activities with Smartphone Sensors using Deep Learning Approaches. In Proceedings of the 2021 IEEE 12th International Conference on Software Engineering and Service Science (ICSESS), Beijing, China, 20–22 August 2021; pp. 243–246. [Google Scholar] [CrossRef]
- Su, T.; Sun, H.; Ma, C.; Jiang, L.; Xu, T. HDL: Hierarchical Deep Learning Model based Human Activity Recognition using Smartphone Sensors. In Proceedings of the 2019 International Joint Conference on Neural Networks (IJCNN), Budapest, Hungary, 14–19 July 2019; pp. 1–8. [Google Scholar] [CrossRef]
- Guo, X.; Hu, X.; Ye, X.; Hu, C.; Song, C.; Wu, H. Human Activity Recognition Based on Two-Dimensional Acoustic Arrays. In Proceedings of the 2018 IEEE International Ultrasonics Symposium (IUS), Kobe, Japan, 22–25 October 2018; pp. 1–4. [Google Scholar] [CrossRef]
- Tripathi, A.M.; Baruah, D.; Baruah, R.D. Acoustic sensor based activity recognition using ensemble of one-class classifiers. In Proceedings of the 2015 IEEE International Conference on Evolving and Adaptive Intelligent Systems (EAIS), Douai, France, 1–3 December 2015; pp. 1–7. [Google Scholar] [CrossRef]
- She, D.; Lou, X.; Ye, W. RadarSpecAugment: A Simple Data Augmentation Method for Radar-Based Human Activity Recognition. IEEE Sens. Lett. 2021, 5, 1–4. [Google Scholar] [CrossRef]
- Kim, Y.; Moon, T. Human detection and activity classification based on microDoppler signatures using deep convolutional neural networks. Remote Sens. Lett. 2015, 13, 8–12. [Google Scholar] [CrossRef]
- Szegedy, C.; Ioffe, S.; Vanhoucke, V.; Alemi, A. Inception-v4, inception–ResNet and the impact of residual connections on learning. In Proceedings of the Thirty-First AAAI Conference on Artificial Intelligence, San Francisco, CA, USA, 4–9 February 2017; Volume 3. [Google Scholar]
- Jordan, T.S. Using convolutional neural networks for human activity classification on micro-Doppler radar spectrograms. In Proceedings of the SPIE DEFENSE + SECURITY, Baltimore, MD, USA, 17–21 April 2016; p. 9825. [Google Scholar]
- Du, H.; He, Y.; Jin, T. Transfer learning for human activities classification using micro-Doppler spectrograms. In Proceedings of the 2018 IEEE International Conference on Computational Electromagnetics (ICCEM), Chengdu, China, 26–28 March 2018; pp. 1–3. [Google Scholar]
- Zhu, J.; Chen, H.; Ye, W. A hybrid CNN–LSTM network for the classification of human activities based on micro-Doppler radar. IEEE Access 2020, 8, 24713–24720. [Google Scholar] [CrossRef]
- Li, X.; He, Y.; Fioranelli, F.; Jing, X. Semisupervised Human Activity Recognition With Radar Micro-Doppler Signatures. IEEE Trans. Geosci. Remote Sens. 2021, 60, 1–12. [Google Scholar] [CrossRef]
- Parvez, S.; Sakib, N.; Mollah, M.N. Chebyshev type-I low pass filter using annular ring resonator: A comparative performance analysis for different substrates. In Proceedings of the 2016 9th International Conference on Electrical and Computer Engineering (ICECE), Dhaka, Bangladesh, 20–22 December 2016; pp. 182–185. [Google Scholar] [CrossRef]
- Puterka, B.; Kacur, J.; Pavlovicova, J. Windowing for Speech Emotion Recognition. In Proceedings of the 2019 International Symposium ELMAR, Zadar, Croatia, 23–25 September 2019; pp. 147–150. [Google Scholar]
- Baykara, M.; Abdulrahman, A. Seizure detection based on adaptive feature extraction by applying extreme learning machines. Traitement Signal 2021, 38, 331–340. [Google Scholar] [CrossRef]
- Bono, R.; Arnau, J.; Alarcón, R.; Blanca-Mena, M.J. Bias, Precision, and Accuracy of Skewness and Kurtosis Estimators for Frequently Used Continuous Distributions. Symmetry 2020, 12, 19. [Google Scholar] [CrossRef] [Green Version]
- Jalal, A.; Ahmed, A.; Rafique, A.; Kim, K. Scene Semantic recognition based on modified Fuzzy c-mean and maximum entropy using object-to-object relations. IEEE Access 2021, 9, 27758–27772. [Google Scholar] [CrossRef]
- Mazumder, I. An Analytical Approach of EEG Analysis for Emotion Recognition. In Proceedings of the 2019 Devices for Integrated Circuit (DevIC), Kalyani, India, 23–24 March 2019; pp. 256–260. [Google Scholar]
- Jalal, A.; Batool, M.; Tahir, B. Markerless sensors for physical health monitoring system using ECG and GMM feature extraction. In Proceedings of the 2021 International Bhurban Conference on Applied Sciences and Technologies (IBCAST), Islamabad, Pakistan, 12–16 January 2021; pp. 340–345. [Google Scholar]
- Kamal, S.; Jalal, A. A hybrid feature extraction approach for human detection, tracking and activity recognition using depth sensors. Arab. J. Sci. Eng. 2016, 41, 1043–1051. [Google Scholar] [CrossRef]
- Jalal, A.; Kamal, S.; Farooq, A.; Kim, D. A spatiotemporal motion variation features extraction approach for human tracking and pose-based action recognition. In Proceedings of the IEEE International Conference on Informatics, electronics and vision, Fukuoka, Japan, 15–18 June 2015. [Google Scholar]
- Jalal, A.; Kamal, S.; Kim, D. Depth Silhouettes Context: A new robust feature for human tracking and activity recognition based on embedded HMMs. In Proceedings of the 12th IEEE International Conference on Ubiquitous Robots and Ambient Intelligence, Goyangi, Korea, 28–30 October 2015; pp. 294–299. [Google Scholar]
- Jalal, A.; Kim, Y.-H.; Kim, Y.-J.; Kamal, S.; Kim, D. Robust human activity recognition from depth video using spatiotemporal multi-fused features. Pattern Recognit. 2017, 61, 295–308. [Google Scholar] [CrossRef]
- Jalal, A.; Kamal, S.; Kim, D. Human depth sensors-based activity recognition using spatiotemporal features and hidden markov model for smart environments. J. Comput. Netw. Commun. 2016, 2016, 8087545. [Google Scholar] [CrossRef] [Green Version]
- Jalal, A.; Kamal, S.; Kim, D. Facial Expression recognition using 1D transform features and Hidden Markov Model. J. Electr. Eng. Technol. 2017, 12, 1657–1662. [Google Scholar]
- Jalal, A.; Kamal, S.; Kim, D. A depth video-based human detection and activity recognition using multi-features and embedded hidden Markov models for health care monitoring systems. Int. J. Interact. Multimed. Artif. Intell. 2017, 4, 54–62. [Google Scholar] [CrossRef] [Green Version]
- Jalal, A.; Mahmood, M.; Sidduqi, M.A. Robust spatio-temporal features for human interaction recognition via artificial neural network. In Proceedings of the IEEE conference on International Conference on Frontiers of Information Technology, Islamabad, Pakistan, 17–19 December 2018. [Google Scholar]
- Ntakolia, C.; Kokkotis, C.; Moustakidis, S.P.; Tsaopoulos, D. Identification of most important features based on a fuzzy ensemble technique: Evaluation on joint space narrowing progression in knee osteoarthritis patients. Int. J. Med. Inform. 2021, 156, 104614. [Google Scholar] [CrossRef]
- Abbas, S.A.; Aslam, A.; Rehman, A.U.; Abbasi, W.A.; Arif, S.; Kazmi, S.Z.H. K-Means and K-Medoids: Cluster Analysis on Birth Data Collected in City Muzaffarabad, Kashmir. IEEE Access 2020, 8, 151847–151855. [Google Scholar] [CrossRef]
- Gaikwad, N.B.; Tiwari, V.; Keskar, A.; Shivaprakash, N.C. Efficient FPGA Implementation of Multilayer Perceptron for Real-Time Human Activity Classification. IEEE Access 2019, 7, 26696–26706. [Google Scholar] [CrossRef]
- Sztyler, T.; Stuckenschmidt, H. On-body localization of wearable devices: An investigation of position-aware activity recognition. In Proceedings of the 2016 IEEE International Conference on Pervasive Computing and Communications (PerCom), Sydney, Australia, 14–19 March 2016; pp. 1–9. [Google Scholar]
- Sztyler, T.; Stuckenschmidt, H. Online personalization of crosssubjects based activity recognition models on wearable devices. In Proceedings of the 2017 IEEE International Conference on Pervasive Computing and Communications (PerCom), Kona, HI, USA, 13–17 March 2017; pp. 180–189. [Google Scholar]
- Ordóñez, F.J.; Roggen, D. Deep convolutional and LSTM recurrent neural networks for multimodal wearable activity recognition. Sensors 2016, 16, 115. [Google Scholar] [CrossRef] [Green Version]
- Hur, T.; Bang, J.; Huynh-The, T.; Lee, J.; Kim, J.-I.; Lee, S. Iss2Image: A novel signal-encoding technique for CNN-based human activity recognition. Sensors 2018, 18, 3910. [Google Scholar] [CrossRef] [Green Version]
- Ferrari, A.; Micucci, D.; Mobilio, M.; Napoletano, P. Hand-crafted Features vs Residual Networks for Human Activities Recognition using Accelerometer. In Proceedings of the 2019 IEEE 23rd International Symposium on Consumer Technologies (ISCT), Ancona, Italy, 19–21 June 2019; pp. 153–156. [Google Scholar]
- Casilari, E.; Lora-Rivera, R.; García-Lagos, F. A Study on the Application of Convolutional Neural Networks to Fall Detection Evaluated with Multiple Public Datasets. Sensors 2020, 20, 1466. [Google Scholar] [CrossRef] [Green Version]
- Colon, L.N.V.; de la Hoz, Y.; Labrador, M. Human fall detection with smartphones. In Proceedings of the 2014 IEEE Latin-America Conference on Communications (LATINCOM), Cartagena, Colombia, 5–7 November 2014; pp. 1–7. [Google Scholar]
- Garcia-Gonzalez, D.; Rivero, D.; Fernandez-Blanco, E.; Luaces, M.R. A public domain dataset for real-life human activity recognition using smartphone sensors. Sensors 2020, 20, 2200. [Google Scholar] [CrossRef] [Green Version]


| Feature | Description | Formulation |
|---|---|---|
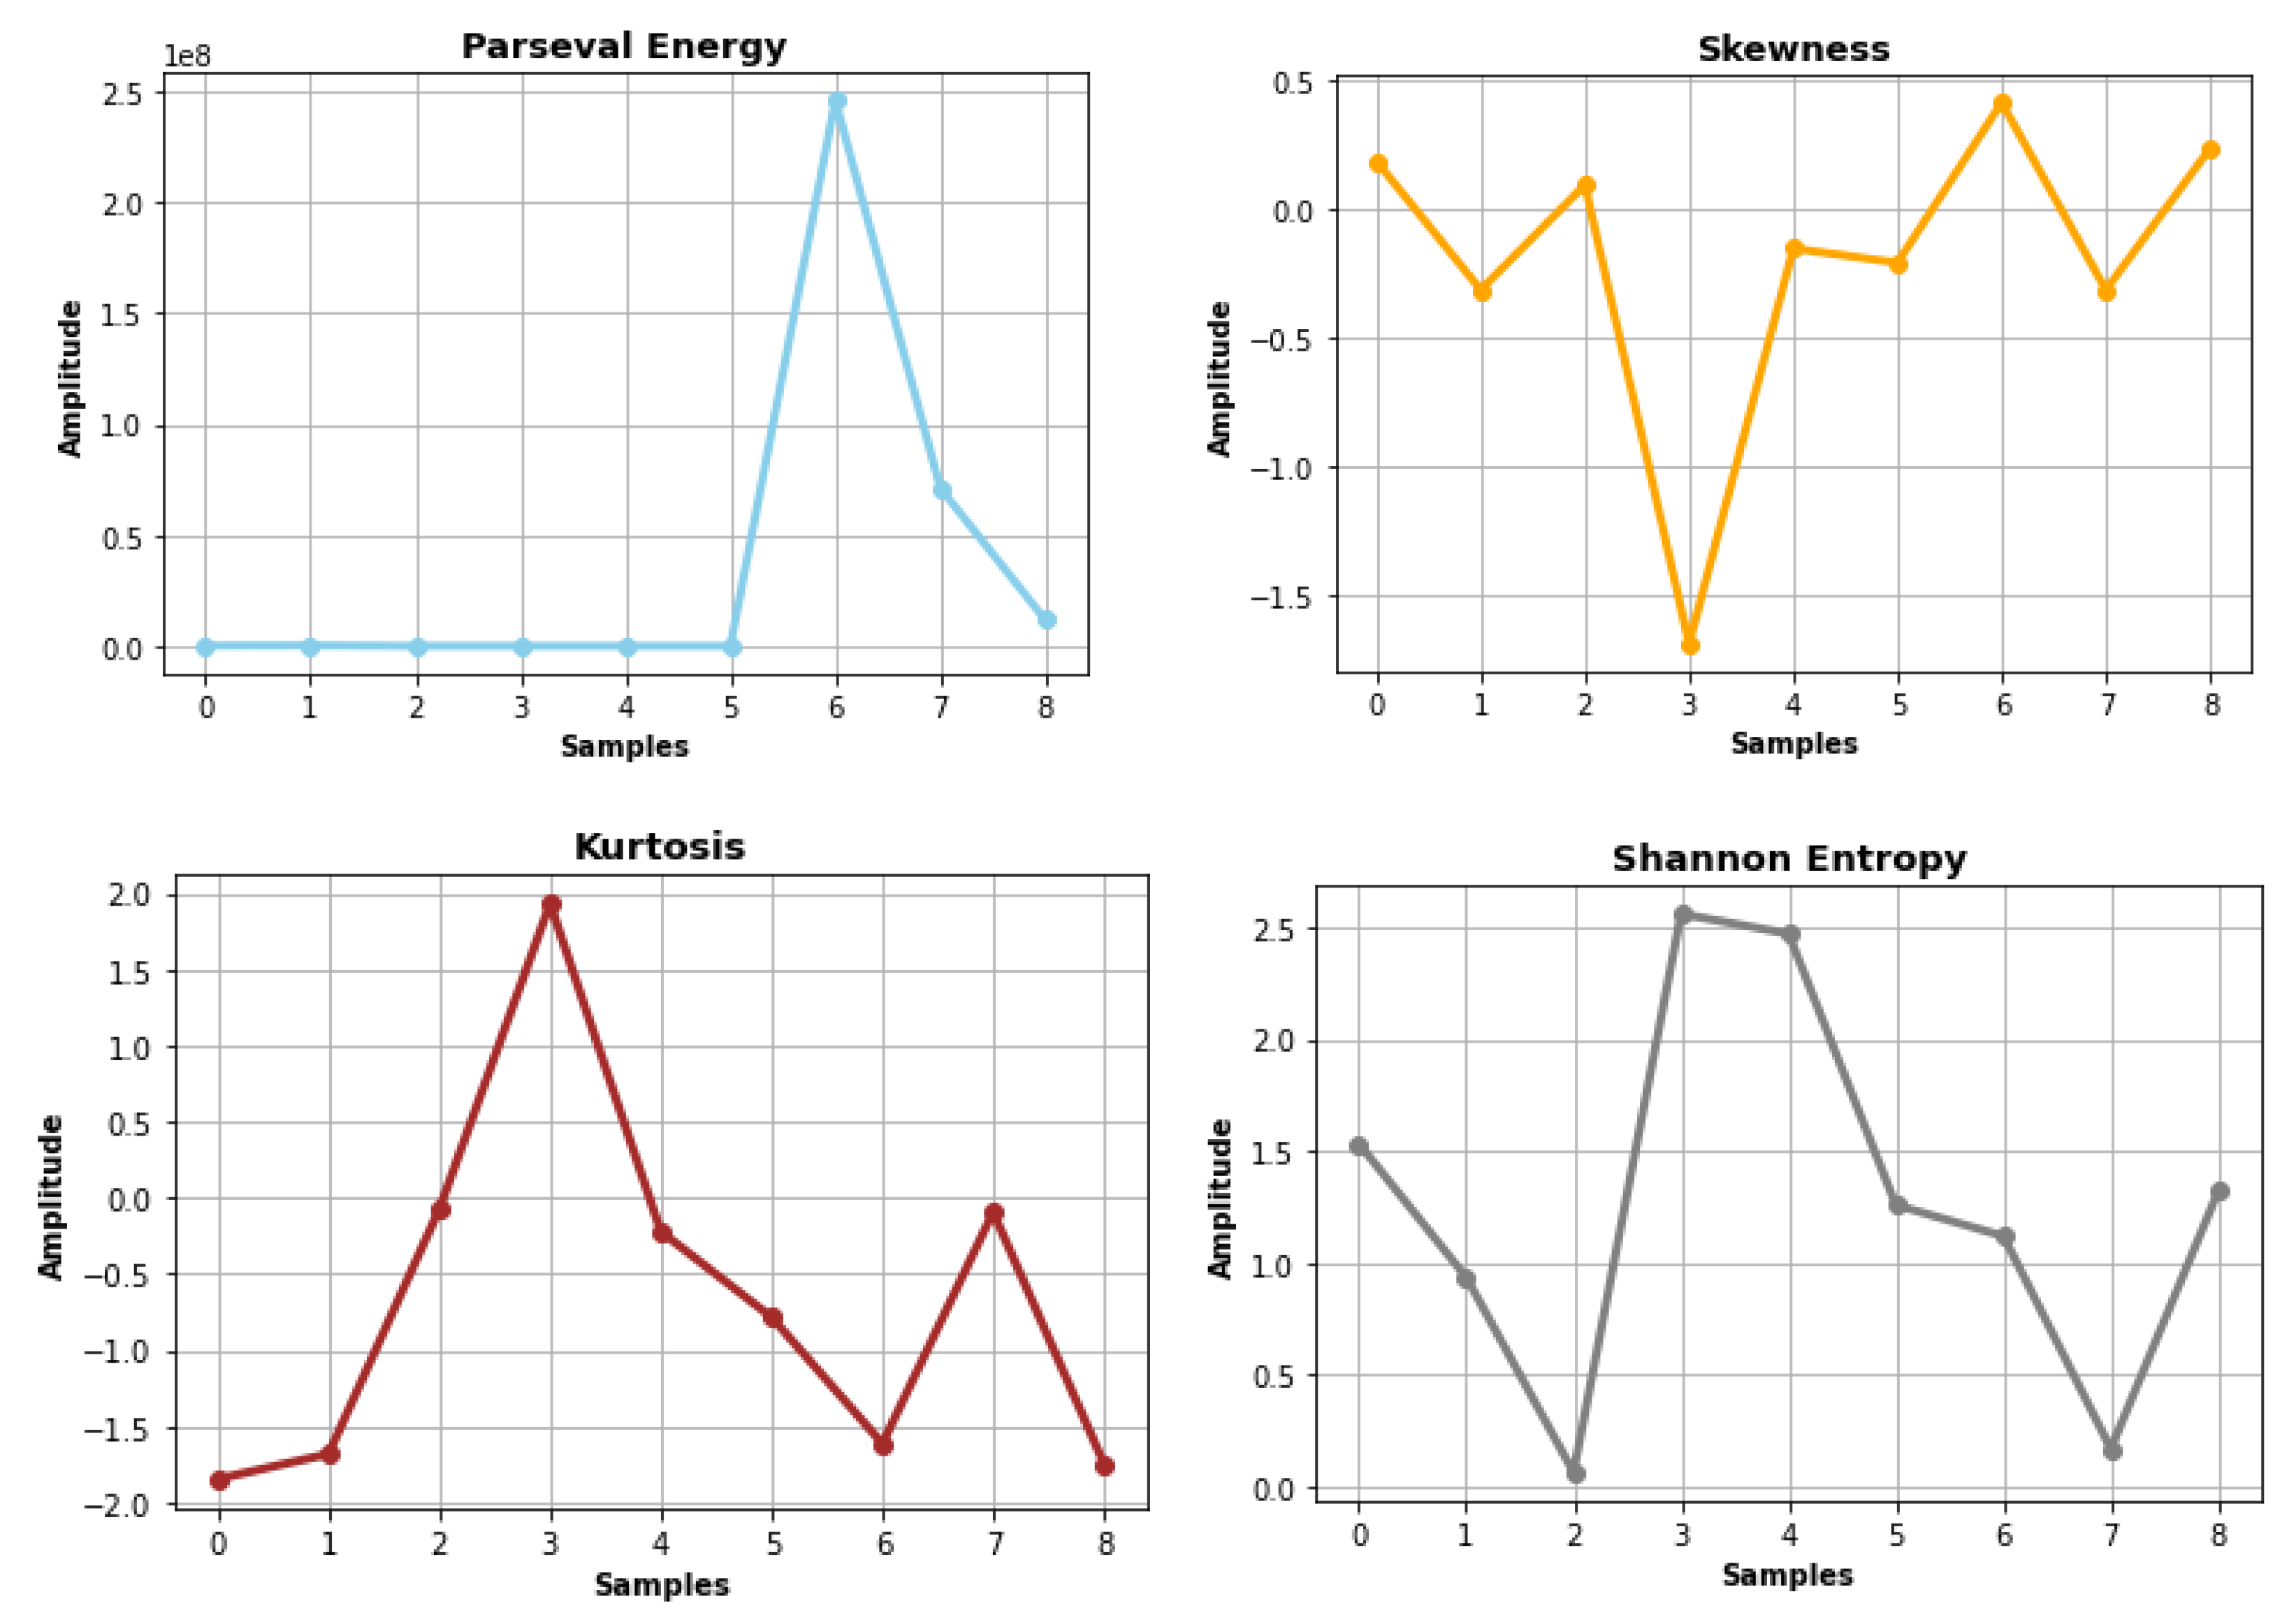
| Parseval’s Energy [43] | Energy of the signal in time domain is equal to the energy of the signal in frequency domain (Parseval Theorem). | |
| Skewness [44] | It is a measure of the symmetry of a distribution. | |
| Kurtosis [44] | It compares the tails of the distribution to the tails of a distribution. | |
| Shannon Entropy [45] | It is the expected amount of information in an instance of the distribution. | |
| AR-Coefficients [46] | These are the auto-regressive coefficients of a distribution. |
| Serial No. | MobiAct_v2.0 | Real-World HAR | Real-Life HAR |
|---|---|---|---|
| 1 | Walking | Stairs Climb-up | Inactive |
| 2 | Stairs-up | Stairs Climb-down | Active |
| 3 | Stairs-down | Jumping | Walking |
| 4 | Stand-to-sit | Lying | Driving |
| 5 | Sit-to-stand | Running | - |
| 6 | Car step-in | Sitting | - |
| 7 | Car step-out | Standing | - |
| 8 | Jogging | Walking | - |
| 9 | Jumping | - | - |
| 10 | Standing | - | - |
| 11 | Sitting | - | - |
| 12 | Forward lying | - | - |
| 13 | Back-sitting chair | - | - |
| 14 | Front-knees lying | - | - |
| 15 | Sideward lying | - | - |
| Activity Classes | K-Nearest Neighbors (KNN) | AdaBoost | Multilayer Perceptron | ||||||
|---|---|---|---|---|---|---|---|---|---|
| Activities | Precision | Recall | F1-Score | Precision | Recall | F1-Score | Precision | Recall | F1-Score |
| WAL | 0.95 | 0.90 | 0.92 | 0.52 | 0.52 | 0.52 | 0.95 | 0.97 | 0.96 |
| STU | 0.82 | 0.83 | 0.83 | 0.33 | 0.69 | 0.45 | 0.89 | 0.88 | 0.88 |
| STN | 0.82 | 0.89 | 0.85 | 0.34 | 0.29 | 0.32 | 0.87 | 0.89 | 0.88 |
| SCH | 0.92 | 0.96 | 0.94 | 0.19 | 0.99 | 0.32 | 0.98 | 0.98 | 0.98 |
| CHU | 0.97 | 0.98 | 0.98 | 0.00 | 0.00 | 0.00 | 0.99 | 0.95 | 0.97 |
| CSI | 0.95 | 0.96 | 0.96 | 0.00 | 0.00 | 0.00 | 0.97 | 0.97 | 0.97 |
| CSO | 1.00 | 0.98 | 0.99 | 0.52 | 0.07 | 0.13 | 0.98 | 0.99 | 0.99 |
| FOL | 0.42 | 0.52 | 0.46 | 0.00 | 0.00 | 0.00 | 0.69 | 0.68 | 0.68 |
| BSC | 0.85 | 0.66 | 0.75 | 0.00 | 0.00 | 0.00 | 0.84 | 0.86 | 0.85 |
| FKL | 0.49 | 0.48 | 0.49 | 0.00 | 0.00 | 0.00 | 0.70 | 0.70 | 0.70 |
| SDL | 0.80 | 0.74 | 0.77 | 0.00 | 0.00 | 0.00 | 0.84 | 0.85 | 0.85 |
| JOG | 0.89 | 0.91 | 0.90 | 0.00 | 0.00 | 0.00 | 0.94 | 0.95 | 0.95 |
| JUM | 0.91 | 0.81 | 0.86 | 0.50 | 0.05 | 0.09 | 0.94 | 0.94 | 0.94 |
| STD | 0.96 | 0.83 | 0.89 | 0.60 | 0.05 | 0.09 | 0.95 | 0.90 | 0.92 |
| SIT | 1.00 | 0.63 | 0.77 | 0.25 | 0.95 | 0.39 | 1.00 | 0.74 | 0.85 |
| Mean | 0.85 | 0.81 | 0.82 | 0.25 | 0.24 | 0.15 | 0.90 | 0.88 | 0.89 |
| Activity Classes | K-Nearest Neighbors (KNN) | AdaBoost | Multilayer Perceptron | ||||||
|---|---|---|---|---|---|---|---|---|---|
| Activities | Precision | Recall | F1-Score | Precision | Recall | F1-Score | Precision | Recall | F1-Score |
| STDN | 0.58 | 0.93 | 0.72 | 0.38 | 0.67 | 0.49 | 0.87 | 0.87 | 0.87 |
| STUP | 0.58 | 0.93 | 0.72 | 0.16 | 0.20 | 0.18 | 0.86 | 0.80 | 0.83 |
| JUM | 1.00 | 1.00 | 1.00 | 0.57 | 0.53 | 0.55 | 1.00 | 1.00 | 1.00 |
| LY | 1.00 | 0.93 | 0.97 | 0.50 | 0.47 | 0.48 | 1.00 | 1.00 | 1.00 |
| RUN | 0.81 | 0.87 | 0.84 | 1.00 | 0.60 | 0.75 | 0.88 | 1.00 | 0.94 |
| SIT | 1.00 | 0.47 | 0.64 | 0.32 | 0.40 | 0.35 | 1.00 | 0.93 | 0.97 |
| STD | 0.67 | 0.53 | 0.59 | 0.16 | 0.20 | 0.18 | 0.72 | 0.87 | 0.79 |
| WAL | 0.62 | 0.33 | 0.43 | 0.00 | 0.00 | 0.00 | 0.92 | 0.73 | 0.81 |
| Mean | 0.78 | 0.75 | 0.74 | 0.39 | 0.38 | 0.37 | 0.91 | 0.90 | 0.90 |
| Activity Classes | K-Nearest Neighbors (KNN) | AdaBoost | Multilayer Perceptron | ||||||
|---|---|---|---|---|---|---|---|---|---|
| Activities | Precision | Recall | F1-Score | Precision | Recall | F1-Score | Precision | Recall | F1-Score |
| WAL | 1.00 | 0.84 | 0.91 | 0.53 | 1.00 | 0.69 | 1.00 | 0.95 | 0.97 |
| INAC | 0.79 | 1.00 | 0.88 | 1.00 | 1.00 | 1.00 | 0.95 | 1.00 | 0.97 |
| ACT | 1.00 | 0.74 | 0.85 | 1.00 | 0.16 | 0.27 | 1.00 | 0.95 | 0.97 |
| DRI | 0.86 | 1.00 | 0.93 | 1.00 | 0.95 | 0.97 | 0.95 | 1.00 | 0.97 |
| Mean | 0.91 | 0.90 | 0.89 | 0.88 | 0.78 | 0.73 | 0.98 | 0.98 | 0.97 |
| Author/Method | Mean Accuracy % | ||
|---|---|---|---|
| MobiAct_v2.0 | Real-World HAR | Real-Life HAR | |
| RF + Position Unaware [67] | - | 80.2 | - |
| Personalized Cross-Subject [68] | - | 83.1 | - |
| RF + Position Aware [67] | - | 83.4 | - |
| Signal Visualization + CNN [69] | - | 92.4 | - |
| Iss2Image + CNN [70] | - | 93.8 | - |
| Support Vector Machine [71] | 77.9 | - | - |
| CNN [72] | 80.7 | - | - |
| Threshold [73] | 81.3 | - | - |
| SVM + Acc. + GPS [74] | - | - | 60.1 |
| SVM + Acc. + GPS + Magn. [74] | - | - | 62.6 |
| SVM + Acc. + GPS + Magn. + Gyro. [74] | - | - | 67.2 |
| Att-CNN-LSTM + Magn. [38] | - | - | 70.3 |
| Att-CNN-LSTM + Gyro. [38] | - | - | 95.2 |
| Att-CNN-LSTM + Acc. [38] | - | - | 95.7 |
| Proposed | 84.5 | 94.2 | 95.9 |
Publisher’s Note: MDPI stays neutral with regard to jurisdictional claims in published maps and institutional affiliations. |
© 2022 by the authors. Licensee MDPI, Basel, Switzerland. This article is an open access article distributed under the terms and conditions of the Creative Commons Attribution (CC BY) license (https://creativecommons.org/licenses/by/4.0/).
Share and Cite
Azmat, U.; Ghadi, Y.Y.; Shloul, T.a.; Alsuhibany, S.A.; Jalal, A.; Park, J. Smartphone Sensor-Based Human Locomotion Surveillance System Using Multilayer Perceptron. Appl. Sci. 2022, 12, 2550. https://doi.org/10.3390/app12052550
Azmat U, Ghadi YY, Shloul Ta, Alsuhibany SA, Jalal A, Park J. Smartphone Sensor-Based Human Locomotion Surveillance System Using Multilayer Perceptron. Applied Sciences. 2022; 12(5):2550. https://doi.org/10.3390/app12052550
Chicago/Turabian StyleAzmat, Usman, Yazeed Yasin Ghadi, Tamara al Shloul, Suliman A. Alsuhibany, Ahmad Jalal, and Jeongmin Park. 2022. "Smartphone Sensor-Based Human Locomotion Surveillance System Using Multilayer Perceptron" Applied Sciences 12, no. 5: 2550. https://doi.org/10.3390/app12052550
APA StyleAzmat, U., Ghadi, Y. Y., Shloul, T. a., Alsuhibany, S. A., Jalal, A., & Park, J. (2022). Smartphone Sensor-Based Human Locomotion Surveillance System Using Multilayer Perceptron. Applied Sciences, 12(5), 2550. https://doi.org/10.3390/app12052550