1. Introduction
Laser thermal hardening is a recent technique that has been effectively used to harden the surface layers of metallic materials [
1,
2,
3]. During the thermal hardening of metals and alloys, the heating of the required area of the irradiation surface causes instant cooling due to the removal of heat from the internal cold layers of the metal. The reduction in the additional processing volume of the material, the absence of a separate cooling process, and the ability to minimize inhomogeneous three-dimensional parts and complex geometries are the main advantages of this process over other common techniques, making it suitable for numerous industrial applications [
4,
5,
6,
7]. Dinesh et al. [
8] investigated laser hardening, identifying its advantages over conventional hardening techniques.
Recent advances in laser technologies have given rise to new research insights [
9,
10,
11]. The increased capacity of data processing in real time has allowed the updating of the laser radiation parameters during the thermal hardening phase, significantly improving the robotic systems above all as to the positioning and speed of the pieces in industrial applications. Indeed, the automatic and proportional adjustment of the irradiation power avoids unwanted overheating, which would affect the results of the thermal hardening process.
The hardening and tempering of steel tools, on the one hand, improve the mechanical properties of the microstructure; on the other hand, they determine the final residual stresses and the ultimate dimensions of the piece [
12,
13]. Some microstructural investigations performed on hardened materials have revealed a close link between microstructure, micromagnetic parameters, and wear rate [
14,
15,
16]. Due to the physical interaction of the microstructure with the magnetic field, significant changes in the microstructure have been observed. These were associated with wear, such as phase transformation and development of residual stresses. Finally, recent research has correlated internal stresses and distortions with the thermo–mechanical–metallurgical interactions that occur during heat treatment [
17,
18,
19].
By analyzing the influence that some robotic process parameters have on the geometry of the final microstructures and on the surface roughness of heat-treated materials, this research work aims to improve the laser processing of these materials through the application of robotic technologies. Special attention was focused on robot laser hardening (RLH), which makes it possible to produce many welding configurations accurately by continuously varying both the angles relative to the shaping of the laser beam with the piece and the surface temperature during heat treatments.
In the present study, it has been assumed that the microstructure of laser-hardened materials depends on complex structural geometry and the modeling of this complexity can be performed through fractal geometry [
20].
Recent studies show that fractal geometry can be successfully applied to describe fracture surfaces on various engineering materials (concrete, steel, etc.), molybdenum, and rocks, but also on composite materials in different length scale ranges and even in plasmonic metamaterials [
21].
Numerous independent process parameters, such as laser power, laser beam speed and temperature, laser beam impact angles, etc., determine the geometric complexity of the microstructure. Since each of these parameters is related in a different way to the surface properties of the material (in particular to hardness, wear resistance, and residual stresses), it is difficult to identify their effects on complexity. In this regard, some authors have shown in previous research work that hardness increases with temperature at low speed [
22]. However, they have not found a direct relationship between temperature and complexity. Nevertheless, the adoption of suitable machine learning (ML) algorithms, which make it possible to predict hardness values comparable to experimental ones, highlighted a strong correlation between complexity and hardness. Therefore, the evaluation of the complexity of the microstructure is an important step to characterize the surface properties of materials, without having to resort to experimental investigations, which are time-consuming and entail higher costs.
Fractal dimension (FD), which was first used by F. Hausdorff as an indicator of complexity, constitutes the topological invariant of each fractal structure, a special type of symmetry, expressed by a non-integer, and a fraction rather than a whole number in many fields of natural and technological sciences [
23,
24,
25,
26,
27,
28].
In our study, a replicable procedure based on the calculation of the FD complexity index was developed to evaluate the complex geometry of the microstructures of RLH materials when the process parameters change, yielding results in keeping with experimental data. The study is divided into the following five sections:
Section 1 describes a survey on recent scientific research concerning laser thermal hardening and its effects on the surface microstructures. In this section the authors specified assumptions and the aim of the work.
Section 2 shows in detail the instruments and methods used to perform the experimental tests, describing the process parameters (laser beam velocity, surface temperature, and impact angle) investigated and the calculation of the FD complexity index.
Section 3 is dedicated to the explanation of the method used to predict the complexity factor, through the proposal of a new equation synthesizing the genetic programming model. The computational model, which is derived from the genetic programming approach and adopted to model the data, is described. A preliminary study of the surface roughness was carried out, resulting in its strong correlation with complex surface microstructures.
Section 4 is focused on the statistical analysis of the data: the repeatability of the calculated complexity method was proved and a valid correspondence between calculated and predicted values was found.
Section 5 summarizes the main results obtained, highlighting the limits of the fractal-based analysis in practical applications and also identifying further insights into the proposed methodology.
2. Materials and Methods
Below (
Section 2.1), the experimental setup used for the steel-RLH surface microstructure analysis is illustrated. In
Section 2.2, the methodology follows, based on SEM image analysis through genetic programming. Finally, in
Section 3, the development of the intelligent system based on genetic programming for the prediction of RLH complex structural geometry is described.
2.1. Experimental Setup
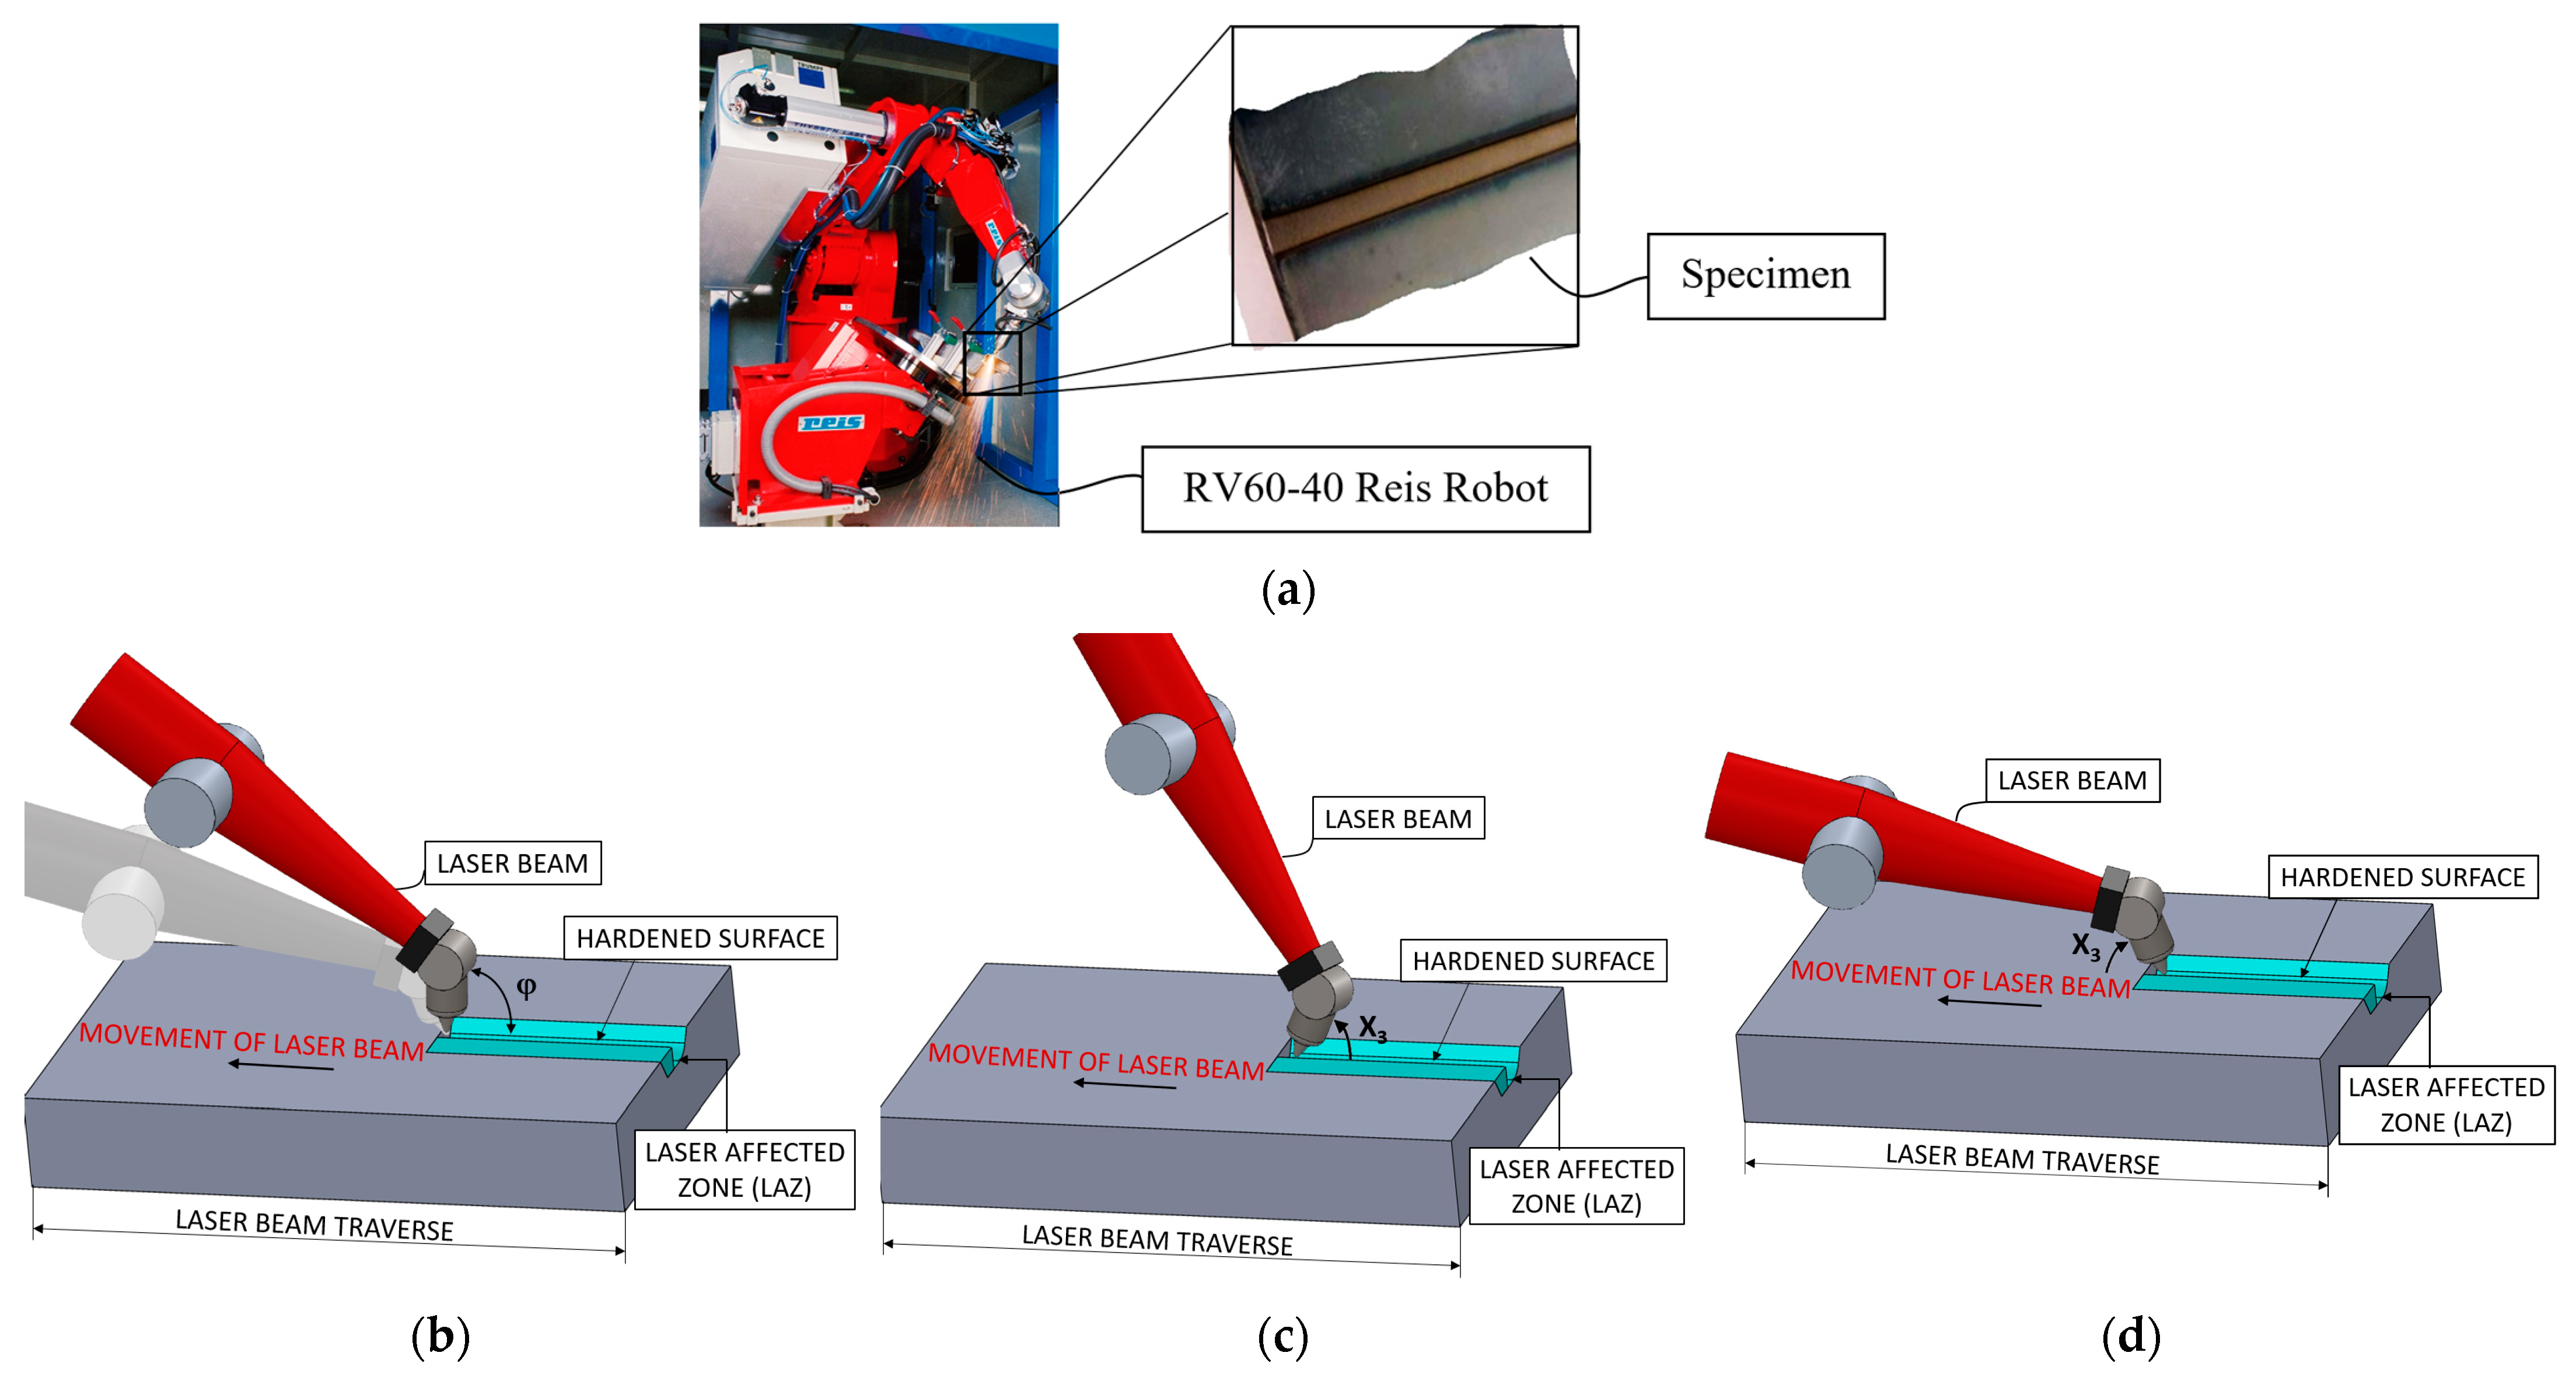
As far as the procedure followed in the research work is concerned, a laser cell, equipped with an RV60-40 robot (produced by Reis Robotics Company, KUKA AG, Zugspitzstraße 140, 86165 Augsburg, Germany) (
Figure 1a) was used to harden steel standard tools labeled EN 100083-1. The maximum power of the laser cell was 3000 W. Several dozens of specimens were hardened with an output constant power of 1500 W, with spot size 8 × 13 mm. This controls the position of the laser head and, consequently, the orientation of the laser beam of the diode laser source. The advantage of the source used was that the manufacturing cell was characterized by a thermal scanner by means of which the surface temperature produced in the heat treatment process was detected and accurately measured. In this way, all the specific process parameters studied were controlled during tests. The parameters analyzed in the study and their variations were: (1) laser beam velocity (v), variable between 2 and 5 mm/s; (2) surface temperature (T), variable between 1373 and 1673 K; (3) impact angle (φ), variable between 30° and 150°.
Furthermore, since there is no contact between the beam diode and the hardened specimens’ surface, the authors considered that any robot vibrations can be valued as negligible with respect to the process parameters studied.
Each laser-hardened specimen was etched and polished at the Ljubljana Institute of Metals and Technology (IMT) and then studied with a JSM-7600F SEM microscope produced by JEOL Company at the Ljubljana Jožef Stefan Institute (IJS). The impact angle parameter is expressed with two corresponding notations: the first notation (angles indicated as φ, as shown in
Figure 1b) fixes the origin on the side of the hardened surface and considers the angles as positive because they are generated by a counterclockwise rotation of the laser beam. The second notation (angles indicated as
X3) reports positive values when the horizontal component of the laser beam agrees with the forward velocity of the laser beam (
Figure 1c) and negative values when the above-mentioned component is in opposition to the forward velocity (
Figure 1d).
Therefore, the angular value of φ = 150° according to the first notation is equivalent to the angular value of X3 = −30° according to the other notation and X3 = 90° coincides with X3 = −90°. The second notation is useful to highlight whether the laser beam agrees with or is in opposition to the forward velocity and will be used below.
The changes in the impact angle were forward φ ∈ [90°, 150°] and backward φ ∈ [30°, 90°]. In a preliminary sensitivity analysis, it was found that the above-mentioned parameters had the strongest impact on the final surface geometrical microstructures.
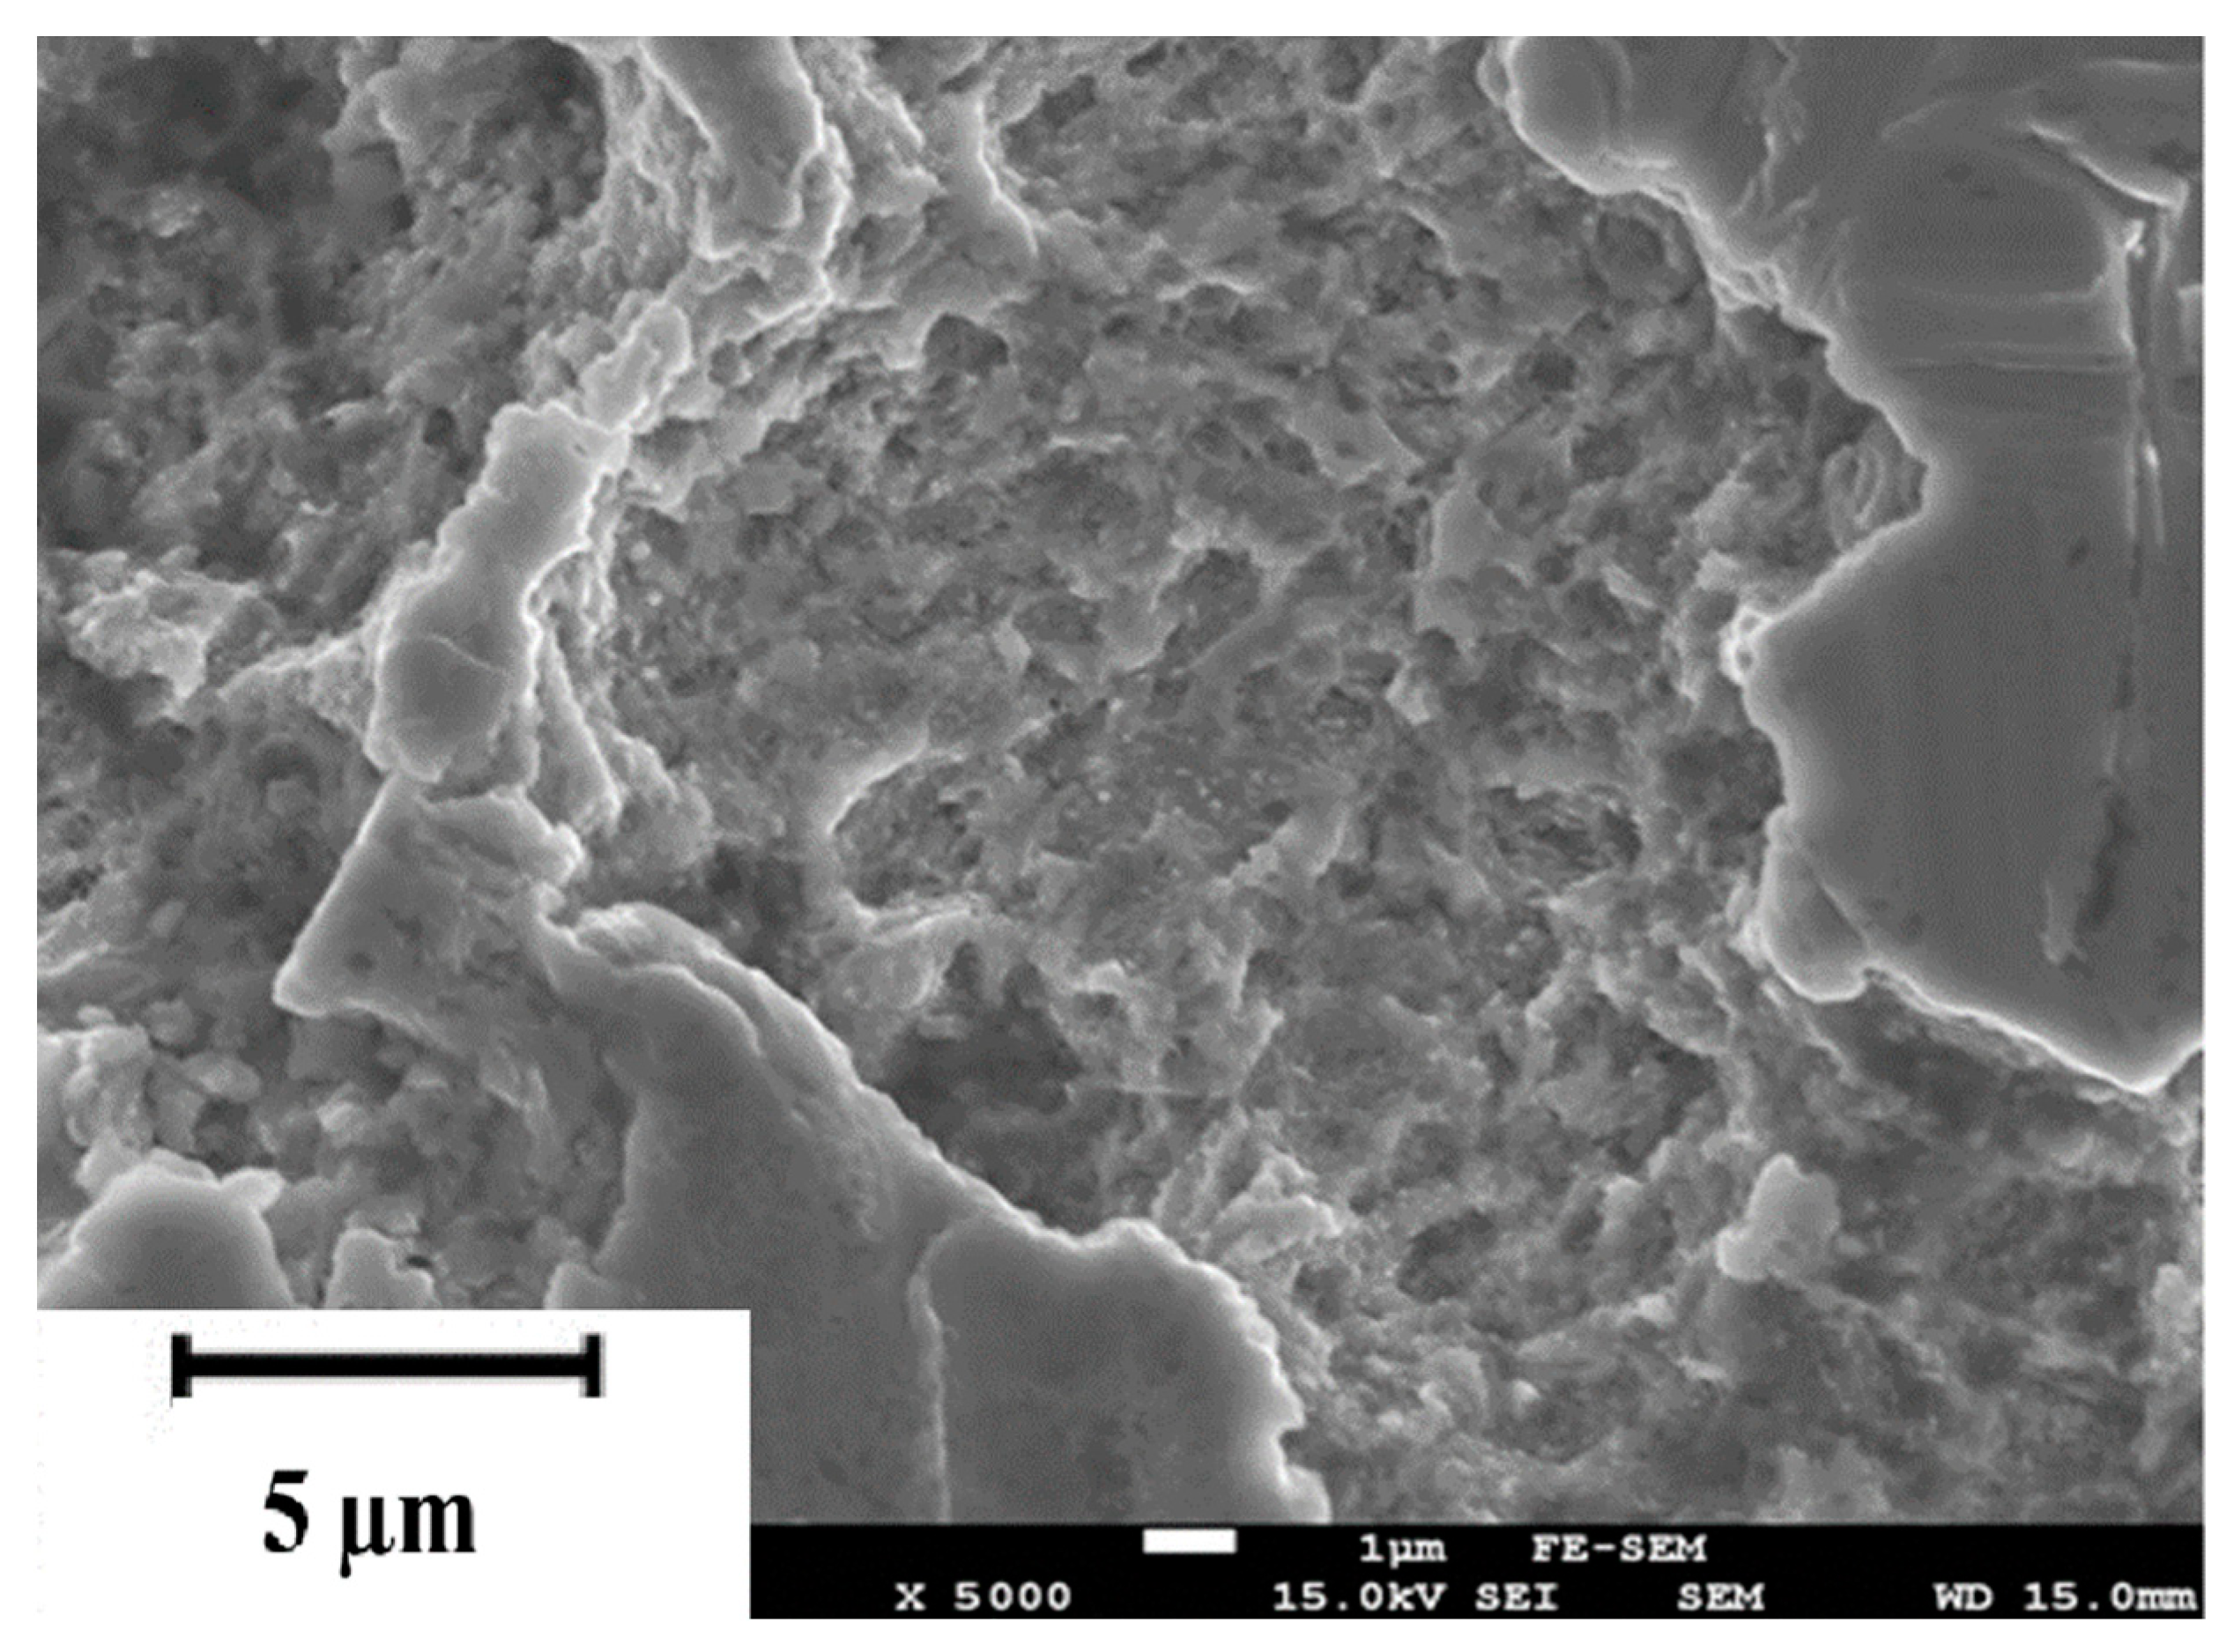
Using JSM-7600F, the field emission scanning electron microscopy (SEM) identified the images which were employed to characterize the material microstructure both before and after the implementation of the surface treatment. The microstructure of laser heat-treated steel was clearly identified through the initial solution with which the specimen surface was arranged and etched. The magnification used was 5000 (
Figure 2).
The analysis of the surface microstructure was carried out in the proximity of the laser heat-treated zone classified as parent material (PM), positioned outside the laser affected zone (LAZ) (
Figure 1b). Within the LAZ microstructure, partially transformed martensite was traced at the boundary with the martensite transformation being complete at the center of the laser-treated zone; this transformation was revealed along with alloy carbides with evidence of distinct grain boundaries. The penetration depth of the laser hardening depends on the type of steel, on the working temperature, and on the laser beam velocity. Overlapping areas could be created, as a result of several adjacent turns of the laser beam, where the microstructural complexity changes with respect to the single-turn areas. The present work focused on studying the microstructural complexity of the hardened surface layer in the single-turn areas.
Due to the thermal strains, that occur during the process of heating and cooling, and the volume changes involved in local transformation from austenite to martensite, residual stresses arise for about 1 mm of depth below the hardened layer [
29]. This depth value can be reasonably considered valid for all specimens used in this study.
The surface microstructure of laser-hardened specimens is very complex. Because of the highly irregular and complex shapes produced, it is extremely difficult and mostly even virtually impossible to describe the microstructure of hardened specimens by means of Euclidian geometry [
30]. The fractal geometry method was therefore used since it can be successfully applied to describe quite complex geometrical objects.
Fractal geometry is based on the idea of magnification invariance, which means that the observed image is the same regardless of the magnification applied. A fractal is a derivative of the Latin word fractus, which means broken, fractured, or unconnected. This type of analysis established the same dimensions as those of self-similar fractals at each magnification, differently from statistical self-affine fractals.
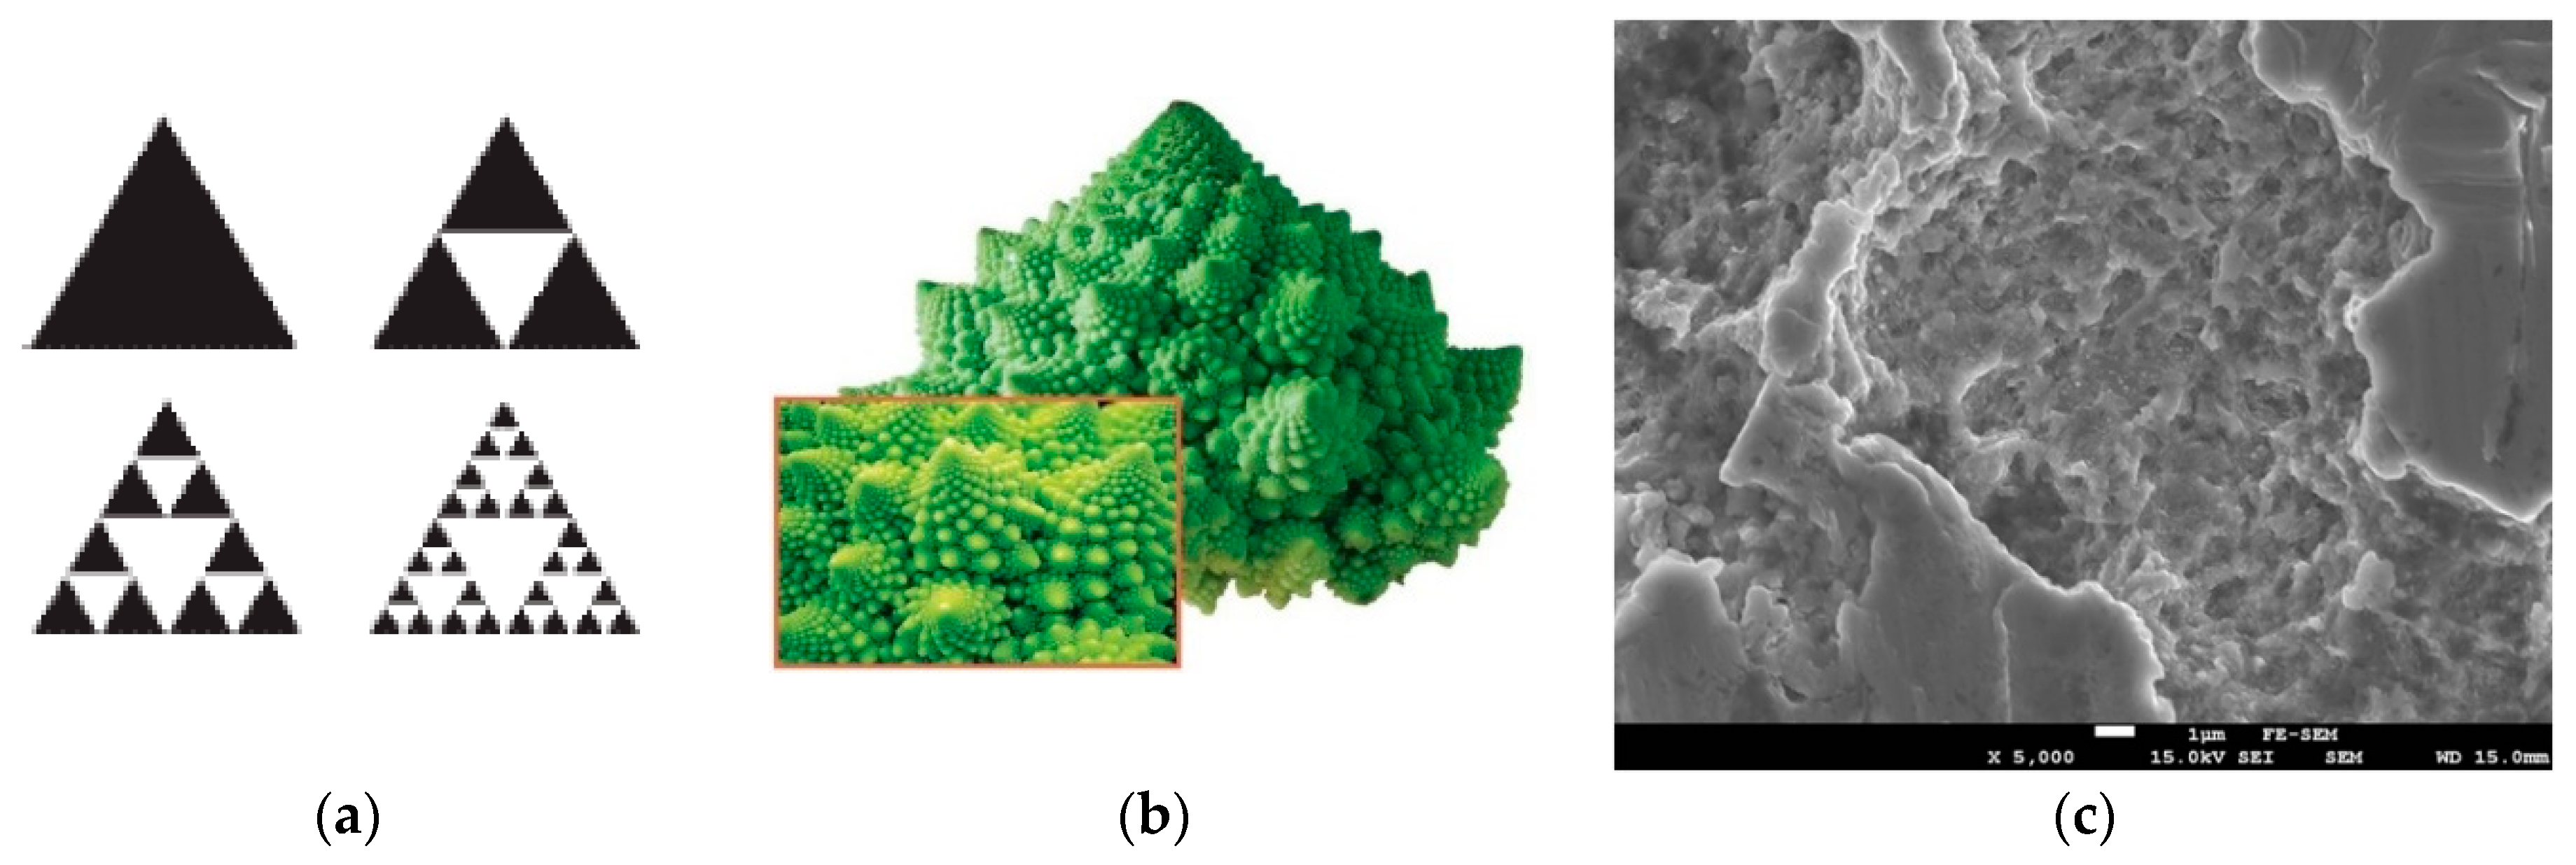
Self-affine transformations are also called shearing transformations. It may be underlined that self-similarity space is a subset of the self-affinity one. Self-affine fractals, including self-similar geometry, can be divided into self-similar, quasi self-affine, and statistically self-affine, as shown in
Figure 3. Fractal structure in laser-hardened specimens occurred in distances of 5000× magnification and over (
Figure 3c).
Fractal dimension [
23] is a property of a fractal that is preserved through all magnifications and is therefore well defined and, moreover, it tells us how complex a fractal is. A fractal can be said to be a graphical solution of a mathematical equation or algorithm in a complex plane. Fractals are shapes that are basically the same on all magnification scales; they are self-similar. The statistical self-image of fractal forms is characteristic of the natural world and can be used to simulate natural processes.
2.2. Data Mining and Processing
The hardened specimen surface microstructure can be evaluated as statistically self-affine [
24] in 2D space despite its high complexity and lack of self-similarity. By capturing SEM images of laser-hardened surfaces under various magnifications, self-similar fractal objects were obtained with a modification due to anisotropic transformations, as shown when converting a SEM image into a binary image.
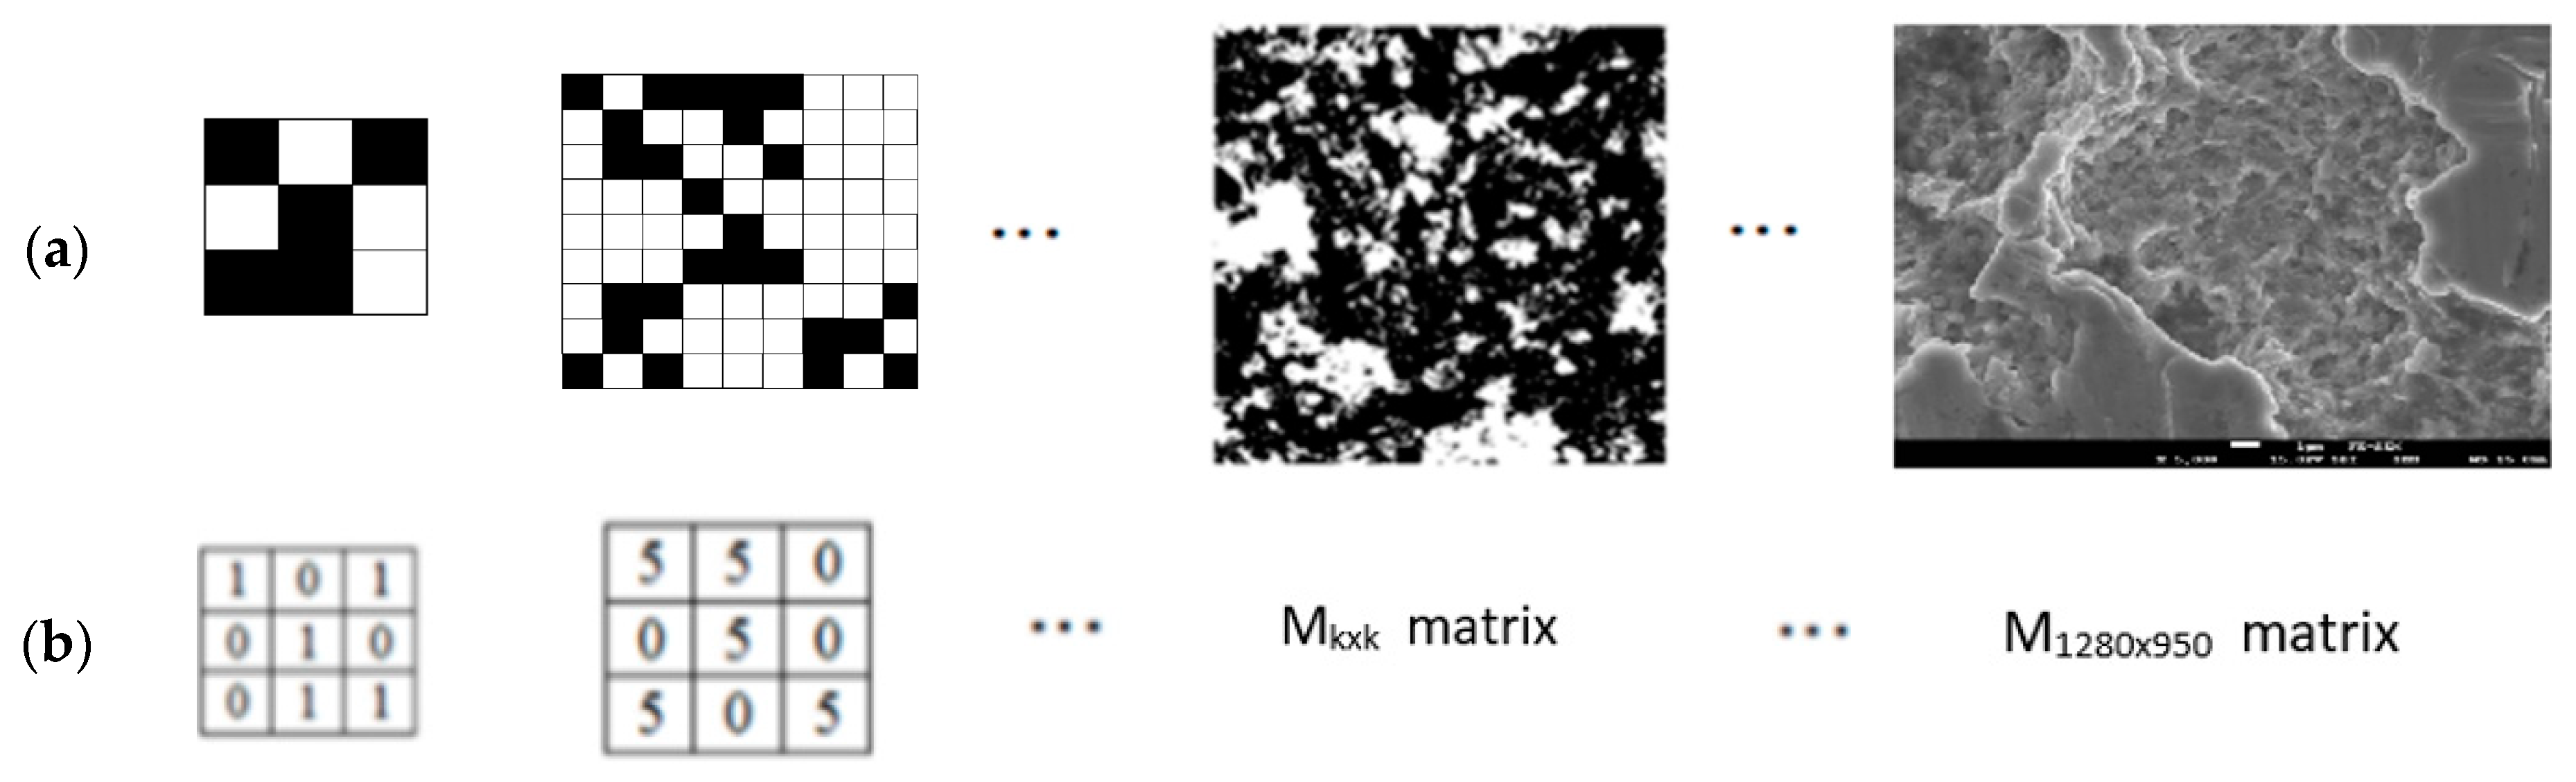
Figure 4 displays the three initial stages of the production of a randomly recursive grid in 2D Euclidean space of size M = 3.
The first operation was counting the black and white pixels for all the 3 × 3 matrices; 3 × 3 for each inner 1 × 1 box. The second was its repetition for all the 9 × 9 matrices for each 3 × 3 box. The process was repeated afterwards including an increase of the matrix and the box dimensions. The fractal dimension was then calculated for each SEM image (1280 × 950 pixels) of the microstructure of the laser-hardened specimen (
Figure 4a) considering Equation (1):
where
m indicates the dimension of the
Mkxk matrix containing all the
k ×
k pixels in the SEM image;
n is the number of the entire pixels forming the matrix;
b indicates the number of black pixels in the considered matrix; and
Dk is the parameter relative to the geometric complexity. Equations (2)–(4) illustrate the procedure described, which is also shown in
Figure 4b.
3. Complexity Prediction Model
Using genetic programming (GP) [
31], a complexity computational prediction model was developed. Efficiency of evolutionary computing relies on an artificial intelligence approach [
32]. In the present study, the following specific GP main parameters were used: size of organism population; maximum number of generations; reproduction probability; crossover probability; maximum permissible depth in the creation of the population; maximum acceptable depth after the operation of crossover of two organisms; smallest acceptable depth of organisms in generating new organisms; and tournament size used for the selection of organisms.
Table 1 shows the values of GP main parameters which give the best combination of simulation times and results accuracy.
Table 2 illustrates the differently combined process parameters, from which a first set of 24 specimens was derived. This first set of specimens were labeled as P1′ to P24′. In the last column, the geometrical structural complexity index (
CC) was calculated as previously described in
Section 2.2.
In order to make the methodology clearer, the set of tested specimens was divided into six groups, each made up of four units. The selection of the process parameters was made in such a way as to have similar complexity indices belonging to the same group. A difference between the odd groups and the even groups emerged: the former was characterized by specimens tested at the same temperature values and with positive velocity and impact angle values. The latter, on the other hand, were characterized by specimens tested at the same temperature values but with negative velocity and impact angle values. It must be said that the fact of inverting both velocity direction and impact angle did not affect complexity; moreover, the analogy between the even groups and the odd groups was detected. Thus, six specimens were tested under the same conditions which offered a good reliability in relation to the evaluation criterion. The other five sets of 24 specimens, denoted as P1n to P24n (with n = 2, 3, …, 6), were tested with variable impact angle when both the surface temperature and the laser beam velocity changed.
The X1 parameter indicates the temperature [K], the X2 parameter indicates the robot laser beam velocity [mm/s], and the X3 parameter indicates the angles [°] of the laser beam by means of which the hardening of the specimens was produced. These were the three process parameters which had the strongest influence on the surface microstructural complexity.
From the 24 × 6
CC specimens’ evaluations, the following genetic programming model (Equation (5)), able to predict the complexity of robot laser-hardened steel specimens, was obtained.
where:
To verify the effectiveness of the GP prediction model, 24 × 6 evaluations of complexity were made using the same process parameters (
X1,
X2, and
X3) used in the experimental tests. The results were summarized in
Table 3 which shows the values of minimum, maximum, and medium values obtained with the complexity GP prediction model.
Method result accuracy was studied in detail in the next section, where the calculation of the statistical error (mean values and standard deviation) of the method was carried out through an ANOVA.
It is worth noting that although the process of the laser heat treatment was simple, the investigations revealed that the evolution of the microstructure during the laser-hardening process was rather complex. The main objective of this research work is to show to what extent different angles of laser beam have an impact on the complexity factor of the microstructure of laser-hardened specimens. In this regard, the new method proposed made it possible to determine the same complex structure. What emerges is that the microstructure was not self-similar but statistically self-affine. Therefore, this research study describes the new and more complex situation that prevails for fractal curves that are not self-similar but self-affine.
Roughness measurements on the specimens’ surface were performed by adopting profilometry techniques and using a computerized contact profilometer, Hommel Tester T1000 (Hommelwerke GmbH, Schwenningen Germany) [
33,
34]. In the temperature range from 1373.0 to 1673.0 K, it appears that surface roughness increases with the increasing of temperature and decreases with the increasing of laser beam velocity. A quantitative assessment was not reported in the present manuscript because the performance of additional measures was deemed necessary as it ensures the statistical reliability and repeatability of the results. However, a first reliable qualitative assessment was found, and it is shown below.
Using the pixel content of the SEM images it was possible to establish a correspondence between the complexity index described in
Section 2.2, the
Y parameter, and the roughness of the RLH surface.
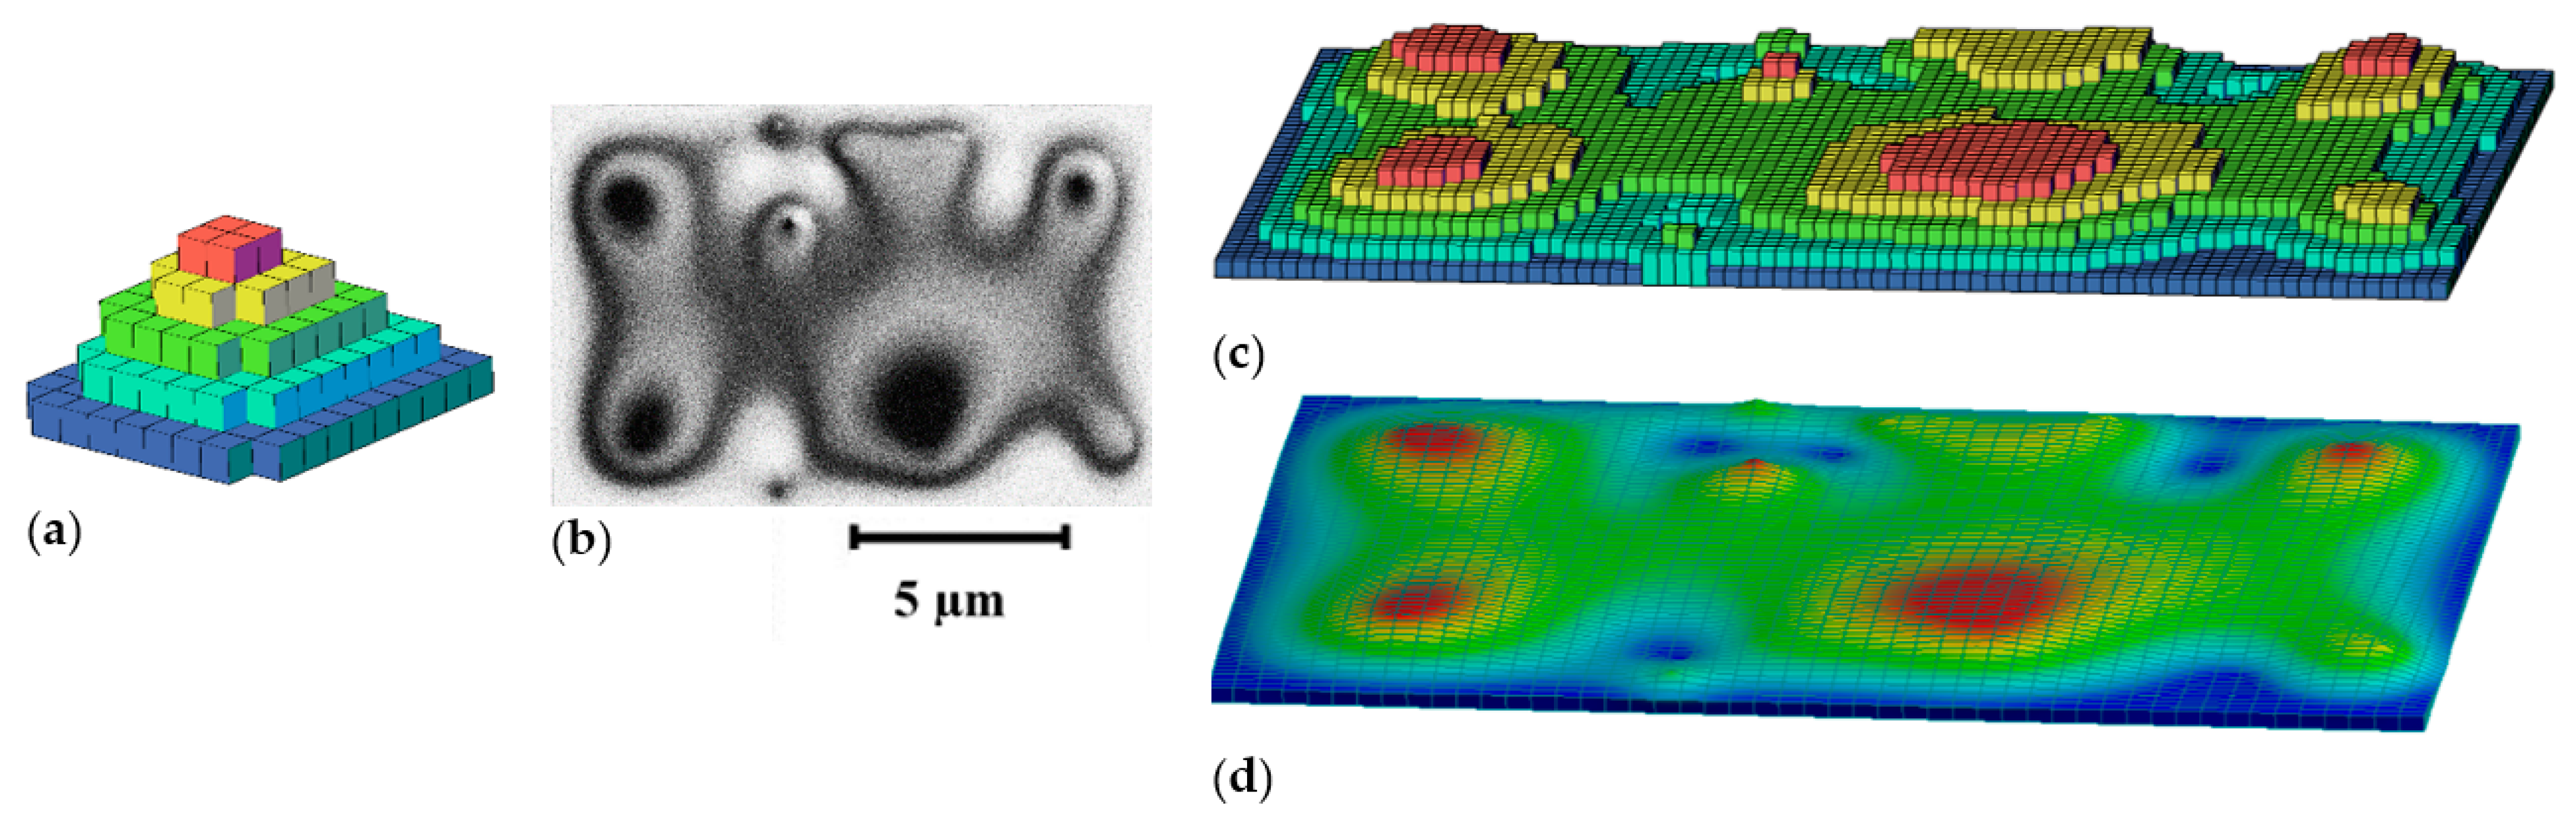
A 3D reconstruction with a 3D voxel map that reproduces the surface roughness was developed by automating a routine in a Python environment. The following logical steps were performed:
- (1)
All 3 × 3 pixel matrices in the SEM image were evaluated and divided into three groups: totally black matrices, where all nine pixels were black; almost black matrices, where eight pixels were black and one pixel was white; hemi-black matrices, where two or more pixels were white.
- (2)
Each square surface of 10 × 10 pixels was extruded into a 3D voxel (0.18 × 0.18 × 0.18 µm cube), forming the layer 0 of the 3D reconstruction.
- (3)
The areas with percentages of totally black matrices lower than 30% were associated with layer 0; the areas with percentages of totally black matrices plus almost black matrices ranging from 30% to 50% were associated with layer 1 (higher than layer 0 by one voxel); the areas with percentages of totally black matrices plus almost black matrices between 50% and 70% were associated with layer 2 (higher than layer 1 by one voxel); the areas with percentages of totally black matrices plus almost black matrices between 70% and 90% were associated with layer 3 (higher than layer 2 by one voxel); and finally, the areas with percentages higher than 90% in totally black matrices plus almost black matrices were associated with layer 4 (higher than layer 3 by one voxel).
- (4)
Labeling the layer 0 areas with a blue color, the layer 1 areas with a cyan color, the layer 2 areas with a green color, the layer 3 with a yellow color, and the layer 4 with a red color, the 3D voxel maps were obtained (
Figure 5a,c).
The length of the edges of the voxels and the elevation corresponding to the pixel groups was established by considering that each pixel has a square area of 0.018 × 0.018 µm.
The voxel map thus obtained allows the evaluation of roughness (Ra) and mean roughness depth (Rt) and modeling of the surface through NURBS curves that interpolate the upper vertices of the voxels (
Figure 5d).
Experimental validation shows a relatively good agreement between the predicted and measured values of mean roughness (Ra) and mean roughness depth (Rt), with errors lower than 13% in many cases. Unfortunately, the developed method is not yet generalizable to all the cases studied and does not provide an accurate quantitative correspondence.
Figure 5 shows an implementation of the developed method applied to a 750 × 500 black and white pixel image (
Figure 5b). In this case, the method made it possible to evaluate Ra = 0.6 µm and Rt = 1.1 µm with an associated index
CC = 1.8275.
4. Statistical Analysis of the Data and Results
As mentioned in
Section 3, the sets of tested specimens can be grouped into four sets of six units each. The specimens of each group were tested at the same surface temperature, at the same speed of the laser beam in absolute value, and for equivalent impact angle values.
An accurate statistical analysis was carried out, repeating the same measurements five times on different specimens in order to better understand the results found.
Table 4 shows the mean value and the standard deviation relative to the six values of each set. A good level of repeatability of the calculated complexity method is proved by the low values of the standard deviation (St. Dev.) compared with the mean values.
Maximal complexity (1.8924) occurred for specimen P13. Specimen P13 was hardened with 2 mm/s, 1373 K under laser beam angle of 30°. Minimal complexity (1.7253) occurred for specimen P11. Specimen P11 was hardened with 4 mm/s, 1573 K under laser beam angle of 75°.
Table 5 shows the comparison between calculated and predicted values, highlighting the percentage error and taking the calculated method as reference. It has to be noted that in both methods the highest values of complexity were obtained by operating under the two extreme conditions: 1373 K, 2 mm/s, 30° and 1673 K, 5 mm/s, 90°, respectively.
In addition, the percentage error made with the complexity prediction method was found to be less than 1% under each working condition.
The prediction of microstructure in an arbitrary forming process must be correlated with the level of phase transformation; in particular, the ferritic–austenitic transformation. The impact of martensitic and ferritic structures on the mechanical and topographical properties of materials was observed. It follows that once the microstructural geometry of the laser-hardened materials is known, the mechanical and topographical properties of the materials can be determined.
5. Conclusions
A new method to predict the surface microstructural geometrical complexity of robot laser-hardened materials was presented. In particular, the proposed method made it possible to determine the complex index of surface microstructures for RLH steel and yielded an excellent degree of predictability in keeping with the experimental results.
From the study, it emerged that the steel-laser-hardened surface microstructure was not self-similar but statistically self-affine. Therefore, this research study describes the new and more complex situation that prevails for fractal curves that are not self-similar but self-affine.
Due to the irregularity and complexity of the microstructure of laser-hardened surfaces, fractal-based analysis requires accurate calibrations to develop an effective technology tool for real-life applications. Therefore, the integration of genetic programming in the study of the microstructures of RLH materials points to a new frontier in research.
A first reliable qualitative assessment to establish a correspondence between the complexity index and the roughness of the RLH surface was carried out.
Other aspects, among which the influence of laser power and laser pulse frequency have on microstructural complexity, remain to be investigated in future research in order to achieve a complete understanding of any relationship between laser process parameters and surface microstructural complexity.
Finally, a further step will consist of realizing a reliable quantitative correlation between complex surface microstructures and surface roughness in order to determine a predictive model for the study of the mechanical properties of RLH materials.
Author Contributions
M.B. (Matej Babič): conceptualization, methodology, software, validation, formal analysis, investigation, data curation, resources, writing—original draft, writing—review and editing, supervision, project administration, funding acquisition. D.M.: software, validation, formal analysis, investigation, data curation. M.B. (Marco Bonfanti): software, validation, data curation, writing—original draft. M.C.: conceptualization, methodology, software, validation, formal analysis, investigation, data curation, resources, writing—original draft, writing—review and editing, supervision, funding acquisition. All authors have read and agreed to the published version of the manuscript.
Funding
This research received no external funding.
Data Availability Statement
The corresponding authors will be happy to provide data not directly available in the article.
Acknowledgments
This research was funded by scientific research cooperation between the Republic of Slovenia and the Federal Republic of Germany with the number of the bilateral project BI-DE/21-22-003. This paper belongs also to a research path funded by the University of Catania (Starting Grant 2020-2022 Linea 3—Progetto NASCAR—Prot. 308811).
Conflicts of Interest
The authors declare no potential conflict of interest with respect to the research, authorship, and publication of this article.
References
- Nath, A.K.; Sarkar, S. Laser transformation hardening of steel. In Advances in Laser Materials Processing; Woodhead Publishing: Cambridge, UK, 2018; pp. 257–298. [Google Scholar]
- Dossett, J.; Totten, G.E.; ASM Handbook Committee (Eds.) ASM Handbook: Steel Heat Treating Fundamentals and Processes; ASM International: Almere, The Netherlands, 2013; Volume 4A, pp. 389–398. [Google Scholar]
- Babu, P.D.; Marimuthu, P. Status of laser transformation hardening of steel and its alloys: A review. Emerg. Mater. Res. 2019, 8, 188–205. [Google Scholar] [CrossRef]
- Lesyk, D.; Dzhemelinskyi, V.; Martinez, S.; Lamikiz, A.; Dаnylеiko, O.; Hyzhevskyi, V. Laser transformation hardening effect on hardening zone features and surface hardness of tool steel AISI D2. Mech. Adv. Technol. 2017, 1, 26–33. [Google Scholar] [CrossRef] [Green Version]
- DuttaMajumdar, J.; Nath, A.K.; Manna, I. Studies on Laser Surface Melting of Tool Steel-Part II: Mechanical Properties of the Surface. Surf. Coat. Technol. 2010, 204, 1326–1329. [Google Scholar] [CrossRef]
- Karthikeyan, K.M.B.; Gowtham Raj, R.; Dinesh, K.; Aravind Kumar, K. Effect of subzero treatment on Microstructure and material properties of EN24 steel. Int. J. Mod. Eng. Res. 2014, 4, 85–92. [Google Scholar]
- Montealegre, M.A.; Castro, G.; Rey, P.; Arias, J.L.; Vázquez, P.; González, M. Surface treatments by laser technology. Contemp. Mater. 2010, 1, 19–30. [Google Scholar] [CrossRef]
- Dinesh Babu, P.; Balasubramanian, K.R.; Buvanashekaran, G. Laser surface hardening: A review. Int. J. Surf. Sci. Eng. 2011, 5, 131–151. [Google Scholar] [CrossRef]
- Karthikeyan, K.M.B.; Balasubramanian, T.; Thillaivanan, V.; Jangetti, G.V. Laser Transformation Hardening of EN24 Alloy Steel. Mater. Today Proc. 2020, 22, 3048–3055. [Google Scholar] [CrossRef]
- Boudreault, E.; Hazel, B.; Godin, S.; Côté, J. A new robotic process for in situ heat treatment on large steel components. In ASME Power Conference; American Society of Mechanical Engineers: New York, NY, USA, 2013; Volume 56062, p. V002T06A001. [Google Scholar]
- Martínez, S.; Lamikiz, A.; Ukar, E.; Calleja, A.; Arrizubieta, J.A.; De Lacalle, L.L. Analysis of the regimes in the scanner-based laser hardening process. Opt. Lasers Eng. 2017, 90, 72–80. [Google Scholar] [CrossRef]
- Narvan, M.; Ghasemi, A.; Fereiduni, E.; Kendrish, S.; Elbestawi, M. Part deflection and residual stresses in laser powder bed fusion of H13 tool steel. Mater. Des. 2021, 204, 109659. [Google Scholar] [CrossRef]
- Bailey, N.S.; Katinas, C.; Shin, Y.C. Laser direct deposition of AISI H13 tool steel powder with numerical modeling of solid phase transformation, hardness, and residual stresses. J. Mater. Process. Technol. 2017, 247, 223–233. [Google Scholar] [CrossRef]
- Knyazeva, M.; Rozo Vasquez, J.; Gondecki, L.; Weibring, M.; Pöhl, F.; Kipp, M.; Tenberge, P.; Theisen, W.; Walther, F.; Biermann, D. Micro-magnetic and microstructural characterization of wear progress on case-hardened 16MnCr5 gear wheels. Materials 2018, 11, 2290. [Google Scholar] [CrossRef] [PubMed] [Green Version]
- Balokhonov, R.; Romanova, V.; Schwab, E.; Zemlianov, A.; Evtushenko, E. Computational Microstructure-based analysis of residual stress evolution in metal-matrix composite materials during thermomechanical loading. Facta Univ. Ser. Mech. Eng. 2021, 19, 241–252. [Google Scholar] [CrossRef]
- Chai, L.; Wu, H.; Zheng, Z.; Guan, H.; Pan, H.; Guo, N.; Song, B. Microstructural characterization and hardness variation of pure Ti surface-treated by pulsed laser. J. Alloys Compd. 2018, 741, 116–122. [Google Scholar] [CrossRef]
- Skripnyak, V.A.; Iokhim, K.; Skripnyak, E.; Skripnyak, V.V. Modeling of titanium alloys plastic flow in linear friction welding. Facta Univ. Ser. Mech. Eng. 2021, 19, 91–104. [Google Scholar] [CrossRef]
- Babu, P.D.; Buvanashekaran, G.; Balasubramanian, K.R. Experimental studies on the microstructure and hardness of laser transformation hardening of low alloy steel. Trans. Can. Soc. Mech. Eng. 2012, 36, 241–258. [Google Scholar] [CrossRef]
- Qiu, F.; Kujanpää, V. Transformation hardening of medium-carbon steel with a fiber laser: The influence of laser power and laser power density. Mechanics 2011, 17, 318–323. [Google Scholar] [CrossRef]
- Zuo, Y.; Liu, H. Fractal approach to mechanical and electrical properties of graphene/sic composites. Facta Univ. Ser. Mech. Eng. 2021, 19, 271–284. [Google Scholar] [CrossRef]
- De Nicola, F.; Purayil, N.S.P.; Miŝeikis, V.; Spirito, D.; Tomadin, A.; Coletti, C.; Polini, M.; Krahne, R.; Pellegrini, V. Graphene Plasmonic Fractal Metamaterials for Broadband Photodetector. Sci. Rep. 2020, 10, 6882. [Google Scholar] [CrossRef] [Green Version]
- Moradi, M.; Arabi, H.; Nasab, S.J.; Benyounis, K.Y. A comparative study of laser surface hardening of AISI 410 and 420 martensitic stainless steels by using diode laser. Opt. Laser Technol. 2019, 111, 347–357. [Google Scholar] [CrossRef]
- Grassberger, P. Generalizations of the Hausdorff dimension of fractal measures. Phys. Lett. A 1985, 107, 101–105. [Google Scholar] [CrossRef]
- Mandelbrot, B.B. Fractals and Chaos, The Mandelbrot Set and Beyond; Springer: New York, NY, USA, 2004. [Google Scholar]
- Zaanen, J. The benefit of fractal dirt. Nature 2010, 466, 825–826. [Google Scholar] [CrossRef] [PubMed]
- Mandelbrot, B.B.; Passoja, D.; Paullay, A.J. Fractal character of fracture surfaces of metals. Nature 1984, 308, 721–722. [Google Scholar] [CrossRef]
- Capo, D. The Fractal Nature of the Architectural Orders. Nexus Netw. J. 2004, 6, 30–40. [Google Scholar] [CrossRef] [Green Version]
- Babič, M.; Mihelič, J.; Calì, M. Complex network characterization using graph theory and fractal geometry: The case study of lung cancer DNA sequences. Appl. Sci. 2020, 10, 3037. [Google Scholar] [CrossRef]
- Ericsson, T. Residual stresses produced by quenching of martensitic steels. In Comprehensive Materials Processing; Elsevier: Amsterdam, The Netherlands, 2014; pp. 271–298. [Google Scholar]
- Tarski, A. What is elementary geometry, Studies in Logic and the Foundations of Mathematics. In The Axiomatic Method with Special Reference to Geometry and Physics; North-Holland Publishing Company: Amsterdam, The Netherlands, 2007; pp. 16–29. [Google Scholar]
- Kovačič, M.; Župerl, U. Genetic programming in the steelmaking industry. Genet. Program. Evolvable Mach. 2020, 21, 99–128. [Google Scholar] [CrossRef]
- Buiten, M.C. Towards Intelligent Regulation of Artificial Intelligence. Eur. J. Risk Regul. 2019, 10, 41–59. [Google Scholar] [CrossRef] [Green Version]
- Ukar, E.; Lamikiz, A.; Martínez, S.; Tabernero, I.; De Lacalle, L.L. Roughness prediction on laser polished surfaces. J. Mater. Process. Technol. 2012, 212, 1305–1313. [Google Scholar] [CrossRef]
- Rott, S.; Ladewig, A.; Friedberger, K.; Casper, J.; Full, M.; Schleifenbaum, J.H. Surface roughness in laser powder bed fusion–Interdependency of surface orientation and laser incidence. Addit. Manuf. 2020, 36, 101437. [Google Scholar] [CrossRef]
| Publisher’s Note: MDPI stays neutral with regard to jurisdictional claims in published maps and institutional affiliations. |
© 2022 by the authors. Licensee MDPI, Basel, Switzerland. This article is an open access article distributed under the terms and conditions of the Creative Commons Attribution (CC BY) license (https://creativecommons.org/licenses/by/4.0/).


