Article

Shotokuseki Extract Promotes Keratinocyte Differentiation Even at a Low Calcium Concentration

1
Laboratory of Dermatological Physiology, Faculty of Pharmacy and Pharmaceutical Sciences, Josai University, 1-1 Keyakidai, Sakado, Saitama 350-0295, Japan
2
Zeria Pharmaceutical Co., Ltd., 10-11 Nihonbashi, Kobuna-cho, Chuo-ku, Tokyo 103-8351, Japan
3
Laboratory of Cosmetic Sciences, Regional Innovation Center, Saga University, 1 Honjo, Saga 840-8502, Japan
4
Japan Cosmetic Center, 1-1 Minami Jonai, Karatsu, Saga 847-0013, Japan
*
Author to whom correspondence should be addressed.
Appl. Sci. 2022, 12(5), 2270; https://doi.org/10.3390/app12052270
Submission received: 12 January 2022 / Revised: 15 February 2022 / Accepted: 19 February 2022 / Published: 22 February 2022

Abstract

:
The switch between keratinocyte proliferation and differentiation is regulated by extracellular calcium levels, requiring high concentrations (>1 mol/L) of extracellular calcium to induce differentiation. The Shotokuseki extract (SE) contains various ions such as calcium, but its effect on keratinocytes is unknown. This study focused on calcium-induced differentiation of keratinocytes and investigated the effects of simultaneous application of calcium and other ions on keratinocyte differentiation. The expression of differentiation markers increased when SE was added to a keratinocyte culture but not when only calcium was added at the same concentration present in SE. The calcium concentration in SE was found to be too low (0.01 mol/L) to induce differentiation of keratinocytes. In addition, the application of SE increased intracellular calcium concentration compared with calcium solution alone. Therefore, the induction of keratinocyte differentiation by SE is not calcium-dependent, or SE may alter the calcium sensitivity of keratinocytes. In our study, we found that simultaneous application of multiple ions and/or the application of trace ions may alter calcium sensitivity and the epidermal cell response. The function of ion transporters associated with these ions and the response of cells to ions depends largely on the balance among various ions and the function of trace ions.

Graphical Abstract

1. Introduction

The epidermal layer consists mainly of keratinocytes, and only cells in the basal layer divide. Keratinocytes change their morphology and properties through differentiation, and through this differentiation process all organelles disappear to form the corneocytes and stratum corneum. The cornified cell envelope, which covers keratinocytes, binds to intercellular lipids in the stratum corneum to form a tough insoluble membrane that acts as the stratum corneum barrier. In addition, keratinocytes express epidermal differentiation markers such as keratin 5 (K5) and 14, keratin 1 and 10 (K10), involucrin, loricrin, filaggrin, and transglutaminase during the differentiation process [1,2,3,4,5]. Epidermal growth factor, transforming growth factor, and calcium play important roles in regulating keratinocyte differentiation [6,7,8]. Minerals are important components of living organisms. Various minerals are present in living organisms and are essential for life activities and the maintenance of organisms. Minerals are closely related to physiological actions and enzymatic reactions. In epidermal cells, calcium promotes differentiation [8] and regulates hyaluronic acid synthesis [9], magnesium improves barrier functions [10,11], and zinc promotes cell proliferation [12].
In recent years, it has been reported that the application of extracts from natural resources such as hot spring water and deep sea water, which contain several minerals, can improve barrier function and heal and prevent inflammation in atopic dermatitis and psoriasis [11,13,14,15,16]. In this study, we focused on the effects of Shotokuseki extract (SE), which contains various minerals, on epidermal differentiation. SE is an extract from Shotokuseki, a type of sedimentary rock that forms from sediments of once-living organisms such as plankton and marine plants accumulating on the seabed and contains plenty of minerals. Therefore, various minerals are also likely to be present in SE. SE is used as a material for cosmetics, such as a lotions and creams, and it has been used for over 40 years. The effect of SE on the skin and its mechanism have not been investigated.
To examine the effects of SE to the epidermis, keratinocytes were treated with SE, and the expression levels of epidermal differentiation marker genes and proteins were measured.

2. Materials and Methods

2.1. Materials

SE was provided by IONA International Corporation (Tokyo, Japan), a member of the Zeria Group (Tokyo, Japan). Normal human epidermal keratinocytes (NHEKs) were purchased from Lifeline Cell Technology (Frederick, MD, USA). HuMedia-KG2 was purchased from Kurabo (Osaka, Japan). 3-[4,5-Dimethylthiazol-2-yl]-2,5-diphenyltetrazolium bromide (MTT) was purchased from Sigma-Aldrich (St. Louis, MO, USA). Primers were purchased from Invitrogen (Carlsbad, CA, USA). RNAiso Plus, PrimeScript™ RT Reagent Kit, and TB Green™ Premix ExTaq were purchased from TaKaRa Bio Inc. (Kusatsu, Shiga, Japan). Polyvinylidene difluoride (PVDF) membranes and Western Blotting Detection Reagents were purchased from GE Healthcare (Chicago, IL, USA). Calcium kit-Fura-2 was purchased from DOJINDO LABORATORIES (Kamimashiki, Kumamoto, Japan). All other chemicals and solvents used were analytical grade and purchased from FUJIFILM Wako Pure Chemical Corporation (Osaka, Japan).

2.2. Atomic Absorption Spectroscopy

An individual stock standard solution containing 1 mg/L of Na, Mg, K, Ca, and Zn was prepared with NaCl, Mg(NO3)2·6H2O, KCl, Ca(NO3)2·4H2O, and Zn in pure water or 0.1 mol/L HNO3 and used as calibration standards. A strontium chloride solution was used as a releasing agent for determining Ca. Cesium chloride was added to samples and standards for determination of Na and K as an ionization buffer. The solution was prepared with strontium chloride, cesium chloride, and hydrochloric acid.
The concentrations of minerals in SE were analyzed by atomic absorption spectroscopy (AAS; AA-6200; Shimadzu Corporation, Kyoto, Japan) with the respective hollow cathode lamps (Hamamatsu Photonics K.K., Hamamatsu, Shizuoka, Japan). Experimental conditions and analytical lines recommended by the manufacturer were used.

2.3. Cell Culturing

NHEKs were cultured in HuMedia-KB2 (Kurabo, Osaka, Japan) supplemented with 10 µg/mL insulin, 0.1 ng/mL human epidermal growth factor, 0.5 µg/mL hydrocortisone, 50 µg/mL gentamicin, 50 ng/mL amphotericin B, and 0.4% (v/v) bovine pituitary extract at 37 °C and 5% CO2. NHEKs were fed every 1–2 days and then passaged once they reached 80% confluence. Cells were used at passages 2–5 for experiments.

2.4. MTT Assay

NHEKs treated with SE as indicated were incubated with MTT for 3 h at 37 °C and lysed in a 0.04 mol/L hydrochloric acid/isopropyl alcohol solution. The absorbance at 570 nm was measured by a spectrophotometer (SpectraMax M2e; Molecular Devices, Sunnyvale, CA, USA).

2.5. Trypan Blue Exclusion Test

The trypan blue exclusion test was performed according to the manufacturer’s protocol. NHEKs were pretreated with trypsin and then suspended and stained with an equal volume of trypan blue dye. The cells were counted using a hemocytometer and a light microscope.

2.6. RNA Extraction and Reverse Transcription-Quantitative Polymerase Chain Reaction (RT-qPCR)

Total RNA was isolated from NHEKs using RNAiso Plus according to the manufacturer’s instructions.
mRNAs were reverse transcribed to cDNA with the PrimeScript™ RT Reagent Kit using oligo dT and random primers. The cDNA was used as the template for RT-qPCR in a Step One Plus Real-Time PCR system (Applied Biosystems, Foster city, CA, USA) with TB Green™ Premix ExTaq using the following settings: 40 cycles at 95 °C for 5 s and 60 °C for 30 s. Each expression was normalized to the housekeeping gene glyceraldehyde-3-phosphate dehydrogenase (GAPDH), and the calculation of data was executed by using the ∆∆CT method. The gene-specific forward and reverse primers used were: K5, 5′-GAGCTGAGAAACATGCAGGA-3′ (forward) and 5′-TCTCAGCAGTGGTACGCTTG-3′ (reverse); K10, 5′-CCATCGATGACCTTAAAAATCAG-3′ (forward) and 5′-GCAGAGCTACCTCATTCTCATACTT-3′ (reverse); profilaggrin (proFLG), 5′-CCATCATGGATCTGCGTGG-3′ (forward) and 5′-CACGAGAGGAAGTCTCTGCGT-3′ (reverse); transglutaminase1 (TGase1), 5′-TCTTCAAGAACCCCCTTCCC-3′ (forward) and 5′-TCTGTAACCCAGAGCCTTCGA-3′ (reverse); and GAPDH, 5′-GAAGGTGAAGGTCGGAGT-3′ (forward) and 5′-GAAGATGGTGATGGGATTTC-3′ (reverse).

2.7. Western Blotting Analysis

Total protein was extracted from NHEKs by RIPA buffer. The protein concentration was measured by the Lowry method [17]. Proteins were heated in loading buffer (0.1 mol/L Tris-HCl, pH 6.8, 25% glycerol, 5% SDS, 0.01% bromophenol blue, 5% 2-mercaptoethanol) for 3 min at 95 °C and separated by 10% sodium dodecyl sulfate-polyacrylamide gel electrophoresis (SDS-PAGE). The separated proteins were then transferred onto a PVDF membrane. The membranes were then blocked with Tris-buffered saline with Tween®20 (TBS-T) buffer containing 5% skim milk for 1 h at room temperature. The membranes were incubated with primary antibody in 5% skim milk and incubated at room temperature for 1 h or 4 °C overnight. The antibodies and ratios used were: anti-TGase1 (Ag3905, Proteintech Group, Inc., Chicago, IL, USA), 2000:1; anti-Filaggrin (sc-66192, Santa Cruz Biotechnology, Inc., Dallas, TX, USA), 1000:1; and anti-β-actin (13E5, Cell Signaling, Danvers, MA, USA), 1000:1. The membrane was then incubated with the horseradish peroxidase (HRP)-conjugated secondary antibody for 1 h at room temperature. Amersham ECL™ Prime Western Blotting Detection Reagent was added, and Western blotting results were visualized with a ChemiDoc™ XRS+ System (Bio-Rad Laboratories, Inc., Hercules, CA, USA). Images were analyzed with ImageJ 1.53a (National Institutes of Health; NIH, Bethesda, MD, USA).

2.8. Quantification of Intracellular Calcium Concentration

Changes in intracellular calcium concentration in NHEKs were measured with Calcium kit-Fura-2 according to the manufacturer’s instructions. Briefly, cells were loaded. with 5 μM Fura-2 AM at 37 °C for 60 min. After loading, the cells were rinsed with PBS(-). After replacement with calcium-free HBSS, each sample was loaded. Intracellular calcium concentration was measured by measuring Fura-2-AM fluorescence at 510 nm, using 340/380 nm dual-wavelength excitation in a spectrophotometer (SpectraMax M2e). The interval time of fluorescence recording is 10 sec. Plate temperatures were kept at 37 °C.

2.9. Statistical Analysis

All results are presented as the mean ± standard deviation (S.D.). Statistical analysis among three or more groups was performed by ANOVA using JMP (version 15.0.0, SAS Institute Inc., Cary, NC, USA).

3. Results

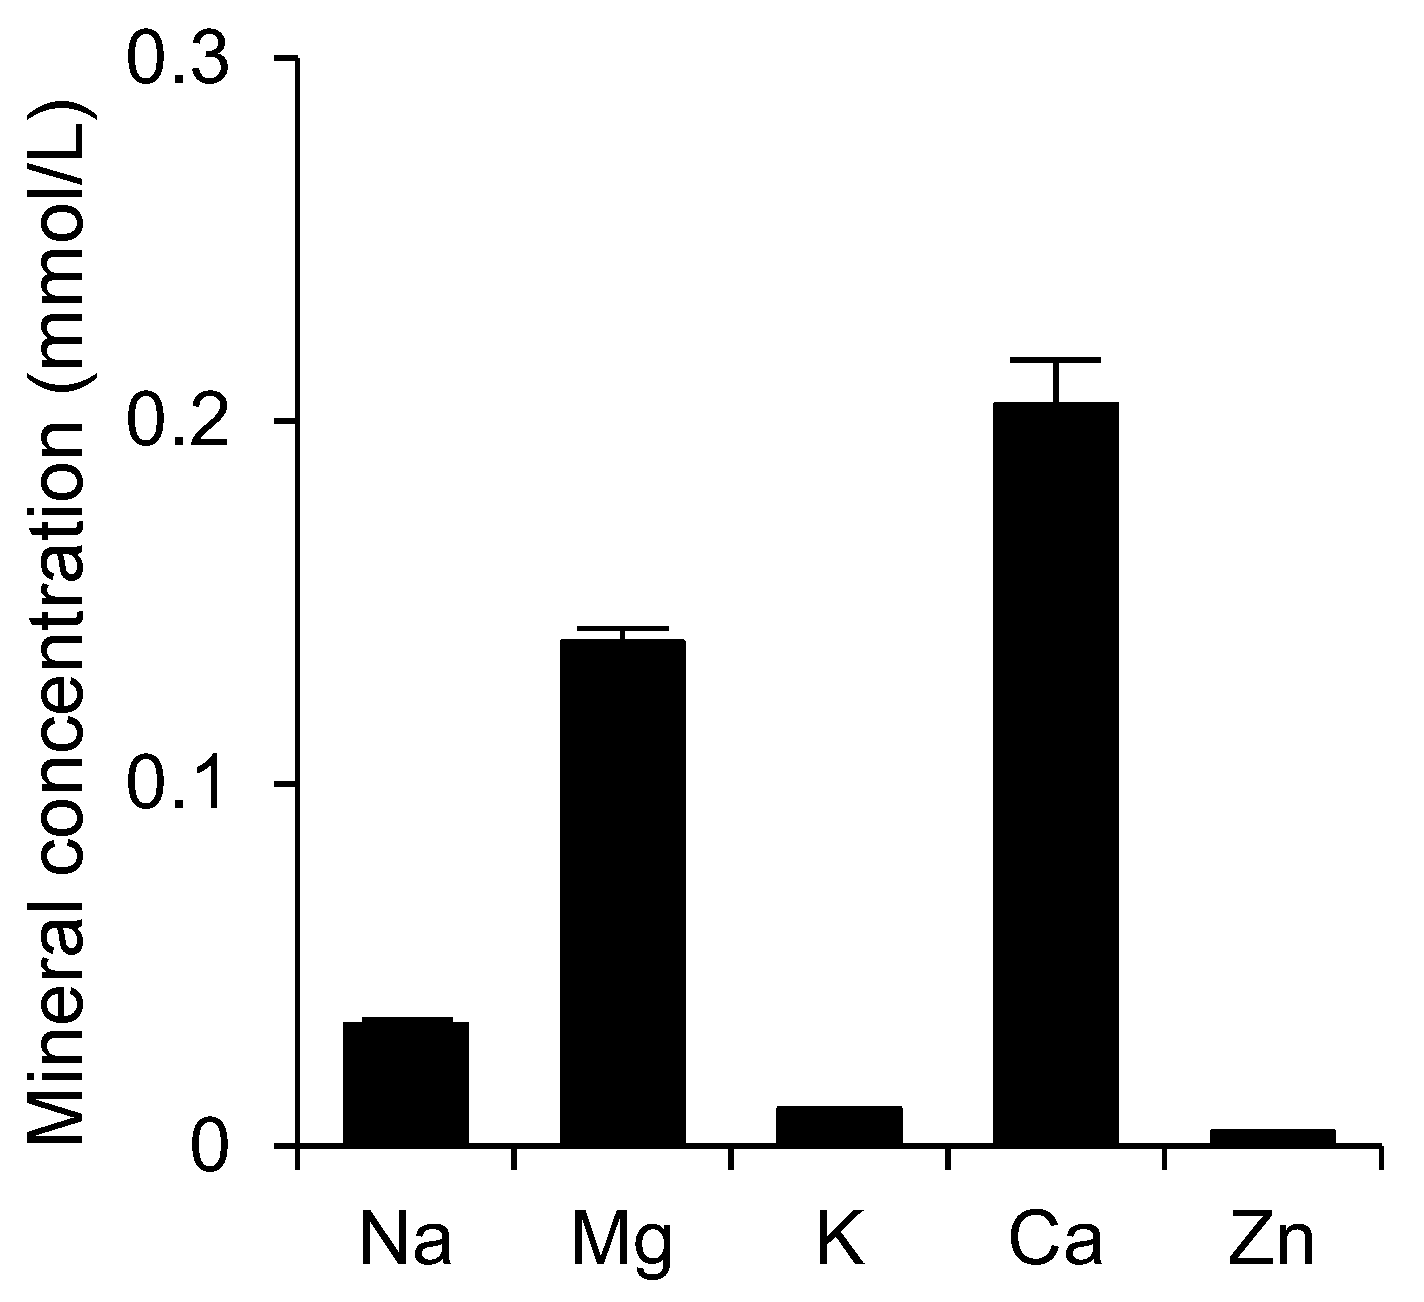
3.1. Concentrations of Minerals in Shotokuseki Extract

The concentrations of minerals in SE were analyzed by AAS. The concentrations of Na, Mg, K, Ca, and Zn in SE were determined to be 0.03 ± 0.001, 0.14 ± 0.004, 0.01 ± 0.0001, 0.21 ± 0.012 and 0.004 ± 0.0005 mmol/L, respectively, by AAS (Figure 1).

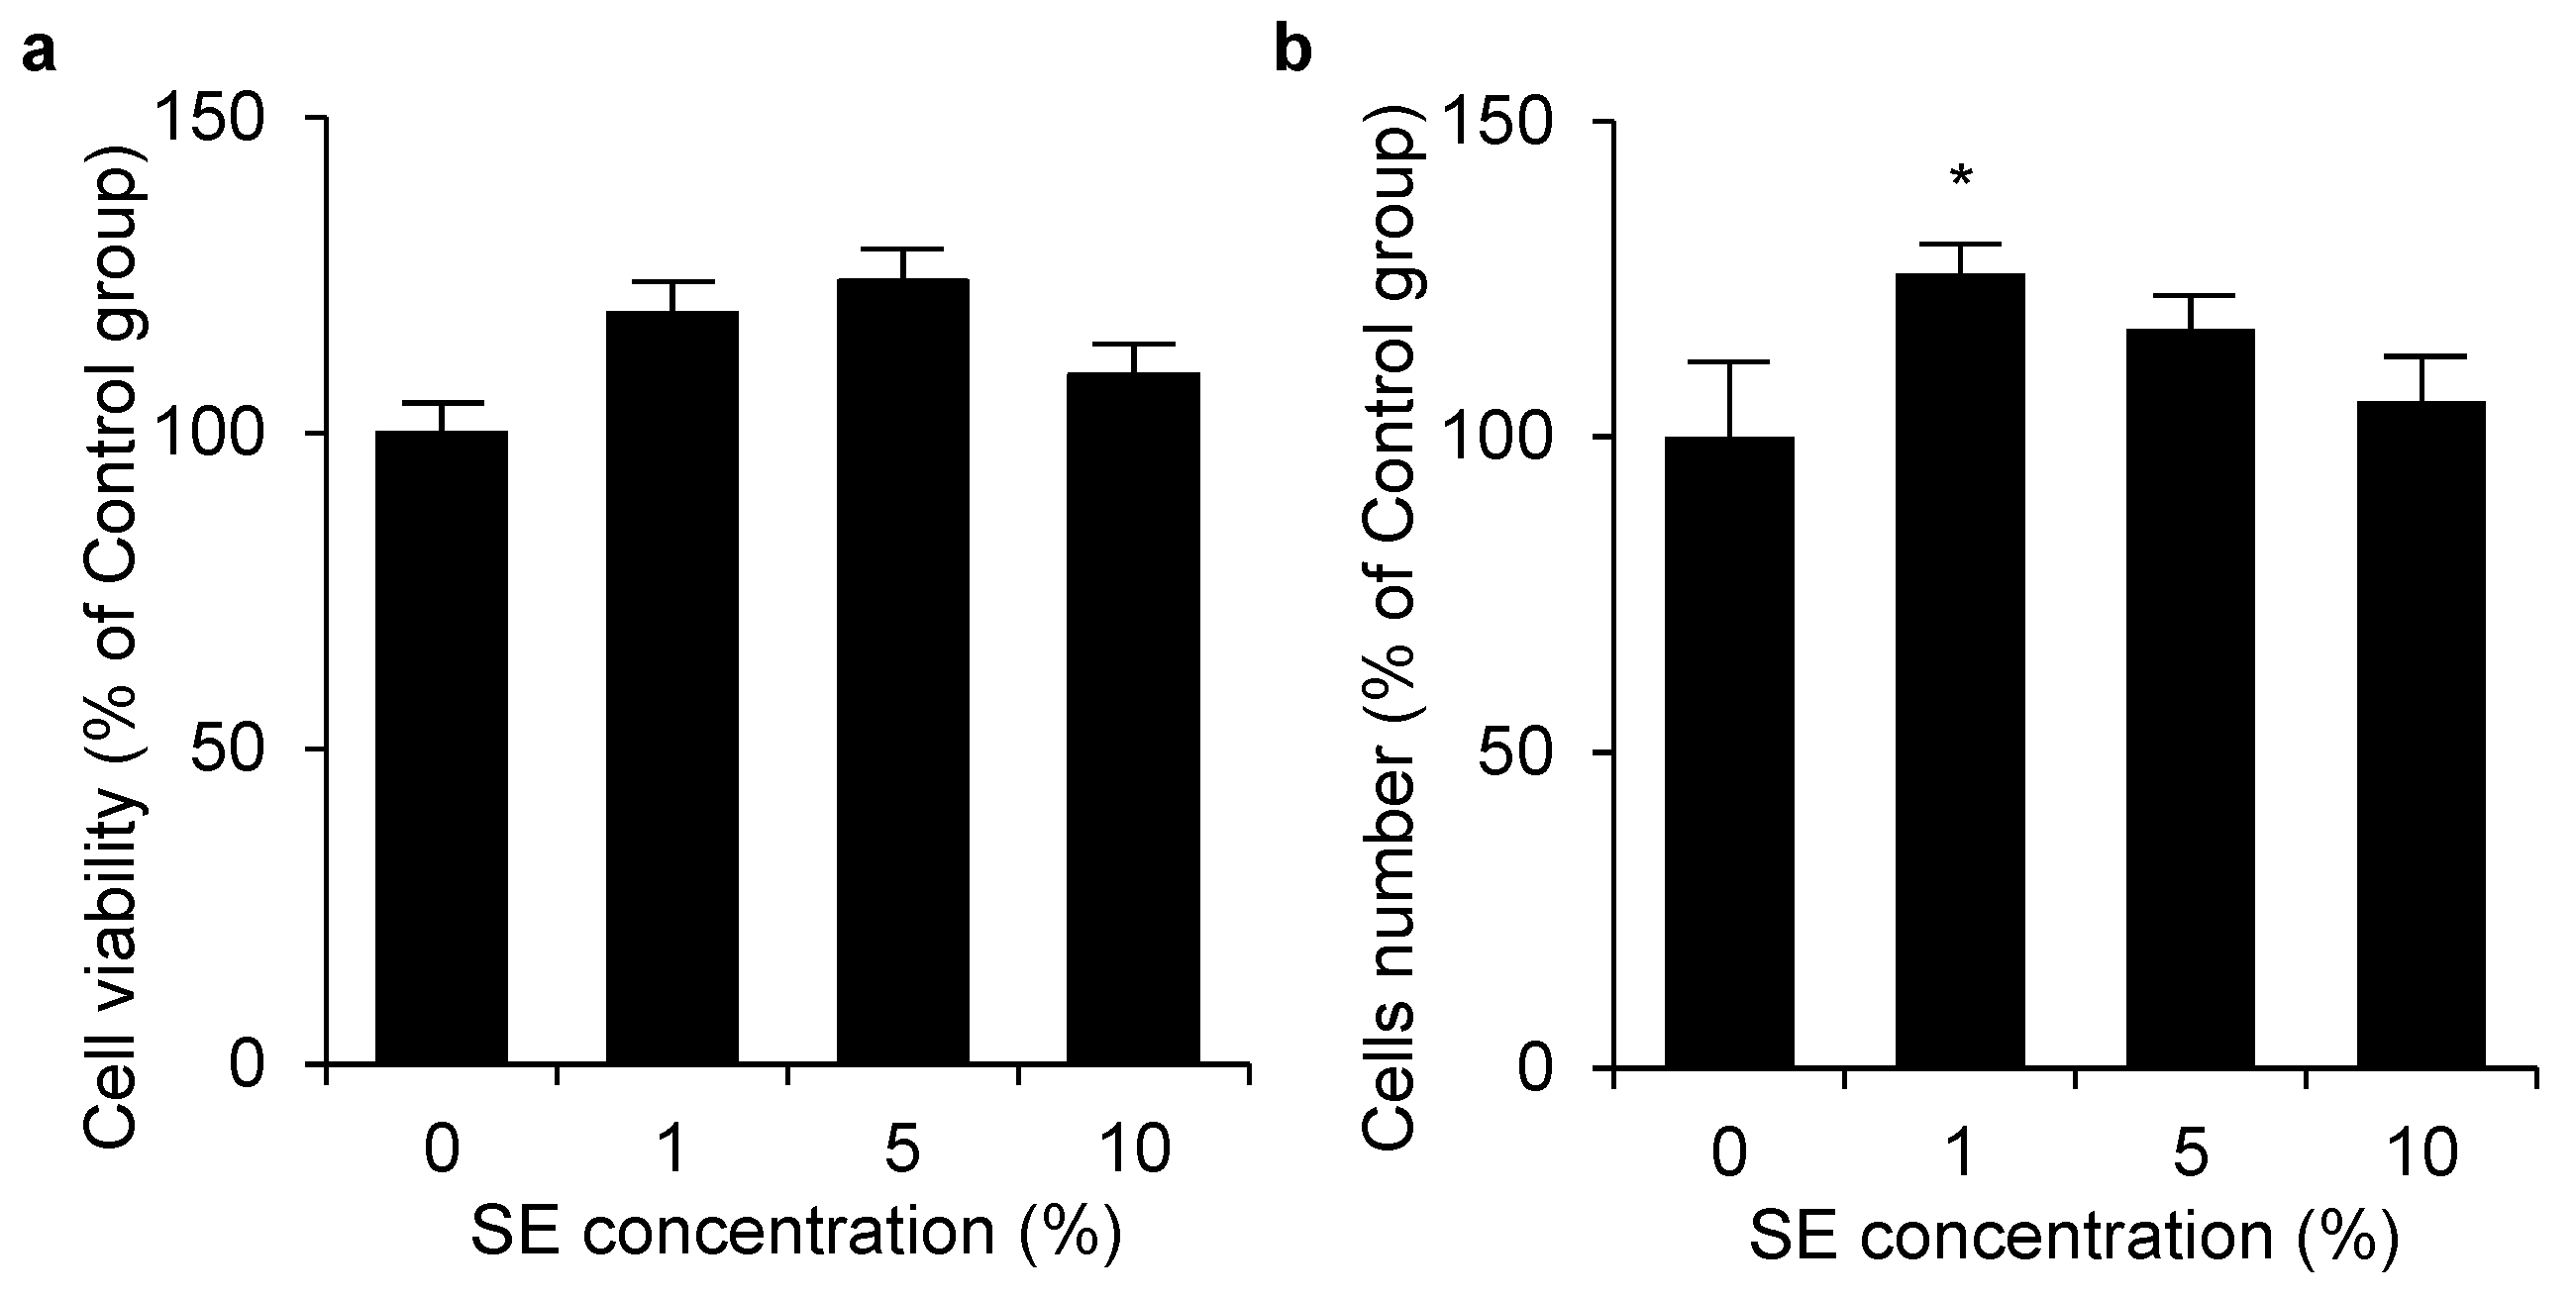
3.2. Cell Viability and Cell Number of Shotokuseki Extract toward NHEKs

We evaluated the cell viability and cell number of SE toward NHEKs. Cells were treated with SE concentrations ranging from 0 to 10% (v/v) for 24 h, and cell viability was evaluated by the MTT assay. The results show that SE did not affect cytotoxicity up to a dose of 10% (v/v) (Figure 2a). In addition, the number of cells increased in keratinocytes with 1% (v/v) application for four days (Figure 2b).

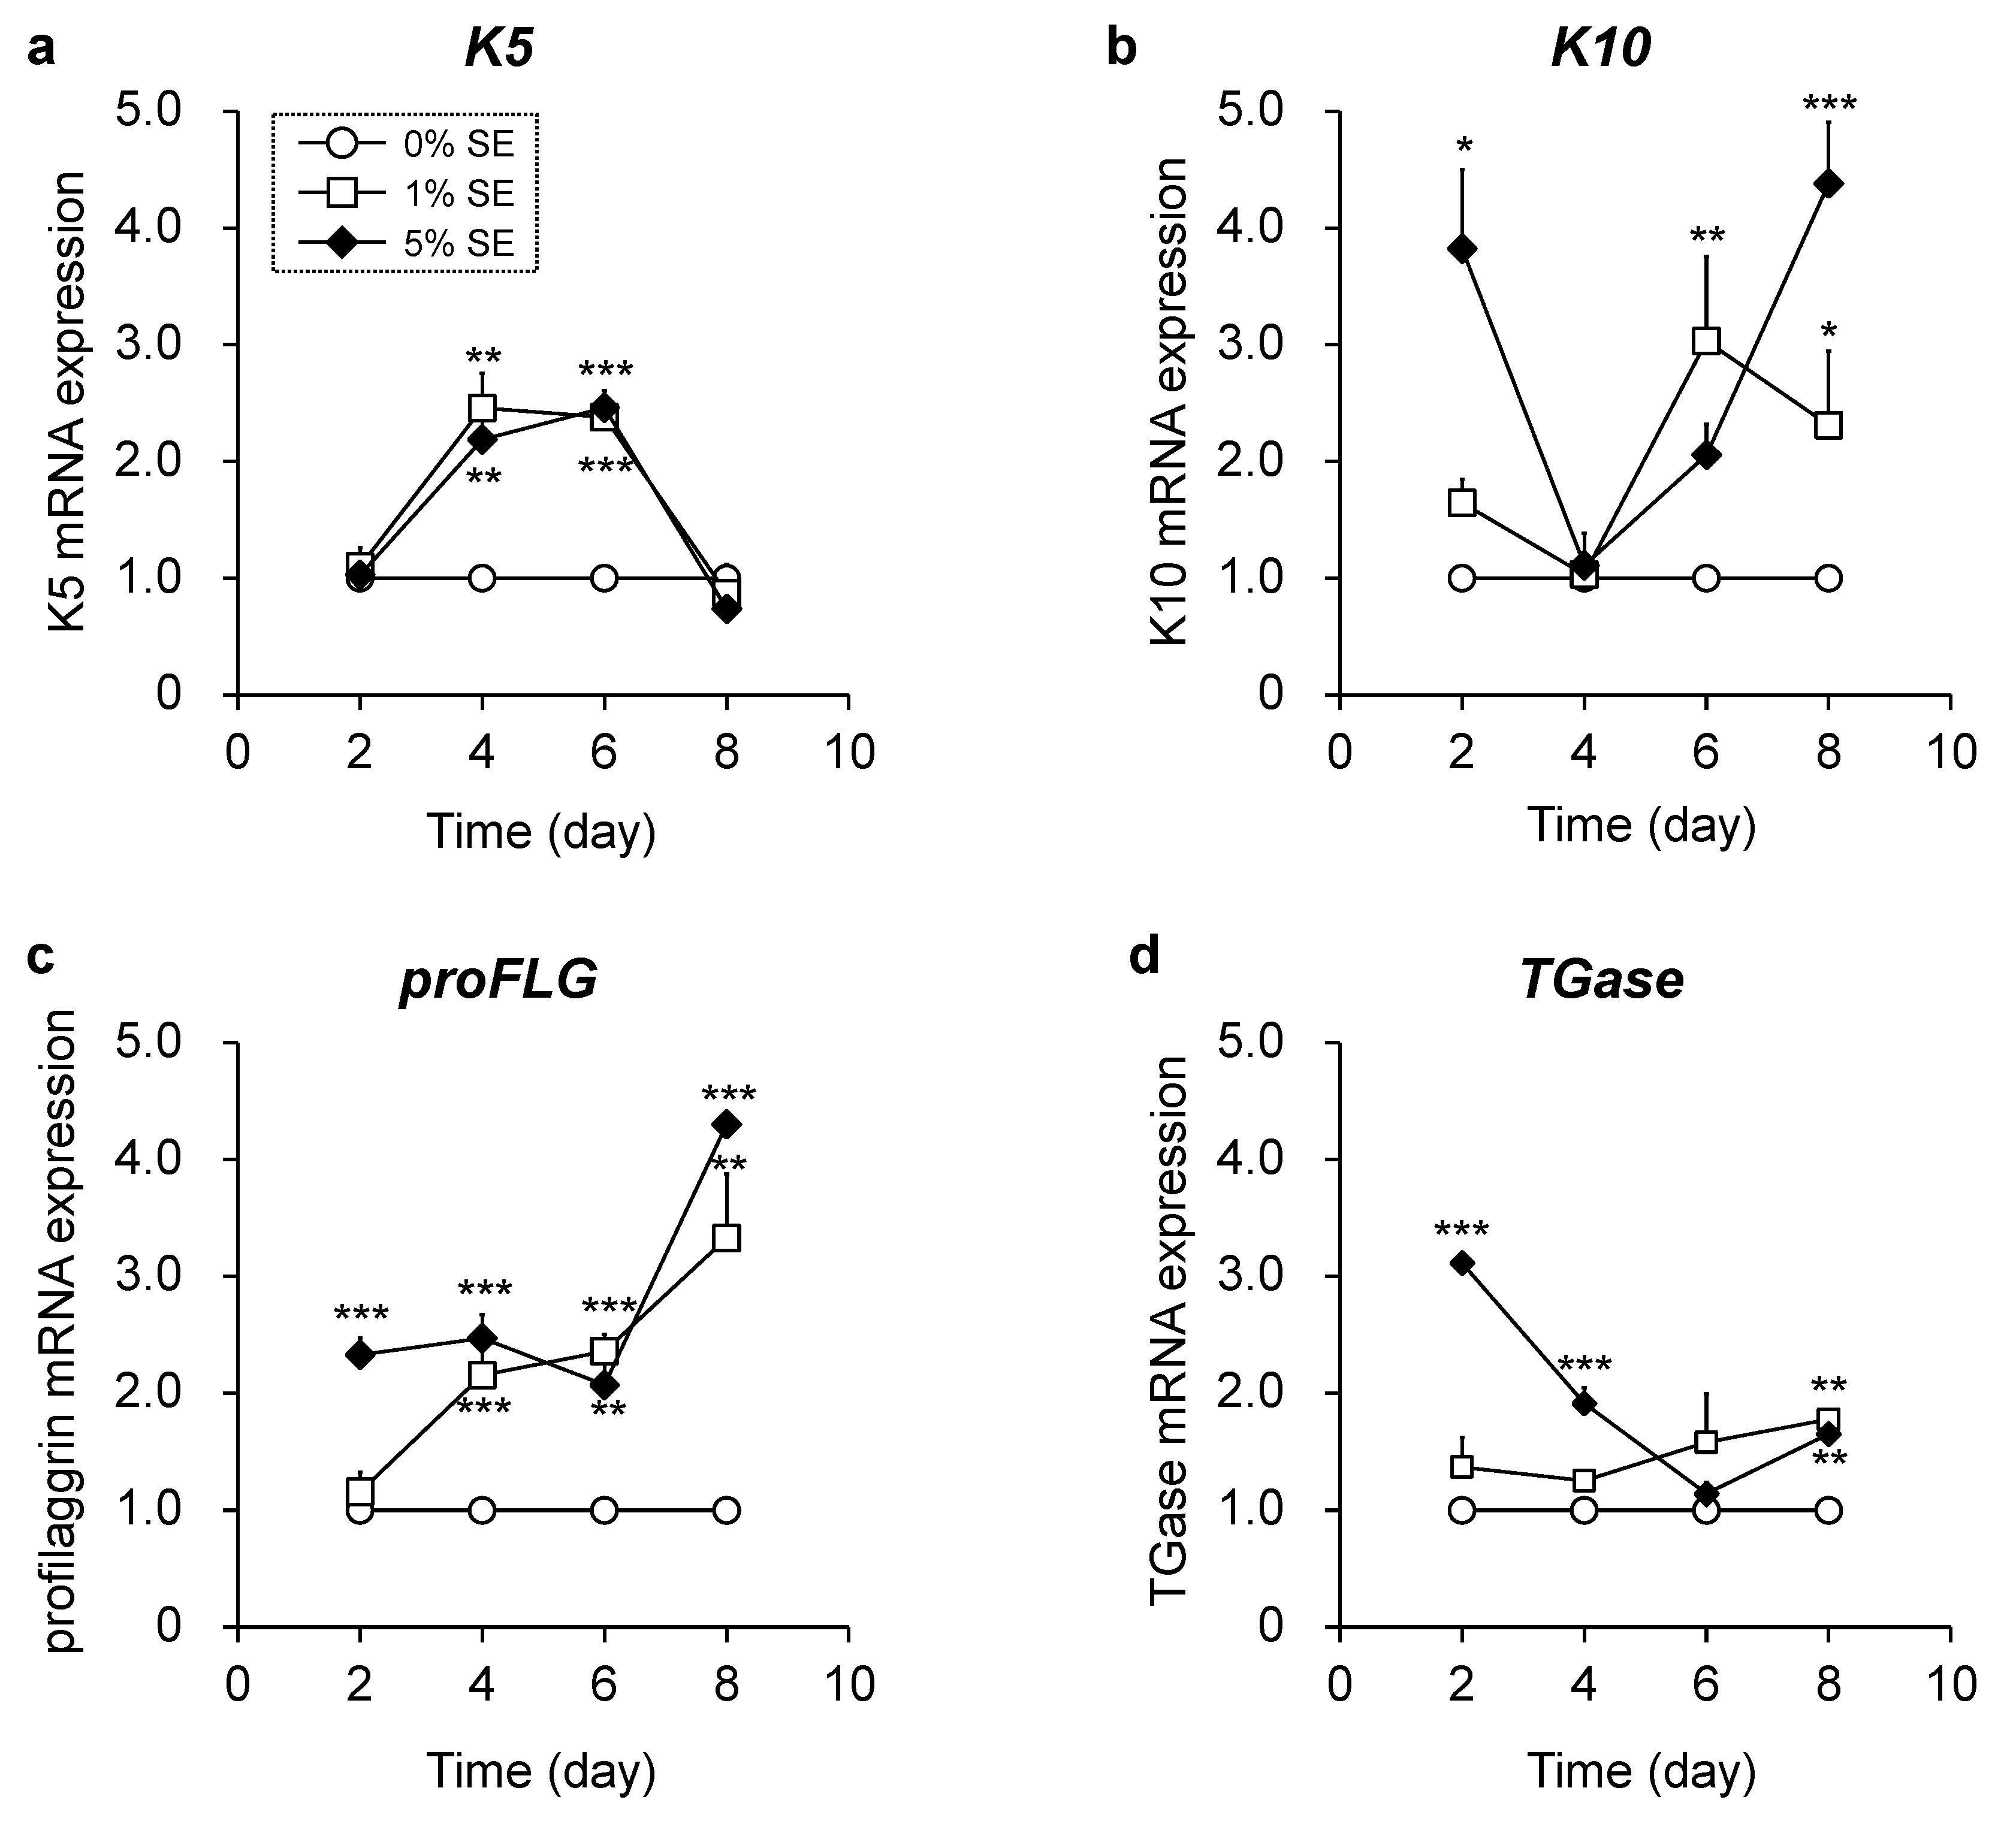
3.3. Effects of Shotokuseki Extract on Epidermal Differentiation in NHEKs

The gene levels of K10, profilaggrin, and TGase1 were measured by RT-qPCR to assess the effect of SE on epidermal differentiation of NHEKs. We also measured the mRNA expression of the basal epidermal keratinocyte marker K5. The mRNA level of untreated cells (control) was expressed as 1.0 at each time point, and the relative levels of treated cells (1% or 5% (v/v) SE) were reported. Treatment with SE increased the relative expression levels of K10, profilaggrin, and TGase1 genes with maximum increases of 4.4-, 4.3- and 3.1-fold when cells were treated with 5% (v/v) SE, respectively. The expression level of K5, a marker of basal epidermal keratinocytes, increased by a maximum of 2.5-fold when NHEKs were treated with 5% (v/v) SE (Figure 3).
We next examined filaggrin and TGase1 protein expression levels, which are late differentiation markers. The protein levels in NHEKs were assessed by Western blotting analysis relative to the expression level of β-actin in NHEKs. Treatment with SE dose-dependently increased the relative amount of TGase1 with a maximal increase of 2.5-fold observed when NHEKs were treated with 5% (v/v) SE. Application of the same concentration of calcium (0.01 mM) as 5% SE slightly increased TGase1 protein expression, which is involved in epidermal final differentiation, and its expression was upregulated more than that in 5% SE. In contrast, the filaggrin protein level was downregulated 0.7-fold when NHEKs were treated with 5% (v/v) SE (Figure 4).

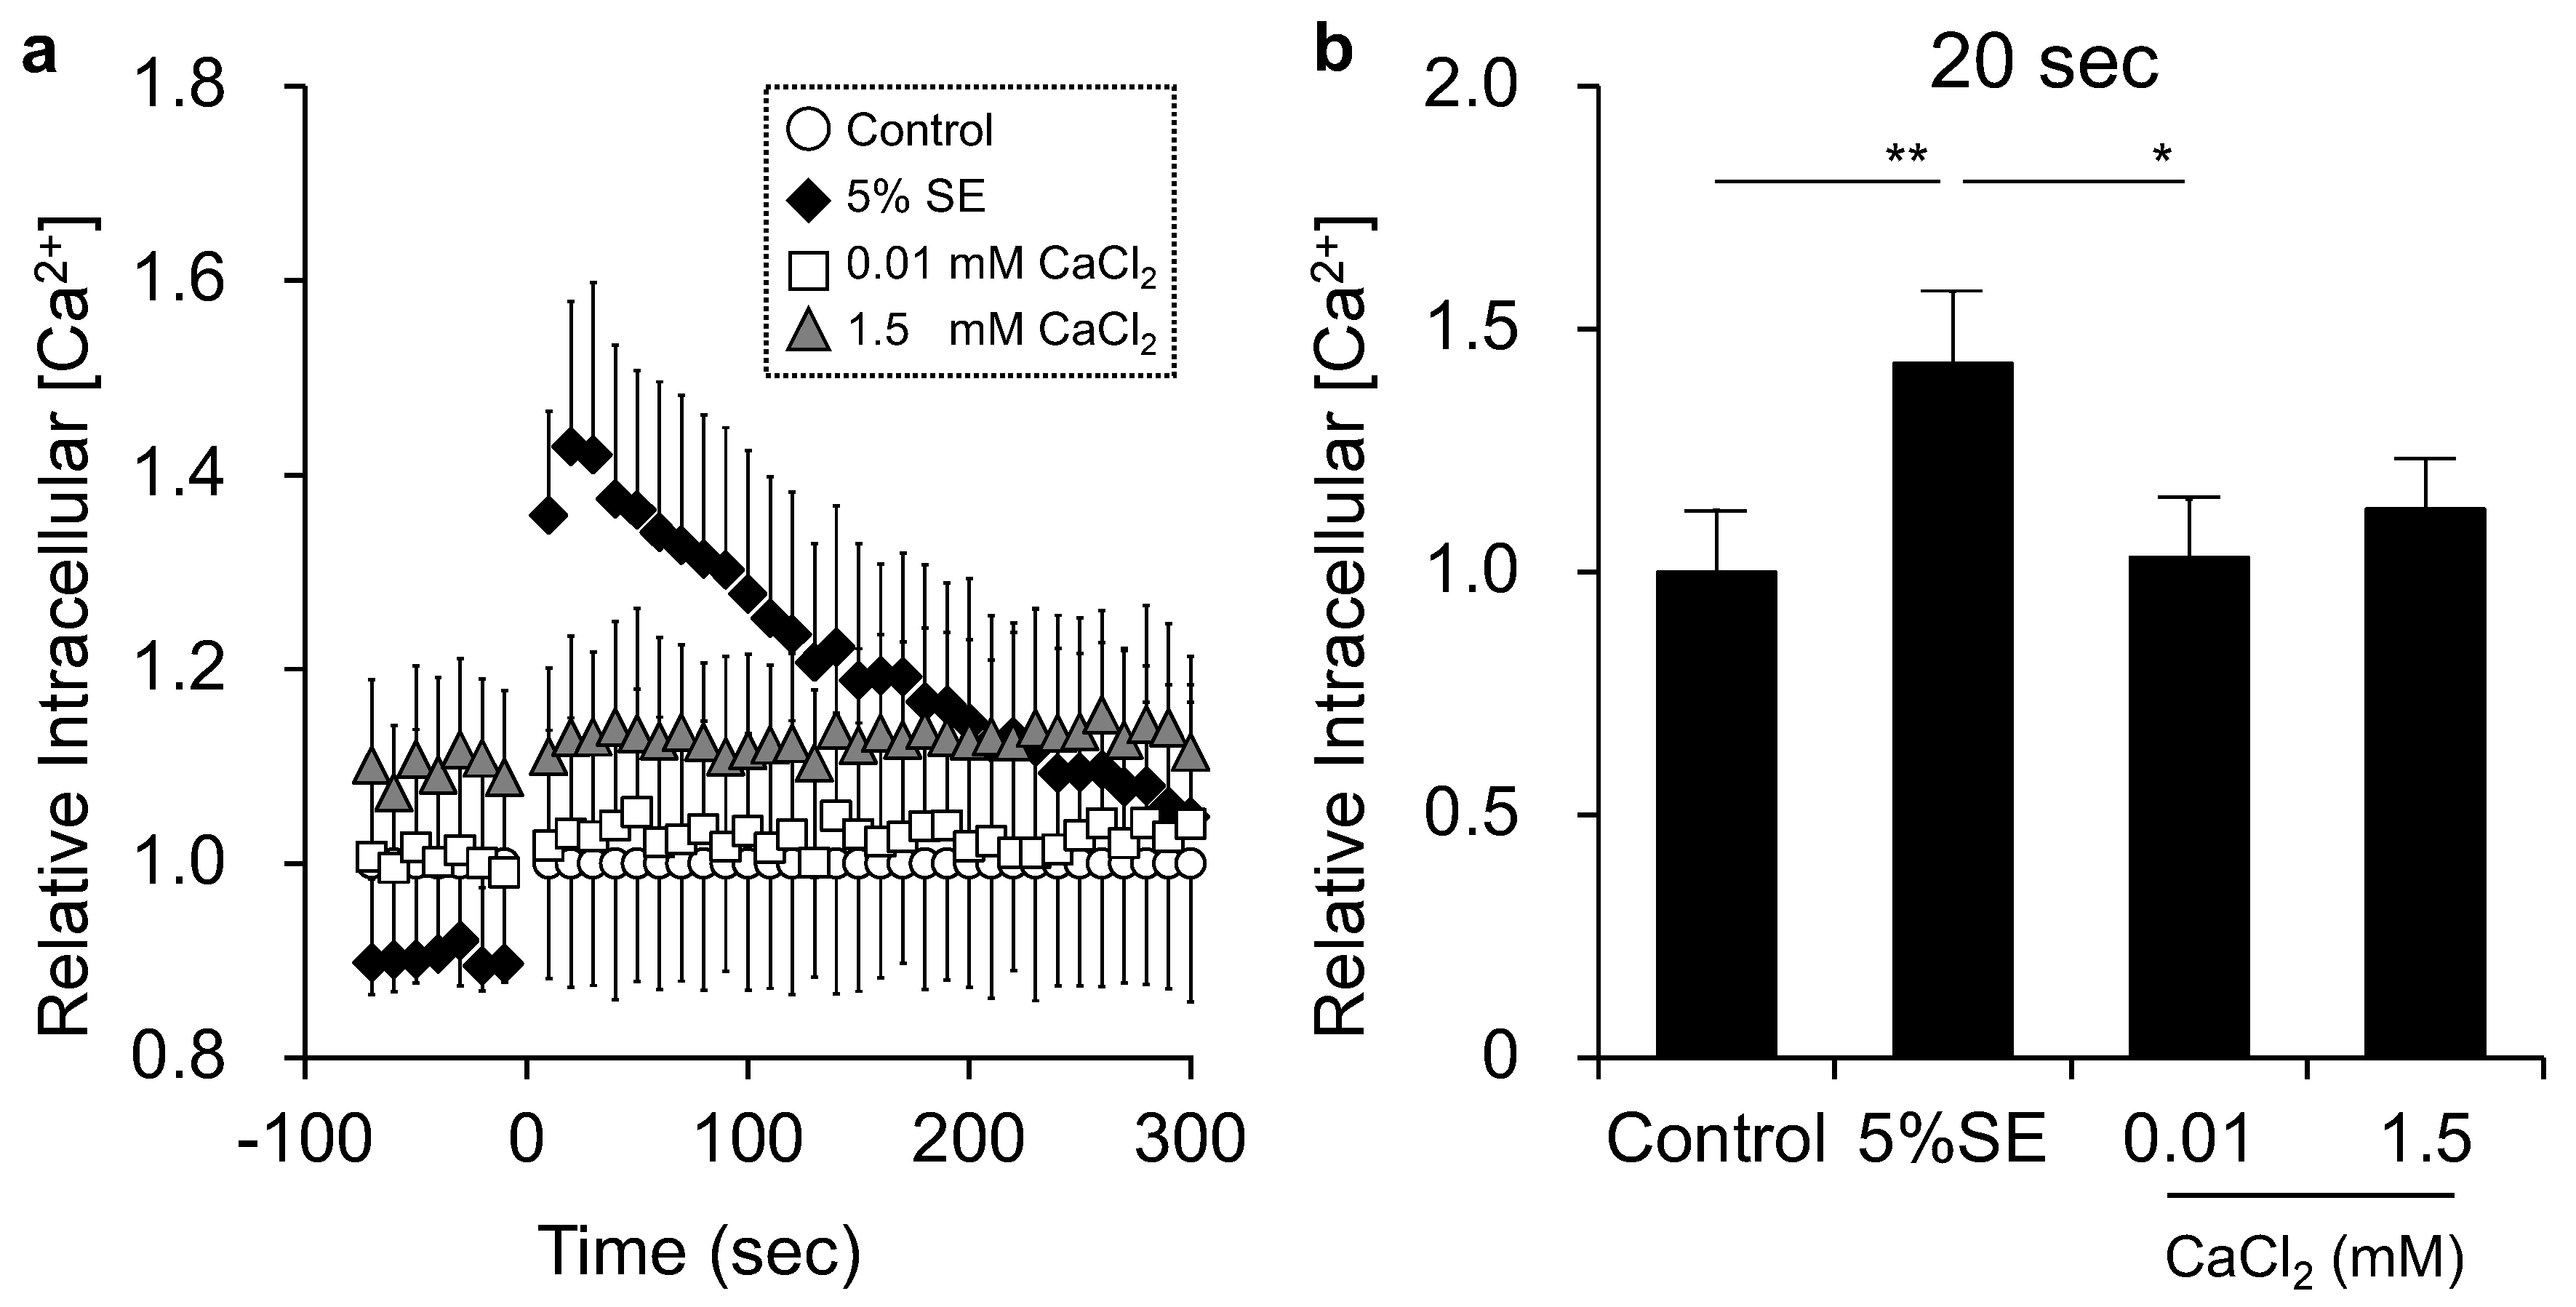
3.4. Effects of Shotokuseki Extract on Intracellular Calcium Levels in NHEKs

Calcium is important in the process of keratinocyte differentiation. Here, we investigated the intracellular concentration of calcium. In SE-treated cells, there was an initial rapid and transient increase in intracellular calcium concentration compared with Control, 0.01, and 1.5 mol/L CaCl2 (Figure 5a). The maximum value was observed 20 sec after the addition of SE, which was 1.5-fold significantly higher than that of the Control group and 0.01 mol/L CaCl2-treated groups (Figure 5b).

4. Discussion

In this study, we hypothesized that Shotokuseki extract contained key minerals that affected keratinocyte differentiation. Initially, minerals present in SE were measured by AAS, revealing the presence of Na, Mg, K, Ca, and Zn ions, indicating that SE contains various minerals (Figure 1).
The epidermis consists of keratinocytes that differentiate from the basal layer to the stratum corneum. Keratinocytes present in the basal layer proliferate and express keratins 5 and 14 [1,2]. As the expression levels of keratins 5 and 14 decrease, these cells move upwards to the stratum spinosum and express the early differentiation markers keratins 1 and 10 [1,2]. Subsequently, the keratinocytes express late differentiation markers involucrin and loricrin [4,5,18]. During the final differentiation process, the cells express transglutaminase, which is essential for the formation of the stratum corneum, and filaggrin, which is a precursor of natural moisturizing factor in keratinocytes [5,19]. Calcium ions are a major regulator of keratinocyte differentiation and proliferation [8], playing important roles in all stages of keratinocyte differentiation, including differentiation in the basal and spinous layers to final differentiation in the stratum granulosum [3,20,21]. The calcium content required for stage-specific expression of differentiation marker proteins varies in each layer of the epidermis [20,21,22]. For example, the calcium concentration required for expression of the late differentiation marker proFLG is high when compared with the extracellular calcium concentration required for expression of keratins 1 and 10 [23]. This suggests that the calcium gradient in the epidermis is important for epidermal differentiation and barrier formation. In general, keratinocytes are promoted to grow at an extracellular calcium concentration of 0.03–0.15 mmol/L. At higher calcium concentrations (1 mmol/L or more), keratinocyte differentiation is induced and proliferative ability is lost [8,24]. In this report, Shotokuseki extract was added to a final concentration of 5% (v/v). The concentration of calcium at this SE concentration was determined to be 0.01 mmol/L. Because the calcium concentration in the medium was 0.06 mmol/L, this indicates that keratinocyte differentiation was not promoted solely by the calcium level in SE. However, the mRNA expression levels of K5, an undifferentiated marker; K10, an early differentiation marker; proFLG, a late differentiation marker; and TGase1 increased significantly in the presence of SE (Figure 3). Furthermore, protein expression of transglutaminase was measured. The expression level of transglutaminase increased significantly when 5% (v/v) SE was added to the keratinocyte culture (Figure 4). Application of the same concentration of calcium (0.01 mM) as 5% SE slightly increased TGase1 protein expression, which is involved in epidermal final differentiation, and its expression was upregulated more than that in 5% SE. This suggests that the promotion of final differentiation of the epidermis by SE treatment is not solely the action of calcium or calcium-dependent but may involve other minerals. Calcium is an important factor in the differentiation process of keratinocytes. We monitored the changes in intracellular calcium concentration in keratinocytes after SE application. The intracellular calcium concentration in the group to which 5% SE was applied increased about 1.4 times (Figure 5). On the other hand, the intracellular calcium concentration of the calcium-added group (0.01 mol/L CaCl2) having the same concentration as 5% SE or the positive control group (1.5 mol/L CaCl2) was almost the same as that of the control group. Keratinocytes have calcium regulatory mechanisms such as calcium-sensing receptors (CaSR), transient receptor potential (TRP) channels, and voltage-gated calcium channels (VGCC) [25,26,27,28,29,30]. It has also been suggested that they are involved in the differentiation of keratinocytes. For example, CaSR knockout decreases mid- to late-stage differentiation marker expression in keratinocytes [31]. TRP channels respond to environmental changes such as temperature, chemicals, osmotic pressure, and pH [32,33,34]. It has been reported that hyperosmotic stimulation causes an increase in the intracellular calcium concentration of keratinocytes, resulting in enhanced differentiation [35]. In addition, after the addition of thermal spring water containing various ions to keratinocytes, TRP vanilloid type 6 (TRPV6)-mediated calcium influx was induced and promoted keratinocyte differentiation [36]. From these reports, it is possible that the application of various ions in SE caused changes in osmotic pressure, pH, which triggered the increase in calcium concentration in keratinocytes. This suggested that various ions contribute to the influx of calcium into the cell and/or the release of calcium stored in the endoplasmic reticulum and other organs. These results indicate that the induction of keratinocyte differentiation may be enhanced by ions other than calcium. However, there are various mechanisms for calcium regulation of keratinocytes. It is necessary to investigate in the future how various ions affect the calcium sensitivity of keratinocytes. In addition, keratinocytes cultured in a monolayer were used. This is the primary limitation of this paper. In future research, we need to use a three-dimensional cultured keratinocytes model to study how minerals that pass through the stratum corneum act and show bioactivity in a living epidermis. Induction of differentiation is hypothesized to facilitate maturation of the stratum corneum and promote the biosynthesis of substances related to the epidermal barrier, such as stratum corneum intercellular lipids and natural moisturizing factors. Measuring the levels of all minerals present in SE must be performed carefully to investigate the effects of trace minerals and mineral ratios on the differentiation of keratinocytes. In the future, SE is expected to have such an effect, just as there have been reports that deep sea water and other water containing various ions have improved the barrier of atopic dermatitis. The ultimate goal is to elucidate the effect of ions in SE on human skin.

5. Conclusions

In the present study, Shotokuseki extract was found to contain several minerals, and treatment of keratinocytes with Shotokuseki extract promoted epidermal differentiation. They may also be related to elevated intracellular calcium in keratinocytes. The results suggest that not only calcium but also other minerals are involved in this differentiation process.

Author Contributions

Conceptualization: K.T., T.K., H.S. and Y.T.; data curation, formal analysis, investigation, methodology, and software: K.T. and T.K.; project administration, supervision, validation: Y.T.; resources: K.T., T.K. and H.S.; visualization: K.T.; writing—original draft: K.T. and Y.T.; writing—review and editing: K.T., T.K., H.S. and Y.T. All authors have read and agreed to the published version of the manuscript.

Funding

This research received no external funding.

Institutional Review Board Statement

Not applicable.

Informed Consent Statement

Not applicable.

Data Availability Statement

The data presented in this study are available on request from the corresponding author.

Conflicts of Interest

The authors declare that they have no conflicts of interest with the contents of this article.

References

  1. Fuchs, E.; Green, H. Changes in keratin gene-expression during terminal differentiation of the keratinocyte. Cell 1980, 19, 1033–1042. [Google Scholar] [CrossRef]
  2. Porter, R.M.; Lane, E.B. Phenotypes, genotypes and their contribution to understanding keratin function. Trends Genet. 2003, 19, 278–285. [Google Scholar] [CrossRef]
  3. Rice, R.H.; Green, H. Presence in human epidermal cells of a soluble protein precursor of the cross-linked envelope: Activation of the cross-linking by calcium ions. Cell 1979, 18, 681–694. [Google Scholar] [CrossRef]
  4. Eckert, R.L.; Yaffe, M.B.; Crish, J.F.; Murthy, S.; Rorke, E.A.; Welter, J.F. Involucrin-structure and role in envelope assembly. J. Investig. Dermatol. 1993, 100, 613–617. [Google Scholar] [CrossRef] [PubMed] [Green Version]
  5. Simon, M.; Green, H. The glutamine residues reactive in transglutaminase-catalyzed cross-linking of involucrin. J. Biol. Chem. 1988, 263, 18093–18098. [Google Scholar] [CrossRef]
  6. Marchese, C.; Rubin, J.; Ron, D.; Faggioni, A.; Torrisi, M.R.; Messina, A.; Frati, L.; Aaronson, S.A. Human keratinocyte growth factor activity on proliferation and differentiation of human keratinocytes: Differentiation response distinguishes KGF from EGF family. J. Cell Physiol. 1990, 144, 326–332. [Google Scholar] [CrossRef] [PubMed]
  7. Bikle, D.D.; Ng, D.; Tu, C.L.; Oda, Y.; Xie, Z. Calcium and vitamin D-regulated keratinocyte differentiation. Mol. Cell Endocrinol. 2001, 177, 161–171. [Google Scholar] [CrossRef]
  8. Hennings, H.; Michael, D.; Cheng, C.; Steinert, P.; Holbrook, K.; Yuspa, S.H. Calcium regulation of growth and differentiation of mouse epidermal cells in culture. Cell 1980, 19, 245–254. [Google Scholar] [CrossRef]
  9. Lee, S.E.; Jun, J.E.; Choi, E.H.; Ahn, S.K.; Lee, S.H. Stimulation of epidermal calcium gradient loss increases the expression of hyaluronan and CD44 in mouse skin. Clin. Exp. Dermatol. 2010, 35, 650–657. [Google Scholar] [CrossRef]
  10. Denda, M.; Katagiri, C.; Hirao, T.; Maruyama, N.; Takahashi, M. Some magnesium salts and a mixture of magnesium and calcium salts accelerate skin barrier recovery. Arch. Dermatol. Res. 1999, 291, 560–563. [Google Scholar] [CrossRef]
  11. Proksch, E.; Nissen, H.P.; Bremgartner, M.; Urquhart, C. Bathing in a magnesium-rich Dead Sea salt solution improves skin barrier function, enhances skin hydration, and reduces inflammation in atopic dry skin. Int. J. Dermatol. 2005, 44, 151–157. [Google Scholar] [CrossRef] [PubMed]
  12. Emri, E.; Miko, E.; Bai, P.; Boros, G.; Nagy, G.; Rózsa, D.; Juhász, T.; Hegeds, C.; Horkay, I.; Remenyik, É.; et al. Effects of non-toxic zinc exposure on human epidermal keratinocytes. Metallomics 2015, 7, 499–507. [Google Scholar] [CrossRef] [PubMed] [Green Version]
  13. Hodak, E.; Gottlieb, A.B.; Segal, T.; Politi, Y.; Maron, L.; Sulkes, J.; David, M. Climatotherapy at the Dead Sea is a remittive therapy for psoriasis: Combined effects on epidermal and immunologic activation. J. Am. Acad. Dermatol. Sci. 2003, 49, 451–457. [Google Scholar] [CrossRef]
  14. Seite, S. Thermal waters as cosmeceuticals: La Roche-Posay thermal spring water example. Clin. Cosmet. Investig. Dermatol. 2013, 6, 23–28. [Google Scholar] [CrossRef] [PubMed] [Green Version]
  15. Bak, J.P.; Kim, Y.M.; Son, J.; Kim, C.J.; Kim, E.H. Application of concentrated deep sea water inhibits the development of atopic dermatitis-like skin lesions in NC/Nga mice. BMC Complement. Altern. Med. 2012, 12, 108. [Google Scholar] [CrossRef] [Green Version]
  16. Lee, K.S.; Chun, S.Y.; Lee, M.G.; Kim, S.; Jang, T.J.; Nam, K.S. The prevention of TNF-α/IFN-γ mixture-induced inflammation in human keratinocyte and atopic dermatitis-like skin lesions in Nc/Nga mice by mineral-balanced deep sea water. Biomed. Pharmacother. 2018, 97, 1331–1340. [Google Scholar] [CrossRef]
  17. Lowry, O.H.; Rosebrough, N.J.; Farr, A.L.; Randall, R.J. Protein measurement with the folin phenol reagent. J. Biol. Chem. 1951, 193, 265–275. [Google Scholar] [CrossRef]
  18. Hohl, D.; Lichti, U.; Breitkreutz, D.; Steinert, P.M.; Roop, D.R. Transcription of the human loricrin gene in vitro is induced by calcium and cell density and suppressed by retinoic acid. J. Investig. Dermatol. 1991, 96, 414–418. [Google Scholar] [CrossRef] [Green Version]
  19. Fleckman, F.; Dale, B.A.; Holbrook, K.A. Profilaggrin, a high-molecular-weight precursor of filaggrin in human epidermis and cultures keratinocytes. J. Investig. Dermatol. 1985, 85, 507–512. [Google Scholar] [CrossRef] [Green Version]
  20. Menon, G.K.; Grayson, S.; Elias, P.M. Ionic calcium reservoirs in mammalian epidermis: Ultrastructural localization by ion-capture cytochemistry. J. Investig. Dermatol. 1985, 84, 508–512. [Google Scholar] [CrossRef] [Green Version]
  21. Menon, G.K.; Elias, P.M. Ultrastructural localization of calcium in psoriatic and normal human epidermis. Arch. Dermatol. 1991, 127, 57–63. [Google Scholar] [CrossRef] [PubMed]
  22. Elias, P.M.; Ahn, S.K.; Brown, B.E.; Crumrine, D.; Feingold, K.R. Origin of the epidermal calcium gradient: Regulation by barrier status and role of active vs passive mechanisms. J. Investig. Dermatol. 2002, 119, 1269–1274. [Google Scholar] [CrossRef] [PubMed] [Green Version]
  23. Yuspa, S.H.; Kilkenny, A.E.; Steinert, P.M.; Roop, D.R. Expression of murine epidermal differentiation markers is tightly regulated by restricted extracellular calcium concentrations in vitro. J. Cell Biol. 1989, 109, 1207–1217. [Google Scholar] [CrossRef] [PubMed] [Green Version]
  24. Pillai, S.; Bikle, D.D.; Hincenbergs, M.; Elias, P.M. Biochemical and morphological characterization of growth and differentiation of normal human neonatal keratinocytes in a serum-free medium. J. Cell Physiol. 1988, 134, 229–237. [Google Scholar] [CrossRef] [PubMed]
  25. Bikle, D.D.; Ratnam, A.; Mauro, T.; Harris, J.; Pillai, S. Changes in calcium responsiveness and handling during keratinocyte differentiation. Potential role of the calcium receptor. J. Clin. Investig. 1996, 97, 1085–1093. [Google Scholar] [CrossRef]
  26. Tu, C.L.; Chang, W.; Bikle, D.D. The extracellular calcium-sensing receptor is required for calcium-induced differentiation in human keratinocytes. J. Biol. Chem. 2001, 276, 41079–41085. [Google Scholar] [CrossRef] [Green Version]
  27. Caterina, M.J.; Pang, Z. TRP channels in skin biology and pathophysiology. Pharmaceuticals 2016, 9, 77. [Google Scholar] [CrossRef] [Green Version]
  28. Tóth, B.I.; Oláh, A.; Szöllősi, A.G.; Bíró, T. TRP channels in the skin. Br. J. Pharmacol. 2014, 171, 2568–2581. [Google Scholar] [CrossRef] [Green Version]
  29. Ho, J.C.; Lee, C.H. TRP channels in skin: From physiological implications to clinical significances. Biophysics 2015, 11, 17–24. [Google Scholar] [CrossRef] [Green Version]
  30. Denda, M.; Fujiwara, S.; Hibino, T. Expression of voltage-gated calcium channel subunit alpha1C in epidermal keratinocytes and effects of agonist and antagonists of the channel on skin barrier homeostasis. Exp. Dermatol. 2006, 5, 455–460. [Google Scholar] [CrossRef]
  31. Tu, C.L.; Crumrine, D.A.; Man, M.Q.; Chang, W.; Elalieh, H.; You, M.; Elias, P.M.; Bikle, D.D. Ablation of the calcium-sensing receptor in keratinocytes impairs epidermal differentiation and barrier function. J. Investig. Dermatol. 2012, 132, 2350–2359. [Google Scholar] [CrossRef] [PubMed] [Green Version]
  32. Caterina, M.J.; Julius, D. The vanilloid receptor: A molecular gateway to the pain pathway. Annu. Rev. Neurosci. 2001, 24, 487–517. [Google Scholar] [CrossRef] [PubMed] [Green Version]
  33. Montell, C.; Birnbaumer, L.; Flockerzi, V.; Bindels, R.J.; Bruford, E.A.; Caterina, M.J.; Clapham, D.E.; Harteneck, C.; Heller, S.; Julius, D.; et al. A unified nomenclature for the superfamily of TRP cation channels. Mol. Cell 2002, 9, 229–231. [Google Scholar] [CrossRef]
  34. Ramsey, I.S.; Delling, M.; Clapham, D.E. An introduction to TRP channels. Annu. Rev. Physiol. 2006, 68, 619–647. [Google Scholar] [CrossRef] [Green Version]
  35. Dascalu, A.; Matithyou, A.; Oron, Y.; Korenstein, R. A hyperosmotic stimulus elevates intracellular calcium and inhibits proliferation of a human keratinocyte cell line. J. Investig. Dermatol. 2000, 115, 714–718. [Google Scholar]
  36. Lehen’kyi, V.; Vandenberghe, M.; Belaubre, F.; Julié, S.; Castex-Rizzi, N.; Skryma, R.; Prevarskaya, N. Acceleration of keratinocyte differentiation by transient receptor potential vanilloid (TRPV6) channel activation. J. Eur. Acad. Dermatol. Venereol. 2011, 1, 12–18. [Google Scholar] [CrossRef]
Figure 1. Mineral concentration of Shotokuseki extract. The mineral concentrations were analyzed by atomic absorption spectroscopy. Data are expressed as mean ± S.D. of three to six independent experiments.
Applsci 12 02270 g001
Figure 2. Cell viability and cell number of Shotokuseki extract on normal human epidermal keratinocytes (NHEKs). (a) Cells were treated with Shotokuseki extract for 24 h. Cell viability was determined by the MTT assay. Data are expressed as a percentage of control group and expressed as mean ± S.D. of six independent experiments. (b) Cells were treated with Shotokuseki extract for four days. Cell numbers were determined by the trypan blue exclusion test. Data are expressed as a percentage of control group and expressed as mean ± S.D. of three independent experiments. * p < 0.05 (compared with control group). Statistical significance was evaluated using the Dunnett’s multiple comparison test.
Applsci 12 02270 g002
Figure 3. Effects of Shotokuseki extract on gene expression of differentiation markers in NHEKs. Cells were treated with Shotokuseki extract for 2–8 days. (a) K5, (b) K10, (c) proFLG, and (d) TGase mRNA expression were assessed by RT-qPCR. Each expression was normalized to the housekeeping gene, GAPDH. Data are expressed as mean ± S.D. of three independent experiments. * p < 0.05, ** p < 0.01, and *** p < 0.001 (compared with control group). Statistical significance was evaluated using the Dunnett’s multiple comparison test.
Applsci 12 02270 g003
Figure 4. Effects of Shotokuseki extract on protein expression of differentiation markers in NHEKs. Cells were treated with Shotokuseki extract for 8 days. (a) Filaggrin and (b) TGase1 protein expression levels were assessed by quantitative Western blotting analysis. Each expression was normalized to the housekeeping protein β-actin. Data are expressed as mean ± S.D. of three independent experiments. * p < 0.05, ** p < 0.01, and *** p < 0.001. Statistical significance was evaluated using the Tukey’s post hoc multiple comparison test.
Applsci 12 02270 g004
Figure 5. Effects of Shotokuseki extract on intracellular calcium concentration in NHEKs. Intracellular calcium concentration was evaluated as detailed in the Materials and Methods section using Fura-2 AM. (a) intracellular calcium concentration profile intracellular calcium concentration profile (b) intracellular calcium concentration after 20 s. Data represent the mean ± S.D. of four independent experiments. * p < 0.05 and ** p < 0.01. Statistical significance was evaluated using the Tukey’s post hoc multiple comparison test.
Applsci 12 02270 g005
Publisher’s Note: MDPI stays neutral with regard to jurisdictional claims in published maps and institutional affiliations.

