1. Introduction
Oligonucleotide therapies are currently experiencing a resurgence, driven by advances in backbone chemistry and discoveries of novel therapeutic pathways that can be uniquely and efficiently modulated by oligonucleotide drugs. A quarter of a century has passed since oligonucleotides were first administered to brains of living mammals to modulate gene expression. Despite challenges in non-systemic local delivery, multiple oligonucleotide-based compounds are currently delivered for treatment of central nervous disorders by direct intrathecal (i.th) administration—to circumvent a more or less intact blood brain barrier [
1,
2,
3,
4,
5].
The most prominent candidate is Spinraza
TM (Nusinersen), a new treatment of spinal muscular atrophy (SMA), which was supported by safety assessment of chronic i.th bolus delivery in cynomolgus monkeys (
Macaca fascicularis) [
6,
7,
8,
9].
The disequilibrium of neuroregeneration and neurodegeneration with a shift towards the latter, and a premature neuronal loss in specific brain areas is one major characteristic of neurodegenerative disorders, independent of the individual patient’s genetic disease background. Preceding disease manifestation, neuronal loss is compensated at least in earlier disease stages by suitable cell replacement (e.g., by increased neurogenesis) [
10,
11,
12,
13]. In neurodegenerative disorders or even in aged patients, a multitude of partly known causes lead to enhanced inflammation and, among other cytokines, to increased TGF-ß concentrations in parenchyma and CSF [
14,
15,
16,
17]. The excess of TGF-ß heavily activates TGF-ß signaling pathways in cells positive for TGFBR2. Crucially, among cells positive for this receptor are neuronal progenitor stem cells, which respond on this exaggerated TGF-ß signaling by decreasing cell division [
18]. However, these stem cells are essential for a physiological replacement mechanism (e.g., pathological motor neuron decay, as in ALS). TGFBR2 as essential ligand binding receptor is the key element to activate the TGF-ß signaling cascades. Targeting the mRNA of TGFBR2 also results in protecting neuronal stem cells from cell cycle arrest in their physiological proliferation and conclusively in brain repair mechanism. Other relevant mechanisms addressed by targeting the TGFBR2 are immune regulation, extracellular matrix and fibrosis, which may contribute to the neurodegenerative process [
19,
20], and finally, autophagy.
In order to dampen an exaggerated TGFBR2-mediated signaling, we developed a novel LNA-Gapmer ASO. Previous in vitro and in vivo studies demonstrate a safe, low toxic, and highly efficient profile of this drug candidate [
21,
22].
As described above, many antisense oligonucleotide (ASOs) drugs are developed for neuronal disorders. Due to the inability to cross the blood brain barrier, ASOs require direct administration into the cerebrospinal fluid (CSF): i.th. bolus delivery in cynomolgus monkeys is a preferred method in preclinical safety assessment of central nervous system (CNS) drugs [
23,
24]. Occasionally, port-catheterization is preferred for overcoming some more specific pharmacokinetic limitations [
25,
26,
27].
ASOs are chemically synthesized and generally require preclinical safety testing in a rodent and a non-rodent species. Yet, they may show limited or even absent pharmacological activity in rodents and thus may be tested in non-rodents only. The cynomolgus monkey is the preferred non-rodent species for ASO safety testing, because many potential drugs against neurodegenerative diseases, particularly antisense oligonucleotides (ASOs), are administered via lumbar i.th. injection, as they do not efficiently cross the blood-brain barrier. This route is well established in cynomolgus monkeys that are commonly used for preclinical safety assessment when other nonrodent species such as dog or minipig cannot be used. Typically, a preclinical safety program for a novel ASO drug candidate comprises a maximum-tolerated-dose (MTD) study, a study addressing the pharmacokinetic profile of the drug, a non-GLP repeated dose study to determine a suitable dose range, and finally, a pivotal GLP-compliant repeated dose toxicity study. Here, we present a novel approach towards preclinical safety testing of ASOs targeting the CNS in the scope of a first-in-human clinical trial.
This preclinical approach consists of only two studies. The first study is conducted under non-GLP conditions and comprises three phases conducted in only 26 animals. This study is then followed by a GLP-compliant repeated dose toxicity study as described elsewhere [
28]. No pivotal toxicity testing was conducted in rodents, but non-specific toxicity was tested in mice, and drug efficacy was evaluated by in vitro work [
21]. The presented study design was successfully implemented in an antisense design project to support rapid entry into clinical development. The objectives of the study were (a) to determine the maximum tolerated dose of the test item, NVP-13, following intrathecal administrations in Phase A, (b) to determine the pharmacokinetics of the test item after i.th. application in Phase B, and (c) to determine the dose-range for a 13-week GLP repeated intrathecal dose toxicity study.
2. Materials and Methods
2.1. Animals
Male (n = 13) and female (n = 13) (Phase A: Male (n = 1) and female (n = 1); Phase B: Male (n = 4) and female (n = 4); Phase C: Male (n = 8) and female (n = 8)). Cynomolgus monkeys (Macaca fascicularis, supplied from a self-sustaining colony in Asia (Nafovanny Tam Phuoc Ward, Bien Hoa City, Dong Nai Province, Vietnam)), with the age of 2 to 6 years, weighing 2.2 to 5 kg were housed in groups of 3 animals. The animals were randomized to treatment groups to ensure equal bodyweight per group and sex. All animals were kept in an AAALAC accredited facility under standard laboratory conditions in a climate-controlled room with a minimum of 8 air changes/hour (12-h light/dark cycle, 19 to 25 °C, 40 to 70% humidity). All animals received a certified lab diet for primates (LabDiet 5048) twice daily, supplemented by fresh fruits and vegetables and had access to tap water (H2O) ad libitum. Immediately after each handling/manipulation, the animals received a tasty reward. All experimental procedures are in compliance with the German Animal Welfare Act and are approved by the local IACUC. The study was approved by the local authority (Landesamt für Natur, Umwelt und Verbraucherschutz, NRW) and registered under following file number: 84-02.04.2017.A093. This study was performed in compliance with the following guidelines or recommendations concerning preclinical development of human pharmaceuticals:
European Directive 2001/83/EC and all subsequent amendments;
German Drug Law;
International Conference on Harmonization (ICH) Guideline: Guidance on Non-clinical Safety Studies for the Conduct of Human Clinical Trials and Marketing Authorization for Pharmaceuticals, M3(R2), issued in EMA as CPMP/ICH/286/95.
2.2. Antisense Oligonucleotide (NVP-13)
NVP-13, a 16-mer Gapmer LNA-Antisense Oligonucleotide was designed as the drug candidate to specifically hybridize with the mRNA for TGFBR2 [
21]. The ASO exerts no cross-reactivity in rodents, dogs or minipigs, due to this high specificity. Therefore, non-human primates such as the cynomolgus monkeys had to be used for preclinical testing. Dose levels in this study were based on in vitro data (human neuronal progenitor cells) [
21] and on recently published data for the treatment of spinal muscular atrophy (SMA) [
6,
7,
8,
9]. The LNA ASO targeting TGFBR2 of this study has chemical class similarity with the 2-MOE ASO Nusinersen of the published SMA data. The route of administration was chosen because it is the intended human therapeutic route.
2.3. Test System Justification
The ASO being investigated in this particular study is highly specific for the human target TGFBR2 message and consequently is only effective in humans and monkeys (species specific). The ASO exerts no cross-reactivity in other species, including rodents, due to this high specificity. Therefore, cynomolgus monkeys must be used.
2.4. Test Item
NVP-13 (Biospring Frankfurt, Batch 249403, under license of Exiqon) was delivered as a lyophilized powder and was formulated in accordance to mixing procedures provided by the Sponsor, using 0.9% Sodium Chloride for Injection. Artificial CSF (aCSF, from R AND D SYSTEMS INC., Minneapolis, MN, USA) was used to flush the test or control item (vehicle) after dosing.
2.5. Dose Administration and Rationale
The rationale for the selection of dose levels in Phase A was based on our own in vitro data (human neuronal progenitor cells [
21]) and on recently published data for the treatment of spinal muscular atrophy [
6,
9,
29,
30]. The LNA ASO targeting TGFBR2 of this study has strong chemical similarity with the 2-MOE ASO Nusinersen of the published SMA data. Therefore, the dose-escalation scheme in Phase A was in close relationship to those published data. Doses for Phases B and C were adapted with respect to results of Phase A. The high dose for Phase C aimed to produce target organ toxicity or non-specific toxicity. The intermediate dose for Phase C was the geometric mean of the low and high doses, and the low dose should have produced a pharmacodynamic effect, the desired therapeutic effect, or CSF levels similar to those expected in humans.
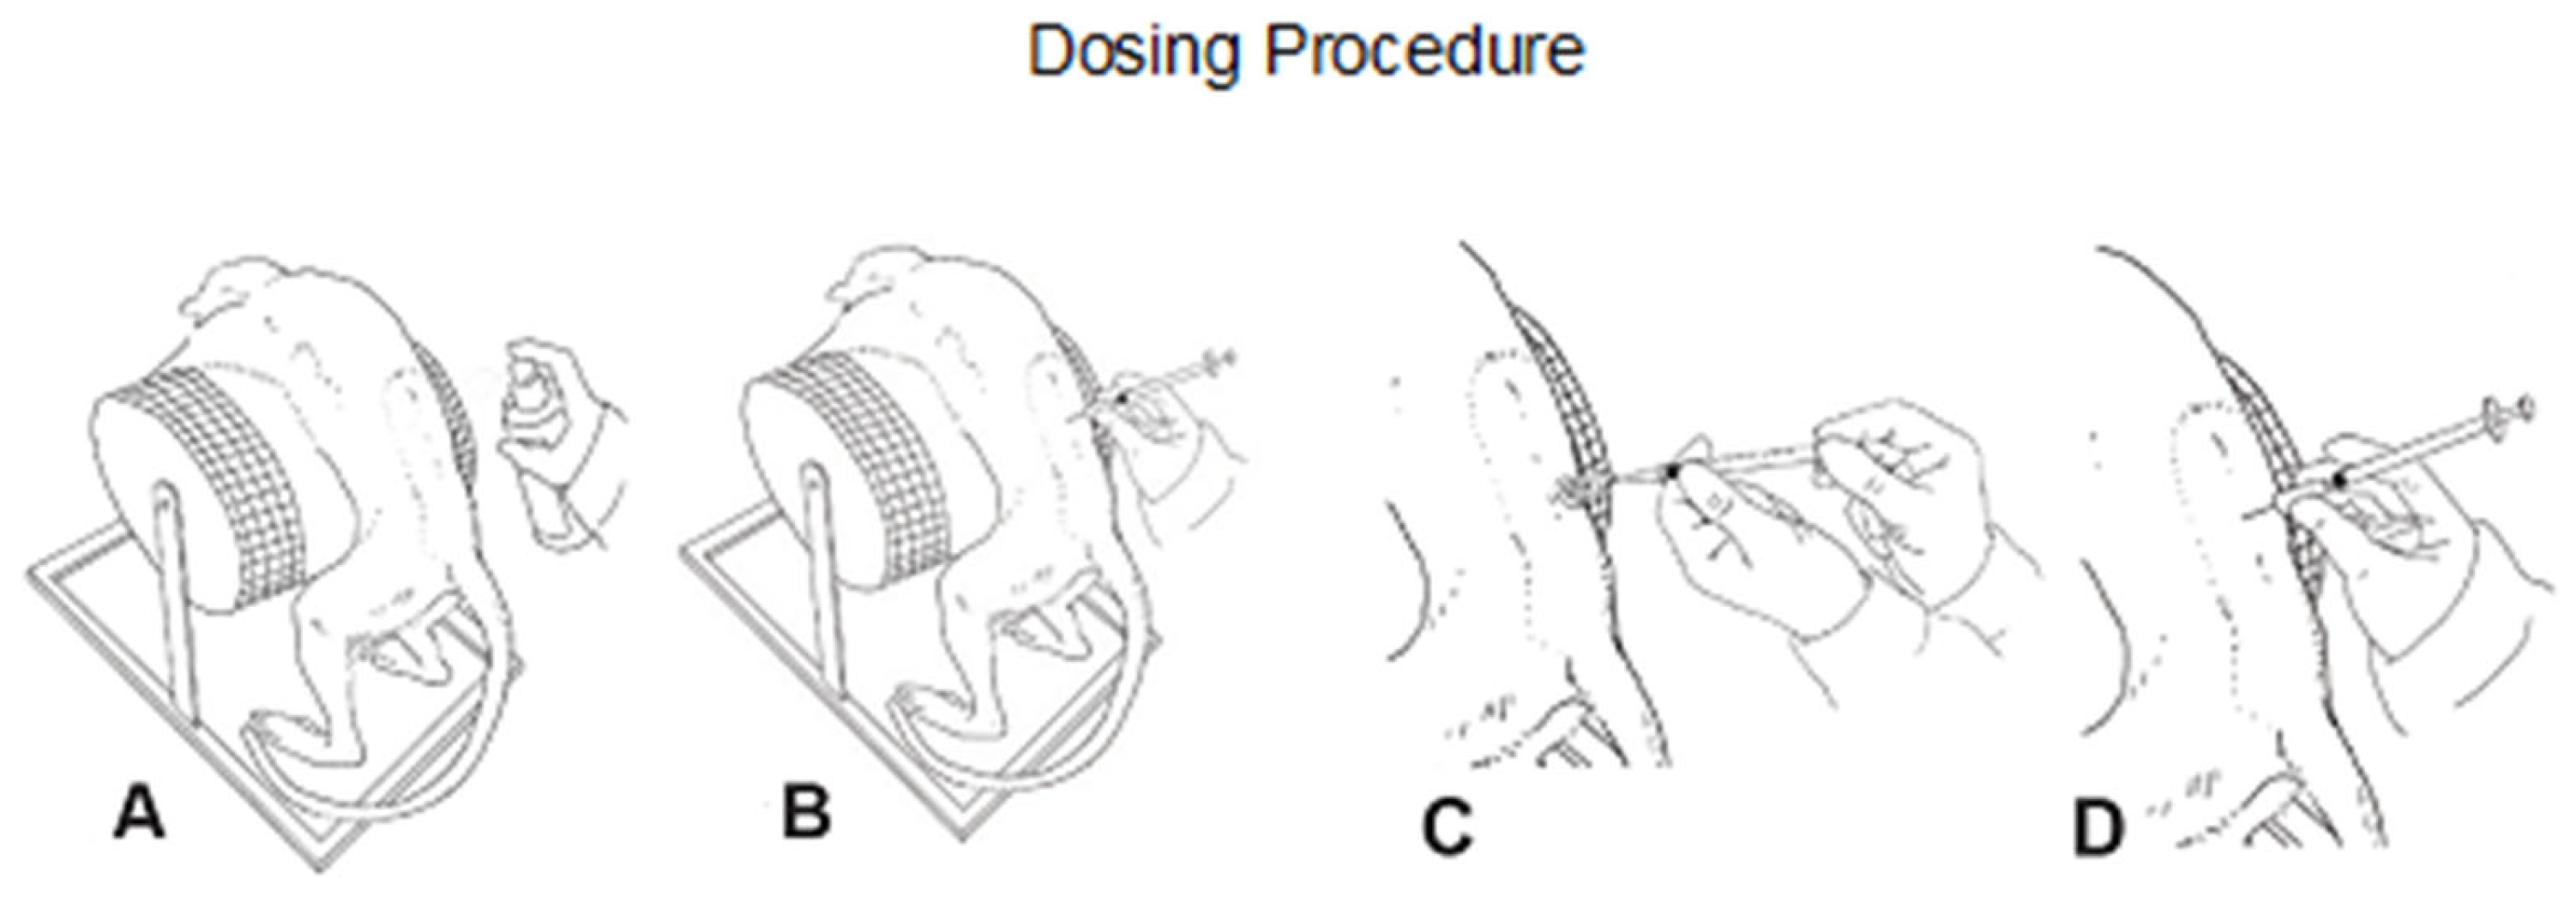
2.6. Dosing Procedure
For intrathecal dosing, animals were fasted and anesthetized with ketamine and medetomidine. After disinfecting the skin, a micro incision of the skin was conducted using a 20G needle. A pencil-point needle for pediatric use (Pencan Paed
® needle, 25 G, B. Braun Melsungen AG, 34212 Melsungen, Germany) was then inserted at L4/L5 until CSF flow was observed (L3/4, L2/L3 were used if no CSF flow was observed). A volume of 0.5 mL CSF was removed for analytical purposes and to adjust for the volume addition by the test article. Thereafter, 0.75 mL of test article or aCSF (artificial cerebrospinal fluid; aCSF, from R AND D SYSTEMS INC) were injected over approximately 1 min, followed by a 0.25 mL flush with aCSF to empty the needle (
Figure 1B). Needle and syringe were left in the dosing site for at least 30 s after the aCSF flush. Bepanthen
® aseptic wound ointment (contains chlorhexidine and dexpanthenol) was applied immediately after each dosing. Thereafter, the animal was placed in a lying position for 15 min before the antidote was applied.
2.7. Study Design
In
Phase A (tolerability/dose escalation), one male (Animal P0001M) and one female (Animal P0101F) of Group 1 were dosed once weekly on Days 1, 8, 15, 22, and 29, with five escalating doses (0.4, 0.8, 4, and 20 mg/animal). After 5 weeks, these animals were sacrificed on Day 36 (
Figure 2, Phase A).
In
Phase B (pharmacokinetics), animals were dosed once on Day 1 with 0.8 mg/animal (Groups 2 and 3) or 4 mg/animal (Groups 4 and 5). One animal/sex/group was used in Groups 2 through 5. After 2 weeks, animals of Groups 2 and 4 were sacrificed on Day 14. After 4 weeks, animals of Groups 3 and 5 were sacrificed on Day 29 (
Figure 2, Phase B).
In
Phase C (dose-range finding for toxicity), animals were dosed weekly for the first 4 weeks of that phase and every other week thereafter (nine doses total)—(on Days 1, 8, 15, 22, 29, 43, 57, 71, and 85 of Phase C). Phase C was conducted with four animals/sex/group. Group 6 animals were administered 0.4 mg/animal, and Group 7 animals were administered 4 mg/animal. After 13 weeks, both groups were sacrificed on Day 91 (
Figure 2, Phase C).
2.8. Plasma Collection
Blood samples (total: 4.3 mL per animal; 1.3 mL for toxicokinetic examination and 3.0 mL for clinical chemistry) were collected from the vena cephalica antebrachii or vena saphena into K2EDTA tubes from all animals. Blood samples were gently mixed by hand and were stored on crushed ice prior to centrifugation. Plasma was obtained by centrifugation at 4 °C and approximately 2300× g for 10 min. The plasma was aliquoted into four labeled micro tubes (three aliquots with at least 0.1 mL each and one aliquot with the remaining fluid) and stored frozen at −70 °C or below.
2.9. Cerebrospinal Fluid Collection
The CSF samples (approximately 0.3 mL, at the 24-h time point only 0.25 mL) were collected by lumbar puncture from fasted and anesthetized animals into micro-tubes (Sarstedt G & Co. KG, Sarstedtstraße 1, 51588 Nümbrecht, Germany) at multiple time points using the same spinal needle as for dosing. The CSF samples were sunk into liquid nitrogen immediately after sampling and stored at −70 °C or below.
2.10. Tissue Collection
- (A)
Brain: The brain was sectioned in a brain matrix at 4-mm coronal slice thickness. Each coronal slice was further divided sagittally into right and left hemispheres. The left hemisphere was preserved in 10% neutral buffered formalin for processing and microscopic evaluation. The right hemisphere was frozen at −70 °C for bioanalytical, mRNA, and biomarker analysis.
- (B)
Spinal Cord: The spinal cord was divided into cervical, thoracic, and lumbar sections. Each section was further divided into two portions. A 3-cm portion from the rostral end of each section was frozen at −70 °C for bioanalytical, mRNA, and biomarker analysis, and the remaining portion was fixed in 10% neutral-buffered formalin for microscopic evaluation. In addition, a section for histology was taken proximal to the injection site (e.g., between L3 and L4).
- (C)
Liver and Kidney: The liver (left lobe) and the kidney (cortex and medulla) were harvested. Samples of liver and kidney were split into two of 0.25 g each; samples were frozen at −70 °C or below for bioanalytical analysis.
2.11. Clinical Observations
Throughout the entire study, all animals were observed twice a day for any signs of ill health or overt toxicity (clinical observations). In addition, animals were clinically examined in detail once a week. Feces were evaluated daily.
2.12. In-Life Parameters
Standard in-life parameters included body weight, food consumption, physical and neurologic examinations, neurobehavioral observations, and ophthalmic observations were performed on regular timepoints throughout the entire experimental time of each phase.
2.13. Clinical Pathology
Blood samples (3.0 mL) were withdrawn from all animals once during the pre-dose phase, during Week 13 of the dosing phase, and from all surviving animals during the last week of the recovery phase. Samples were collected from the
vena cephalica antebrachii or
vena saphena and hematology tests (
Table 1), coagulation tests, and clinical chemistry tests (
Table 2) were performed.
2.14. End of In-Life Phase
All animals were subjected to necropsy. All animals were fasted overnight prior to scheduled necropsies. Where possible, necropsies were carried out in replicate in order to ensure equal numbers of animals from each group and/or sex were sacrificed on each day. Animals were administered an intramuscular injection of ketamine hydrochloride, which was followed by an intravenous overdose of sodium pentobarbitone prior to exsanguination.
2.15. Necropsy, Organ Weights, and Macroscopic Observations
A full macroscopic examination was performed under the general supervision of a Pathologist, and all findings were recorded.
2.16. Histology
Brain, spinal cord, liver, kidney, and lymph node tissue from each animal were trimmed and embedded in paraffin wax, sectioned at a nominal 5 μm, stained with hematoxylin and eosin and analyzed for microscopic alterations. Sectioning of the brain was performed such that, at a minimum, the following structures were captured: neocortex (including frontal, parietal, temporal and occipital cortex), paleocortex (olfactory bulbs and/or piriform lobe), basal ganglia (including caudate and putamen), limbic system (including hippocampus and cingulate gyri), thalamus/hypothalamus, midbrain regions including substantia nigra, subventricular zone, cerebellum, pons, and medulla oblongata.
2.17. Microscopic Observations
Tissues were examined microscopically by a pathologist.
2.18. NVP-13 Concentration Measurement
Plasma: The analytical work was done in accordance to standard operating procedures and for each chromatographic analysis batch, a detailed assay protocol was generated and retained as raw data. The method was validated at Axolabs prior to the start of this study phase. Results of the method validation are summarized in the Method Validation Report for the PNA-HPLC-Assay for cynomolgus monkey plasma: AN57.0-17.
The analytical method is based on an AEX-HPLC method with fluorescence detection that allows the sensitive and specific detection of NVP-13 from cynomolgus monkey plasma samples. The assay is based on the specific hybridization of a 16-mer complementary PNA-probe conjugated at the N-terminus with Atto425 dye. The duplex of PNA and parent compound yields a specific signal in the subsequent analysis by AEX-HPLC coupled to a fluorescence detector, as described in detail earlier [
21]. Quantification is performed based on an external calibration curve generated from a standard dilution series in cynomolgus monkey plasma. Linear calibration curves (weighted 1/X) are calculated from 1 ng/mL to 5000 ng/mL.
CSF: The method of analysis used in this study is documented in Standard test Method: STM_NVP-13_CynoCSF. The analytical work was done in accordance with Axolabs’ SOP RA-001 and for each chromatographic analysis batch, a detailed assay protocol was generated and retained as raw data. The method was validated at Axolabs prior to the start of this study phase. Results of the method validation are summarized in the Method Validation Report for the PNA-HPLC-Assay for cynomolgus monkey plasma: AN58.0-17.
The analytical method is based on an AEX-HPLC method as described above (Plasma section) using cynomolgus CSF instead of plasma for calibration.
Tissue: The method of analysis used is documented in the Method Development Report: MDR NVP-13 & 19_PNA-HPLC-Assay. The analytical work was done in accordance to SOP RA-001 and for each chromatographic analysis batch, a detailed assay protocol was generated and retained as raw data. The method was qualified previously at Axolabs under Method Development Project No. AN479.0-15 prior to the start of this study.
Details on all mentioned protocols and reports may be provided by the corresponding author upon reasonable request.
2.19. Statistics
Due to low animal number in Phases A and B, statistical analysis was only performed in Phase C. For graph design and statistical comparison, GraphPad Prism 8 was employed. All parameters were tested for Gaussian distribution using the D’Augostino–Pearson omnibus normality test or the Shapiro–Wilk normality test (samples sizes too small for the D’Augostino–Pearson omnibus normality test). Afterwards, all parameters were analyzed using a one-way ANOVA followed by Tukey post hoc test or a Kruskal–Wallis test followed by Dunn’s post hoc test, depending on Gaussian distribution. Data are presented as median with min to max or mean ± SEM depending on statistical analysis. Significance was taken at p ≤ 0.05.
3. Results
Phase A: Dose levels were escalated from 0.4 mg/dose to 20 mg/dose. The only adverse test item-related finding was observed at a dose level of 20 mg/animal:
The Phase A female (Animal P0101F) was prematurely sacrificed on Day 29 due to apparent neurological findings at 20-mg dose (paralysis of arms and legs, missing tendon reflexes). In autopsy, no microscopic correlate to this finding could be identified. A test item-related finding of neuronal vacuolation was noted in the cerebral cortex and hippocampus of this animal‘s brain; this finding is common with intrathecally delivered ASOs and was considered not responsible for the paralysis of the animal.
Following single escalating intrathecal doses of NVP-13 at dose levels up to 20 mg/animal, plasma and CSF concentrations of NVP-13 generally increased with dose. However, the observed changes in NVP-13 exposure relative to the increases in dose level were inconsistent, probably due to inter-animal variability and the small number of animals (N = 1/sex) used.
Tissue concentrations were measured after final dosing on the day of necropsy (day 36) in kidneys, liver and including spinal cord.
NVP-13 reaches CNS regions of interest following repeated intrathecal administrations with escalating doses.
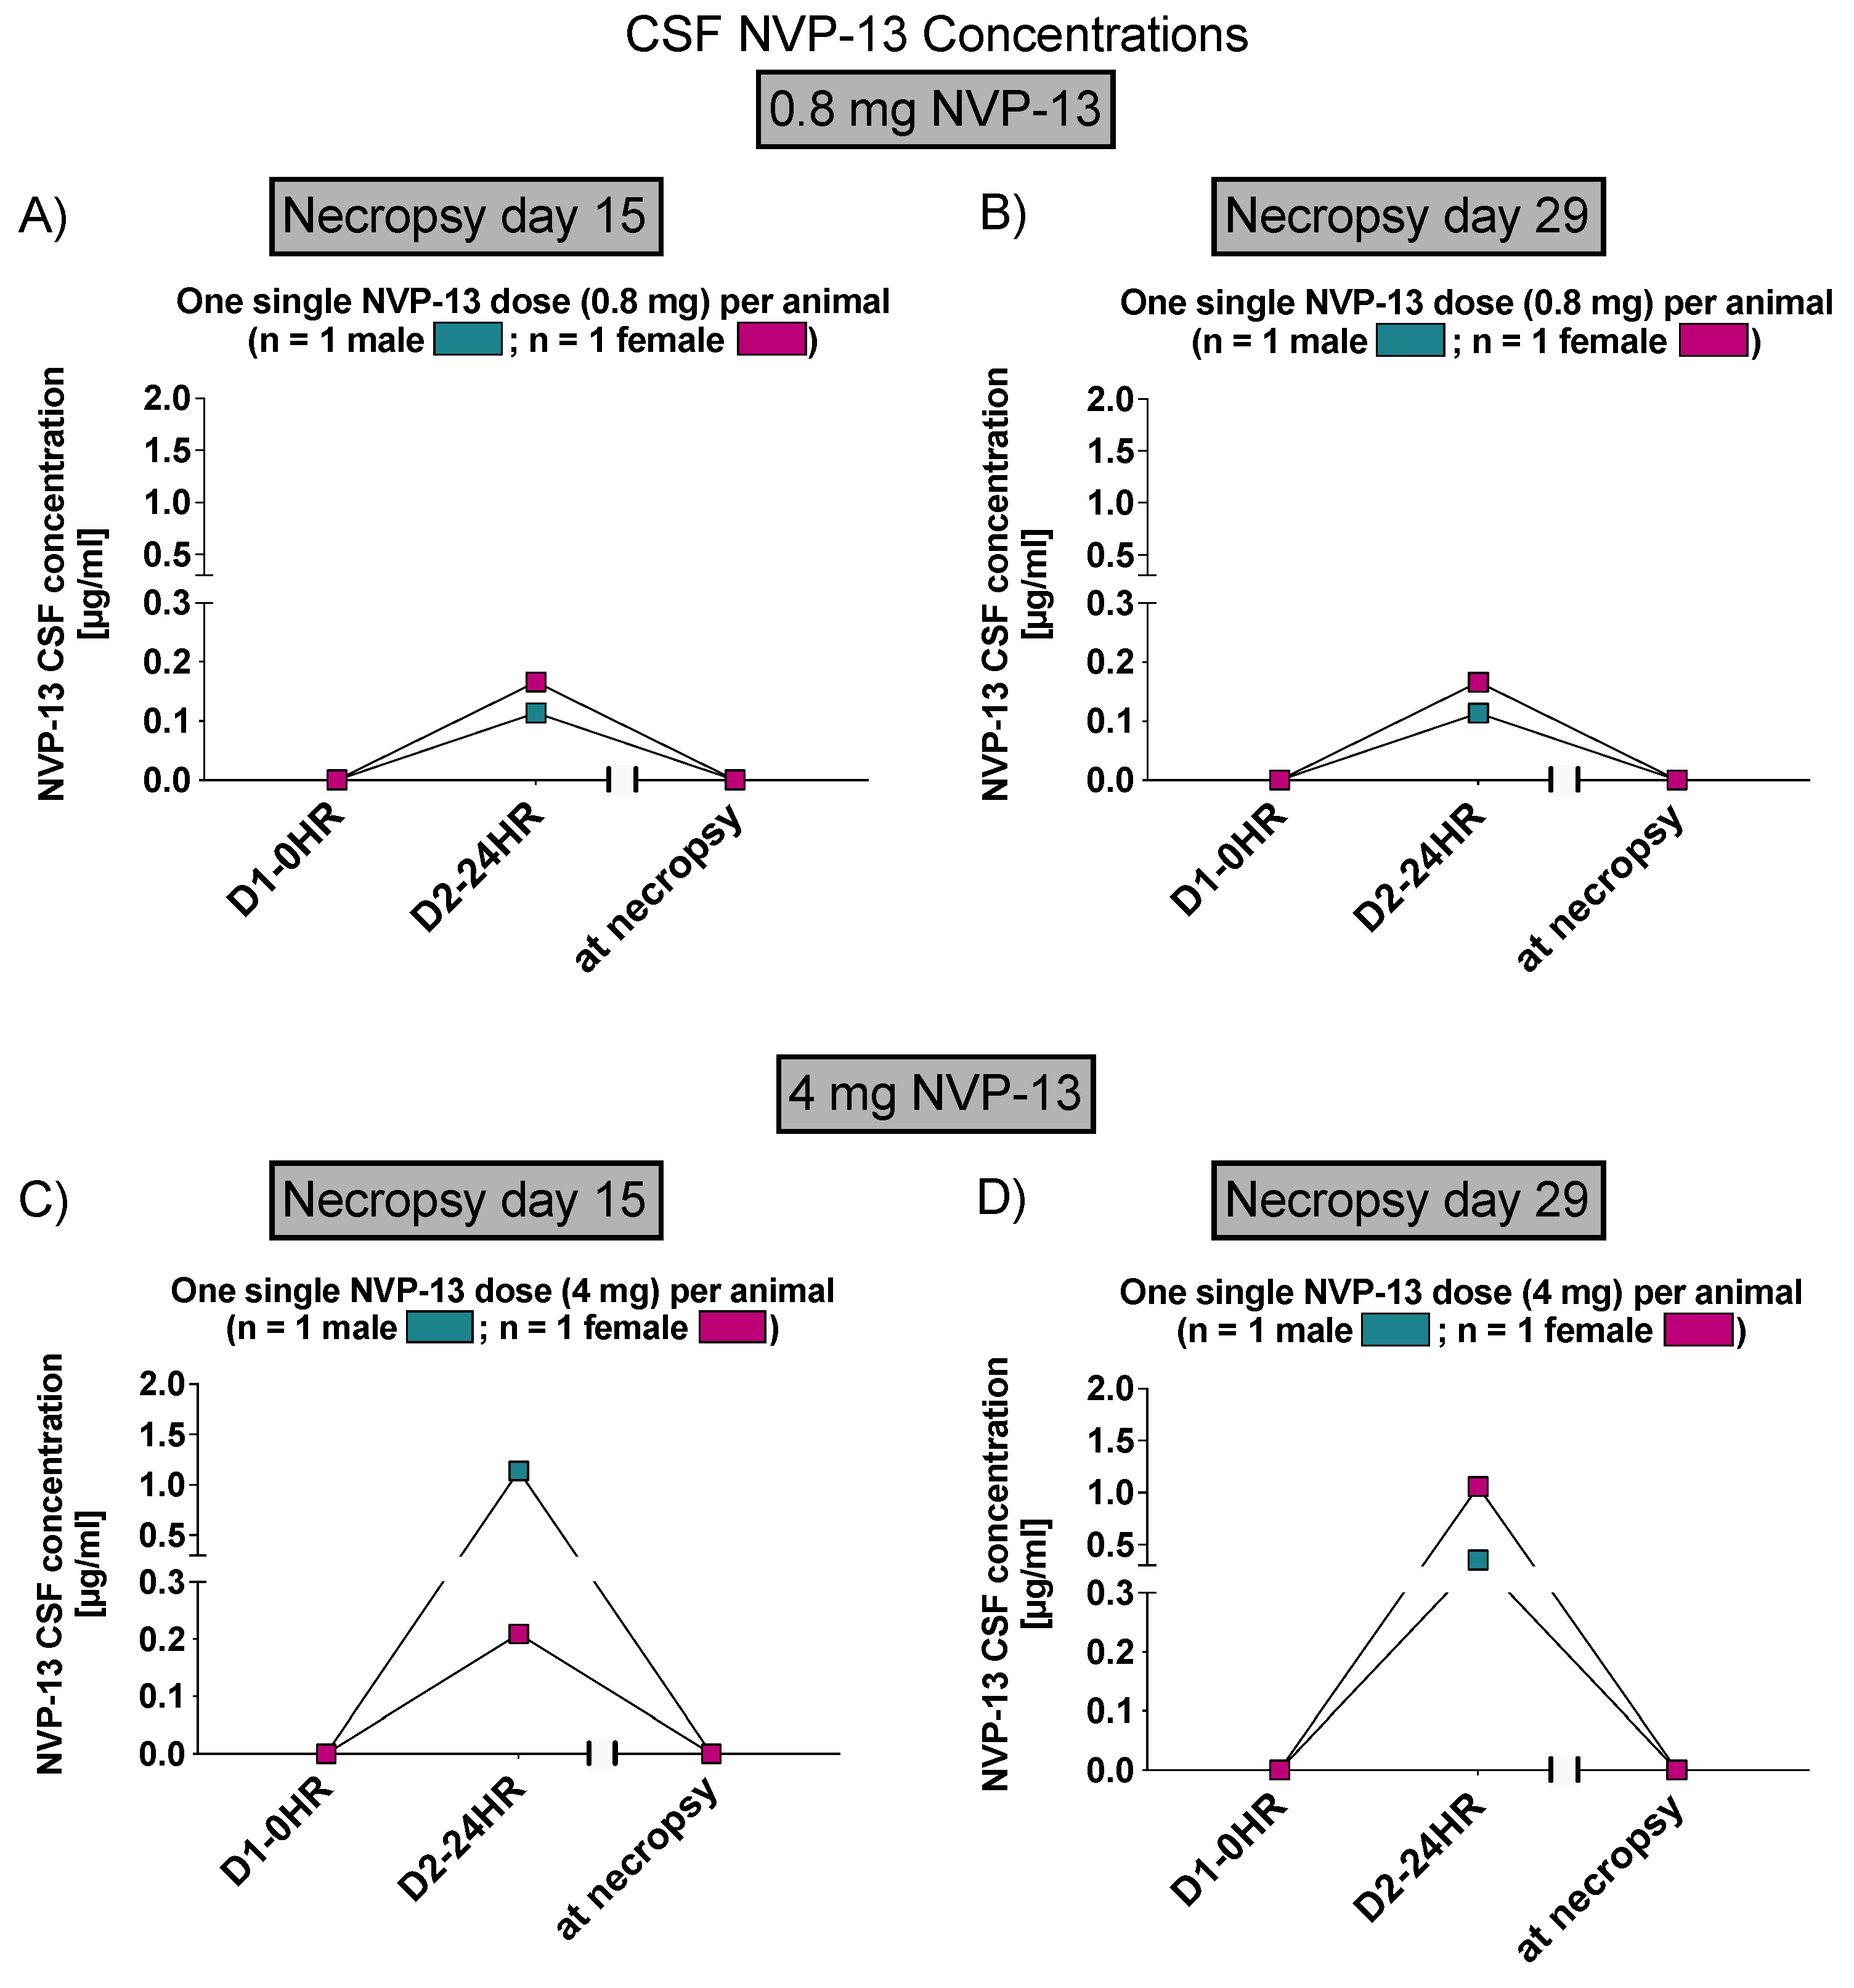
Phase B: Following single intrathecal doses of NVP-13, at dose levels of 0.8 and 4 mg/animal, the median plasma Tmax value was 0.5 h at both dose levels. Concentrations declined after Tmax, but remained above the LLOQ (1.00 ng/mL) at the final sampling time point (24 h after dosing).
Concentrations of NVP-13 in plasma and CSF generally increased with dose level. The observed increases in NVP-13 plasma exposure, as assessed using mean Cmax and AUC(0–t) values, were dose-proportional.
On Day 14, the highest mean tissue concentrations of NVP-13 were observed in the kidneys. The tissue distribution pattern observed for Day 29 was similar to that on Day 14; however, relatively high levels of NVP-13 were also present in the lumbar spinal cord at both dose levels and in liver at 0.8 mg/animal. The highest mean tissue concentrations measured for Day 29 represented approximately 30% and 25% of those measured for Day 14, at the 0.8 and 4 mg/animal dose levels, respectively.
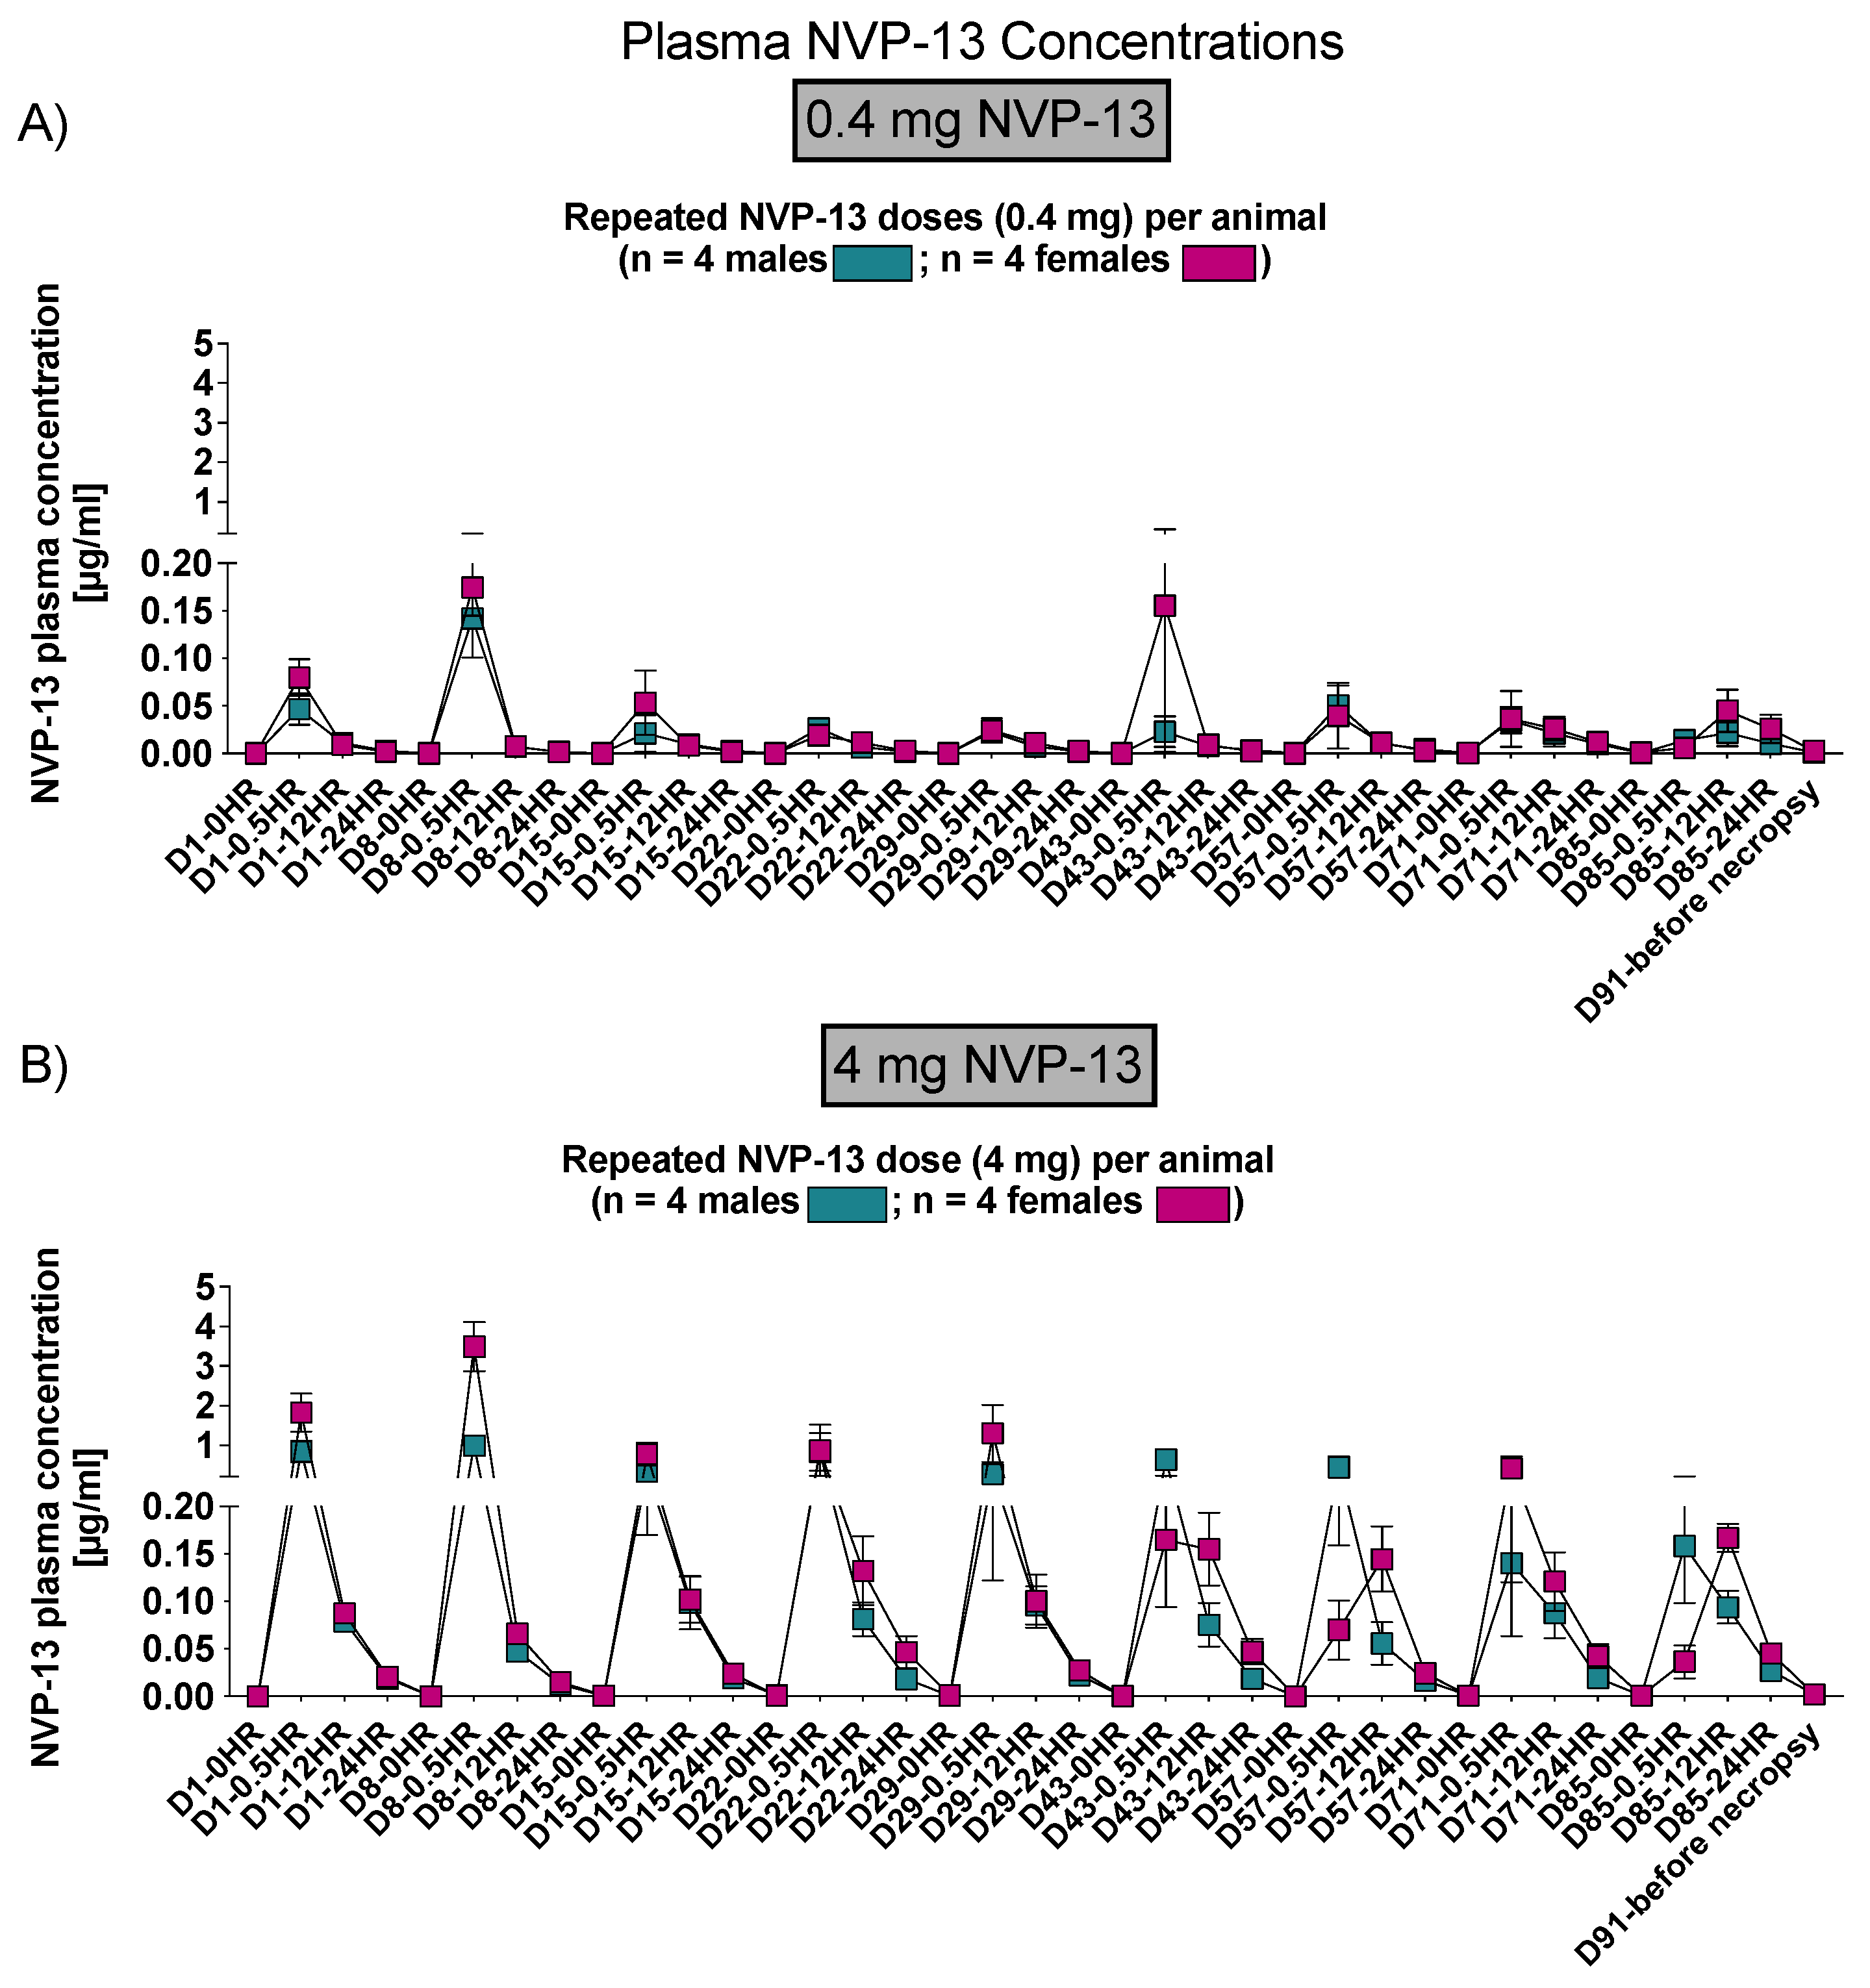
Phase C: Following repeated single intrathecal doses of NVP-13, at dose levels of 0.4 and 4 mg/animal/occasion for up to 13 weeks, median Tmax values in plasma were between 0.5 and 24 h after dosing. Plasma concentrations remained quantifiable at the last sampling time point (24 h after dosing) for all animals on each dosing occasion.
Concentrations of NVP-13 in plasma and CSF increased with dose level. The observed increases in NVP-13 plasma exposure were dose-proportional.
No accumulation of NVP-13 in plasma was observed. Exposure remained consistent throughout the dosing period at the 0.4 mg/animal/occasion dose level, and decreased with increasing number of 4 mg/animal/occasion doses.
For both dose levels, the highest concentrations of NVP-13 in tissues were measured in the lumbar spinal cord and kidney cortex. Mean concentrations in other areas of the brain and in kidney medulla reached NVP-13 levels between approximately 10 and 33% of maximum mean tissue levels, whilst concentrations in the liver represented less than 10% of maximum mean levels.
To assess NVP-13 concentrations within CNS regions, AEX-HPLC analysis was performed in all three phases of the present study. In all phases, NVP-13 was detectable within the main regions of interest, namely the spinal cord (lumbar, thoracic, and cervical), the hippocampus and the subventricular zone (
Figure 3A, Figures 5A,B and 10).
3.1. NVP-13 Is Detectable within the CSF
To assess NVP-13 concentrations within CSF, AEX-HPLC analysis was performed in all three phases of the present study. In all phases, NVP-13 was detectable within the CSF (
Figure 3B, Figures 7 and 12). A summary of gender-averaged toxicokinetic parameters for NVP-13 in CSF is given in
Table 3,
Table 4,
Table 5 and
Table 6. NVP-13 exerts dose-dependent effects on CSF toxicokinetic parameters in Phase A (
Table 3), Phase B (
Table 4), and Phase C (
Table 5 and
Table 6).
3.2. NVP-13 Is Slightly Detectable within Plasma Up to 24 h
To assess NVP-13 concentrations within plasma, AEX-HPLC analysis was performed in all three phases of the present study. In all phases, NVP-13 was detectable within the plasma (
Figure 4A, Figures 6 and 11). A summary of gender-averaged toxicokinetic parameters for NVP-13 in plasma is given in
Table 7,
Table 8,
Table 9 and
Table 10. NVP-13 exerts dose-dependent effects on plasma toxicokinetic parameters in Phase A (
Table 7), Phase B (
Table 8), and Phase C (
Table 9 and
Table 10).
As already stated above, in order to assess NVP-13 concentrations within CNS regions, AEX-HPLC analysis was performed and NVP-13 was detectable within the main regions of interest, namely the spinal cord (lumbar, thoracic, and cervical), the hippocampus and the subventricular zone (
Figure 5A,B) following one single i.th administration, on day 15 and day 29.
Similar to phase A, NVP-13 concentrations were assessed within CNS regions by AEX-HPLC analysis. NVP-13 was detectable within the CSF and plasma (
Figure 6 and
Figure 7) following one single i.th administration, on day 15 and day 29.
Again, to assess NVP-13 concentrations within peripheral tissue (liver and kidney), AEX-HPLC analysis was performed and, NVP-13 was detectable (
Figure 8 and
Figure 9), on day 15 and 29.
Similar to phase A and B, NVP-13 concentrations within CNS regions of interest were determined by AEX-HPLC analysis.. Again, NVP-13 was detectable in all areas on day 91 of the experiment (
Figure 10)
Similar to phase A and B, NVP-13 concentrations within CSF and plasma were determined by AEX-HPLC analysis (
Figure 11 and
Figure 12).
Finally, NVP-13 concentrations were also detectable in peripheral tissues (liver and kidney) in phase C on day 91 of the experiment (
Figure 13).
3.3. Effects of NVP-13 on Physiological Parameters
To assess effects of repeated NVP-13 administrations on standard in-life parameters (behavior and appearance, feces, morbidity and mortality, and body weight development, data (not shown) were monitored throughout the entire experiment (for details, see study plan). For none of the three read-out parameters, any unusual changes were noted.
3.4. Effects of NVP-13 on Physical Parameters
To assess effects of repeated NVP-13 administrations on physical parameters, physical examinations were performed on all unsedated animals throughout the entire experiment (for details, see study plan). During Phase A, only the high dose of 20 mg/animal resulted in paralysis of the arms and legs; these findings led to the premature sacrifice of this animal, which indicated the dose level was above the maximum tolerated dose.
Physical examinations during Phase B did not show any post-dose absence of reflexes in animals administered 0.4 or 4.0 mg/animal.
During Phase C, all but one animal administered 0.4 g/animal (Animal P0604; Group 6) were observed with a regain of lower abdominal reflex losses after a maximum of 48 h. However, Animal P0604 was also not showing an adverse test item-related reflex loss, as the patellar reflex on both sides was already absent before dose initiation.
3.5. Effects of NVP-13 on Neurobehavioral Parameters
To assess effects of repeated NVP-13 administrations on neurobehavioral parameters, a standard observation sequence, which allowed the assessment of peripheral and central nervous system activities, using a modified version of primary observation test described by Irwin for detecting neurological and behavioral tests in mice (Irwin, 1968), was performed. Here, no adverse or test item-related findings were noted.
3.6. Effects of NVP-13 on Neurological Parameters
To assess effects of repeated NVP-13 administrations on physical parameters, physical examinations were performed on animals without further medication throughout the entire experiment (for details, see study plan). Here, no adverse or test item-related findings were noted.
3.7. Effects of NVP-13 on Ophthalmic Parameters
To assess effects of repeated NVP-13 administrations on ophthalmic parameters, animals were anesthetized with ketamine and medotomidine, and a mydriatic agent (1% tropicamide) was instilled into eyes prior to examination. Atipamezole was used as an antidote at the end of the investigation. All investigations were performed on all animals throughout the entire experiment (for details, see study plan). Macroscopic examinations were performed on eye and periocular tissues. The ocular fundus, with macula lutea, papilla, ocular vessels, and retina were examined. Anterior and medium segments, with conjunctiva, cornea, anterior chamber, iris, lens, and vitreous body, were examined by slit-lamp microscopic. Fluorescein was instilled onto the cornea for epithelial staining. For none of these parameters, an adverse or test item-related findings were noted
3.8. Effects of NVP-13 on Hematological Parameters
To assess effects of repeated NVP-13 administrations on hematological parameters, blood samples were withdrawn and analyzed from all animals throughout the entire experiment (for details, see study plan). For none of the measured parameters, any adverse or test item-related changes were noted.
3.9. Effects of NVP-13 on Coagulation
To assess effects of repeated NVP-13 administrations on coagulation, Prothombin Time (PT.) and Activated Partial Thromboplastin Time (APTT.) were determined from blood collected into trisodium citrate anticoagulant. For none of the 2 parameters, any adverse or test item-related changes were noted.
3.10. Effects of NVP-13 on Clinical Chemistry
To assess effects of repeated NVP-13 administrations on clinical chemistry, respective parameters were analyzed (for details, see study plan). For none of the measured parameters, any adverse or test item-related changes were noted.
3.11. Effects of NVP-13 on Histology
To assess effects of repeated NVP-13 administrations on histology (
Table 11), tissues from each animal were trimmed and embedded in paraffin wax, sectioned at a nominal 5 µm, and stained with hematoxylin and eosin. All differences between test item-treated groups and controls were interpreted as incidental (for instance, differences in sexual organ weights) and/or within normal range of variation because they were present only in absolute weight or in relative (to body or brain weight) ratio, they lacked a histological correlate, or the difference was very small.
Macroscopic Observations: The only macroscopic observation described in the present study, namely a marked autolysis, arose in one female animal (Phase A) following 20-mg NVP-13 i.th administration. No other macroscopic findings due to NVP-13 administrations were noted in Phase B, or C.
Microscopic Observations: Test item-related changes were observed in the central nervous system (including the IT injection site). These changes occurred at all dose levels, with no dose relationship.
Central Nervous System: Hippocampal vacuoles have been described as a fixation artefact related to the cellular uptake of ASOs and the subsequent washout during tissue processing for microscopic evaluation [
31]. In this study, similar neuronal vacuolation was noted in the unscheduled sacrifice animal (Animal P0101F), and after five escalating doses (0.4, 0.8, 4, and 20 mg/animal) over 29 days and in two animals, after nine doses of 4 mg/animal over 13 weeks.
During all phases and at all doses, infiltrates of mononuclear cells were noted in the brain (frequently accompanied by perivascular cuffs), spinal cord, intrathecal injection site, and spinal nerve roots of animals, and meningeal oedema was noted in the brain; these findings were considered test item-related and consequences of the mild proinflammatory effect described for ASOs (e.g., vasculitis/inflammatory infiltrates) [
32]. Only in Phase C, mononuclear cell infiltrates were found in the dura mater of the spinal cord lumbar and intrathecal injection site, indicating a dose-dependent increase of this inflammatory reaction.
In the thoracic and lumbar parts of the spinal cord, minimal to slight white matter vacuolation was found sporadically; this finding was considered related to the slight traumatic event induced by intrathecal injection procedures in the lumbar region, as frequently observed in controls following intrathecal application.
4. Discussion
The concept of the present study has been successfully applied to support first-in-human clinical trials and has found acceptance by regulatory bodies (BfArM in Germany). The entire non-GLP program was completed within less than 6 months and represents a valuable blueprint for fast-track development of oligonucleotides. Furthermore, applying the described concept will result in using fewer animals in comparison to the conduct of three independent studies (maximum tolerated dose study, pharmacokinetic and biodistribution study, and repeated dose-range-finding study). As we move forward with ASO-based therapies [
5], the design and conduct of non-human primate studies will require constant review and improvement, as, in comparison to classical small molecules and biologics, comparison data are utmost limited.
By measuring ASO concentrations within CNS tissue, CSF, peripheral tissue, and plasma, physiological and physical, neurobehavioral and neurological, but also hematological and clinical chemistry parameters, this study paradigm gives a good characterization profile of the respective test compound.
Due to the inability of ASO crossing the blood brain barrier on the one hand and the need for central ASO concentrations to treat neurodegenerative disorders, an intrathecal administration was performed as described in other studies [
4]. In vivo NVP-13 i.th. administrations led to dose-dependent ASO concentrations within CNS tissue. Hereby, dose levels indirectly correlated with distance to the respective area of injection, the lumbar spinal cord, which is in line with previous studies in mice, juvenile cynomolgus monkeys, human infants, and own in vivo data (Peters et al., Pharmaceutics, under review). Within the CNS, ASOs are well distributed by intrinsic CSF dynamics. For details, see Bennett et al., 2019 [
4].
NVP-13 levels were also detectable in peripheral organs, namely the kidney and the liver, at treatment active drug levels, but also indicating the regular physiological way of substance distribution and decay. Calculation for gender ratios (male/female) indicated sex differences in the toxicokinetics of NVP-13 following i.th administration. Further, concentration-time profiles show a general enhancement of NVP-13 levels with increasing dose levels for all three phases.
The only macroscopic observation described in the present study, namely a marked autolysis, arose in one female animal (phase A) following 20 mg NVP-13 i.th administration. This indicates an enhanced enzymatic digestion of cells by the action of its own enzymes and occurs mostly in dying or even dead cells [
33] and might be an explanation for the impaired neurological behavior (paralysis of arms and legs) in this animal as a direct result of the i.th. injection. A second explanation might be a test item-related change in vacuoles in the neuronal cell bodies. Here, minimal, multifocal, neuronal vacuoles (clear and empty) were found in the hippocampus (affecting CA1 area of the cornu ammonis) and cerebral cortex. A refutation for the influence of these vacuoles on neurological behavior is described by Engelhardt et al. Here, comparable vacuoles have been described as a fixation artefact related to the cellular uptake of ASOs and the subsequent washout during tissue processing for microscopic evaluation [
31]. The presence of comparable vacuoles in male and female animals out of Phase C (
Table 11) give further evidence for no direct effect on neurological parameters. Finally, a high concentration of ions surrounding spinal rout ganglions following the high NVP-13 dose or a compression as a result of the i.th. administration process might have led to the neurological behavior.
The test item-related inflammatory reactions (mononuclear cell infiltrates, perivascular cuffs) were noted in the meninges of the brain (cerebral cortex, sporadically cerebellum) and spinal cord (cervical, thoracic, and lumbar; dura mater of spinal cord), adjacent to the intrathecal injection site (lumbar spinal cord), in the spinal nerve roots, and adjacent to the intrathecal injection site of most animals during all phases and all doses. In Phase C only, mononuclear cell infiltrates were found in the dura mater of the spinal cord lumbar and intrathecal injection site, indicating a dose-dependent increase of this inflammatory reaction (
Table 11). During all phases and at all doses, infiltrates of mononuclear cells were noted in the brain (frequently accompanied by perivascular cuffs), spinal cord, intrathecal injection site, and spinal nerve roots of animals, and meningeal edema was noted in the brain; these findings were considered test item-related and consequences of the mild proinflammatory effect described for ASOs (e.g., vasculitis/inflammatory infiltrates) [
32]. In addition to the mononuclear cell infiltrates observed in the current study, splenomegaly and lymphoid hyperplasia are well-known subchronic toxicity effects. This non-specific immune stimulation is due to an unmethylated cytosine-phosphorous-guanine (CpG) motif in the ASO sequence which is recognized by Toll-like receptor -9 immune cells. Following activation, proinflammatory cytokines including IL-6, IL-12, and INF-gamma are released and B-cell proliferation, antibody production as well as T-lymphocyte and natural killer cell activation is promoted [
26,
34]. In terms of no severe physiological, neurological, and neurobehavioral observations, except the female in Phase A, observed in this approach, the effects of NVP-13 on immunity are considered as non-adverse, which is in line with the safe and low toxic drug profile of a broad variety of ASOs for the treatment of different disorders.


 ,
, 


