Article

Video Freeze Assessment of TPCAST Wireless Virtual Reality: An Experimental Study †

Blekinge Institute of Technology, SE-371 79 Karlskrona, Sweden
*
Author to whom correspondence should be addressed.
This paper is an extended version of our paper published in the International Conference on Quality of Multimedia Experience, Berlin, Germany, 5–7 June 2019.
Appl. Sci. 2022, 12(3), 1733; https://doi.org/10.3390/app12031733
Submission received: 21 December 2021 / Revised: 28 January 2022 / Accepted: 31 January 2022 / Published: 8 February 2022
(This article belongs to the Special Issue Advances in Mobile Immersive Media in 5G and Beyond)

Abstract

:
Wireless virtual reality (VR) offers a seamless user experience but has to cope with higher sensitivity to temporal impairments induced on the wireless link. Apart from bandwidth dynamics and latency, video freezes and their lengths are important temporal performance indicators that impact on the quality of experience (QoE) of networked VR applications and services. This paper reports an experimental study that focuses on the VR video frame freeze length characteristics of a wireless VR solution. A comprehensive measurement campaign using a commercial TPCAST wireless VR solution with an HTC Vive head-mounted display was conducted to obtain real VR video traces. The number of detected freezes and freeze intensities are reported both accumulated over four room quadrants as well as for each of the four quadrants subject to six transmitter-receiver distances. The statistical analysis of the VR video traces of the different experiments includes histograms of the freeze lengths and cumulative complementary histograms of the freeze length. The results of this analysis offer insights into the density of the underlying distributions of the measured data, illustrate the impact of the room topology on the freeze characteristics, and suggest the statistical modeling of the freeze characteristics as exponential and geometric distributions. The statistical models of the freeze characteristics may be included in wireless VR simulators supporting the development of physical layer, medium access layer, and higher layer functionalities. They also may serve as network-disturbance models for VR QoE studies, e.g., generating realistic freeze events in wireless VR stimuli.

1. Introduction

Wireless virtual reality (VR) offers a seamless user experience by removing the restricted mobility of conventional wired VR headsets. The greater freedom of movement offered by wireless VR allows users to more conveniently immerse in a virtual world which in turn results in improved quality of experience (QoE). The delivery of such VR video services over networks requires data rates of ≥1.6 Gbps [1] depending on the video resolution and anticipated level of interaction with the virtual world. Furthermore, the motion-to-photon (MTP) latency, i.e., the delay between the viewer’s head movement and the head-mounted display’s (HMD’s) change reflecting this movement, must be kept as ≤20 ms [1]. In the context of home Wi-Fi, for example, network latencies of ≤10 ms for fair experience, ≤7 ms for comfortable experience, ≤5 ms for ideal experience have been recommended in [1]. As a consequence, the network contribution to this MTP latency budget also needs to be significantly improved to guarantee satisfactory QoE. To accommodate such high performance wireless data applications in terms of throughput and latency, several standards have been developed and are being worked on regarding advanced wireless and cellular network technologies. In particular, standardization of the required wireless connectivity takes place both in the field of wireless local area networks (WLAN), and broadband cellular networks such as fifth generation (5G), beyond fifth generation (B5G) and sixth generation (6G) networks.
Contributing to the understanding of network-induced temporal disturbances in wireless VR systems, this paper reports an experimental study that focuses on the VR video frame freeze length characteristics of a commercial TPCAST wireless VR solution [2]. Similar as other wireless systems that target ultra-reliable low latency communications, the commercial TPCAST wireless VR solution also utilizes beamforming, higher order modulation constellations, and millimeter wave technology in the 60 GHz band. As such, the results and statistical models provided in this paper may be considered as representative for the freeze characteristics in such practical settings. In the following, an overview of the related wireless technologies targeting ultra-reliable low latency communications, experimental studies, and wireless VR testbeds are provided leading to the motivation, research questions, and contributions of the work reported in this paper.

1.1. Related Work

1.1.1. Wireless Technologies toward Ultra-Reliable Low Latency Communications

In response to emerging new applications such as 8K video, VR, gaming, and cloud computing, the IEEE 802.11 Task Group BE started to work on the IEEE 802.11be standard (Wi-Fi 7) enabling extremely high throughput at low latency [3]. IEEE 802.11be is anticipated to operate in the 2.4 GHz, 5 GHz, and 6 GHz bands offering 320 MHz channel bandwidth. Higher order modulation constellations up to 4096-ary quadrature amplitude modulation (4096-QAM) will be supported while the number of spatial streams will be increased up to 16 through the use of 16 × 16 multi-user multiple-input multiple-output (MU-MIMO) systems. The high signal-to-noise ratio (SNR) required for reliable operation of 4096-QAM shall be achieved by beamforming. IEEE 802.11be aims to provide at least one operation mode that supports data rates great than 30 Gbps. It is envisaged that a final version of the IEEE 802.11be standard will be available by early 2024.
Further, the WiGig specifications produced under the umbrella of the Wireless Gigabit Alliance provides a set of wireless network protocols for operation in the 60 GHz band [4]. The WiGig system, also known as 60 GHz Wi-Fi, includes IEEE 802.11ad [5] and IEEE 802.11ay [6], and supports data rates of up to 7 Gbps. It resorts on beamforming which allows to explore the signal reflections induced by the propagation environment, e.g., surfaces, ceilings, and floors. Specifically, the phased array antenna beamforming used in the WiGig system enables robust communication with transmitter-receiver distances of up to 10 m.
The WirelessHD or UltraGig proprietary standard [7] targets wireless transmission in the 60 GHz band for high-definition (HD) video content. The high date rate physical layer of WirelessHD uses quadrature phase shift keying (QPSK), 16-QAM, and 64-QAM together with equal and unequal error protection, and provides the option for spatial multiplexing. WirelessHD supports data rates of up to 28 Gbps, uses beamforming at the transmitter and receiver, and supports a communication range of up to 10 m. The WirelessHD technology is used in the TPCAST wireless VR system that was developed for the HTC Vive HMD (see Section 2).
Further, VR and augmented reality (AR) applications and services are foreseen to be delivered over broadband cellular networks such as the currently rolled out 5G networks and to be expanded to cater for digital realities offering immersive experiences in B5G and 6G mobile networks [8]. Regarding HMD technologies for such networks, the Qualcomm Snapdragon XR2 5G reference design, for instance, aims at next-generation 5G-enabled HMDs for untethered VR, AR, and mixed reality (MR). Network technologies considered to deal with the stringent performance indicators of ultra-reliable low latency communications include network slicing and edge-cloud processing architectures such as cloud VR.
Irrespective of whether a dedicated private network or a network slice over a public network is used for the delivery of untethered immersive media, the underlaying infrastructure must offer: (1) High bandwidth to accommodate the required high data rates, (2) low latency to keep within the MTP budget, (3) high reliability to avoid spatial and temporal artifacts being inflicted to the immersive media. The challenge of providing sufficiently high bandwidth has been tackled by moving toward higher frequencies, e.g., 60 GHz millimeter waves (mmWaves), and the related wider frequency bands. The requirement of low latency is being addressed by finding a balance between advanced on-device processing and moving processing to the edge. Beamforming at the transmitter and receiver along with adaptive coding and modulation schemes are increasingly engaged at the physical layer to provide ultra-reliable wireless links.

1.1.2. Experimental Studies and Wireless VR Testbeds

In [9], a multi-path multi-tier 360 video streaming technique is proposed taking into account the dynamics of the network bandwidth as well as the user viewing direction. In this work, video encoding is performed at multi-tiers, i.e., the base-tier encoded with a basic rate, enhancement-tier coded with multiple rates and assisting view prediction accuracy, and correction-tier carrying information about the predicted view direction. A 5G wireless research platform is used to collect real bandwidth traces over a WiGig testbed which, in combination with a Wi-Fi component, allows for studying the multi-path approach. In addition, real user field of view traces with diverse head movement patterns are used for the assessment of the multi-tier approach. The analytical and experimental performance assessment in terms of optimal rate allocation, throughput, latency, and network utilization demonstrated that a high level of QoE can be achieved.
The experimental study reported in [10] assesses the IEEE 802.11ad performance on a smartphone regarding throughput, coverage, mobility, and power consumption. The experimental setup focused on an indoor environment using an Asus Republic of Gamers (ROG) Android gaming smartphone which is equipped with an IEEE 802.11ad chip set. All measurements were performed with a Netgear Nighthawk X10 Smart WiFi Router which allows for 4K streaming, VR gaming, and instant downloads. In this context, the ROG smartphone was assessed as a general purpose IEEE 802.11ad smartphone. The measurement campaign revealed that the ROG smartphone was able to support Gbps throughput while power consumption was less of an issue than originally expected. However, the results suggest that the beamforming protocol on the smartphone performs suboptimally and affects the network performance. Overall, it was concluded that IEEE 802.11ad is a promising technology for upcoming bandwidth-intensive applications on smartphones.
Building on [10], a more comprehensive performance assessment of IEEE 802.11ad on smartphones is provided in [11]. The experimental study presented in this work considers the following three experimental setups. First, the IEEE 802.11ad setup operating at the 60 GHz band comprises of an Asus ROG Android gaming smartphone and a Netgear Nighthawk X10 Smart WiFi Router. Physical layer data rates range from 1.65 Gbps to 2.3 Gbps depending on the scenario. Second, a Samsung Galaxy S10 and Xiaomi Mi 10 phone and an ASUS RT-AX88U router constitute the IEEE 802.11ax-2021 or IEEE 802.11ax setup operating at the 5 GHz band. In this setup, the smartphones constrained the maximum physical layer data rate to 1.2 Gbps. Third, the state-of-the-art IEEE 802.11ac setup operating at the 5 GHz band, was used for comparison with the IEEE 802.11ad scenario, also using the Netgear Nighthawk router with the ROG phone. The physical layer data rate of this setup was limited to 866 Mbps. The performance of these setups were evaluated with respect to range, coverage, mobility, blockage, and power consumption. The measurement data allowed to assess the impact of smartphone features such as antenna array placements as well as performance comparisons among members of the family of IEEE 802.11 standards. Although inferior to an IEEE 802.11ad-enabled laptop, it was shown that an IEEE 802.11ad-enabled smartphone can sustain Gbps data rates given that the range to the access point is kept within a few tens of ft. Overall, it was found that the IEEE 802.11ad setup, which is placed at the 60 GHz band, outperforms the 5 GHz counterparts associated with IEEE 802.11ac and IEEE 802.11ax. However, challenges faced with the IEEE 802.11ad setup include performance degradation due to the beamforming protocol, antenna array placement, and human blockage.
In [12], an extensive measurement study is reported focusing on the predictability of throughput of an IEEE 802.11ad system on the downlink to an IEEE 802.11ad-enabled mobile device. In this study, using a similar experimental setup as in [10,11], the mobility patterns and orientations of the mobile device were varied. It was shown that throughput may be predicted in real time using a small neural network model with good accuracy at varying timescales. Regarding wireless VR applications, given that the prediction error was above 10% for 40% of the time at the 10 ms timescale, this work suggests to be conservative in the use of throughput prediction in this context.
Off-the-shelf WiGig and WiFi interface modules were used in [13] to establish a motion-aware WiGig-WiFi interplay system for VR (MW 2 IVR). This testbed comprises of a local PC for processing, a Netgear Nighthawk X10 serving as access point (AP), and a Travelmate laptop with Sparrow 11ad module. An HTC Vive headset is connected to the laptop using high definition multimedia interface (HDMI) and universal serial bus (USB) cables which allows limited translational and rotational movements in the vicinity of the laptop. The testbed collects user motion, link signal levels, and the generated frame sizes, and opportunistically switches between WiGig and WiFi while controlling the VR frame encoding for latency regulation. The distance between AP and laptop was limited in the WiGig wireless VR scenario to 3 m offering a throughput of approximately 1.5 Gbps with the antenna embedded in the laptop facing the AP (front view). However, the throughput measured for the distance of 2 m and varying antenna direction is reported to decrease almost proportionally with the antenna angle turning away from the front view. It is conjectured that this behavior may be induced by imperfect and slow beamforming operations. The throughput in the WiFi wireless VR scenario, on the other hand, was measured being constant for distances up to 5 m but dropped to one-third of the maximum throughput that was achieved by WiGig. The experimental results indicate that the MW 2 IVR outperforms the WiGig-only system in terms of latency regulation and video fidelity.
A VR gaming testbed referred to as Air Light Virtual Reality (ALVR) is presented in [14] and used to objectively and subjectively assess the performance of cloud VR gaming. The ALVR testbed consists of a Windows workstation with an Intel Core i5 CPU, 64 GB RAM, and an NVIDIA RTX 2080Ti GPU to constitute a cloud gaming server, a BSD workstation also with an Intel Core i5 CPU acting as traffic shaper, an ASUS RT-AC88U IEEE 802.11ac WiFi router offering wireless connectivity, and an Oculus Quest HMD equipped with an IEEE 802.11ac network interface. The testbed measures frame rate, latency, server load, client load, and throughput while bandwidth, delay, and packet loss rate are varied using Dummynet on the BSDF-based traffic shaper. The results indicate that bandwidth limitations may have higher influence on user experience than latency and packet loss rate. Related performance studies using cloud gaming testbeds include the work reported in [15] that adapts the open source cloud gaming platform [16] to conduct experiments on conventional mobile devices.
A wireless VR platform for commodity HMDs using a programmable WiGig interface as a potential cable replacement is presented in [17]. This platform comprises of a desktop PC with Intel Core i7-4790 CPU, 16 GB memory, and an NVIDIA TITAN X CPU which runs the VR applications and renders all graphic contents. A wireless Internet protocol (IP) network was setup using the Intel WiGig modules 17265 and W13100. A Dell XPS M3800 laptop with NVIDIA GeForce 970 GPU is connected to an HTC Vive HMD for studying the computational power needed to decompress the received frames. The performance assessment of this experimental study focused on frame-processing time and end-to-end latency in the context of VR gaming. It is shown that GPU-based optimization techniques and parallel processing can reduce the total frame-processing time but it remains still challenging to meet the end-to-end latency requirements of wireless high-quality VR applications. Powerful new hardware and novel software techniques are stated as being desirable to enable wireless high-quality VR applications.
In [18], an end-to-end wireless VR platform is proposed offering low latency remote rendering. An Intel Core i7 based PC equipped with an NVIDIA TITAN X GPU is used as rendering server. The server holds a Mellanox 10 Gbps network interface card that is connected through a 10 Gbps Ethernet cable with a Netgear Nighthawk X10 WiGig AP. A ThinkPad X1 Yoga laptop, equipped with an Intel i7-7600U CPU and an HD 620 integrated GPU with H.264 hardware decoder ASIC, is used as client. The laptop uses a Qualcomm QCA6320/QCA6310 WiGig module to wirelessly connect to the WiGig AP and connects to an HTC Vive HMD through HDMI and USB cables. The proposed parallel rendering and streaming mechanism reduces streaming latency while the proposed VSync driven rendering technique minimizes display latency. It is shown that this wireless VR platform supports 2K VR resolutions at a refresh rate of 90 Hz with less than 16 ms and 4K VR resolution with 20 ms end-to-end latency.
In [19], a TPCAST wireless VR testbed is presented that allows for studying temporal data delivery issues of video frames. In particular, the TPCAST wireless adapter and the underlying WirelessHD standard is used with the HTC Vive HMD. The testbed allows for monitoring and recording of traces from which video freezes at the wireless HMD can be detected. It also records traces that capture information about the input traffic from the HMD and hand controls to the rendering computer. The TPCAST wireless VR testbed was used in [20] to measure, analyze, and model network-induced temporal disturbances in VR applications with focus on freeze durations. The freeze length distributions deduced from the measurement campaign were modeled as geometric distributions.

1.2. Motivation and Contributions

Inspired by all of the above, we have conducted a measurement campaign on VR video frame freeze length, referred to as freeze length in the sequel for brevity, using a commercial TPCAST wireless VR solution. Apart from latency, video freezes and their durations or lengths are also important temporal performance indicators that impact on the QoE of networked VR applications and services. Based on the video traces collected in this experimental study, the following research questions are pursued in this paper:
(1)
What are the statistical characteristics of the number of freezes, freeze intensities, and freeze lengths to be dealt with in wireless VR solutions?
(2)
What are the statistical models that form a compact representation of the measured freeze events?
The research reported in this paper utilizes a wireless VR testbed which is based on the commercial TPCAST wireless adapter together with the HTC Vive HMD. This hardware has been chosen because TPCAST has been specifically developed and optimized for the HTC Vive HMD. In the meantime, a TPCAST adaptor is also available for the Oculus Rift HMD. The TPCAST wireless VR testbed can be used as a measurement environment that allows obtaining real data on temporal impairments observed in a commercial network solution rather than needing to focus on optimizing the wireless VR technology itself. The related work reported above has extensively assessed throughput and latency issues of wireless VR systems while little has been reported on freezes and freeze lengths. The comprehensive experimental study reported in this paper hence focuses on measuring freeze characteristics and their statistical analysis and modeling. The statistical models of the freeze characteristics may be included in wireless VR simulators supporting the development of physical layer, medium access layer, and higher layer functionalities. They also may serve as network-disturbance models for VR QoE studies, e.g., generating realistic freeze events in wireless VR stimuli to support the development of perceptual quality measures, similar as is done for conventional videos [21,22].
The main contributions of this paper are summarized as follows:
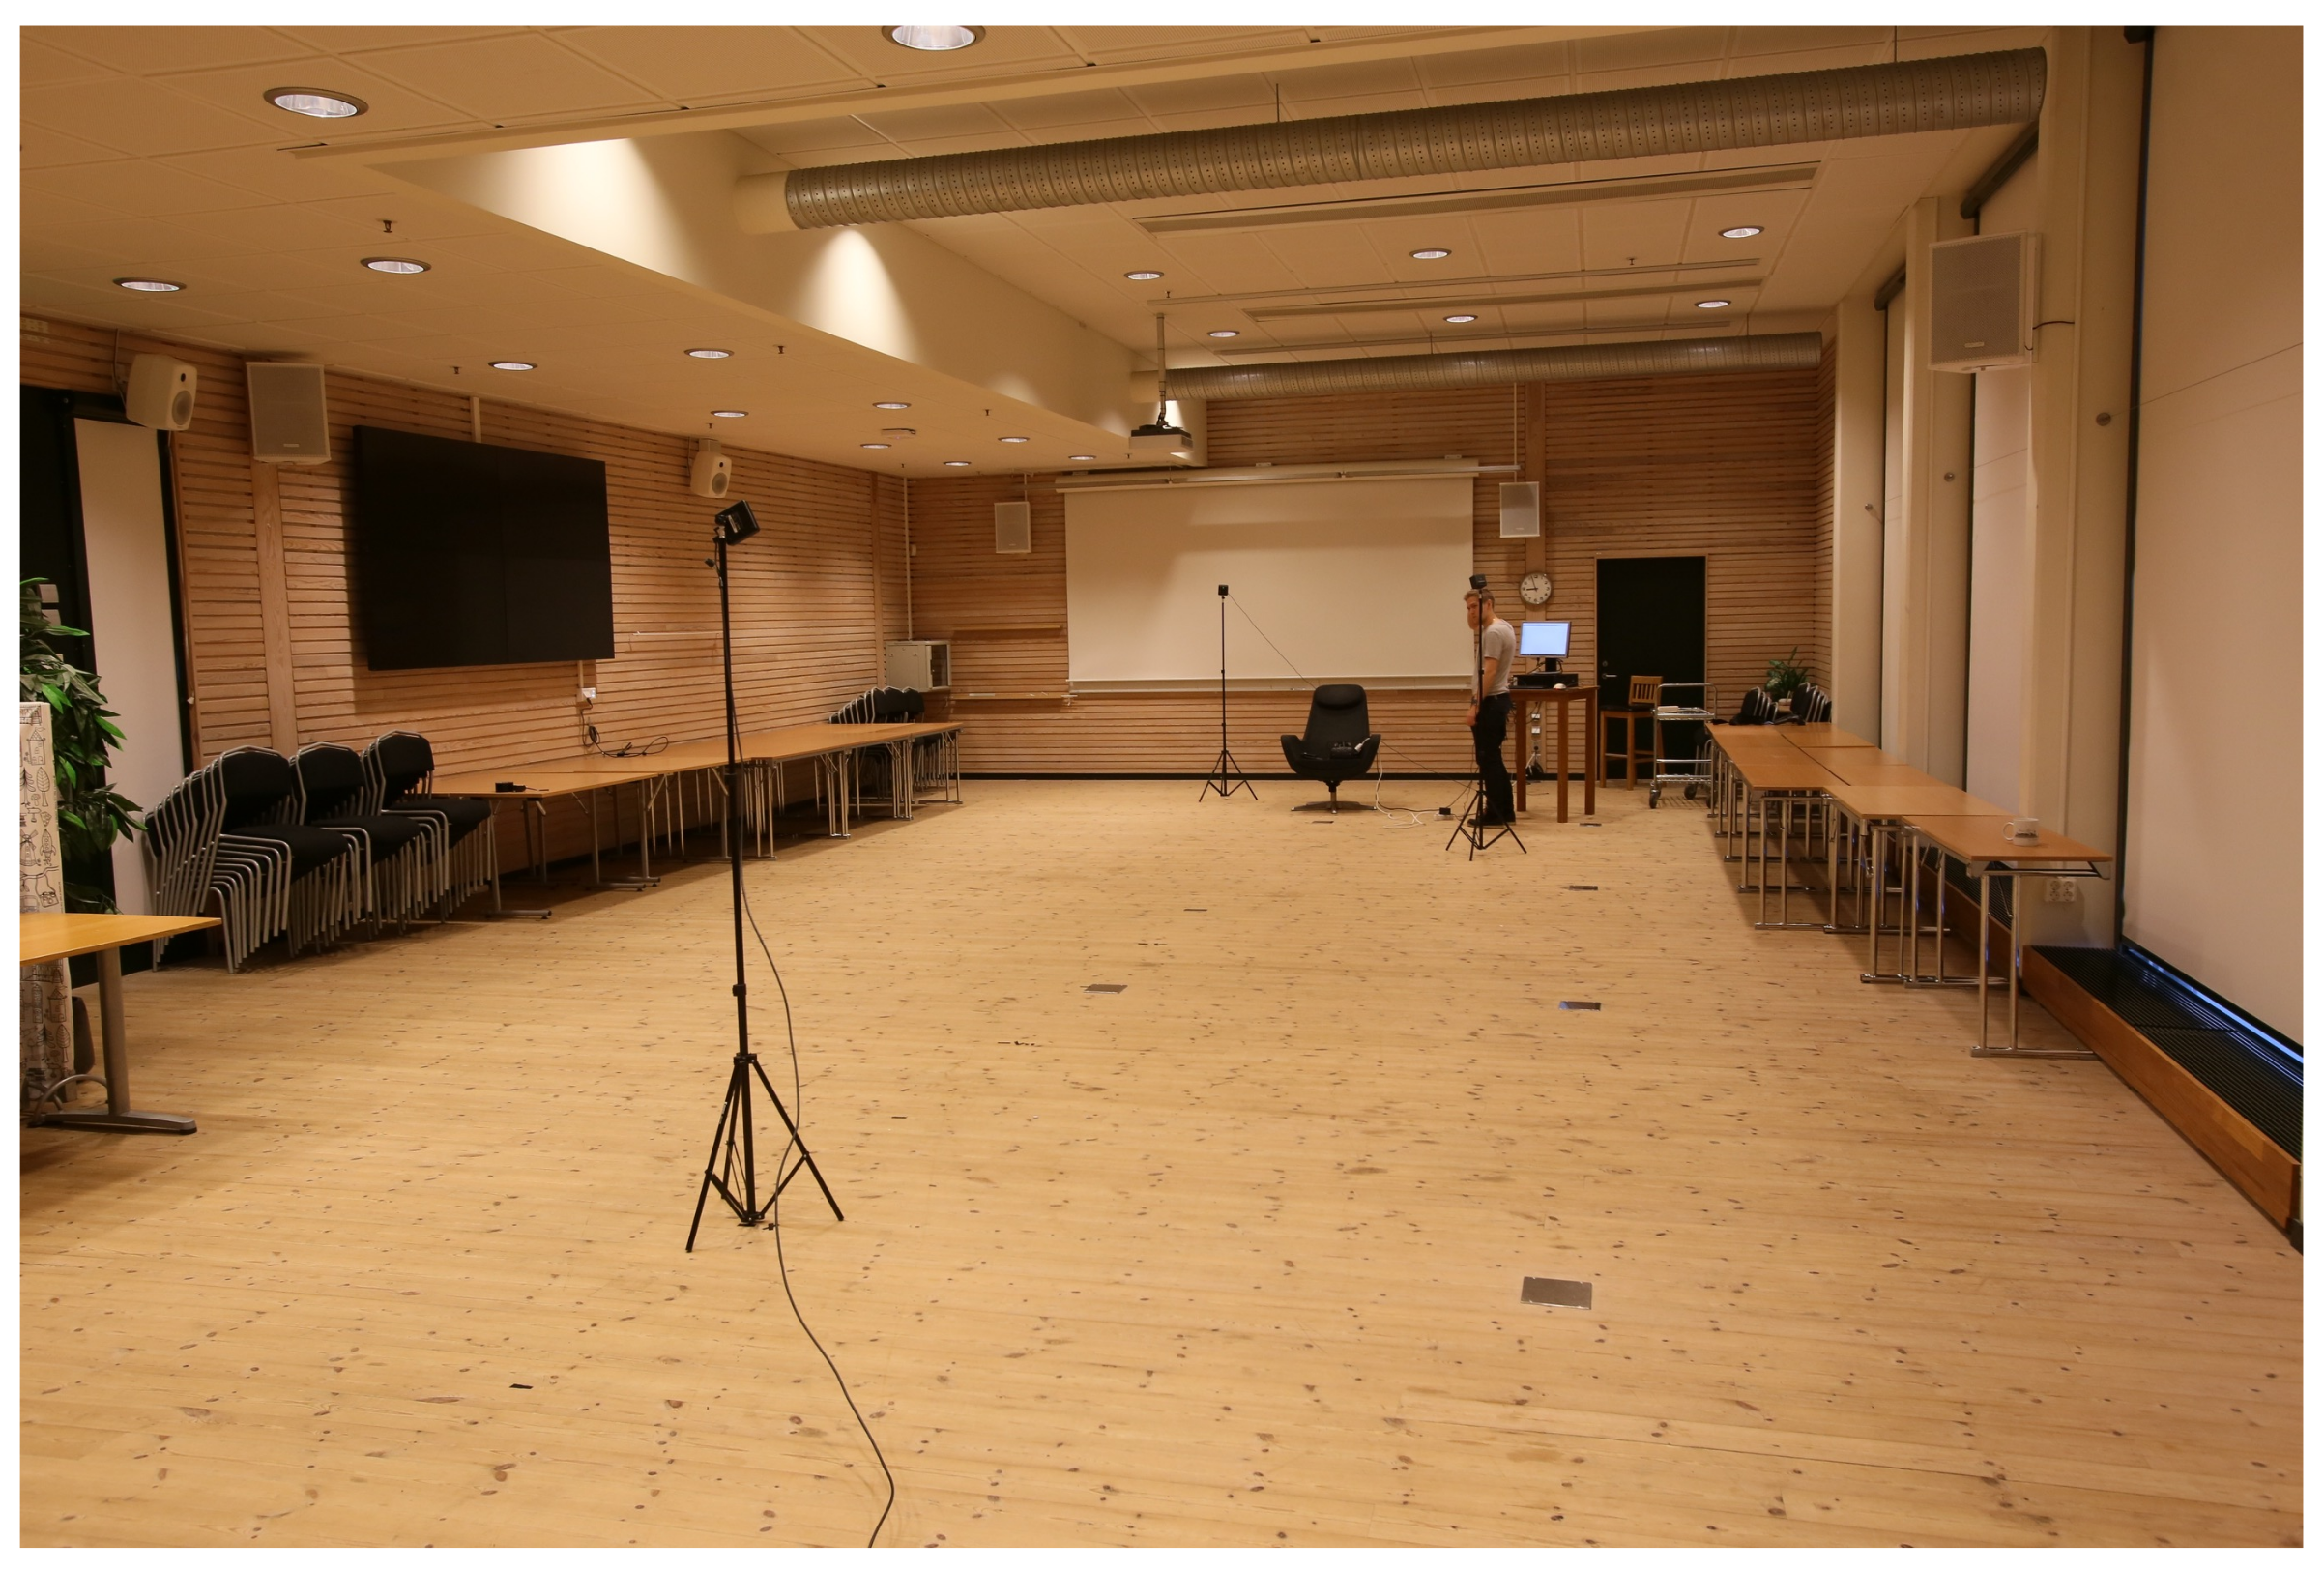
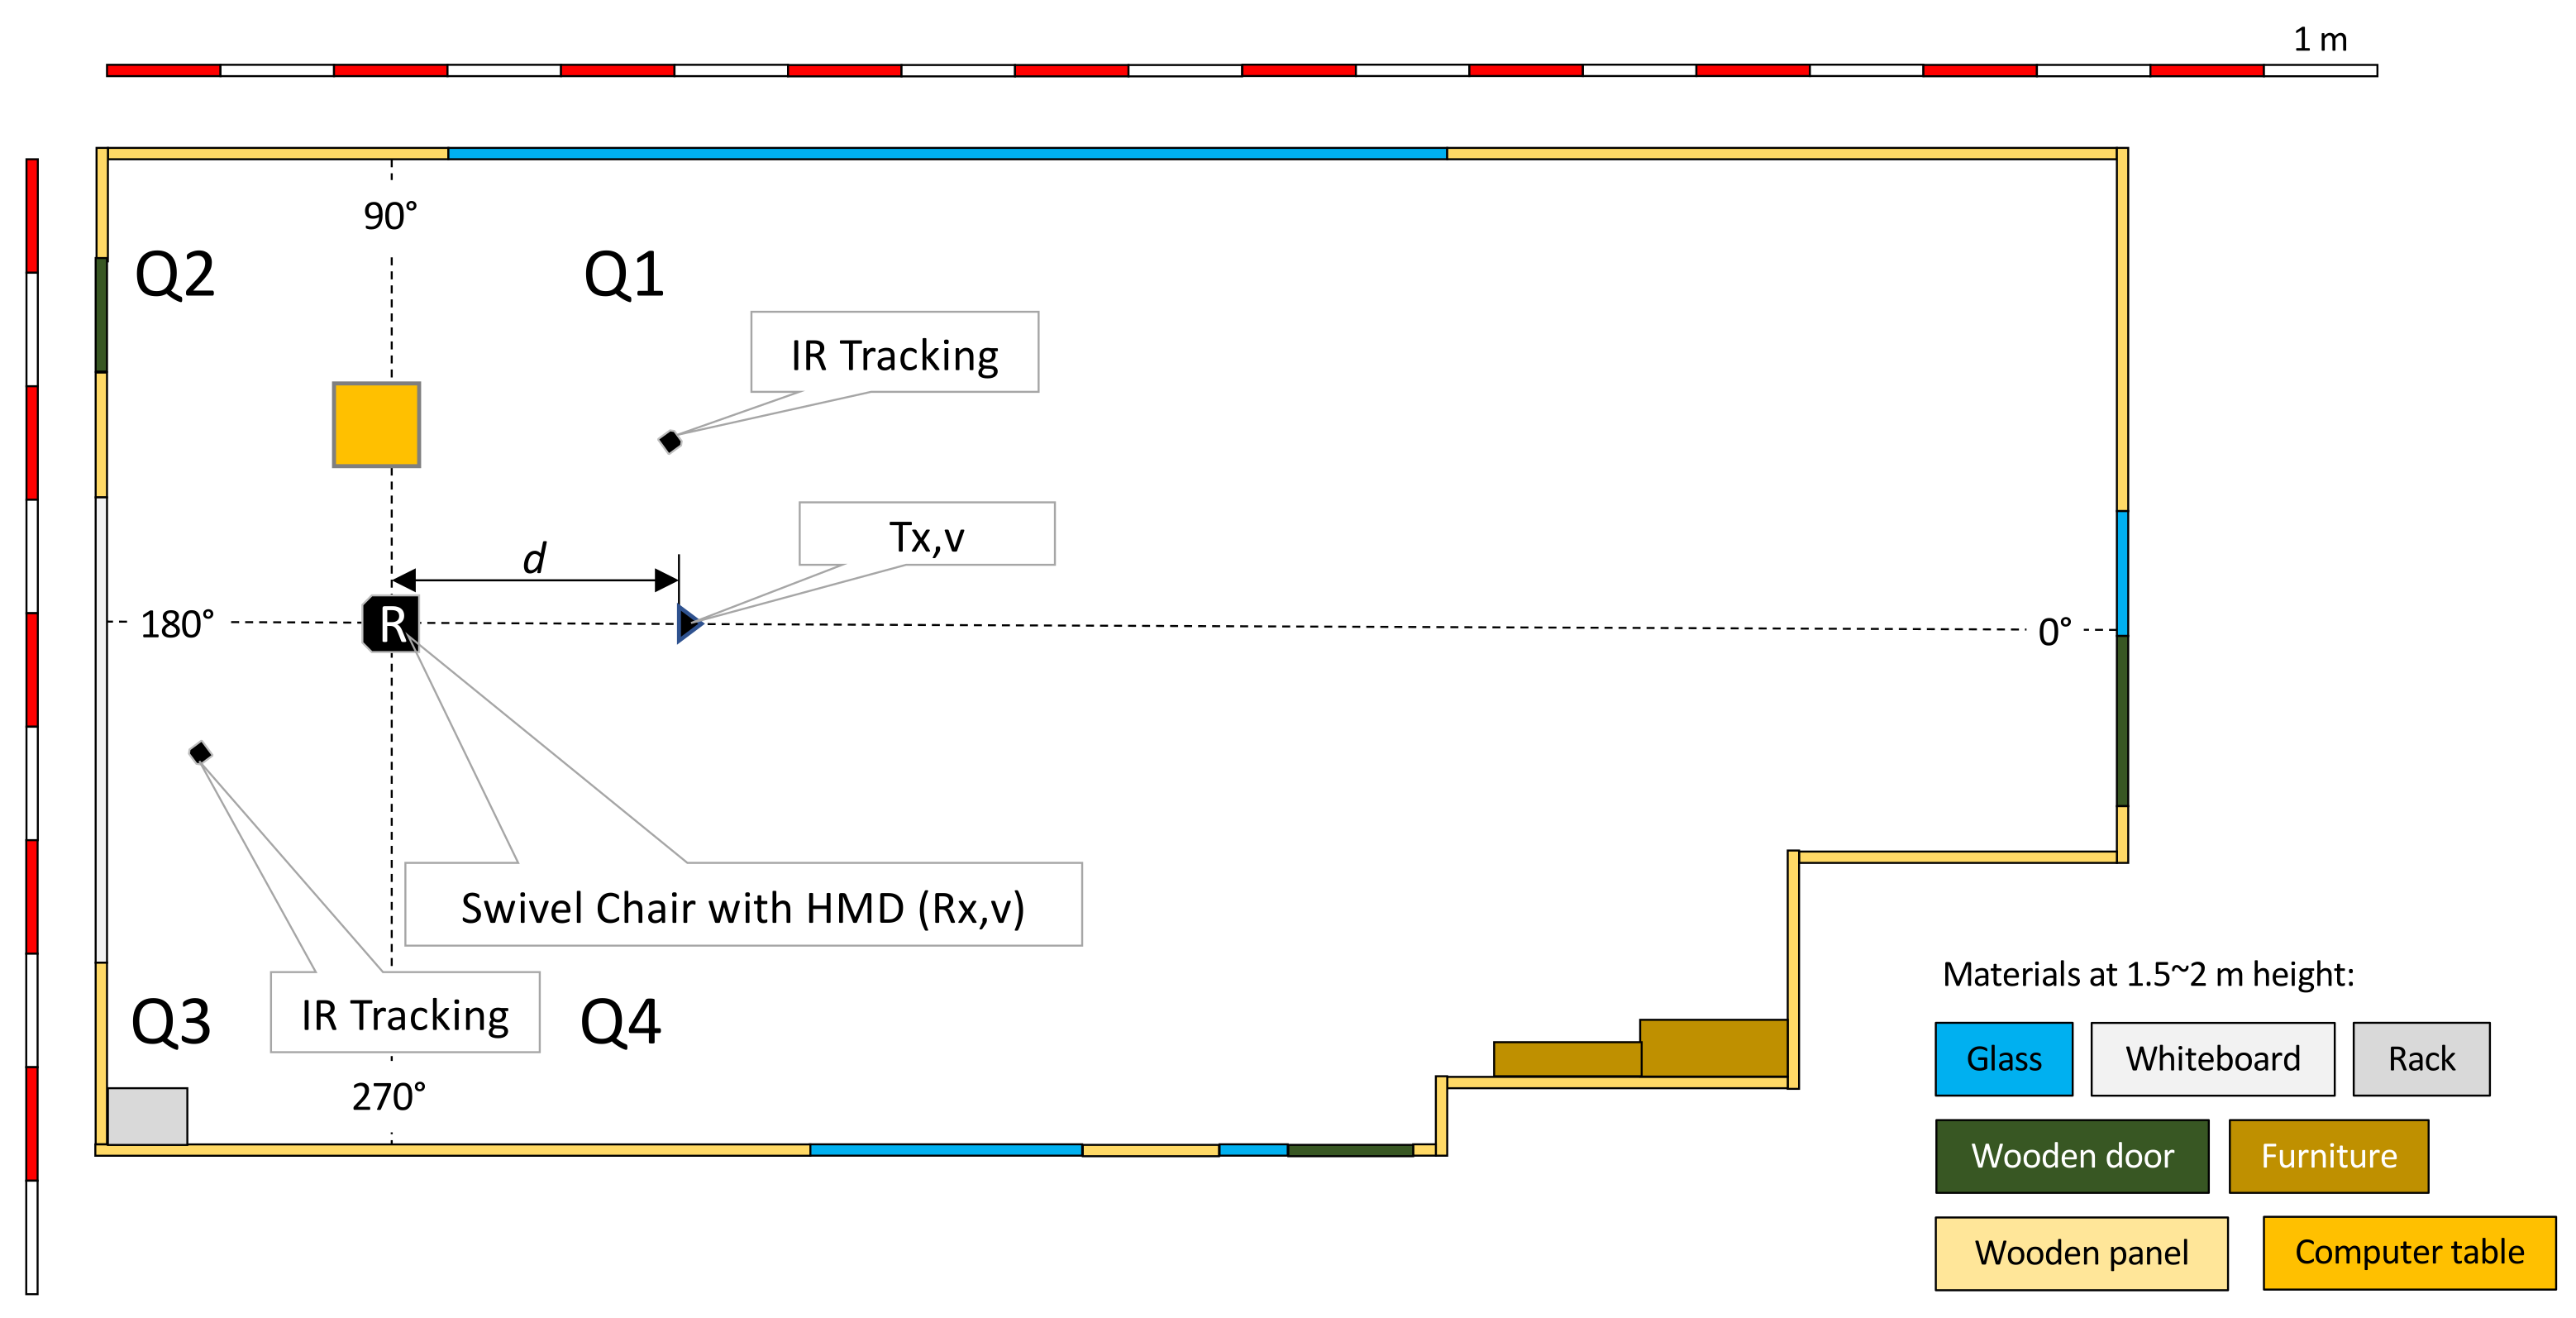
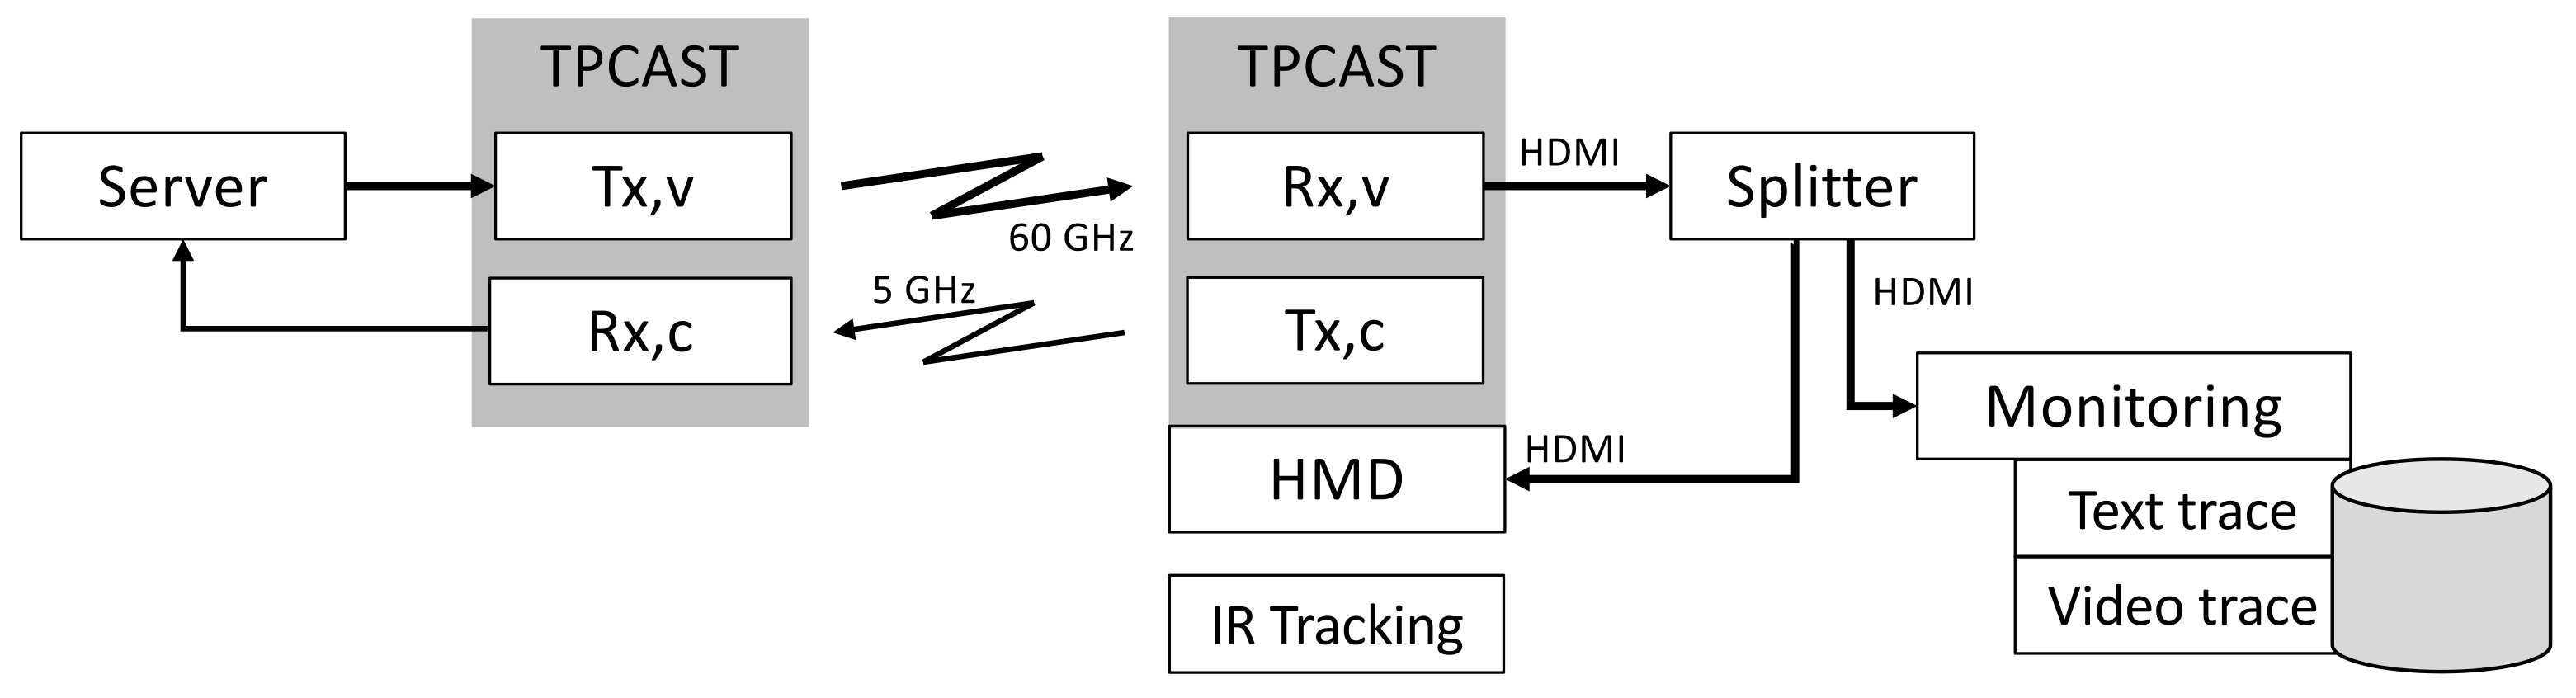
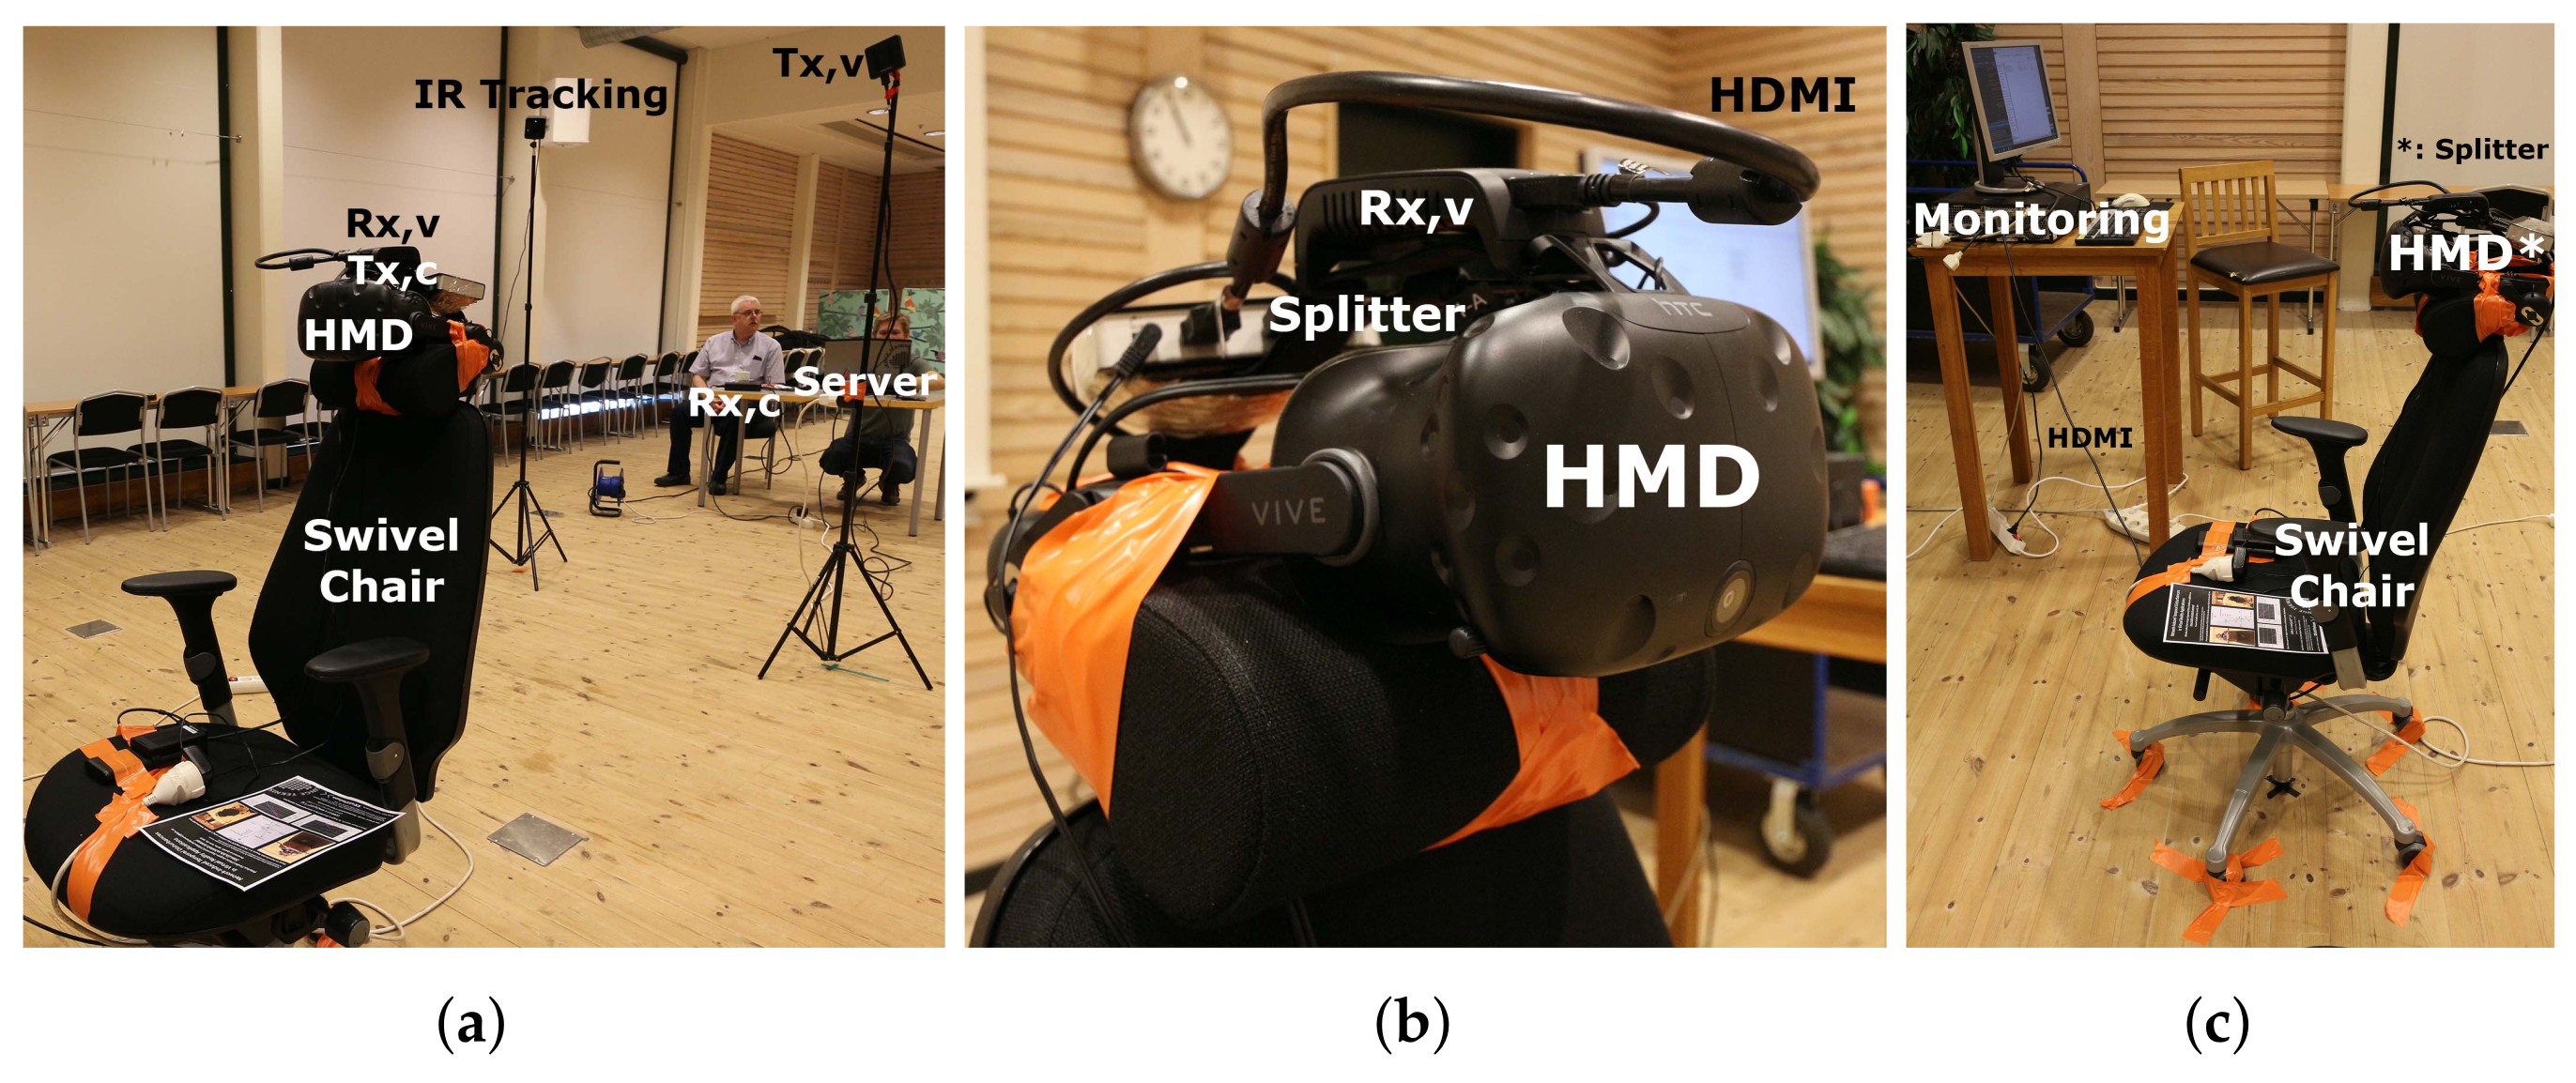
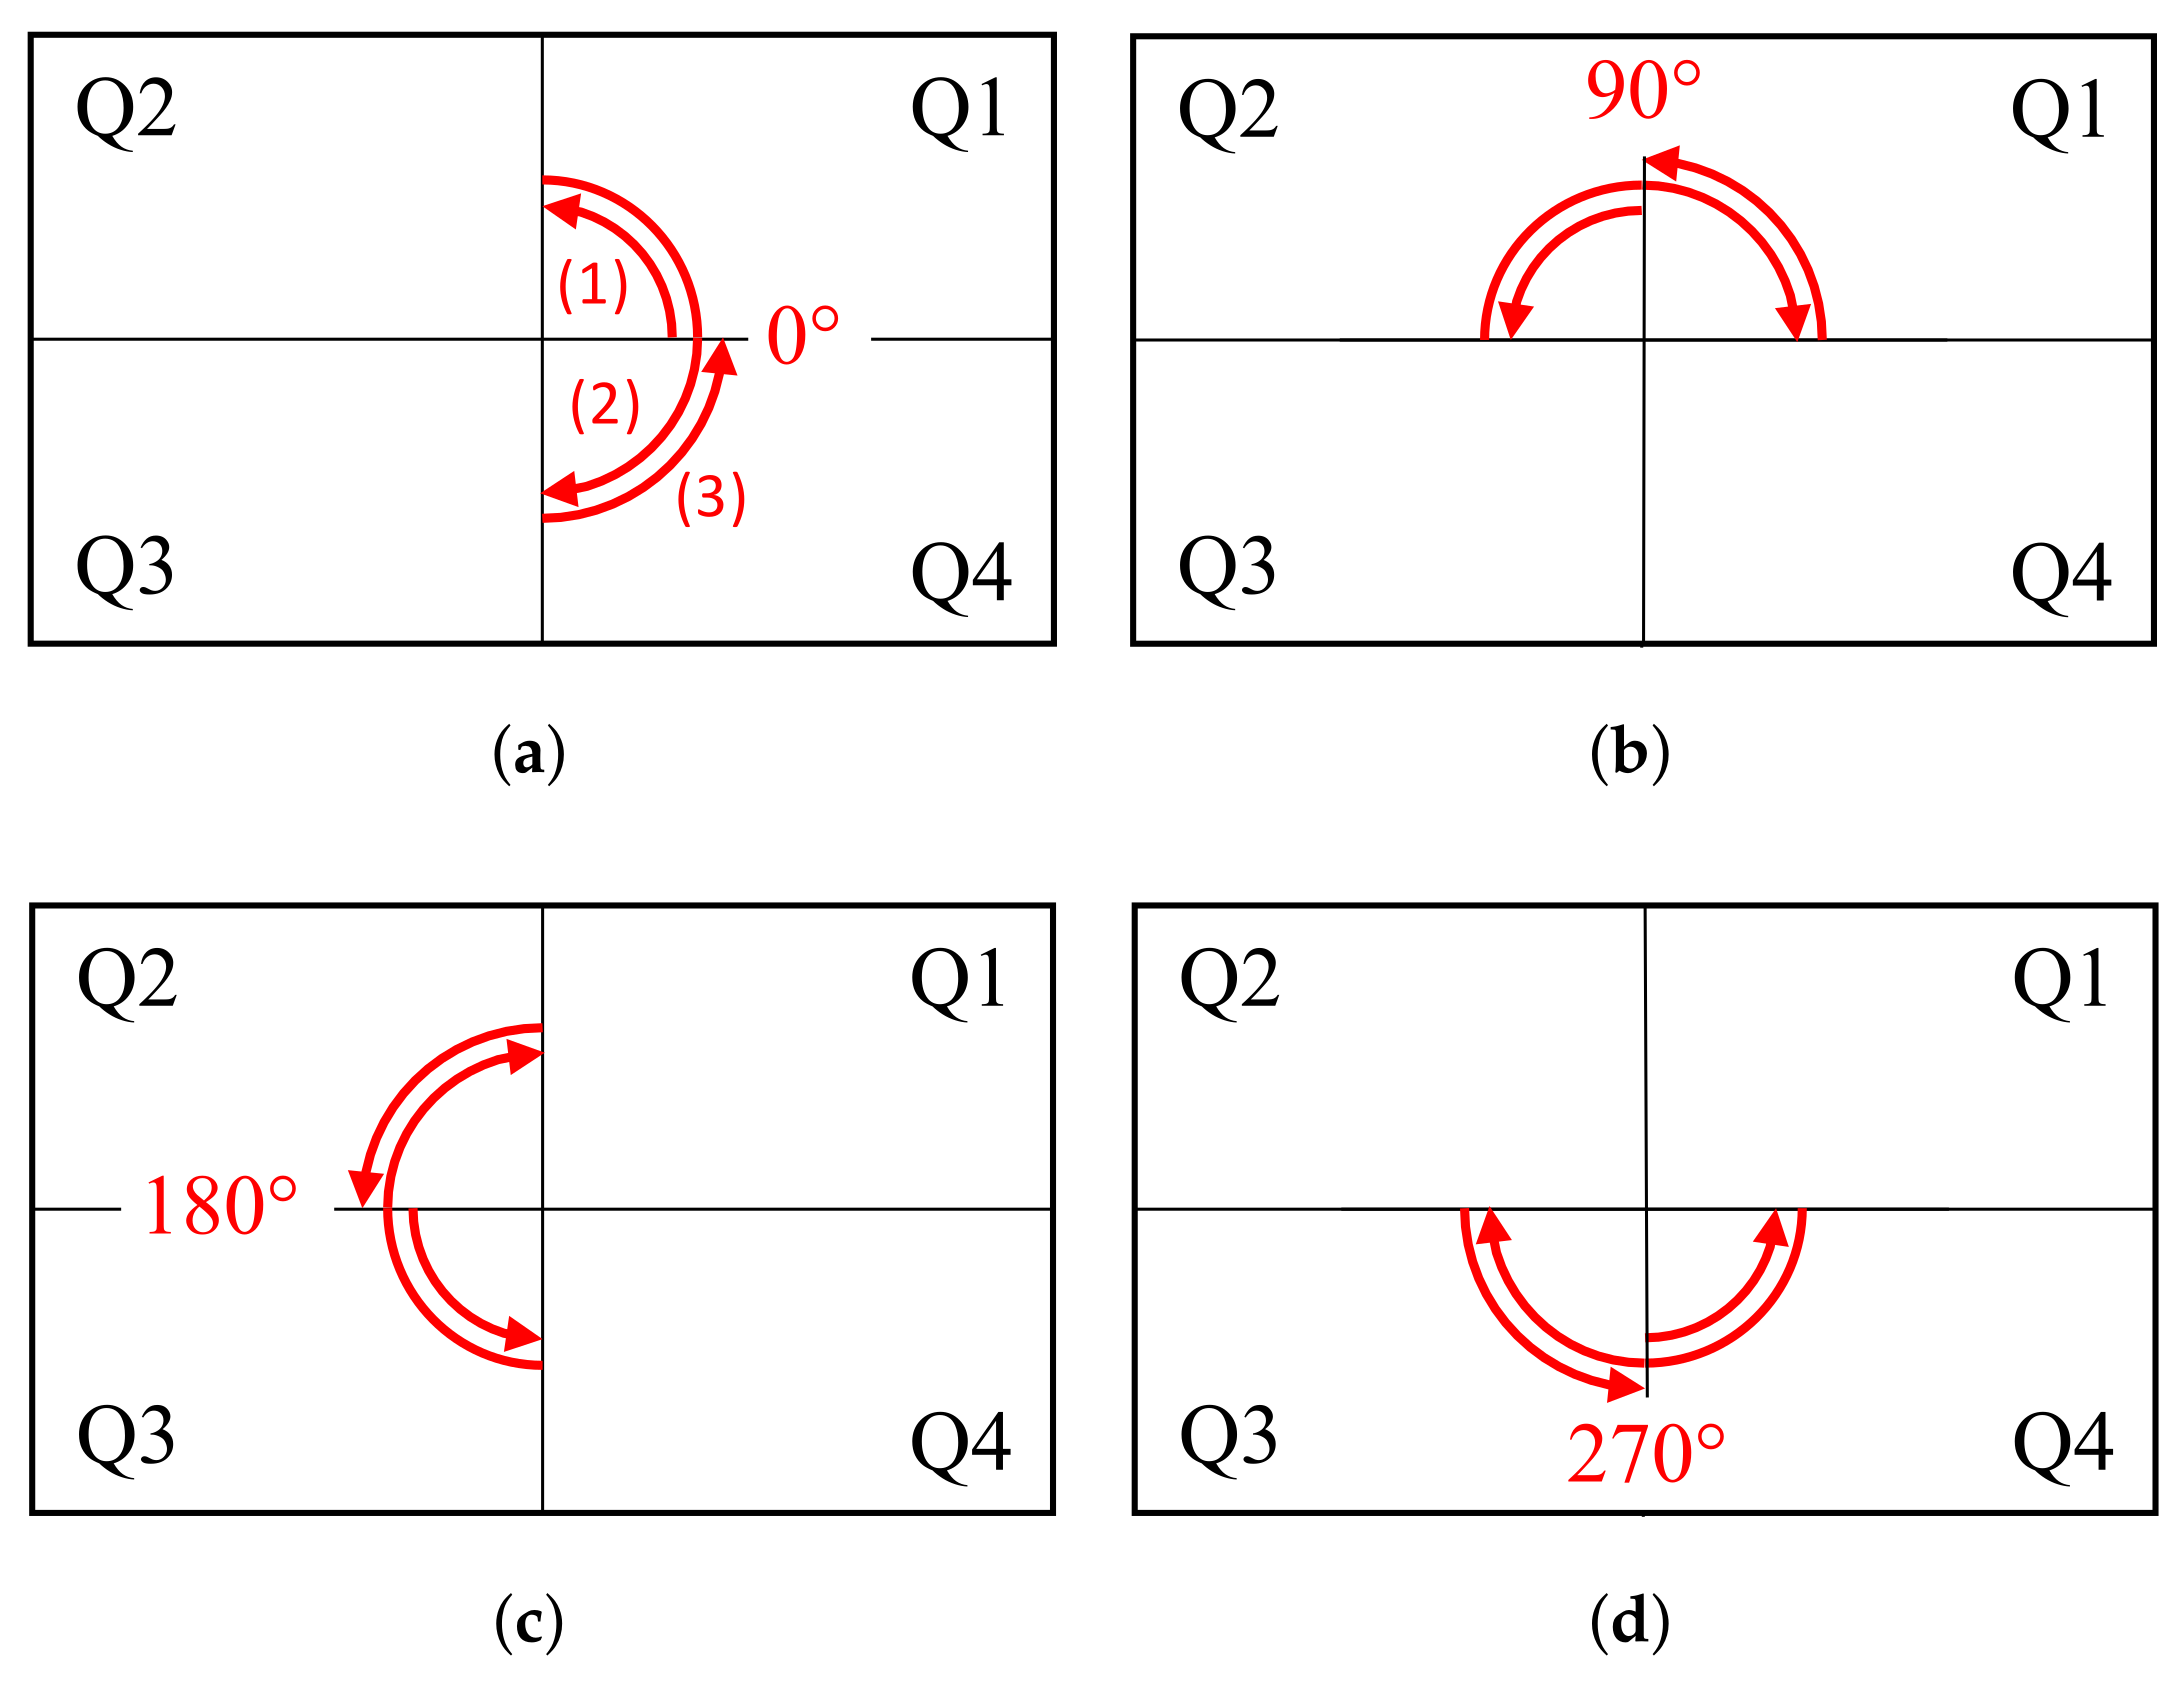
  • A comprehensive description of the experimental setup of the wireless VR TPCAST testbed is provided including room topology and its structuring into quadrants, relevant hardware components and functions of the TPCAST-based wireless VR testbed, rotational movement procedure of the full-swivel chair adopted to realize the HMD rotational movement pattern, and the six distances imposed on the placements of the transmitter and receiver of the wireless link.
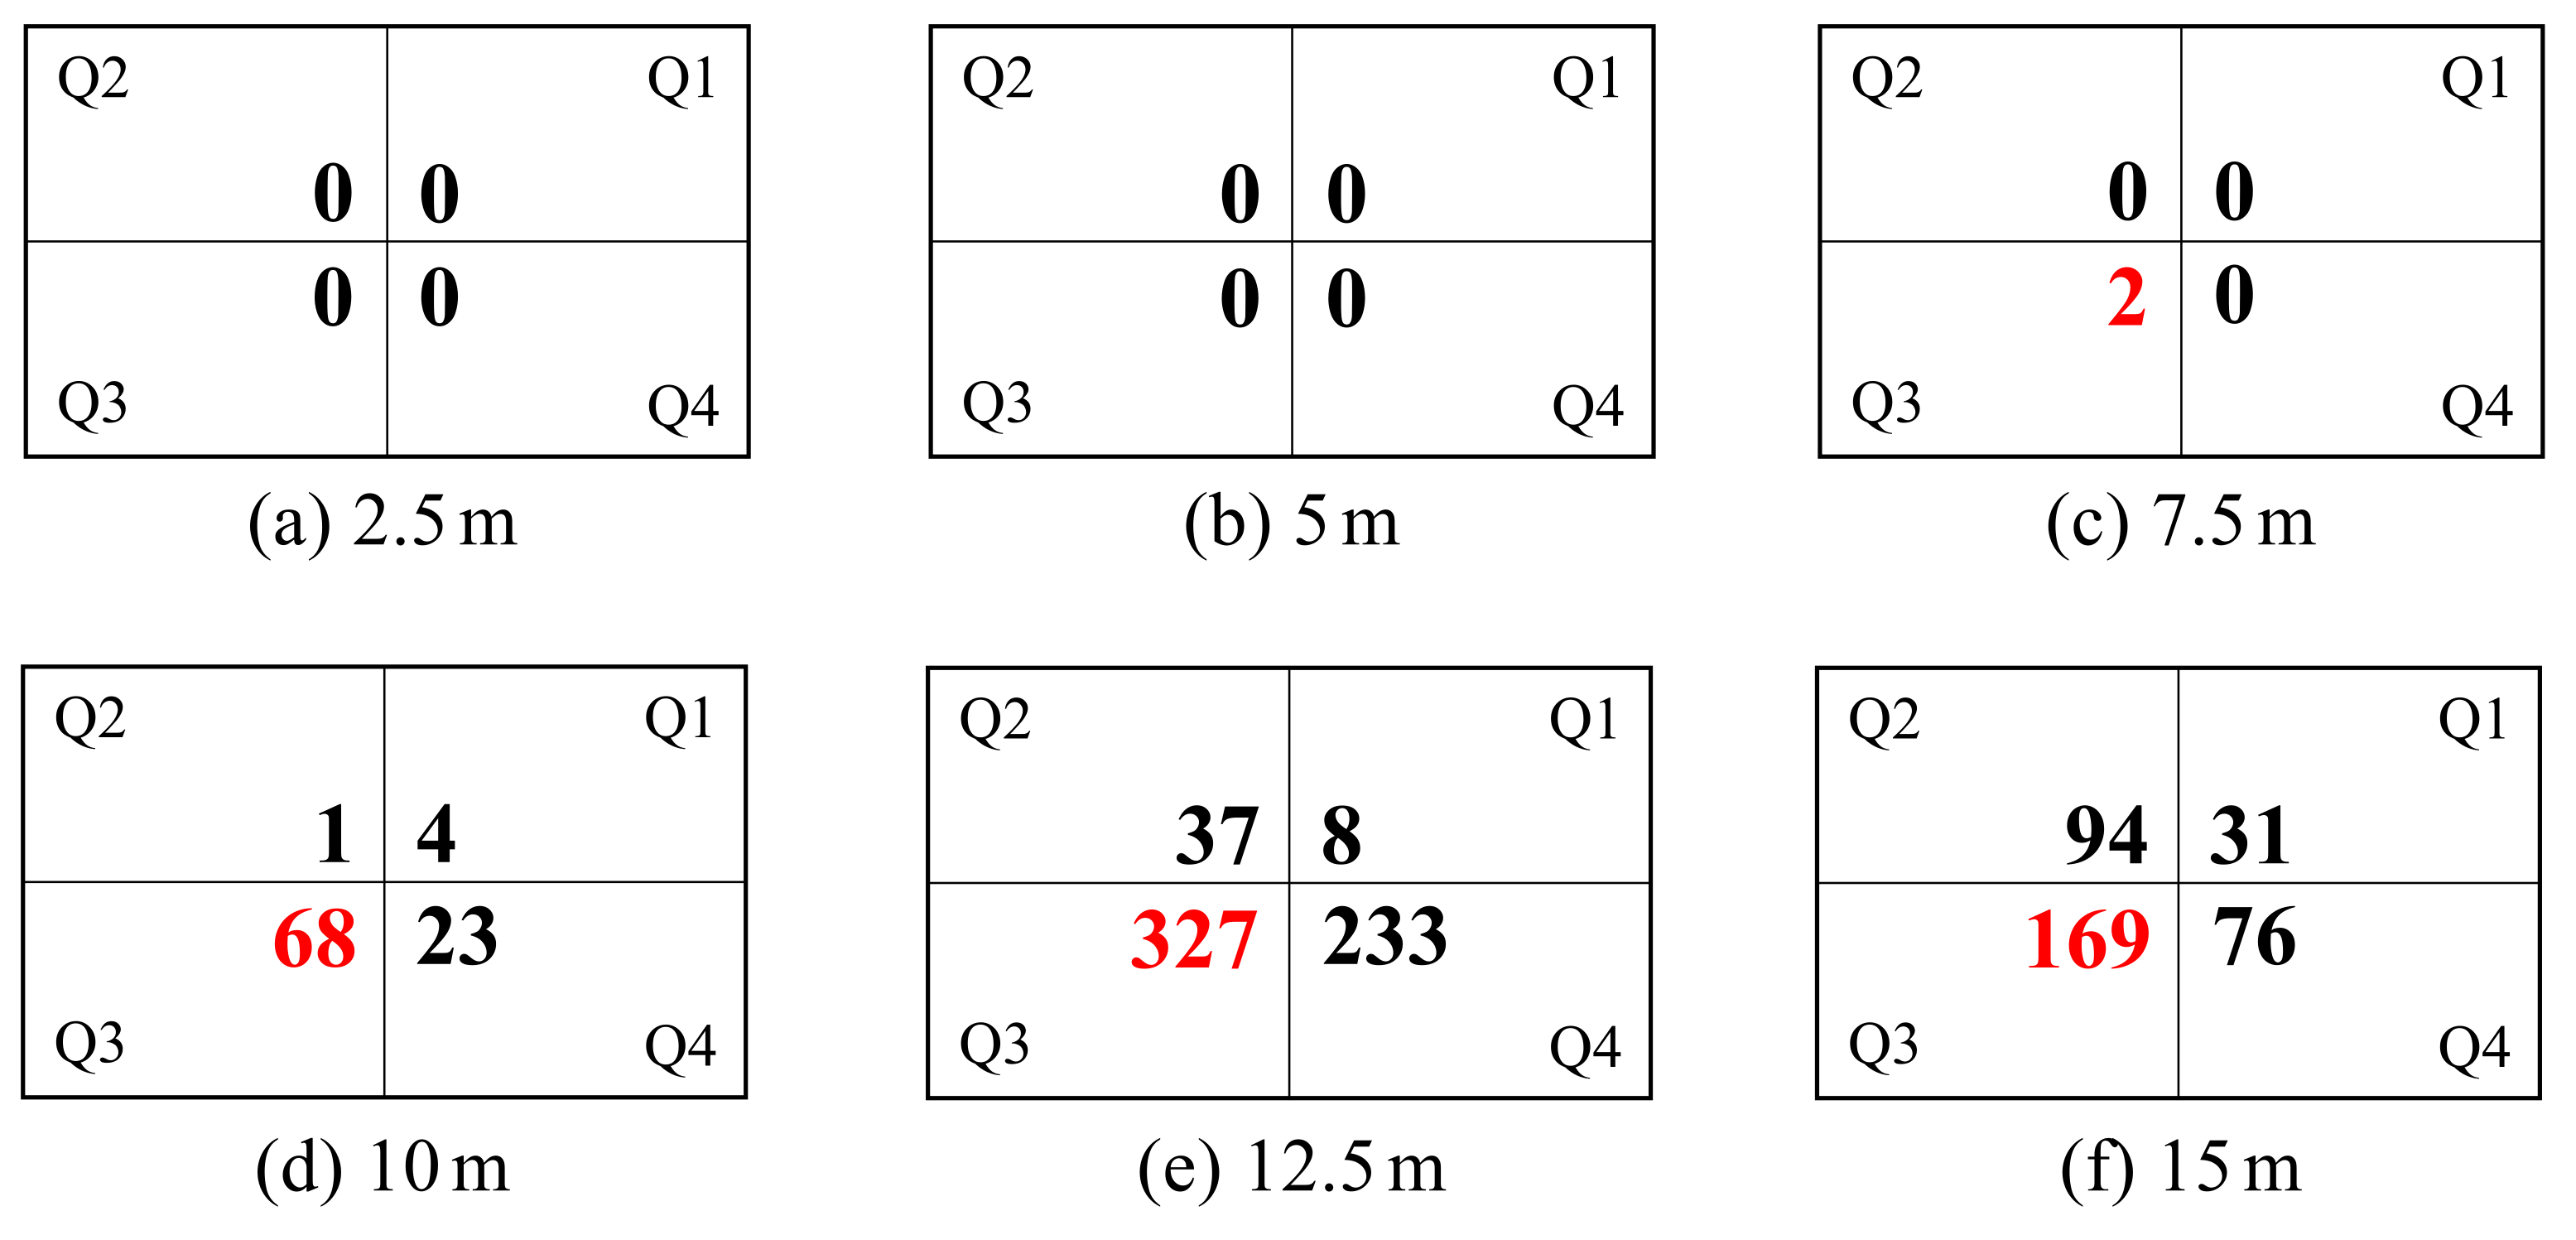
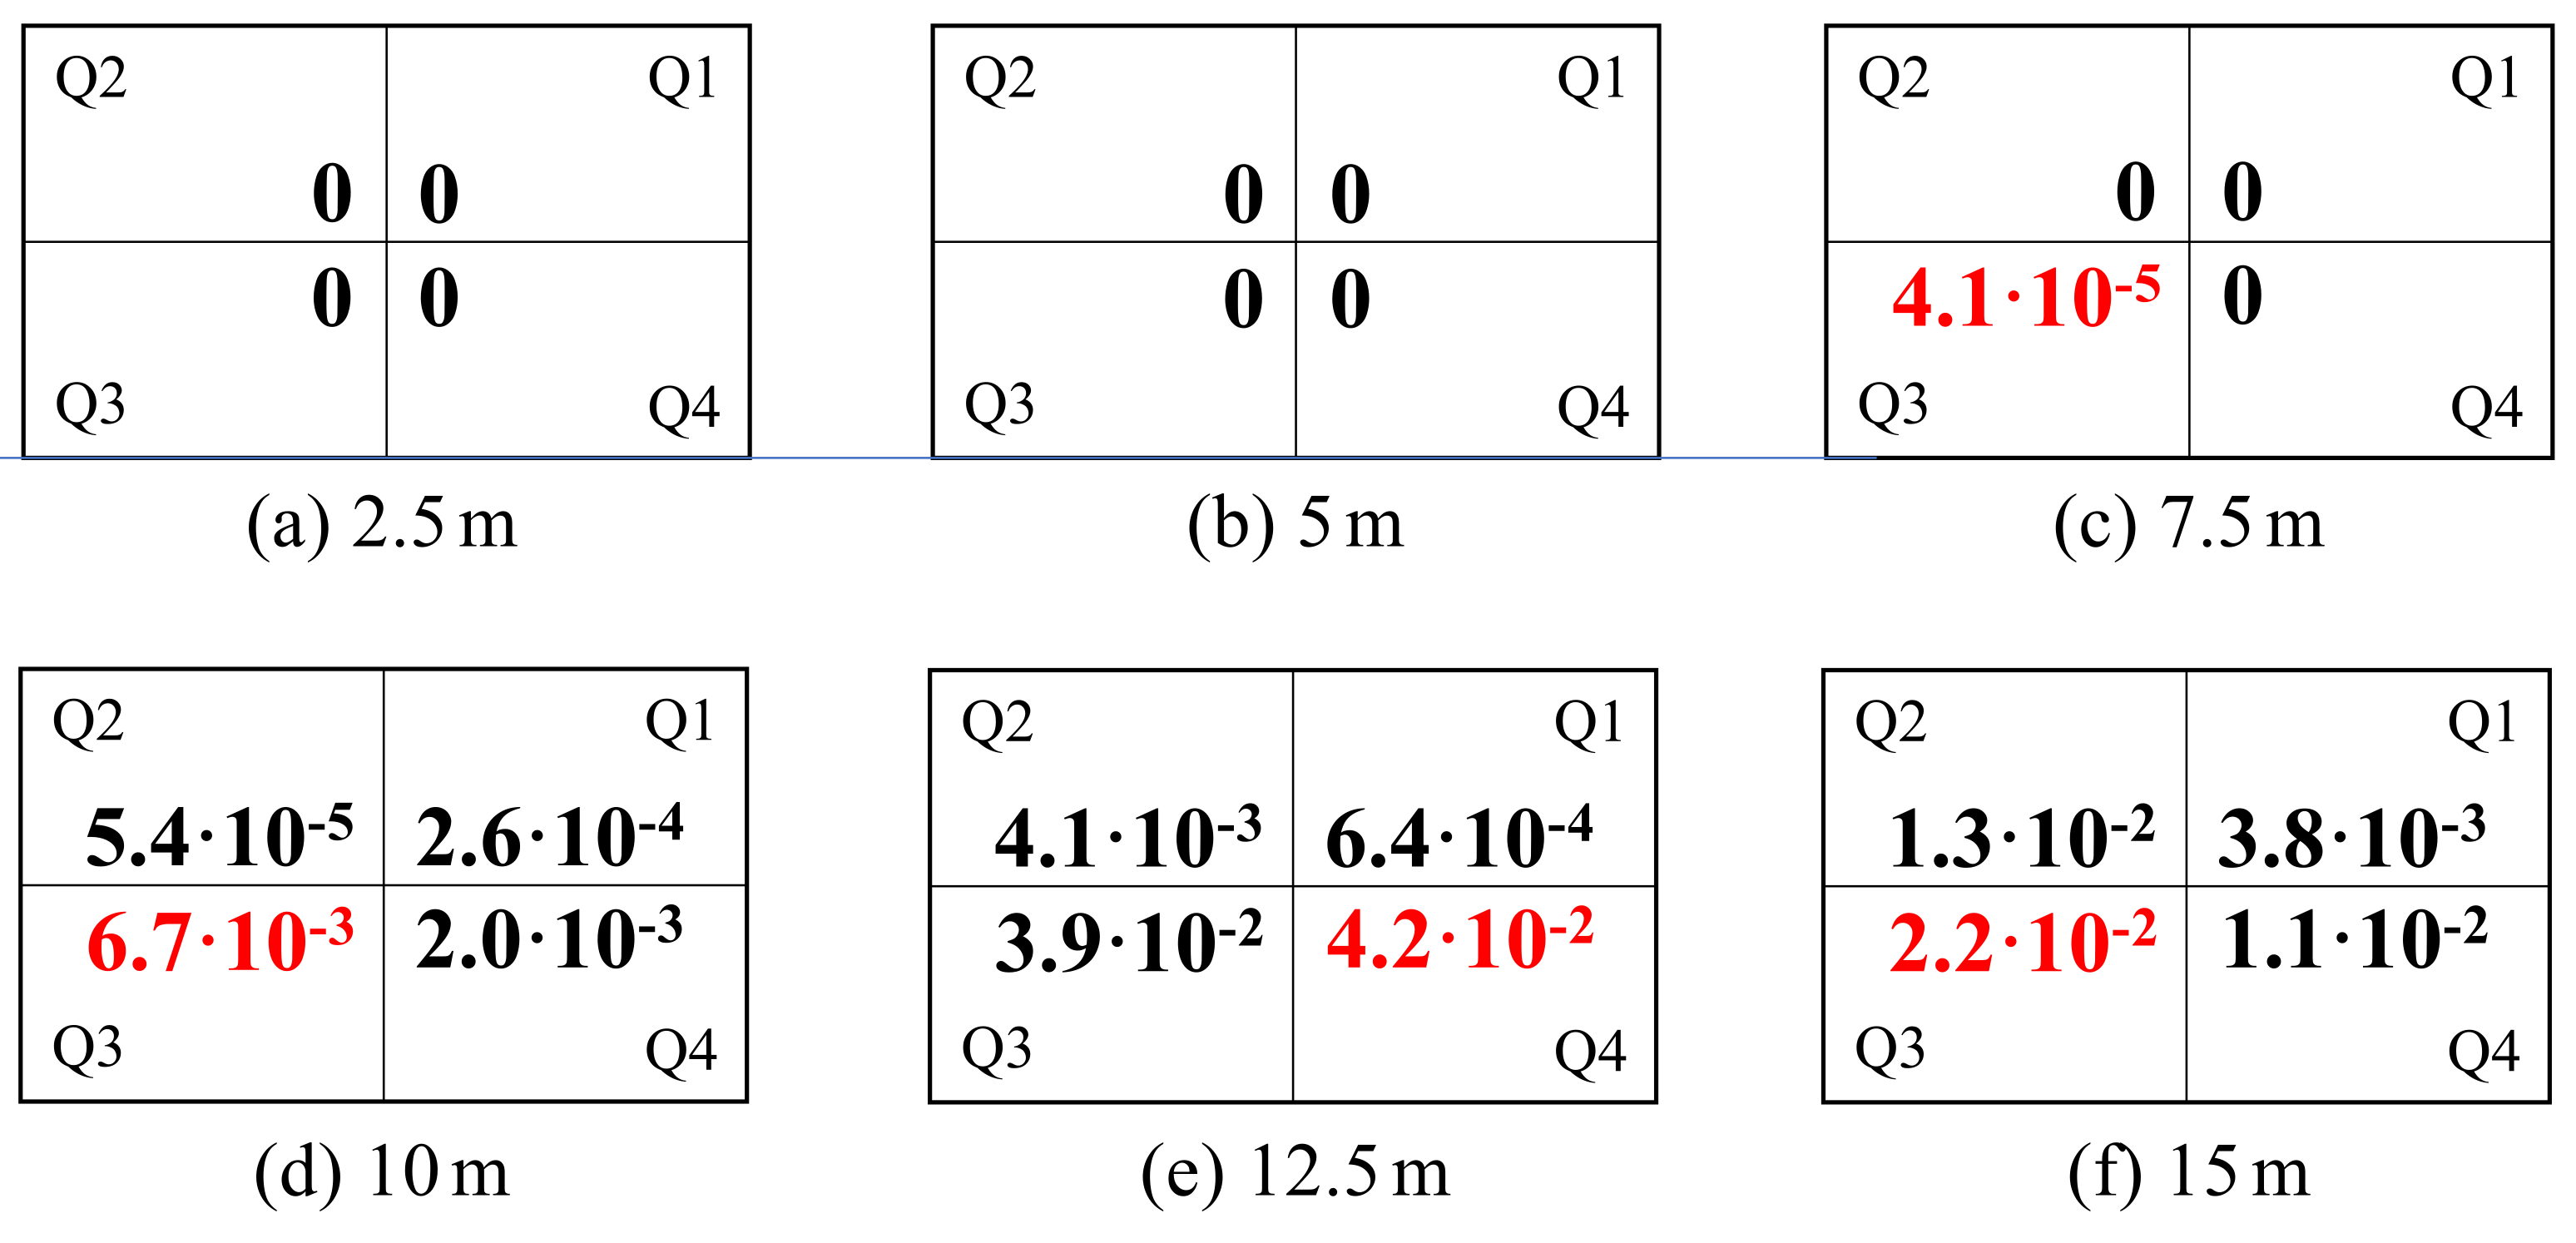
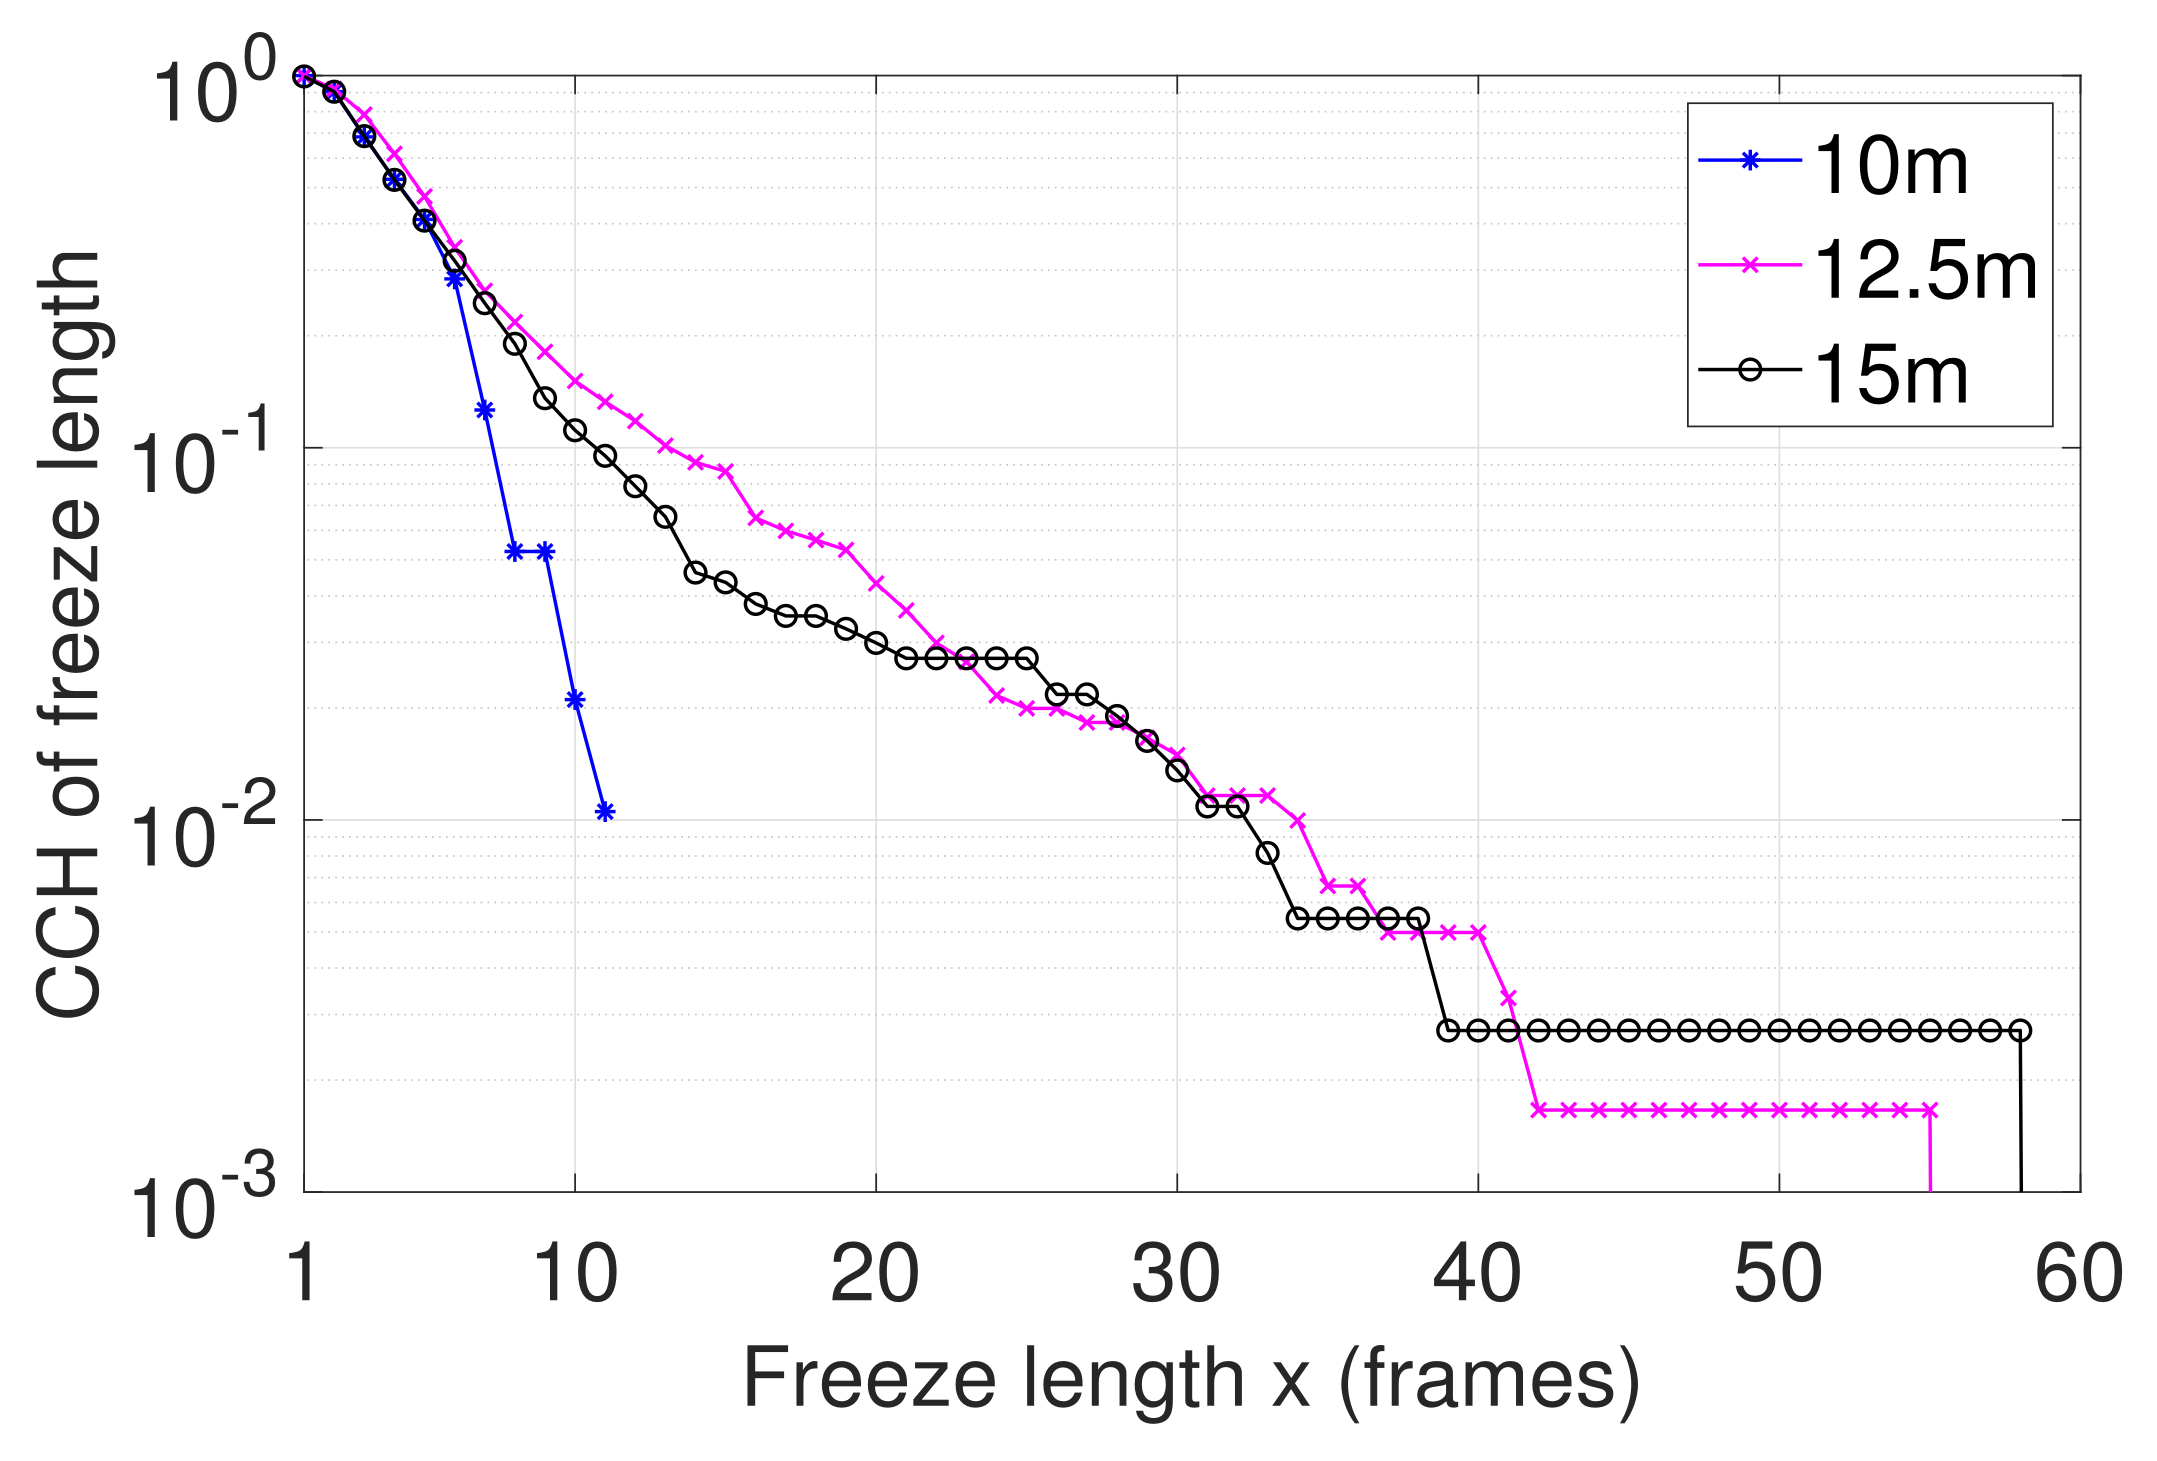
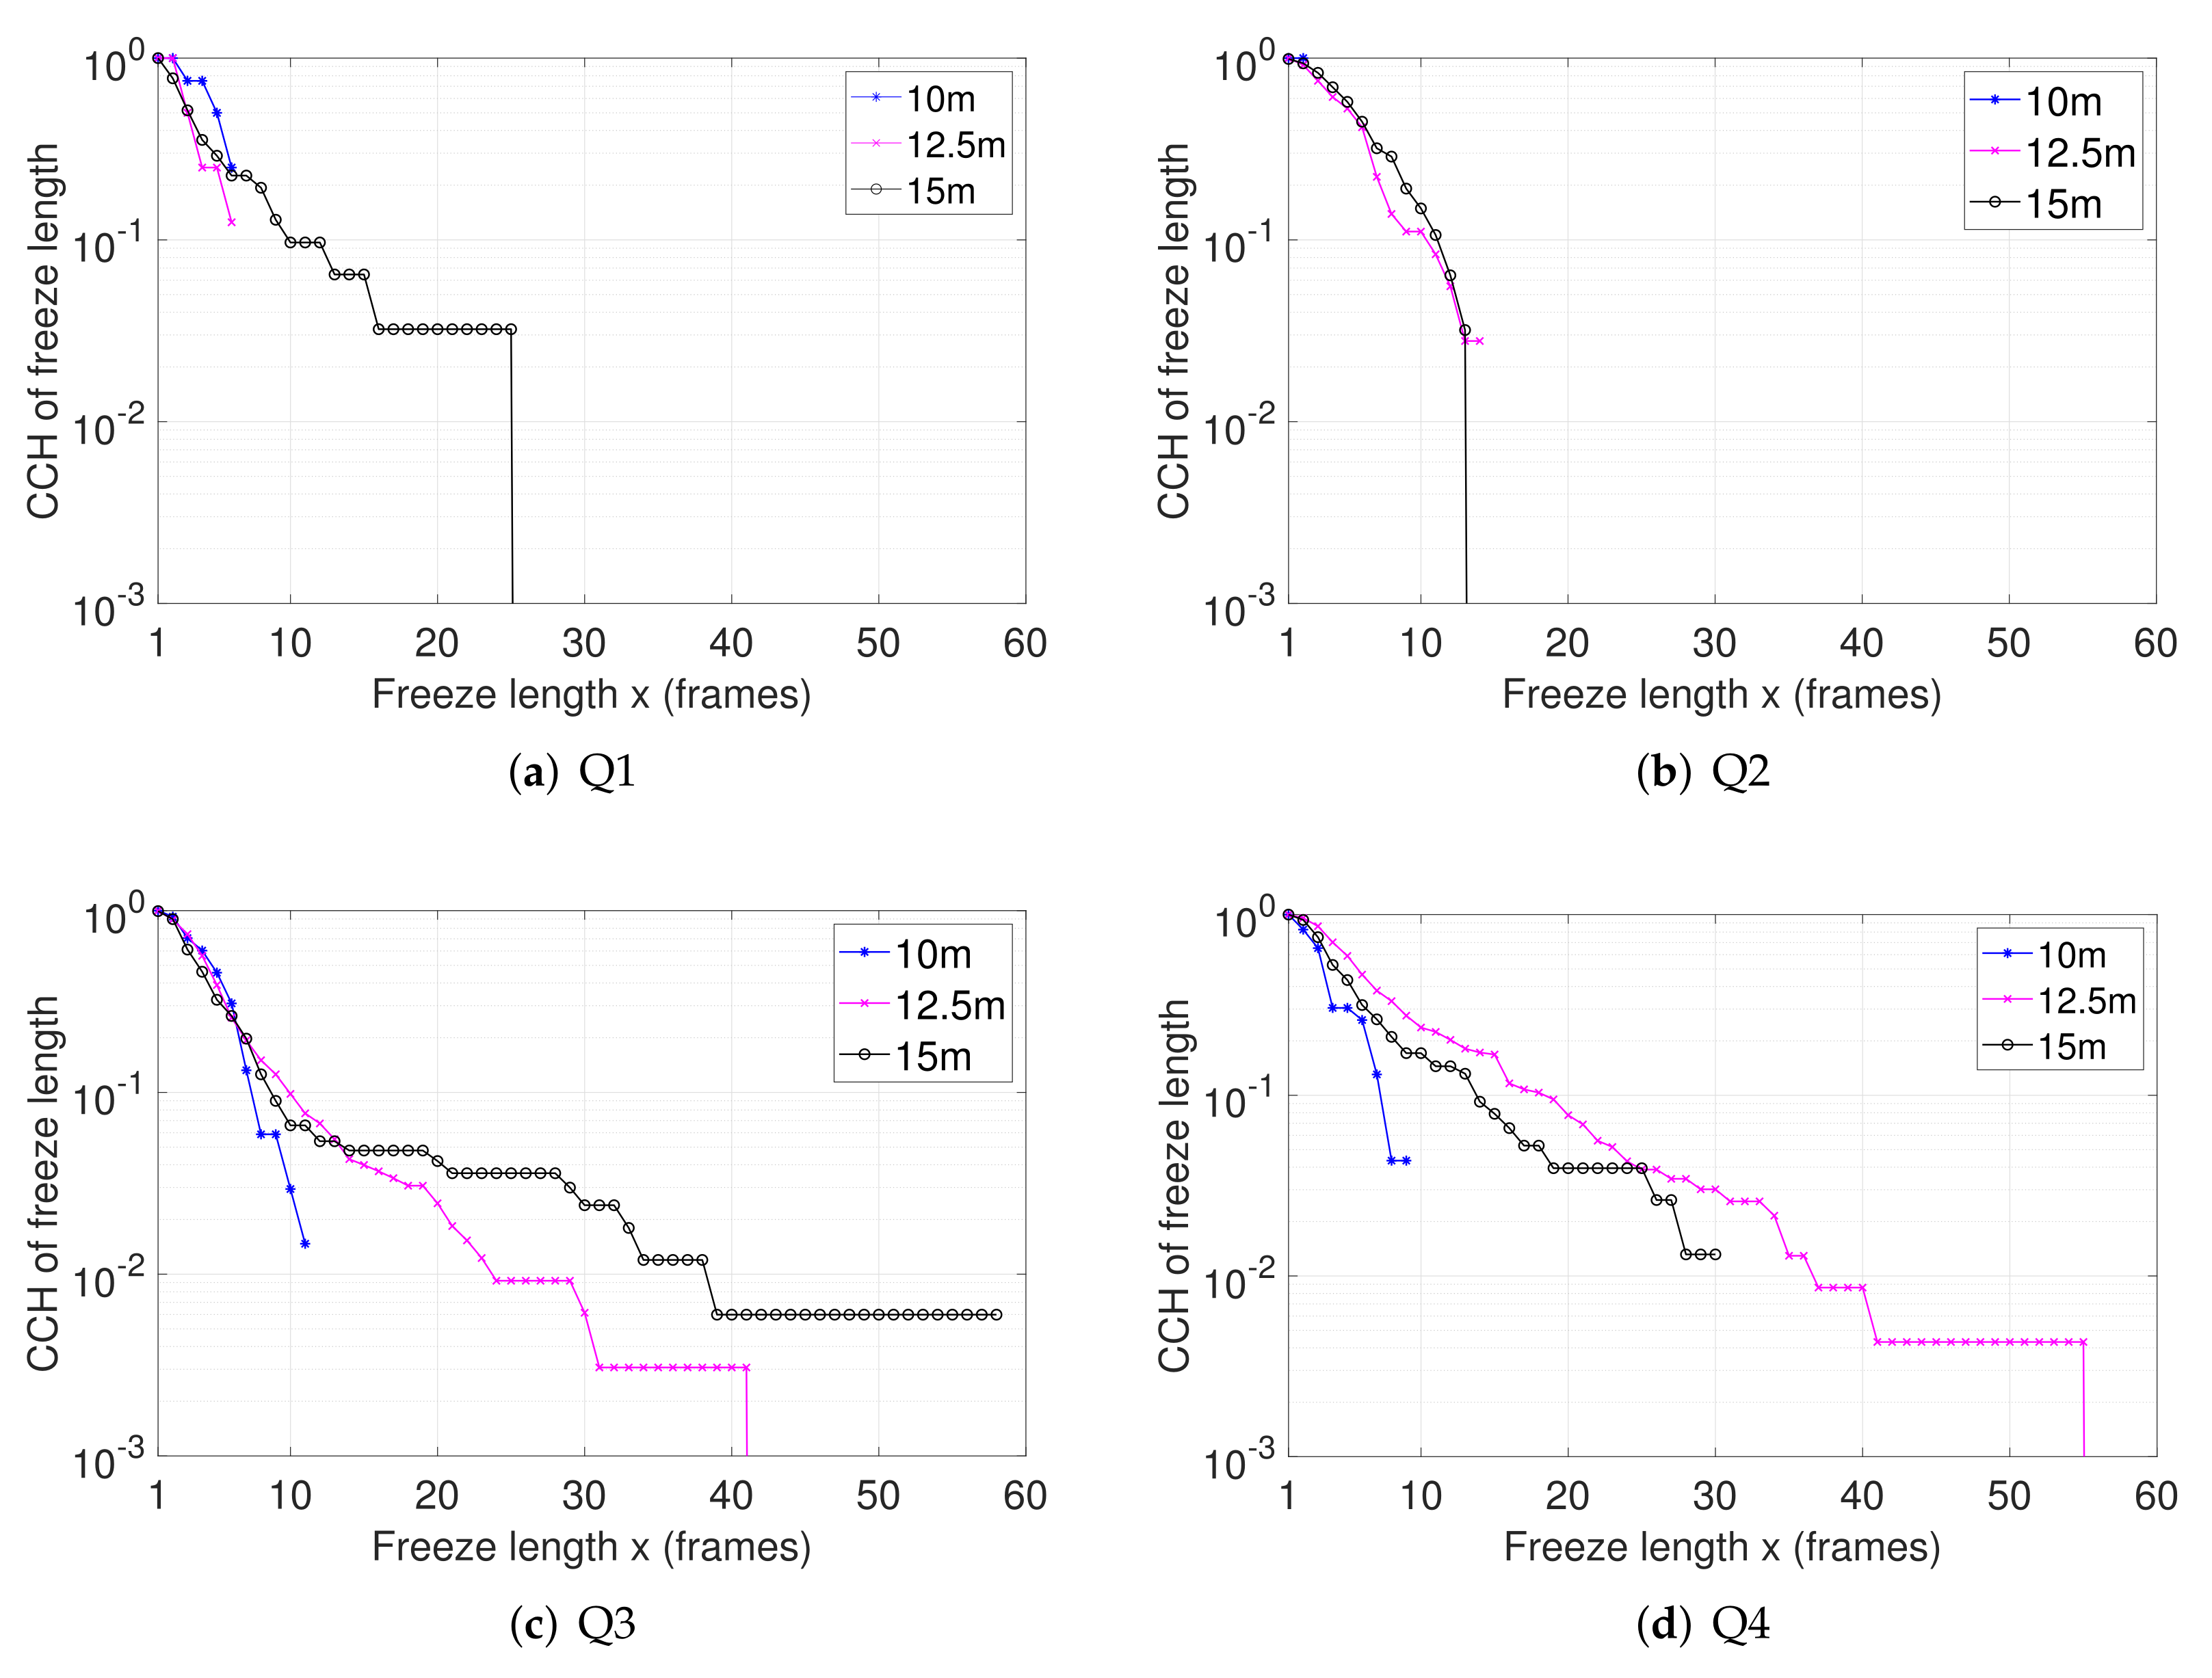
  • The number of freezes and freeze lengths deduced from the VR video traces that were recorded in the measurement campaign are reported both accumulated over the four quadrants as well as focusing on each of the four quadrants. This analysis is provided for the six considered distances.
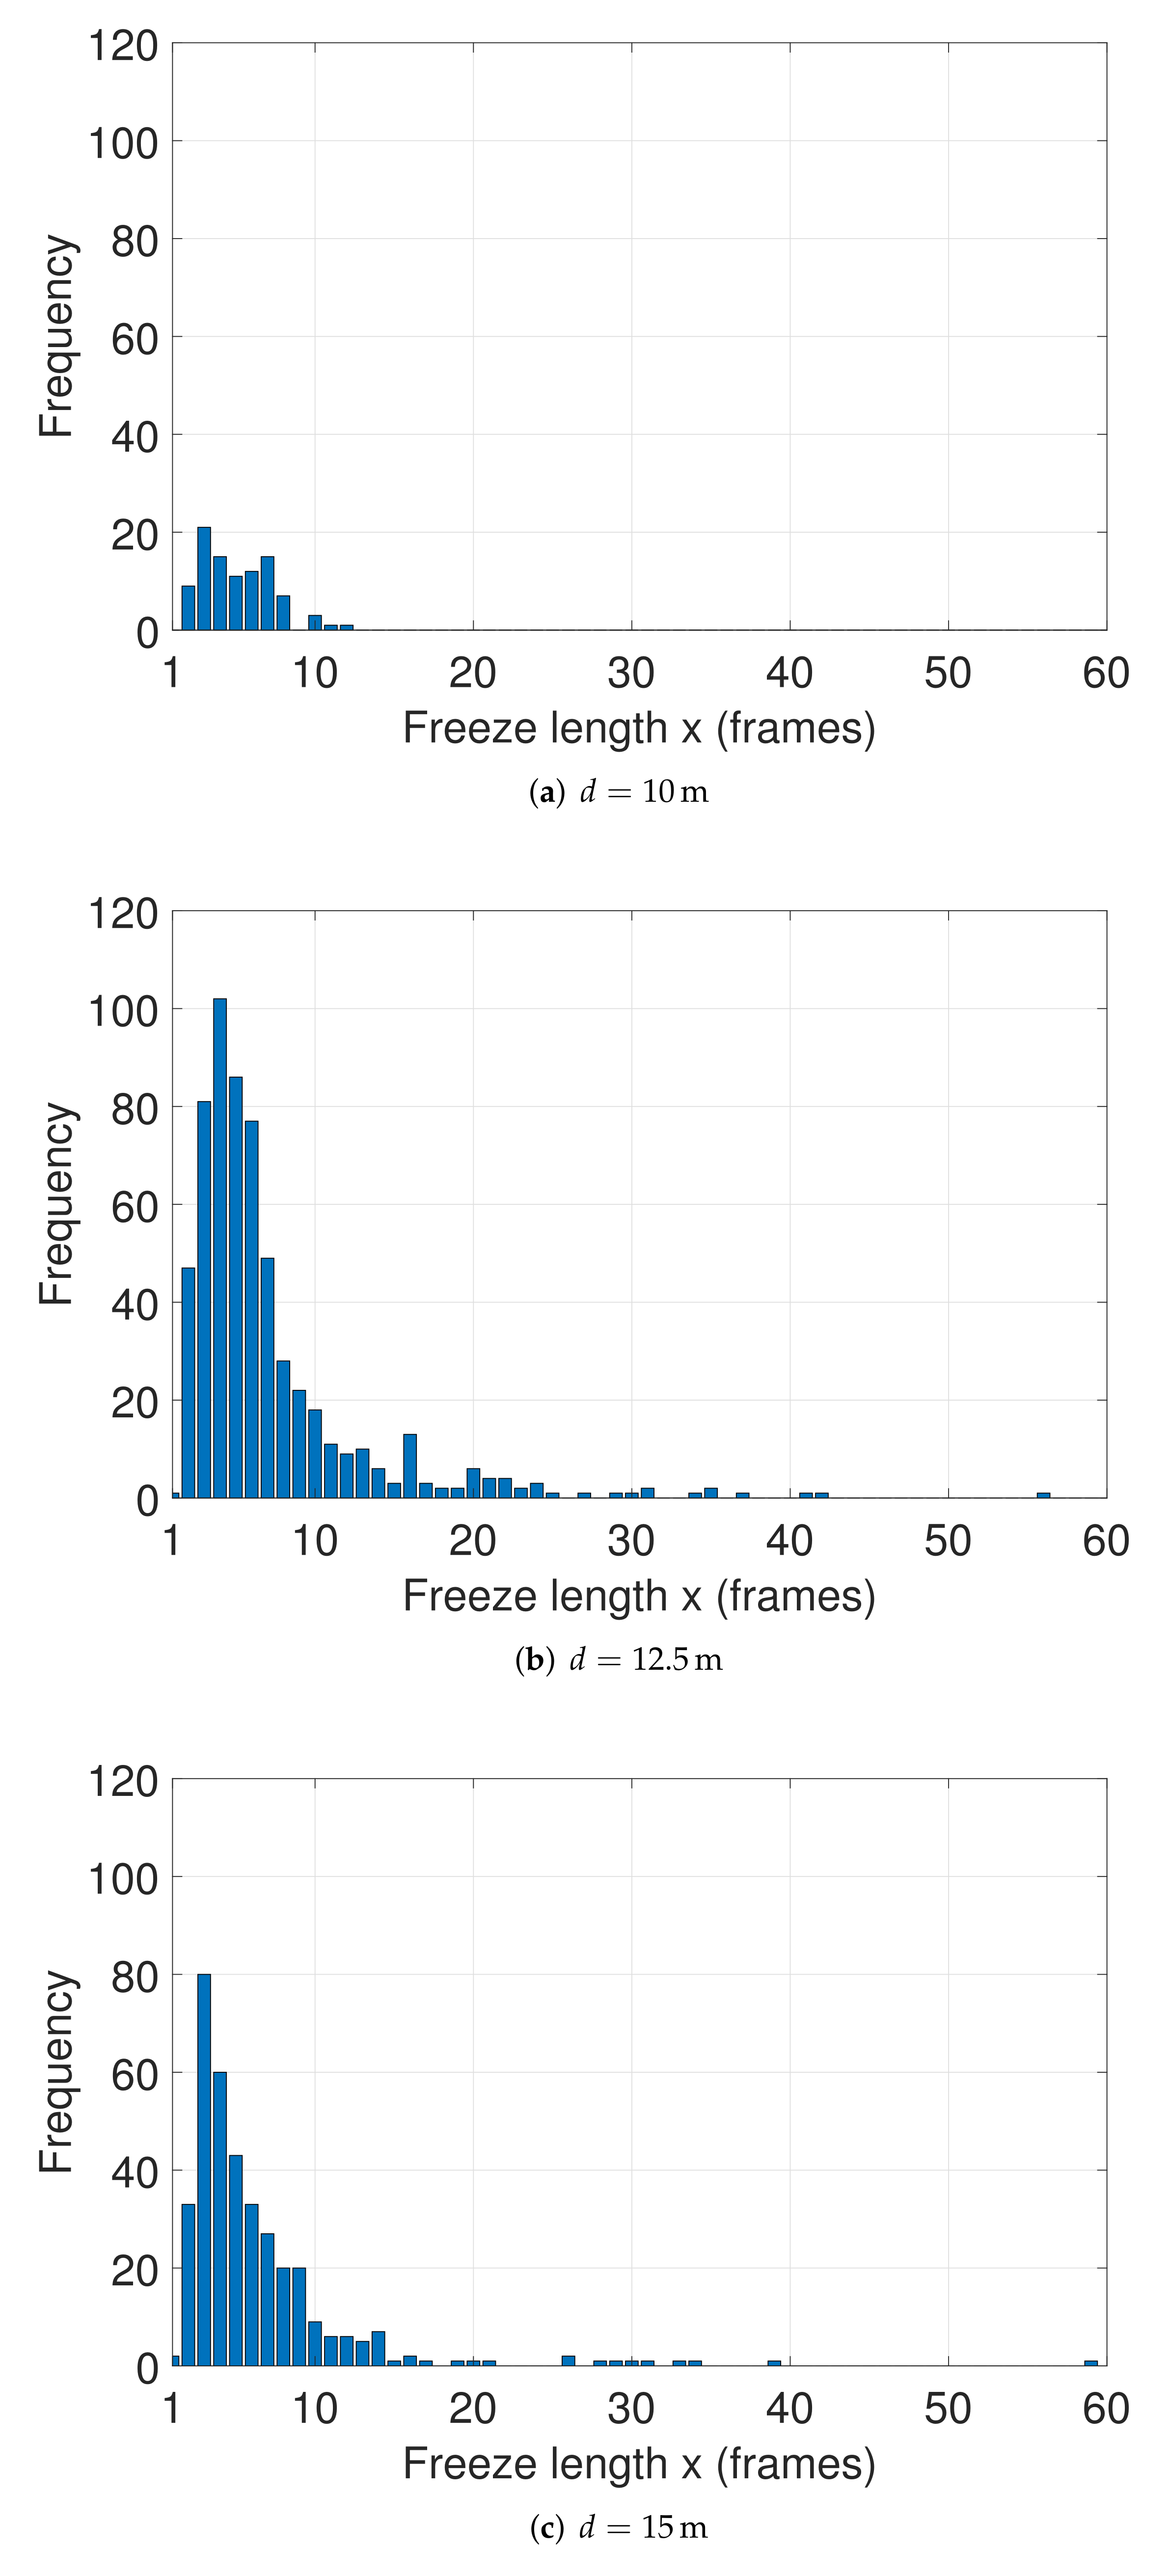
  • Histograms of the freeze lengths measured in frames are provided for different distances between transmitter and receiver to shed light on the density of the underlying distributions of the measured data. Measures of the central tendency of freeze lengths are provided to support the statistical modeling of the freeze lengths.
  • Cumulative complementary histograms (CCHs) of the freeze length both accumulated over the four quadrants and quadrant-specific CCHs are provided. The CCHs reveal those scenarios which cause tails beyond the central part of the distributions of the freeze length.
  • Exponential distributions and their equivalent geometric distributions are obtained as statistical models for the freeze length characteristics using curve fitting along with their goodness of fit.
The remainder of this paper is organized as follows. The experimental setup is described in Section 2 including the TPCAST wireless VR testbed, VR video traffic, room topology, and measurement procedure. Section 3 conducts a statistical analysis of the VR video traces that were gathered in an extensive measurement campaign. Focus is given to histograms and CCHs of the VR video freeze data. In Section 4, the statistical models capturing the statistical characteristics of the freeze lengths are derived. Finally, conclusions and directions for future research are given in Section 5.

2. Experimental Setup

This section describes the experimental setup used for the performance assessment including room topology, components of the TPCAST wireless VR testbed, and the full-swivel chair rotational movement procedure. More details about the TPCAST can be found in [2,23], specifications of the associated WirelessHD are given in [7], other options and applications supported by our TPCAST wireless VR testbed are provided in [19,20].

2.1. Room Topology

The room in which the measurements took place is a multi-purpose lecture hall of size 17.7 m × 8.7 m with a 3.9 m ceiling (see Figure 1). The ceiling is located 0.4 m below the concrete floor from the second storey of the three storey building. This multi-purpose lecture hall is equipped with easily removable furniture, a feature which is suitable for conducting experimental VR studies due to its open and obstacle-free space.
A floor plan of the multi-purpose lecture hall is shown in Figure 2. The walls consist of different materials including wooden walls, glass windows with blinds, wooden doors with small windows, a whiteboard, and a multi-screen arrangement. Further, a few items of furniture and information and communication technology (ICT) equipment were in the room during the measurement campaign. The distance between the transmitter Tx,v and the receiver Rx,v (receiving HMD on the full-swivel chair) was chosen as d { 2.5 , 5 , 7.5 , 10 , 12.5 , 15 } m. The location of the receiver Rx,v remained fixed while the transmitter Tx,v was moved to the different locations within the multi-purpose lecture hall at the specified distances. It is noted that the distance d = 15 m extends the transmitter placement from the wide open room into the narrow corridor-like appendix seen on the right-hand side of the floor plan. Two SteamVR base stations (infrared (IR) tracking) were used for room-scale tracking of the locations of the HMD and controller locations. The computer table in the vicinity of the receiving HMD on the full-swivel chair holds the equipment for recording the video stream traces.
To allow for examining the impact of the rotational orientation of the HMD on the video freeze characteristics in relation to the related changing propagation environment, the multi-purpose lecture hall is partitioned into quadrants Q1, Q2, Q3, and Q4. The origin of the associated coordinate system is anchored at the center of the receiver Rx,v with the anticlockwise azimuthal angle ϕ defining the range of the quadrants, i.e., Q1: ϕ [ 0 , 90 ) , Q2: ϕ [ 90 , 180 ) , Q3: ϕ [ 180 , 270 ) , and Q4: ϕ [ 270 , 360 ) .

2.2. TPCAST VR Testbed

Figure 3 and Figure 4, respectively, show a block diagram and photos of the typical placement of the hardware components of the TPCAST wireless VR testbed. In the following, detailed descriptions of the different blocks of our TPCAST VR testbed that were used in this work are provided. The interested reader is referred to [19] for further details of the TPCAST VR testbed and its complete monitoring capabilities that may be used to pursue experimental studies on other challenges of wireless VR.
  • TPCAST transmitter and receiver: The TPCAST wireless adapter was specifically developed for the HTC Vive HMD. The main components of this system include an HMD receiver, personal computer (PC) transmitter, and a router. TPCAST is designed for an intended transmitter-receiver distance of above 5 m allowing a footprint of 80–100 m 2 with a 360 degree freedom of movement. TPCAST operates in the 57–66 GHz frequency band using the carrier frequencies of 60.48 GHz and 62.64 GHz with a channel spacing of 2.16 GHz. The modulation types follow the WirelessHD1.1 specifications [7] allowing for binary phase shift keying (BPSK), QPSK, and 16-QAM. The HMD receiver is equipped with a phase array antenna to compensate for the translational and rotational movements of the users such that a directional communication link to the PC transmitter is maintained. It receives the WirelessHD signal and recodes it into an HDMI video signal for further processing and display at the HMD. This setting provides a data rate of up to 28 Gbps for high quality 2K ( 2160 × 1200 pixels) video transmission with ultra-low latency of below 2 ms. In addition, a wireless link in the 5 GHz band is used with the AP to relay control data between PC transmitter and HMD receiver.
  • Server: An Alienware 17 R4 gaming laptop with an Intel Core i7-7820HK CPU of 2.90 GHz clock rate, 32 GB RAM and a GeForce GTX 1080 GPU was used as server. The WirelessHD video signal of the 2K video at an actual rate of 89.53 frames per second (fps) is produced at the server to be transmitted to the HMD.
  • Splitter: The ATEN 4K HDMI splitter devides the HDMI signal released by the TPCAST receiver into two data streams for distribution to the HMD and the monitoring unit. The splitter ensures that both units receive the same signal, one processed at the HMD for video diplay and the other used for video freeze detection at the monitoring unit.
  • HMD: The video test stimuli were shown on an HTC Vive HMD which provides a resolution of 1080 × 1200 pixels per eye, a 110 field of view, and runs at a refresh rate of 90 Hz.
  • IR tracking: In this experimental study, the SteamVR tracking with Vive base stations 1.0 was used for the HMD to position itself in the 3D space.
  • Monitoring: The HTC Vive HMD is equipped with a TPCAST wireless adapter that releases the HDMI signal needed for the identification of video freezes. For this purpose, the HDMI signal from the TPCAST receiver to the HMD is split and recorded by the monitoring equipment. This allows for a pixel-by-pixel comparison among the displayed video frames as a basis for the video freeze detection. In particular, if n consecutive video frames show exactly the same picture, a freeze of length x = n 1 is indicated. The minimum freeze length is therefore given as x min = 1 for n = 2 . Figure 5 shows an example of a text trace and a video trace that are produced by the monitoring function. In this example, a freeze length of x = 3 is detected.
  • Full-swivel chair: During our initial pilot studies on networked immersive media systems, it was observed that sudden turns of the HMD may cause freezes and lags of the video displayed to the user. A full-swivel chair was identified as a suitable device that allows for generating reproducible video freeze conditions. However, preliminary testing of this approach with in-person participation revealed that nausea may potentially be induced to some users after a few minutes. It was decided to execute this experimental study using an HMD mounted on the headrest of a full-swivel chair, and to post-analyze the video traces for the appearance and length of potential freezes. In particular, a full-swivel chair was used that can swivel around the entire 360 range of the azimuthal angle ϕ . The base and seat of the full-swivel chair were connected by swivel mechanisms with the base being fixed with heavy duty tape to the play area.

2.3. Full-Swivel Chair Rotational Movement Procedure

Figure 6 shows the full-swivel chair rotational movement pattern that were followed to generate reproducible video freeze conditions. The procedure starts with selecting an initial direction in which the HMD and TPCAST receiver are pointing to in terms of one of the four azimuthal angles ϕ { 0 , 90 , 180 , 270 } (see also Figure 2). The full-swivel chair, holding the receiving HMD, is first rotated to the left by Δ ϕ = 90 with respect to the selected initial azimuthal angle ϕ 0 covering rotations within the respective quadrant from ϕ 0 to ϕ l = ϕ 0 + 90 . Subsequently, the full-swivel chair is rotated to the right by Δ ϕ = 180 starting at ϕ l = ϕ 0 + 90 and ending at ϕ r = ϕ 0 90 . Finally, the full-swivel chair is rotated again to the left by Δ ϕ = 90 from ϕ r = ϕ 0 90 back to the initial azimuthal angle ϕ 0 . The full-swivel chair rotational speed was kept approximately constant at ± 60 / s with 40 turns performed for each of the considered four initial azimuthal angles. Accordingly, each of the four quadrants is covered by 80 forth-and-back turns. It should be noted that the selected rotational speed is consistent with the average head speeds of up to 48 / s around the yaw that were reported in [25] as averages over a whole session of a subjective experiment on 360 video quality.

3. Experimental Results

3.1. Number of Freezes and Freeze Intensities

A frozen video frame occurs as a single frame of video content being repeatedly shown on the HMD. As such, a freeze is declared when at least two consecutive video frames are identical. The number of freezes counts the freeze events detected in an observed video stream irrespective of the frame length. Further, the freeze intensity as a relative measure of the number of frozen frames with respect to the total number of observed video frames can be defined as
I f = N f N o
where N f denotes the number of frozen video frames and N o is the total number of observed video frames. Because the freeze intensity accumulates the contributions of the four quadrants, (1) can be expressed as
I f = i = 1 4 N f , i i = 1 4 N o , i
where N f , i and N o , i , respectively, denote the number of frozen video frames and total number of observed video frames in the i-th quadrant. In the following, the number of freezes and the freeze intensities measured in this experimental study are reported.
Table 1 shows the number of freezes and freeze intensity that were obtained from the data traces when accumulated over the four quadrants. It can be seen from the table that both measures increase with the increase of the distance from d = 2.5 m to 12.5 m. A further increase of the distance to d = 15 m results in a decrease of the number of freezes and freeze intensity. In this case, the transmitter is moved in the narrower extension of the multi-purpose lecture hall (see Figure 2) which may assist in directing energy residing in the antenna sidelobes toward the room similar as a waveguide.
Figure 7 shows the number of freezes that were detected in the four quadrants for the selected six distances d between transmitter and receiver. No freezes were observed at the distances d = 2.5 m and d = 5 m while only two freezes were detected in Q3 at the distance d = 7.5 m. A further increase of the distance also increases the number of freezes in the quadrants with the highest impact observed in Q3. A reason for the dominance of freezes in Q3 may be attributed to the materials at the different walls of the multi-purpose lecture hall and the more ragged room topology in Q4 compared to Q1 that may influence secondary reflections (see Figure 2). It is also observed that the total number of freezes and the number of freezes associated with Q3 and Q4 reduces with the increase of distance from d = 12.5 m to d = 15 m. This behaviors may also be attributed to the room topology as the transmitter moves into the more narrow extension of the multi-purpose lecture hall at the right-hand side of the floor plan (see Figure 2). It may be conjectured that the narrow extension acts as a waveguide that assists focusing the energy of the mainlobe and sidelobes of the beamforming antenna.
Figure 8 shows the freeze intensities for the different scenarios, i.e., four quadrants and six distances:
I f , i = N f , i N o , i , i = 1 , 2 , 3 , 4
where I f , i denotes the freeze intensity in the i-th quadrant. The highest freeze intensities were observed in Q3 and Q4 for 7.5 m, 10 m, and 15 m and tightly followed by Q3 for 12.5 m. Similar as for the number of freezes, reasons for the observed freeze intensities may be related to the wall materials and room topology. An alternative representation of the number of freezes and freeze intensities subject to the initial azimuthal angle ϕ 0 is provided in Appendix A.

3.2. Histograms

In view of the results obtained for the number of freezes and freeze intensities, in the sequel, the histograms of the freeze length x accumulated over all four quadrants are provided and discussed for the distances d = 10 m, 12.5 m, and 15 m.
The histograms of freeze length shown in Figure 9a–c indicate a few short freezes. The minimum freeze length of x min = 1 , i.e., two subsequent video frames are identical, is observed for the cases of d = 12.5 m and 15 m while x min = 2 is the minimum freeze length for d = 10 m. On the other extreme of large freeze lengths, these are obtained as x = 56 for d = 12.5 m and x = 59 for d = 15 m. Given the minimum freeze length of x min = 1 , the histograms are right-skewed with the respective distributions leaning to the left and the tails being drawn out to the right.
To assess the central tendencies of the freeze length data shown in the histograms, the mean (average value of freeze length), the median (separating the higher from the lower half of freeze lengths), and mode (most frequently occurring freeze length) are shown in Table 2. The standard deviation (SD), skewness, and kurtosis are also provided in the table. Depending on the distance d, the most frequently occurring freeze lengths are 3 to 4 frames while a median freeze length of 5 frames was observed for all distances. The mean varies between 5.0737 and 7.0909 frames depending on the distance d with the related SDs of 2.2467 and 6.0678 indicating higher spread of freeze length values for the larger distances. The asymmetry of the unimodal histogram of freeze length about the mean is minor for the distance d = 10 m with a positive skewness of 0.6938 . Pronounced tails on the right of the histograms develop with increasing distance, i.e., skewness of 3.1341 for d = 12.5 m and 4.1254 for d = 15 m. In view of the statistical modeling of the freeze length characteristics conducted in Section 4, it should be noted that an exponential distribution has a skewness of 2 while geometric and shifted geometric distributions have a skewness greater than or equal to 2. The kurtosis value is largely determined by the tails (outliers) of the histogram of the data [26]. As can be seen from the histograms in Figure 9a–c, the tailedness increases with increased distance. The small sample kurtosis of 0.1249 at d = 10 m characterizes a light tail while the tails become heavier at d = 12.5 m and d = 15 m with significantly larger sample kurtosis of 13.8458 and 24.8990 , respectively. It should be noted that heavier tails are an indication of outliers which, in the context of this work, are due to single occurrences of long freezes.

3.3. Complementary Cumulative Histograms of Freeze Length

Figure 10 shows the CCHs of freeze length observed in the experiments accumulated over the four quadrants. A log-linear presentation is used which is beneficial in revealing exponential and geometric progressions. For small freeze lengths in the range 1 x 6 , the CCHs drop with a similar gradient irrespective of the considered distances. In particular, the linearly decreasing progression of the CCHs for this range of small freeze length indicates an exponential or geometric decay. For medium freeze lengths in the range 7 x 40 , the CCHs also drop approximately exponentially or geometrically but with different gradients depending on the selected distance. The steepest slope and least steep slope are obtained for the distances d = 10 m and d = 12.5 m, respectively. For large freeze lengths in the range 41 x , tails develop in the CCHs for d = 12.5 m, and d = 15 m which are due to single occurrences of long freezes. The above finding about the progression of the CCHs of freeze length being generally comprised of three parts can be explored in the derivation of statistical models including exponential and geometric distributions (see Section 4).
Figure 11 shows the quadrant-specific CCHs of freeze length. It is observed that the quadrants Q1 and Q2 facing the glass wall of the multi-purpose lecture hall experience similar CCHs of freeze length with short tails at most. On the other hand, the quadrants Q3 and Q4 facing the wall mainly composed of wooden panels encounter CCHs of freeze length with well developed tails. In particular, the following CCH progressions are observed:
  • Q1: Similar exponential progressions are observed for distances d = 10 m and d = 12.5 m and an exponential progression with a short tail induced by a single freeze event is observed for distance d = 15 m. Because the freeze lengths are positive integers, it should be noted that the exponential progressions can be described equivalently as geometric progressions (see Section 4).
  • Q2: The CCHs of freeze length show an exponential (or geometric) progression without a tail for all distances.
  • Q3: Exponential (or geometric) progressions are observed for all distances with a transition region with different slopes developing for distances d = 12.5 m and d = 15 m along with tails due to a single freeze occurrence.
  • Q4: An exponential (or geometric) progression of the CCH is observed for the case of d = 10 m without a tail while exponential (or geometric) progressions are observed for d = 12.5 m and d = 15 m accompanied with a small tail and a large tail, respectively, caused by a single freeze occurrence.
In summary, the quadrant-specific CCHs of freeze length span a range of exponential (or geometric) progressions with and without tails depending on the particular quadrant and distance. Apart from similar shifts observed in the respective quadrants, similar initial drops by one order of magnitude can be seen until the freeze length reaches x = 10 . These results also indicate the dominance of the contribution of Q3 and Q4 to the CCHs in Figure 10 for freeze length x 10 .

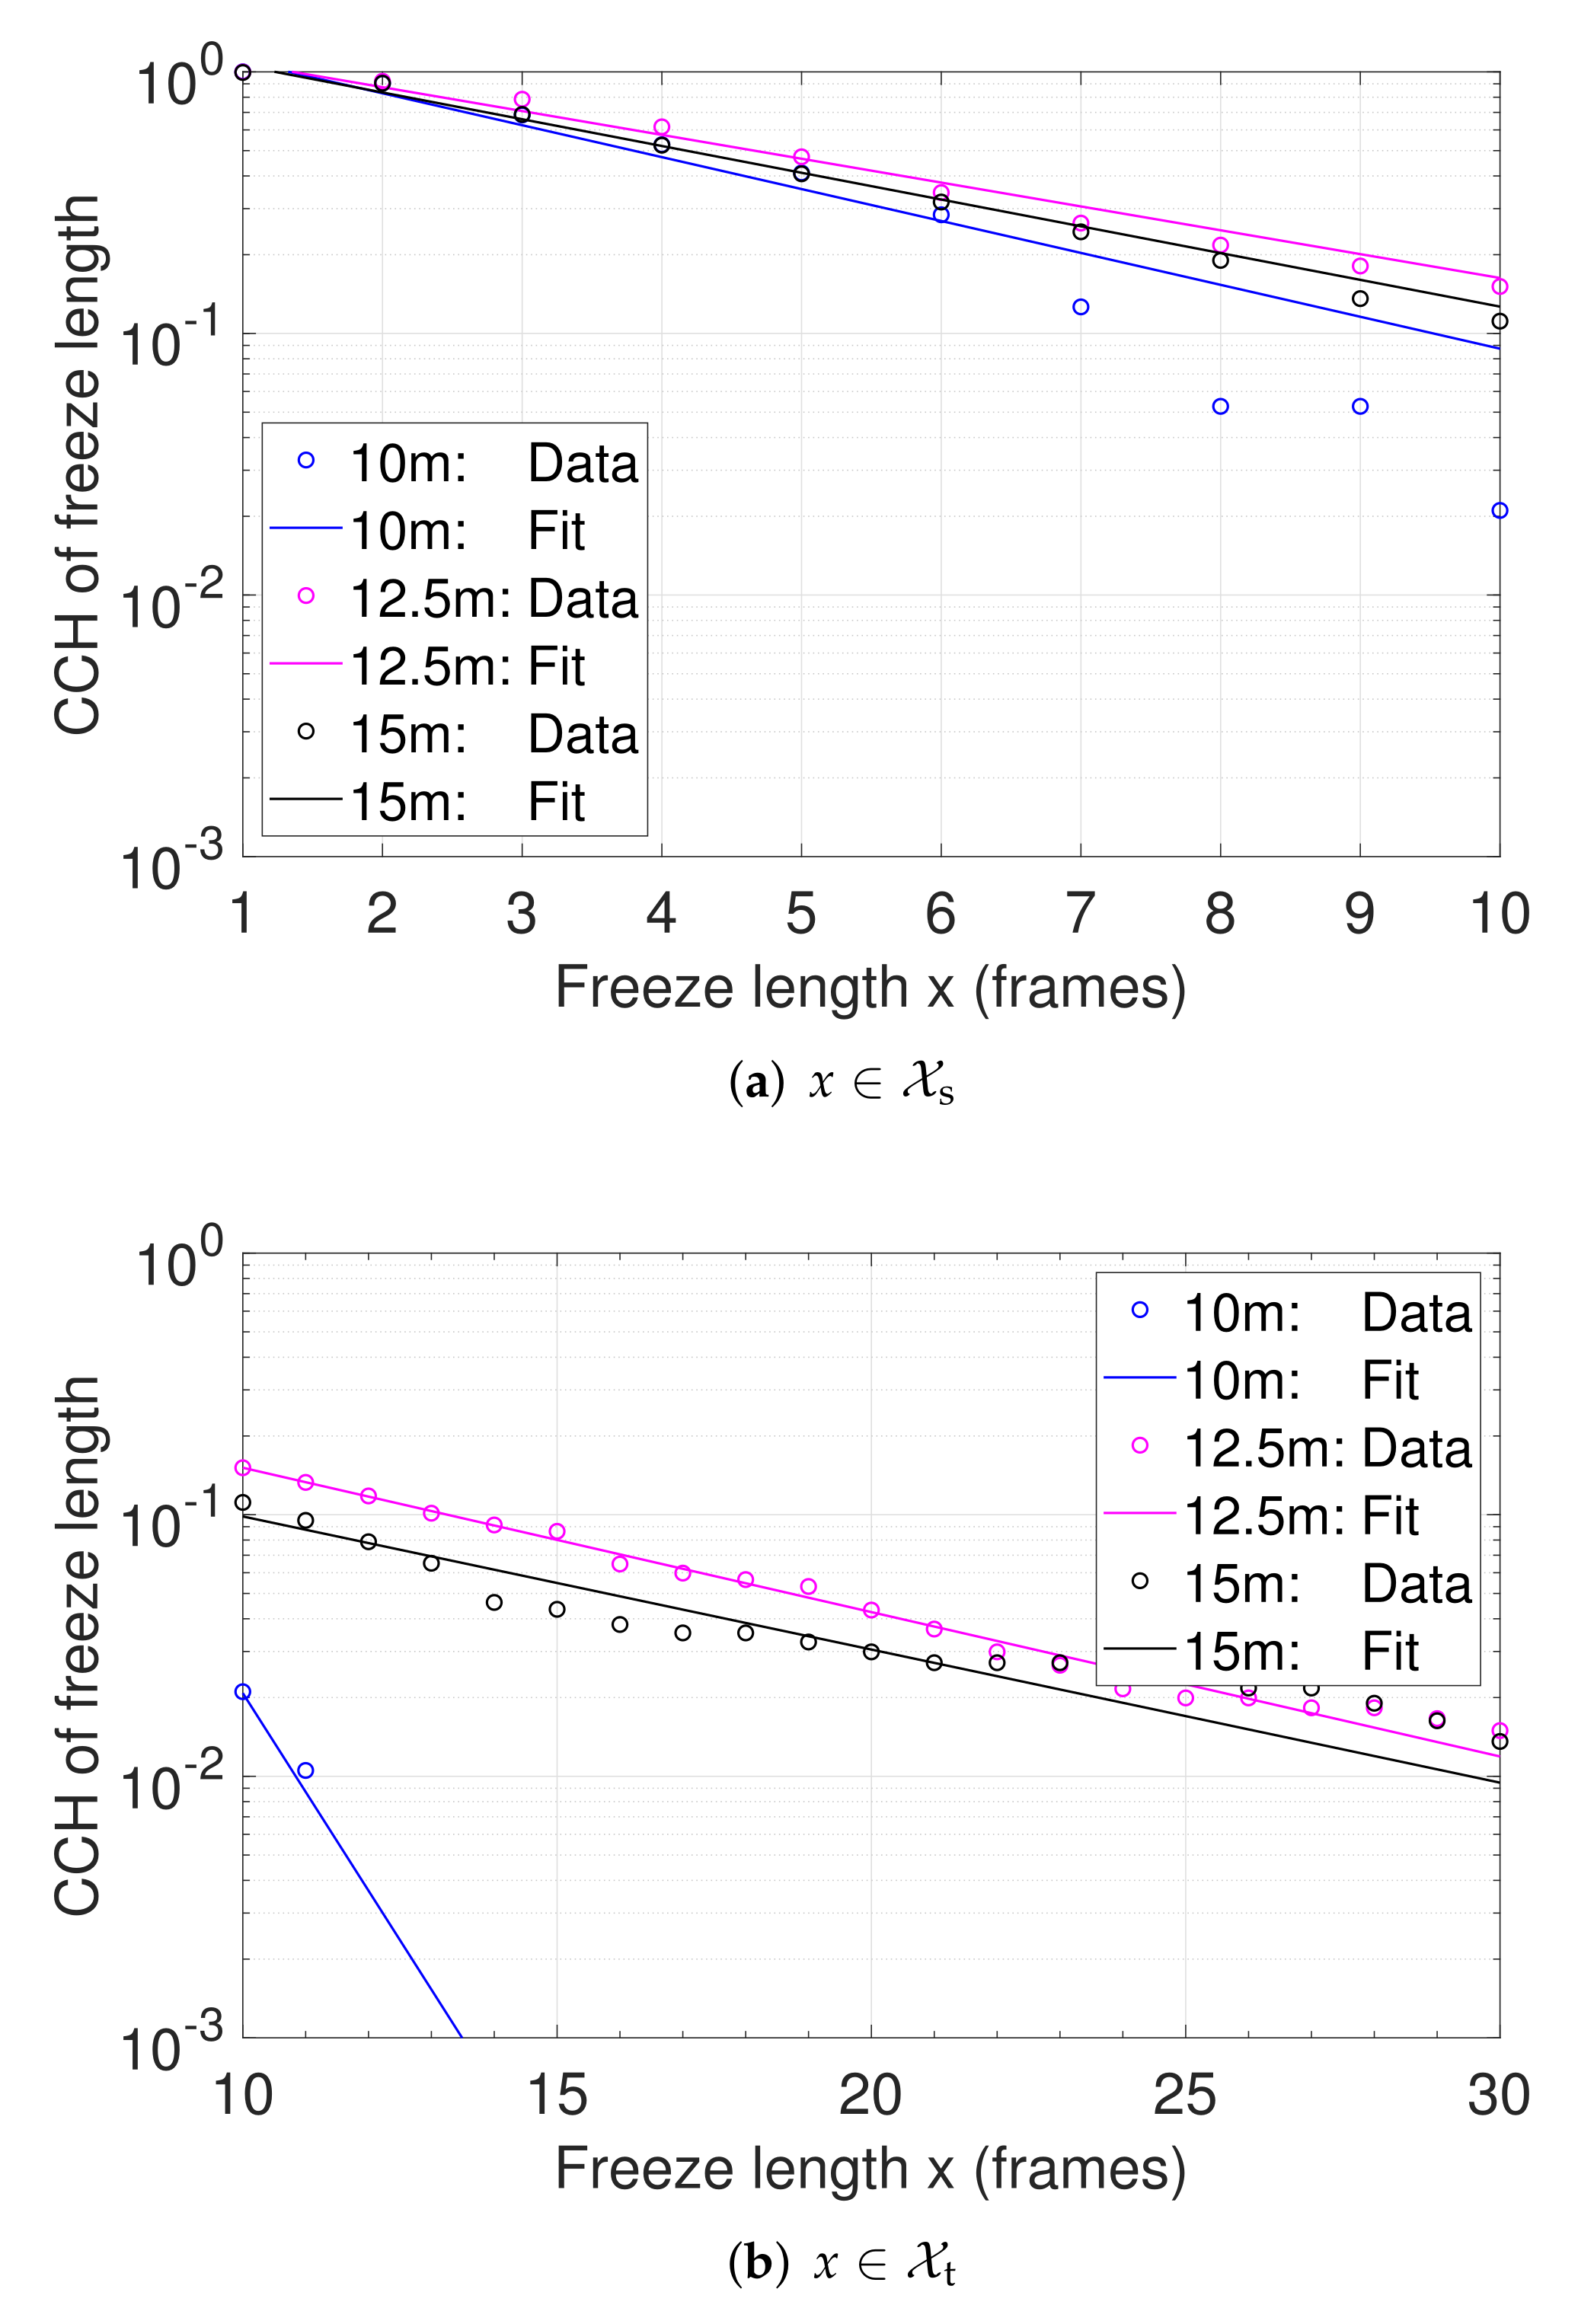
4. Statistical Models of Freeze Length Characteristics

In this section, we derive models of the progressions of the CCHs with increasing freeze length x. While x is a positive integer, the progressions shown in Figure 10 and Figure 11 are exponential, which can also be described equivalently by geometric progressions using a straightforward parameter transformation. We are specifically interested in the parameters of the fittings to the measured data, as they reveal properties, similarities, and differences between the CCHs for the various distances and quadrants.
First, we focus on the domain of shorter freeze lengths x X s = { 1 , , 10 } , for which a steeper exponential or an equivalent geometric progression is observed. Because the minimum value of the freeze length is given as x = 1 , we use the following exponential fitting function to serve as statistical model of the freeze length characteristics:
y s ( x ) = a s exp [ b s ( x 1 ) ]
where the argument of the operator exp [ · ] = e [ · ] is written as an exponent of Euler’s number e, parameter a s scales the exponential function, and a negative parameter b s describes a progression that decays with increasing argument. The fit function of the MATLAB ® Curve Fitting Toolbox T M was used to create the fit to the freeze length data x and to determine the model parameters a s and b s . Because the freeze lengths assume discrete values, the statistical model of the exponential progression in (4) can also be described by a geometric sequence using the following relationship:
y s ( x ) = a s q s ( x 1 )
where q s = exp ( b s ) denotes the so-called common ratio.
Table 3 shows the coefficients of the fitting functions (4) and (5) and the goodness of fit in terms of sum of squared error (SSE), root mean square error (RSME), coefficient of determination R 2 , and adjusted coefficient of determination R a 2 . The results for the different distances are shown accumulated over all quadrants and for each quadrant in which a sufficiently large number of freezes were observed to support a meaningful fitting. The adjusted coefficients of determination of the fits are in the range 0.84 < R a 2 < 0.99 , with the majority of values above 0.95 which indicates a very good fitting performance.
The coefficients a s and b s of the exponential function (4) for the different scenarios in the domain of short freeze lengths X s are obtained in the following ranges:
1.06 < a s < 1.18 and 0.33 < b s < 0.26 for d = 10  m
1.05 < a s < 1.13 and 0.41 < b s < 0.16 for d = 12.5  m
0.98 < a s < 1.09 and 0.29 < b s < 0.18 for d = 15  m
In all cases, the strongest variation of the decay parameter b s among the quadrants appears at distance d = 12.5 m. On the other hand, variations of the decay parameter b s for the distances d = 10 m and d = 15 m are much narrower, indicating similar progressions. It may be conjectured that this characteristic is caused by the room topology (see Figure 2) which shows that the transmitter Tx,v at d = 12.5 m is positioned at the boundary between the open space multi-purpose lecture hall and the right-hand side narrower extension.
Alternatively, considering the geometric sequence models, the common ratio is obtained in the following ranges:
0.72 < q s < 0.77 for d = 10  m
0.66 < q s < 0.86 for d = 12.5  m
0.75 < q s < 0.84 for d = 15  m
Again, the largest variation of the common ratio among the quadrants appears for d = 12.5 m, while the corresponding values for d = 10 m and d = 15 m are much closer to each other, indicating similar shapes. It should be mentioned that the common ratios q s over all quadrants are of a similar order as the values obtained for the pilot measurement campaign in [20], i.e., q = 0.73 for d = 10 m and q = 0.77 for d = 15 m (results for d = 12.5 m were not reported).
The result that most of the scale parameters a s of the models for the short freeze lengths are larger than 1 indicates a shift of the fitting functions toward larger x values, crossing the point ( x = 1 + x 0 , y = 1 ) . In contrast, a fit of a non-shifted exponential or geometric CCH would cross the point ( x = 1 , y = 1 ) representing the discrete freeze length and corresponding maximum CCH value. The actual shift x 0 of a CCH can be obtained as the solution to the following condition:
y s ( 1 + x 0 ) = a s exp [ b s ( x 0 ) ] = 1
which yields
x 0 = 1 b s ln 1 a s
Table 3 shows the shifts x 0 for the different quadrants and distances which assume positive non-integer values 0 < x 0 < 1 with the exception of Q1 for d = 15 m. To comply with the property of a CCH G ( x ) , i.e., 0 G ( x ) 1 , the shift x 0 inherent in the model y s ( x ) in (5), causing the crossing of the point ( x = 1 , y = 1 ) , is accounted for by defining
G ( x ) = min { y s ( x ) , 1 }
Second, we consider the domain of long freeze lengths x X t = { 10 , , 30 } constituting the tails of the freeze length progressions. In particular, tails with slower decays captured within the domain X t compared to domain X s appear for the following cases (see also Figure 10 and Figure 11):
d = 12.5  m:all, Q3, Q4
d = 15  m:all, Q1, Q3, Q4
Table 4 shows the coefficients and common ratio of the exponential and geometric progressions, respective, for the tails of domain X t along with the goodness of fit performance for the following fitting functions:
y t ( x ) = a t exp [ b t ( x 1 ) ] = a t q t ( x 1 )
We observe adjusted coefficients of determination in the range 0.89 < R a 2 < 1.00 which again relates to very good fitting performance. However, in contrast to the short freeze length domain X s , the values of the scale and decay parameters vary widely in the ranges 0.08 < a t < 0.71 and 0.15 < b t < 0.03 , respectively. On the other hand, as a t < 1 , the concept of a shift x 0 is not needed for the modeling of the tails.
To reveal additional insights into the freeze length characteristics associated with the tails, the fitting function (9) may be formulated as compound probability
y t ( x ) = p t · P r ( X > x | L F )
where the probability p t that a long freeze (LF) occurs is given by
p t = a t
Further, the probability P r ( X > x | L F ) that a freeze X > x occurs conditioned on such a freeze being long, is given by
P r ( X > x | L F ) = exp [ b t ( x 1 ) ] = q t ( x 1 )
Let us consider quadrant Q3 for d = 15 m that shows a particularly flat and low tail. The probability that the tail occurs is rather small, i.e., p t = a t 0.088 . However, the corresponding tail decays very slowly: b t 0.039 q t 0.962 , indicating a risk for extraordinary large freeze lengths.
Finally, Figure 12 shows the fittings over all quadrants according to the models formulated in (4) and (9) for freeze lengths in the domains X s and X t , respectively. Given that log-linear plots are used in these figures to capture the large range of values of the exponential relationship, the divergence between data and fitting for increasing freeze length is numerically small while visual inspection may give the impression of a larger difference (see, e.g., Figure 12a for d = 15 m).

5. Summary and Conclusions

This experimental study has provided a statistical analysis and statistical modeling of VR video freeze characteristics measured in a commercial TPCAST wireless VR solution together with an HTC Vive HMD. While bandwidth and latency characteristics have been extensively reported in literature for a variety of testbeds, this experimental study advances on the understanding of temporal disturbances with respect to video freezes and their lengths which both also affect the QoE of networked VR applications. The video freeze assessment has been conducted with respect to four room quadrants, aggregated over all quadrants, and each scenario for six transmitter-receiver distances. The statistical analysis of the measured VR video traces has been performed revealing the number of detected freezes, freeze intensities, histograms, and CCHs of the freeze length. This analysis has been serving as a basis for deriving statistical models capturing the underlying distributions of the freeze length characteristics. The obtained statistical models of the freeze characteristics may be used in wireless VR simulators to support the development of physical layer, medium access layer, and higher layer functionalities. They also may be used to generate realistic freeze events in wireless VR stimuli for VR QoE studies. The statistical results obtained from this experimental study, contributing to answering the two research questions posed in the introduction section, include the following insights:
  • The results obtained from the statistical analysis of the recorded VR traces for the different initial azimuthal angles, transmitter-receiver distances, and the four quadrants illustrate the dependence of the freeze characteristics on the topology of the multi-purpose lecture hall.
  • The number of freezes and freeze intensities commence to increase for distances d > 5 m. The quadrant-specific breakdown of the number of freezes and freeze intensities show also the dependence on the wall materials and room topology.
  • The obtained asymmetric unimodal right-skewed histograms indicate a few short freezes with tails being drawn out to the right. The tailedness of the histograms increases with distance and are induced by single occurrences of very long freezes. The central tendencies of the freeze length data in terms of skewness and kurtosis point to exponential and geometric distributions as basis for statistical modeling of the freeze length characteristics.
  • The quadrant-specific CCHs of freeze length show exponential progressions or corresponding geometric progressions with and without tails depending on the particular quadrant and distance. Similar initial drops by one order of magnitude can be seen for short freeze length x 10 . The results also indicate the dominance of the contribution of quadrants Q3 and Q4 to the CCHs for freeze lengths x 10 .
  • The statistical modeling of the freeze length characteristics returned two exponential functions, one for modeling the domain of short freeze lengths x X s and the other modeling the subsequent domain of larger freeze lengths x X t in the tails. The corresponding equivalent geometric distributions are also provided. A very good fitting performance has been obtained for these models with the majority of the adjusted coefficients of determination of the fits for the considered 21 scenarios being above 0.95.
  • Given that the chosen commercial TPCAST wireless VR solution resorts on beamforming, higher order modulation constellations, and millimeter wave technology in the 60 GHz band, similar as other systems such as WiGig, WirelessHD, 5G, and B5G that target ultra-reliable low latency communications, the results and statistical models may be considered as representative for the freeze characteristics in such settings.
The results of this experimental study on video freeze assessment of a TPCAST wireless VR testbed also suggest some future work that may be pursued as follows:
  • Conduct experimental studies on and performance assessment of temporal impairments in wireless VR solutions for different room topologies such as corridors, lecture theaters of different sizes, offices, and living rooms.
  • Include the statistical models of the freeze characteristics into wireless VR simulators to assist the further development of efficient processing algorithms and protocols on the different layers of existing and future wireless VR systems.
  • Conduct wireless VR QoE studies based on statistical models on freeze characteristics, e.g., generating realistic freeze events in wireless VR stimuli to obtain a ground truths on quality through subjective tests with panels of participants.

Author Contributions

Conceptualization, H.-J.Z., M.F., T.M.C.C. and V.K.; methodology, H.-J.Z., M.F., T.M.C.C. and V.K.; software, V.K., M.F. and T.M.C.C.; validation, V.K., M.F., T.M.C.C. and H.-J.Z.; formal analysis, H.-J.Z., M.F. and T.M.C.C.; investigation, H.-J.Z., M.F., T.M.C.C. and V.K.; data curation, M.F.; writing—original draft preparation, H.-J.Z.; writing—review and editing, H.-J.Z., M.F., T.M.C.C. and V.K.; visualization, H.-J.Z., M.F., T.M.C.C. and V.K.; supervision, H.-J.Z. and M.F.; project administration, H.-J.Z.; funding acquisition, H.-J.Z. All authors have read and agreed to the published version of the manuscript.

Funding

This research was funded in part by The Knowledge Foundation, Sweden, through the ViaTecH project (Contract 20170056).

Institutional Review Board Statement

Not applicable.

Informed Consent Statement

Not applicable.

Data Availability Statement

The data presented in this study are available on request.

Conflicts of Interest

The authors declare no conflict of interest.

Abbreviations

The following abbreviations are used in this manuscript:
5GFifth generation
6GSixth generation
APAccess point
ARAugmented reality
B5GBeyond fifth generation
BPSKBinary phase shift keying
CCHComplementary cumulative histogram
HDHigh definition
HDMIHigh definition multimedia interface
HMDHead-mounted display
ICTInformation and communication technology
IPInternet protocol
IRInfrared
MRMixed reality
MTPMotion-to-photon
MU-MIMOMulti-user multiple-input multiple-output
PCPersonal computer
PDFProbability density function
QAMQuadrature amplitude modulation
QoEQuality of experience
QPSKQuadrature phase shift keying
ROGRepublic of gamers
SNRSignal-to-noise ratio
USBUniversal serial bus
VRVirtual reality
WLANWireless local area network

Appendix A. Number of Freezes and Freeze Intensities for Each Quadrant per Experiment

The measurement campaign was organized in 24 experiments, i.e., four initial azimuthal angles ϕ 0 and six distances d. In view of the full-swivel chair rotational movement pattern shown in Figure 6, each quadrant is accessed twice once all four initial azimuthal angles ϕ 0 have been used. In case of ϕ = 0 and ϕ = 90 , for example, quadrants Q1 and Q4, and Q1 and Q2 are covered, respectively. The values provided in Figure 7 and Figure 8 represent the total amounts accumulated over the respective two instances covering each quadrant.
Alternatively, Table A1 and Table A2, respectively, show the number of freezes and freeze intensities for each quadrant subject to the initial azimuthal angle ϕ 0 and different distances d. This more detailed information provides insights into the impact of the turning direction on the number of freezes and freeze intensities. For example, the number of freezes measured in quadrant Q3 is higher for an initial azimuthal angle ϕ 0 = 180 compared to ϕ 0 = 270 .
Table A1. Contributions to the number of freezes for each quadrant per experiment, described by initial azimuthal angle ϕ 0 and distance d.
ϕ 0 90°180°270°
d [m]Q1Q4Q2Q1Q3Q2Q4Q3
2.5 00000000
5.0 00000000
7.5 00002000
10.0 41700361632
12.5 41501742032083124
152142471089473480
Table A2. Contributions to the freeze intensities for each quadrant per experiment, described by initial azimuthal angle ϕ 0 and distance d.
ϕ 0 90°180°270°
d [m]Q1Q4Q2Q1Q3Q2Q4Q3
2.5 00000000
5.0 00000000
7.5 0000 2.5 · 10 4 000
10.0 5.3 · 10 4 3.0 · 10 3 00 6.4 · 10 3 1.0 · 10 4 1.0 · 10 3 7.0 · 10 3
12.5 5.4 · 10 4 5.9 · 10 2 7.4 · 10 4 4.8 · 10 3 4.8 · 10 2 3.5 · 10 3 2.3 · 10 3 2.9 · 10 2
15.0 5.1 · 10 3 1.6 · 10 2 1.5 · 10 2 2.3 · 10 3 2.3 · 10 2 1.2 · 10 2 7.0 · 10 3 2.1 · 10 2

References

  1. Huawei iLab. Cloud VR Network Solution White Paper; Huawei Technologies Co., Ltd.: Shenzhen, China, 2018. [Google Scholar]
  2. TPCAST. TPCAST Business Edition; TPCAST: Amsterdam, The Netherlands, 2017. [Google Scholar]
  3. IEEE 802. IEEE P802.11 Task Group BE (EHT) Meeting Update. Available online: http://www.ieee802.org/11/Reports/tgbe_update.htm (accessed on 25 September 2021).
  4. Hansen, C.J. WiGig: Multi-gigabit Wirless Communications in the 60 GHz Band. IEEE Wirel. Commun. 2011, 18, 6–7. [Google Scholar] [CrossRef]
  5. IEEE. IEEE Std 802.11ad-2012 (Amendment to IEEE Std 802.11-2012, as amended by IEEE Std 802.11ae-2012 and IEEE Std 802.11aa-2012; IEEE Standard for Information Technology–Telecommunications and Information Exchange Between Systems–Local and Metropolitan Area Networks–Specific Requirements—Part 11: Wireless LAN Medium Access Control (MAC) and Physical Layer (PHY) Specifications Amendment 3: Enhancements for Very High Throughput in the 60 GHz Band. IEEE: New York, NY, USA, 2012; pp. 1–628.
  6. Ghasempour, Y.; da Silva, C.R.C.M.; Cordeiro, C.; Knightly, E.W. IEEE 802.11ay: Next-Generation 60 GHz Communication for 100 Gb/s Wi-Fi. IEEE Commun. Mag. 2017, 55, 186–192. [Google Scholar] [CrossRef]
  7. WirelessHD. Overview of WirelessHD Specification Version 1.1; Broadcom Co.: San Jose, CA, USA; Intel Co.: San Francisco, CA, USA; LG Electronics Inc.: Seoul, South Korea; NEC Co.: Tokyo, Japan; Panasonic Co.: Osaka, Japan; Royal Philips Electronics: Amsterdam, The Netherlands; Samsung Electronics Co. LTD: Suwon, South Korea; SiBEAM Inc.: Sunnyvale, CA, USA; Sony Co.: Tokyo, Japan; Toshiba Co.: Tokyo, Japan, 2010. [Google Scholar]
  8. Yrjölä, S.; Ahokangas, P.; Matinmikko-Blue, M. (Eds.) White Paper on Business of 6G. (6G Research Visions, No. 3); University of Oulu: Oulu, Finland, 2020. [Google Scholar]
  9. Sun, L.; Duanmu, F.; Liu, Y.; Wang, Y.; Ye, Y.; Shi, H.; Dai, D. Multi-Path Multi-Tier 360-Degree Video Streaming in 5G Networks. In Proceedings of the ACM Multimedia Systems Conference, Amsterdam, The Netherlands, 12–15 June 2018; pp. 162–173. [Google Scholar]
  10. Aggarwal, S.; Thirumurugan, A.; Koutsonikolas, D. A First Look at 802.11ad Performance on a Smartphone. In Proceedings of the ACM Workshop on Millimeter-Wave Networks and Sensing Systems, Los Cabos, Mexico, 25 October 2019; pp. 13–18. [Google Scholar]
  11. Aggarwal, S.; Ghoshal, M.; Banerjee, P.; Koutsonikolas, D. An Experimental Study of the Performance of IEEE 802.11ad in Smartphones. Comput. Commun. 2021, 169, 220–231. [Google Scholar] [CrossRef]
  12. Aggarwal, S.; Kong, Z.; Ghoshal, M.; Hu, Y.C.; Koutsonikolas, D. Throughput Prediction on 60 GHz Mobile Devices for High-Bandwidth, Latency-Sensitive Applications. In Passive and Active Measurement; Hohlfeld, O., Lutu, A., Levin, D., Eds.; Springer International Publishing: New York, NY, USA, 2021; pp. 513–528. [Google Scholar]
  13. Kim, S.; Yun, J.H. Motion-Aware Interplay Between WiGig and WiFi for Wireless Virtual Reality. Sensors 2020, 20, 6782. [Google Scholar] [CrossRef] [PubMed]
  14. Li, Y.C.; Hsu, C.H.; Lin, Y.C.; Hsu, C.H. Performance Measurements on a Cloud VR Gaming Platform. In Proceedings of the ACM Workshop on Quality of Experience in Visual Multimedia Applications, Seattle, WA, USA, 12–16 October 2020; pp. 1–9. [Google Scholar]
  15. Huang, C.Y.; Huang, Y.L.; Chi, Y.H.; Chen, K.T.; Hsu, C.H. To Cloud or Not to Cloud: Measuring the Performance of Mobile Gaming. In Proceedings of the ACM Workshop on Mobile Gaming, Florence, Italy, 18–20 May 2015; pp. 19–24. [Google Scholar]
  16. Huang, C.Y.; Hsu, C.H.; Chang, Y.C.; Chen, K.T. GamingAnywhere: An Open Cloud Gaming System. In Proceedings of the ACM Multimedia Systems Conference, Oslo, Norway, 28 February–1 March 2013; pp. 36–47. [Google Scholar]
  17. Zhong, R.; Wang, M.; Chen, Z.; Liu, L. On Building a Programmable Wireless High-Quality Virtual Reality System Using Commodity Hardware. In Proceedings of the ACM Asia-Pacific Workshop on Systems, Mumbai, India, 2–3 September 2017; pp. 1–7. [Google Scholar]
  18. Liu, L.; Zhong, R.; Zhang, W.; Liu, Y.; Zhang, J.; Zhang, L.; Gruteser, M. Cutting the Cord: Designing a High-Quality Untethered VR System With Low Latency Remote Rendering. In Proceedings of the ACM International Conference on Mobile Systems, Applications, and Services, Munich, Germany, 10–15 June 2018; pp. 68–80. [Google Scholar]
  19. Kelkkanen, V.; Fiedler, M. A Test-bed for Studies of Temporal Data Delivery Issues in a TPCAST Wireless Virtual Reality Set-up. In Proceedings of the International Telecommunication Networks and Applications Conference, Sydney, Australia, 21–23 November 2018; pp. 1–3. [Google Scholar]
  20. Fiedler, M.; Zepernick, H.J.; Kelkkanen, V. Network-Induced Temporal Disturbances in Virtual Reality Applications. In Proceedings of the International Conference on Quality of Multimedia Experience, Berlin, Germany, 5–7 June 2019; pp. 1–3. [Google Scholar]
  21. Dumic, E.; Bjelopera, A. No-Reference Objective Video Quality Measures for Frame Freezing Degradation. Sensors 2019, 19, 4655. [Google Scholar] [CrossRef] [PubMed] [Green Version]
  22. Martinez, H.B.; Hines, A.; Faria, M.C.Q. Perception Quality of Audio-Visual Content with Common Video and Audio Degradations. Appl. Sci. 2021, 11, 5813. [Google Scholar] [CrossRef]
  23. TÜV Rheinland. In FCC/IC Test Report—PC Transmitter; Test Report 50088174001; TÜV Rheinland: Cologne, Germany, 2017.
  24. Steam®. SteamVR Home Screen. 2019. Available online: https://store.steampowered.com/app/250820/SteamVR/ (accessed on 20 December 2021).
  25. Elwardy, M.; Zepernick, H.J.; Hu, Y. On Head Movements in Repeated 360 Video Quality Assessment for Standing and Seated Viewing on Head Mounted Displays. In Proceedings of the IEEE Conference on Virtual Reality and 3D User Interfaces Abstracts and Workshops, Lisbon, Portugal, 27 March–1 April 2021; pp. 71–74. [Google Scholar]
  26. Westfall, P.H. Kurtosis as Peakedness, 1905–2014. R.I.P. Am. Stat. 2014, 68, 191–195. [Google Scholar] [CrossRef] [PubMed] [Green Version]
Figure 1. Multi-purpose lecture hall with the transmitter (foreground) which is moved to six different distances away from the receiver (background) during the measurement campaign.
Applsci 12 01733 g001
Figure 2. Floor plan of the multi-purpose lecture hall including placement of the measurement equipment and introducing a room partitioning into quadrants around the receiver (Tx,v: Transmitter of the 60 GHz video link; Rx,v: Receiver of the 60 GHz video link; Q1-4: Quadrants; IR: Infrared; HMD: Head-mounted display).
Applsci 12 01733 g002
Figure 3. Block diagram of the TPCAST wireless VR testbed (Tx,v: Transmitter of the 60 GHz video link, Rx,v: Receiver of the 60 GHz video link, Tx,c: Transmitter of the 5 GHz control link, Rx,c: Receiver of the 5 GHz control link).
Applsci 12 01733 g003
Figure 4. Hardware components of the TPCAST wireless VR testbed: (a) Transmitter and IR tracking (top) and server along with operators (right), (b) HMD holding the TPCAST receiver and splitter mounted on the full-swivel chair, (c) Monitoring equipment (top) and full-swivel chair placement (bottom).
Applsci 12 01733 g004
Figure 5. Example traces produced by the monitoring: (a) Excerpt of the text trace obtained for a transmitter-receiver distance of d = 7.5 m and 270 initial HMD direction (first column: frame number; second column: measured inter-frame time in micro-seconds ( 11169 μ s relating to a nominal frame rate of 89.53 fps); third column: flow indicator (0 = freeze, 1 = no freeze), (b) Video trace sample of “SteamVR home screen” [24] given as screenshot of the first frozen frame, here frame number 3474 with HMD residing in Q3.
Applsci 12 01733 g005
Figure 6. Definition of full-swivel chair rotational movement pattern in terms of initial azimuthal angle and covered quadrants: (a) ϕ 0 = 0 covering Q1 and Q4, (b) ϕ 0 = 90 covering Q2 and Q1, (c) ϕ 0 = 180 covering Q3 and Q2, (d) ϕ 0 = 270 covering Q4 and Q3.
Applsci 12 01733 g006
Figure 7. Number of freezes detected in the four quadrants for different distances between transmitter and receiver.
Applsci 12 01733 g007
Figure 8. Freeze intensities observed in each quadrant for the different distances.
Applsci 12 01733 g008
Figure 9. Histograms of freeze length x measured in frames for different transmitter-receiver distances.
Applsci 12 01733 g009
Figure 10. CCH of freeze length accumulated over the four quadrants.
Applsci 12 01733 g010
Figure 11. CCH of freeze length observed in the four quadrants.
Applsci 12 01733 g011
Figure 12. Fitting functions over all quadrants for different distances d: (a) Short freeze lengths x X s , (b) Long freeze lengths x X t .
Applsci 12 01733 g012
Table 1. Number of freezes and freeze intensity accumulated over all quadrants.
d [m]Number of Freezes N f Freeze Intensity I f
2.500
5.000
7.52 1.1 · 10 5
1096 2.3 · 10 3
12.5605 2.1 · 10 2
15307 1.3 · 10 2
Table 2. Measures of central tendency of freeze lengths in number of frames.
d [m]MeanMedianModeSDSkewnessKurtosis
105.0737532.24670.69380.1249
12.57.0909546.06783.134113.8458
156.3659535.81594.125424.8990
Table 3. Coefficients of the models for short freeze lengths x X s .
d [m]Q a s b s q s x 0 SSERMSE R 2 R a 2
10all 1.0966 0.2810 0.7550 0.3279 0.04940.07860.95830.9531
Q1 1.1752 0.2794 0.7562 0.5778 0.22340.16710.86300.8459
Q3 1.1096 0.2648 0.7674 0.3928 0.06890.09280.94300.9363
Q4 1.0651 0.3258 0.7219 0.1791 0.03820.06910.96560.9613
12.5all 1.0777 0.2099 0.8107 0.3562 0.02050.05070.97720.9744
Q1 1.1283 0.4065 0.6660 0.2971 0.10320.11360.92700.9179
Q2 1.0879 0.2206 0.8020 0.3820 0.04420.07430.95640.9509
Q3 1.0792 0.2504 0.7785 0.3043 0.02720.05830.97330.9700
Q4 1.0594 0.1606 0.8517 0.4874 0.01830.04790.97520.9721
15all 1.0557 0.2357 0.7901 0.2301 0.01080.03670.98810.9866
Q1 0.9857 0.2854 0.7517 0.0505 0.01490.04320.98120.9788
Q2 1.0847 0.1815 0.8340 0.4479 0.03240.06370.96240.9577
Q3 1.0584 0.2796 0.7561 0.2031 0.01580.04440.98420.9822
Q4 1.0467 0.2218 0.8011 0.3028 0.01820.04780.97950.9770
Table 4. Coefficients of the models for long freeze lengths x X t in the tails.
d [m]Q a t b t q t SSERMSE R 2 R a 2
12.5all 0.4745 0.1271 0.8807 0.0002 0.0030 0.9950 0.9947
Q3 0.3432 0.1472 0.8631 0.0002 0.0035 0.9820 0.9810
Q4 0.7009 0.1140 0.8923 0.0015 0.0088 0.9847 0.9839
15all 0.2827 0.1172 0.8894 0.0012 0.0080 0.9108 0.9061
Q1 0.3326 0.1280 0.8799 0.0002 0.0035 0.9820 0.9810
Q3 0.0883 0.0389 0.9618 0.0002 0.0035 0.9018 0.8966
Q4 0.5689 0.1337 0.8749 0.0019 0.0099 0.9587 0.9565
Publisher’s Note: MDPI stays neutral with regard to jurisdictional claims in published maps and institutional affiliations.

