
Patent Analysis Using Bayesian Data Analysis and Network Modeling


Abstract
:1. Introduction
2. Patent Data Analysis
3. Proposed Method
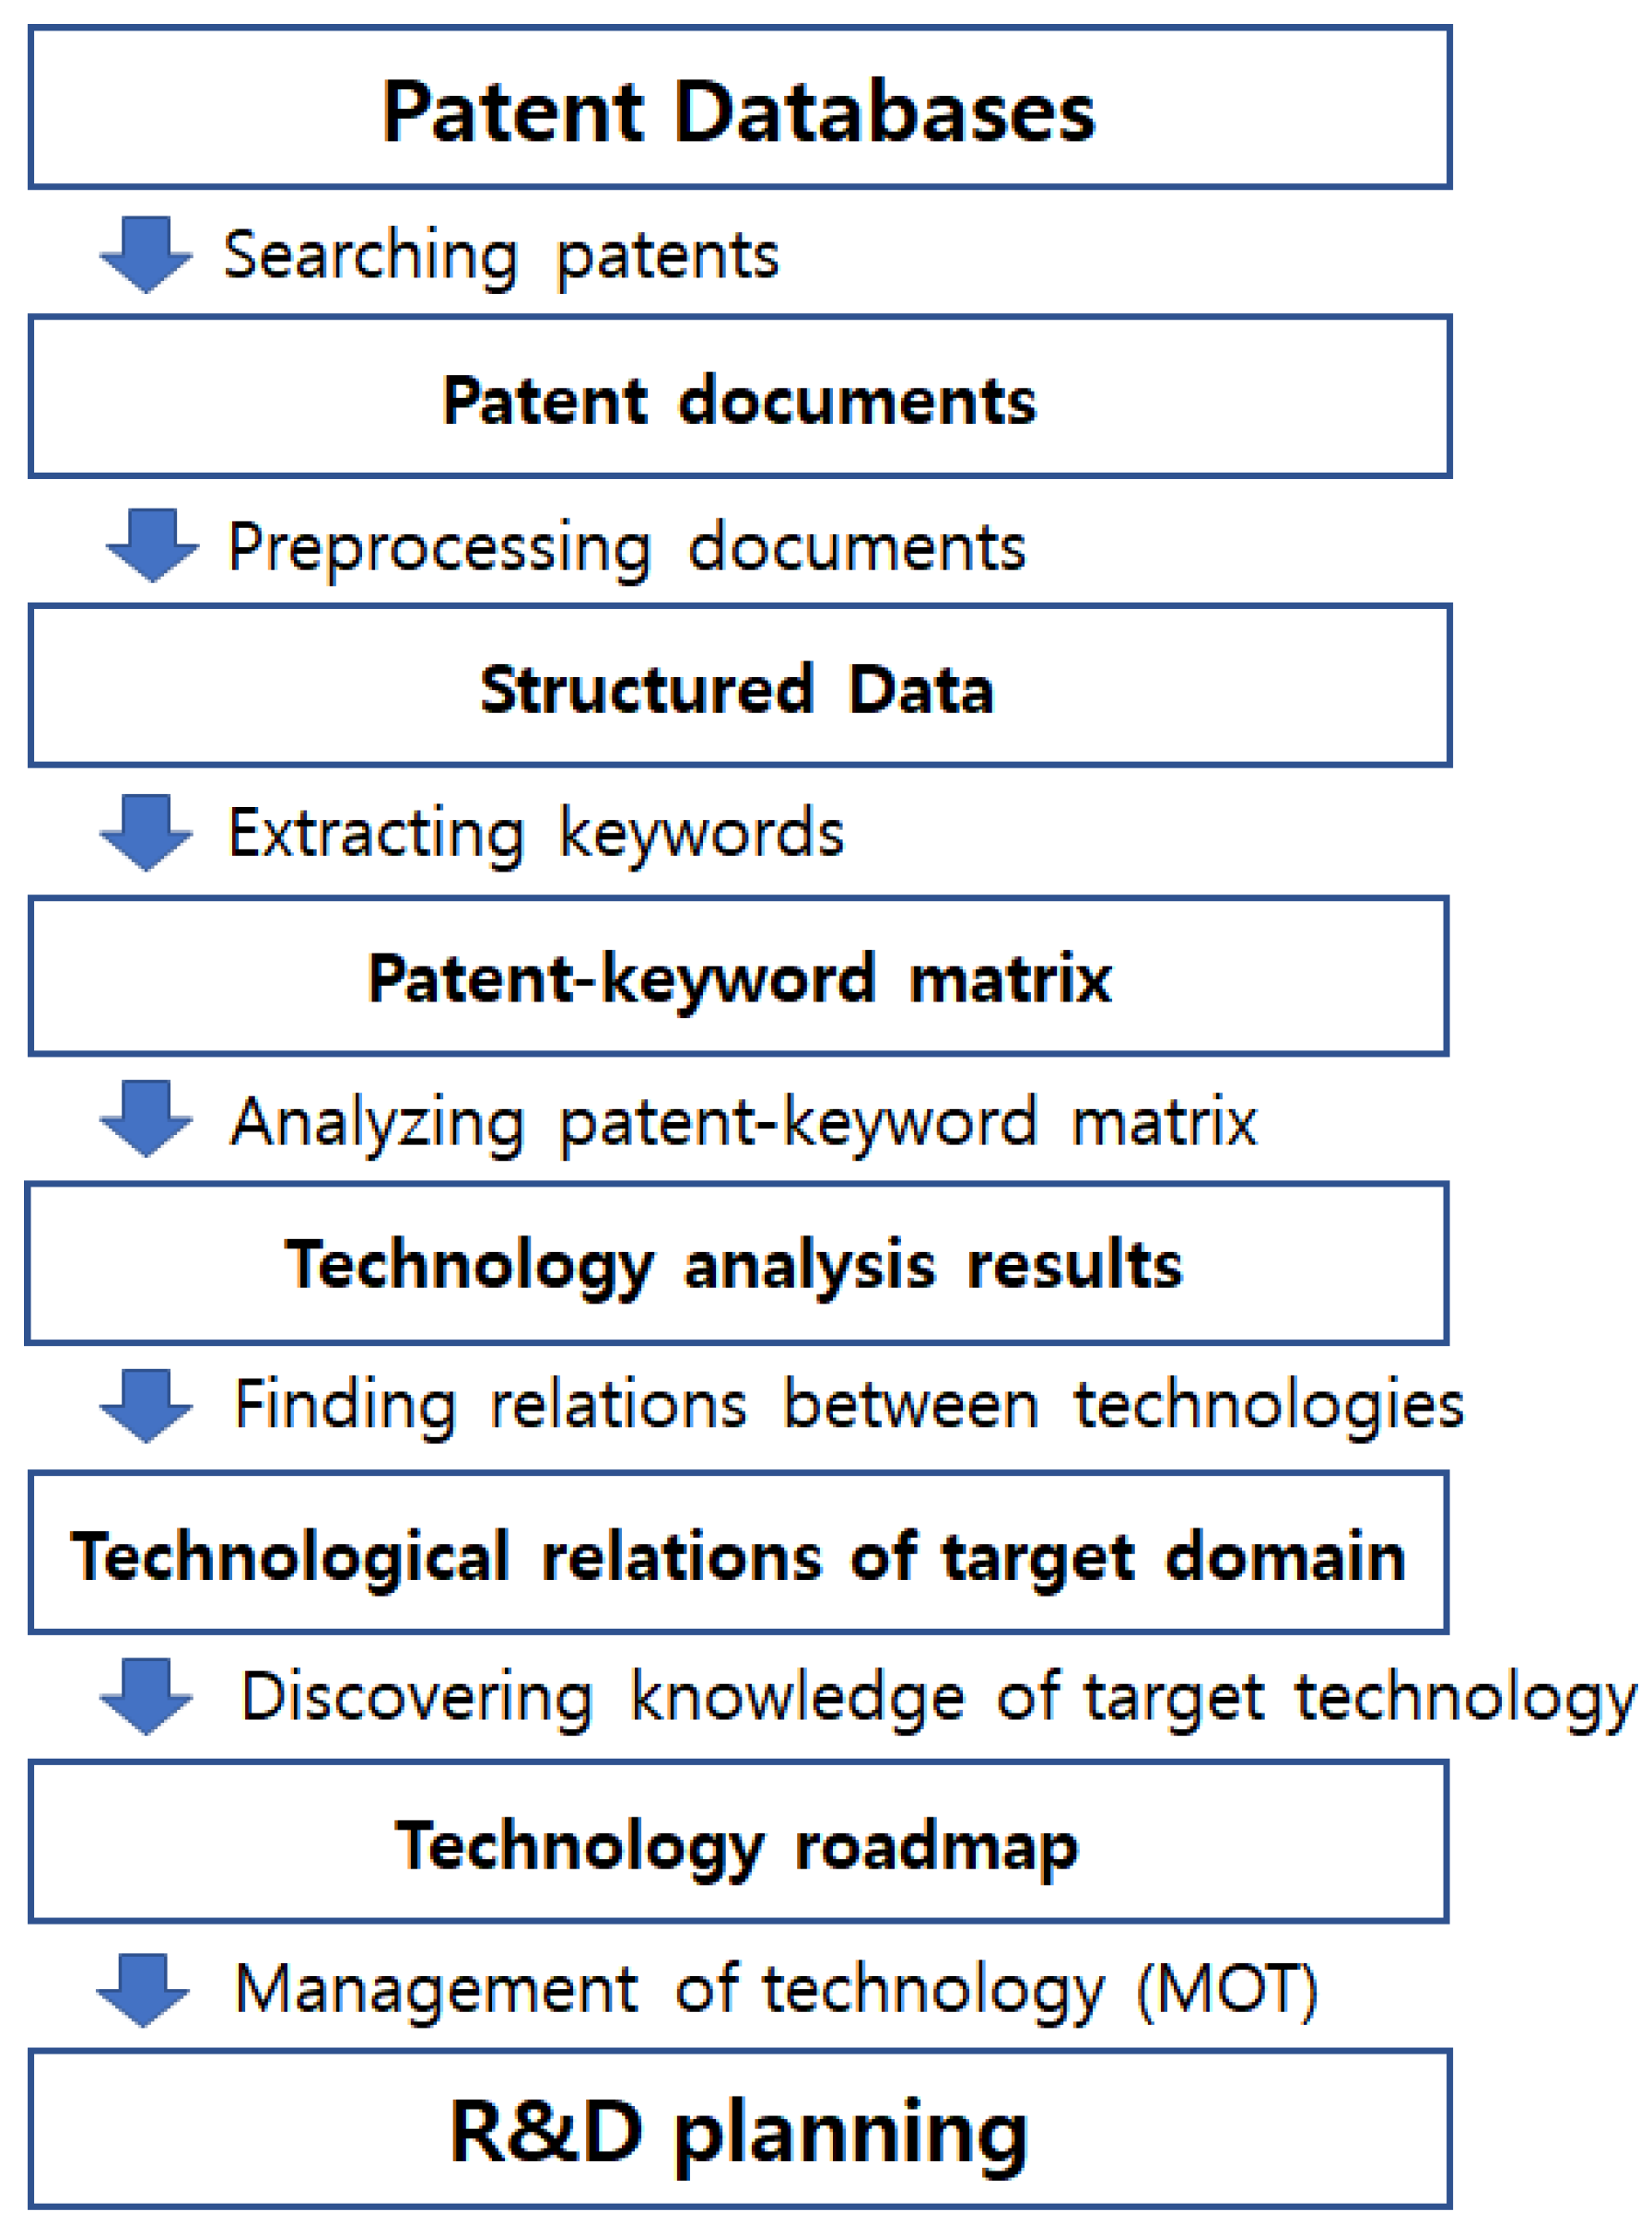
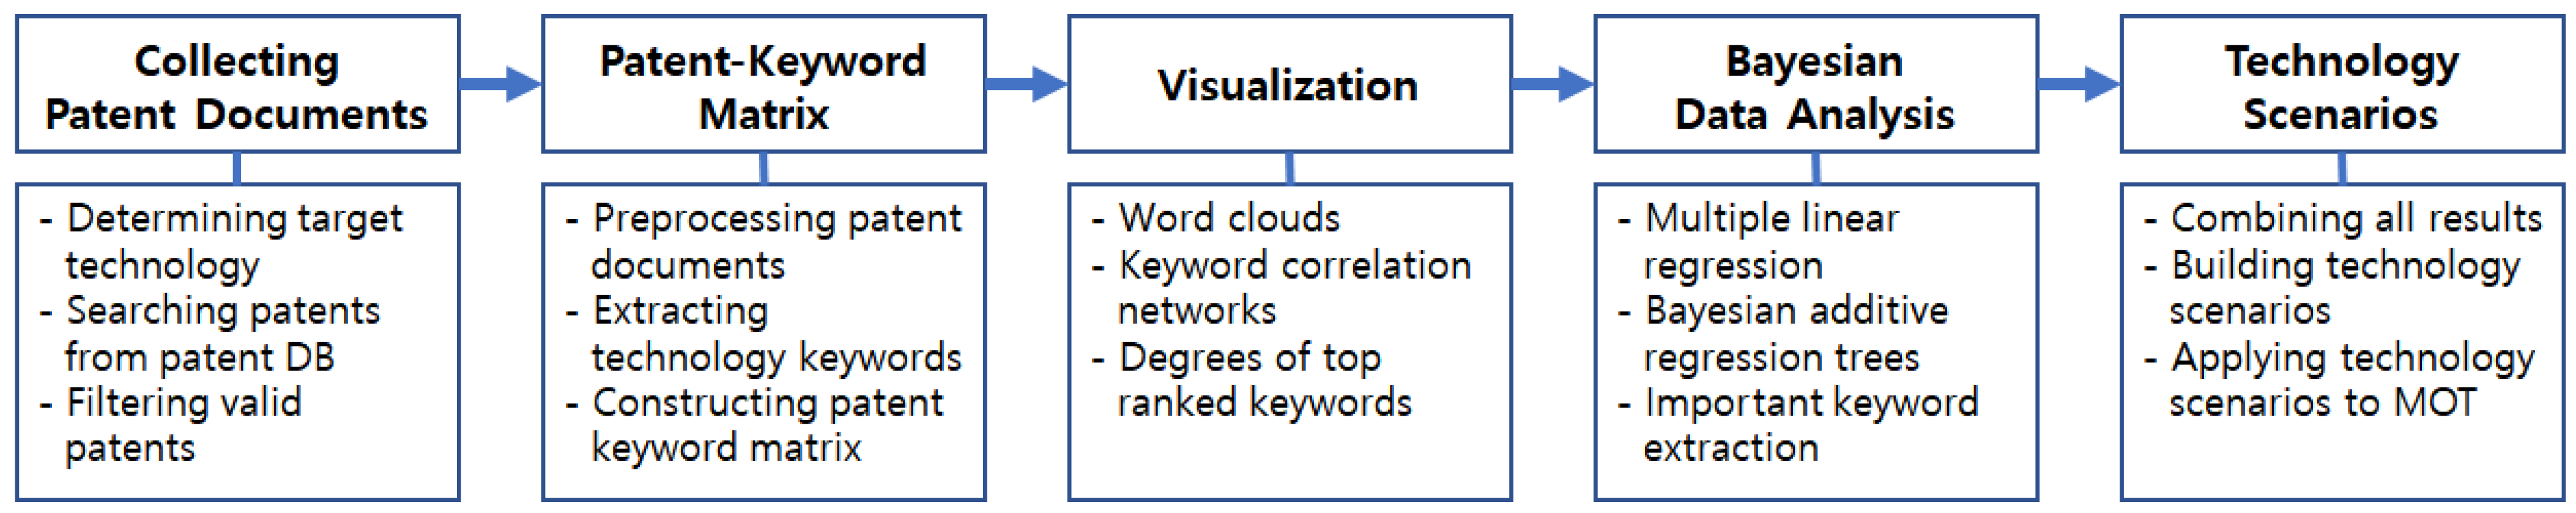
3.1. Technical Analysis Procedure
- (Step 1)
- Collecting Drone Patent Documents
- (1-1)
- Searching patent documents related to drone technology from patent databases.
- (1-2)
- Removing noise from searched patent documents to select valid patents.
- (Step 2)
- Preprocessing Valid Patent Data
- (2-1)
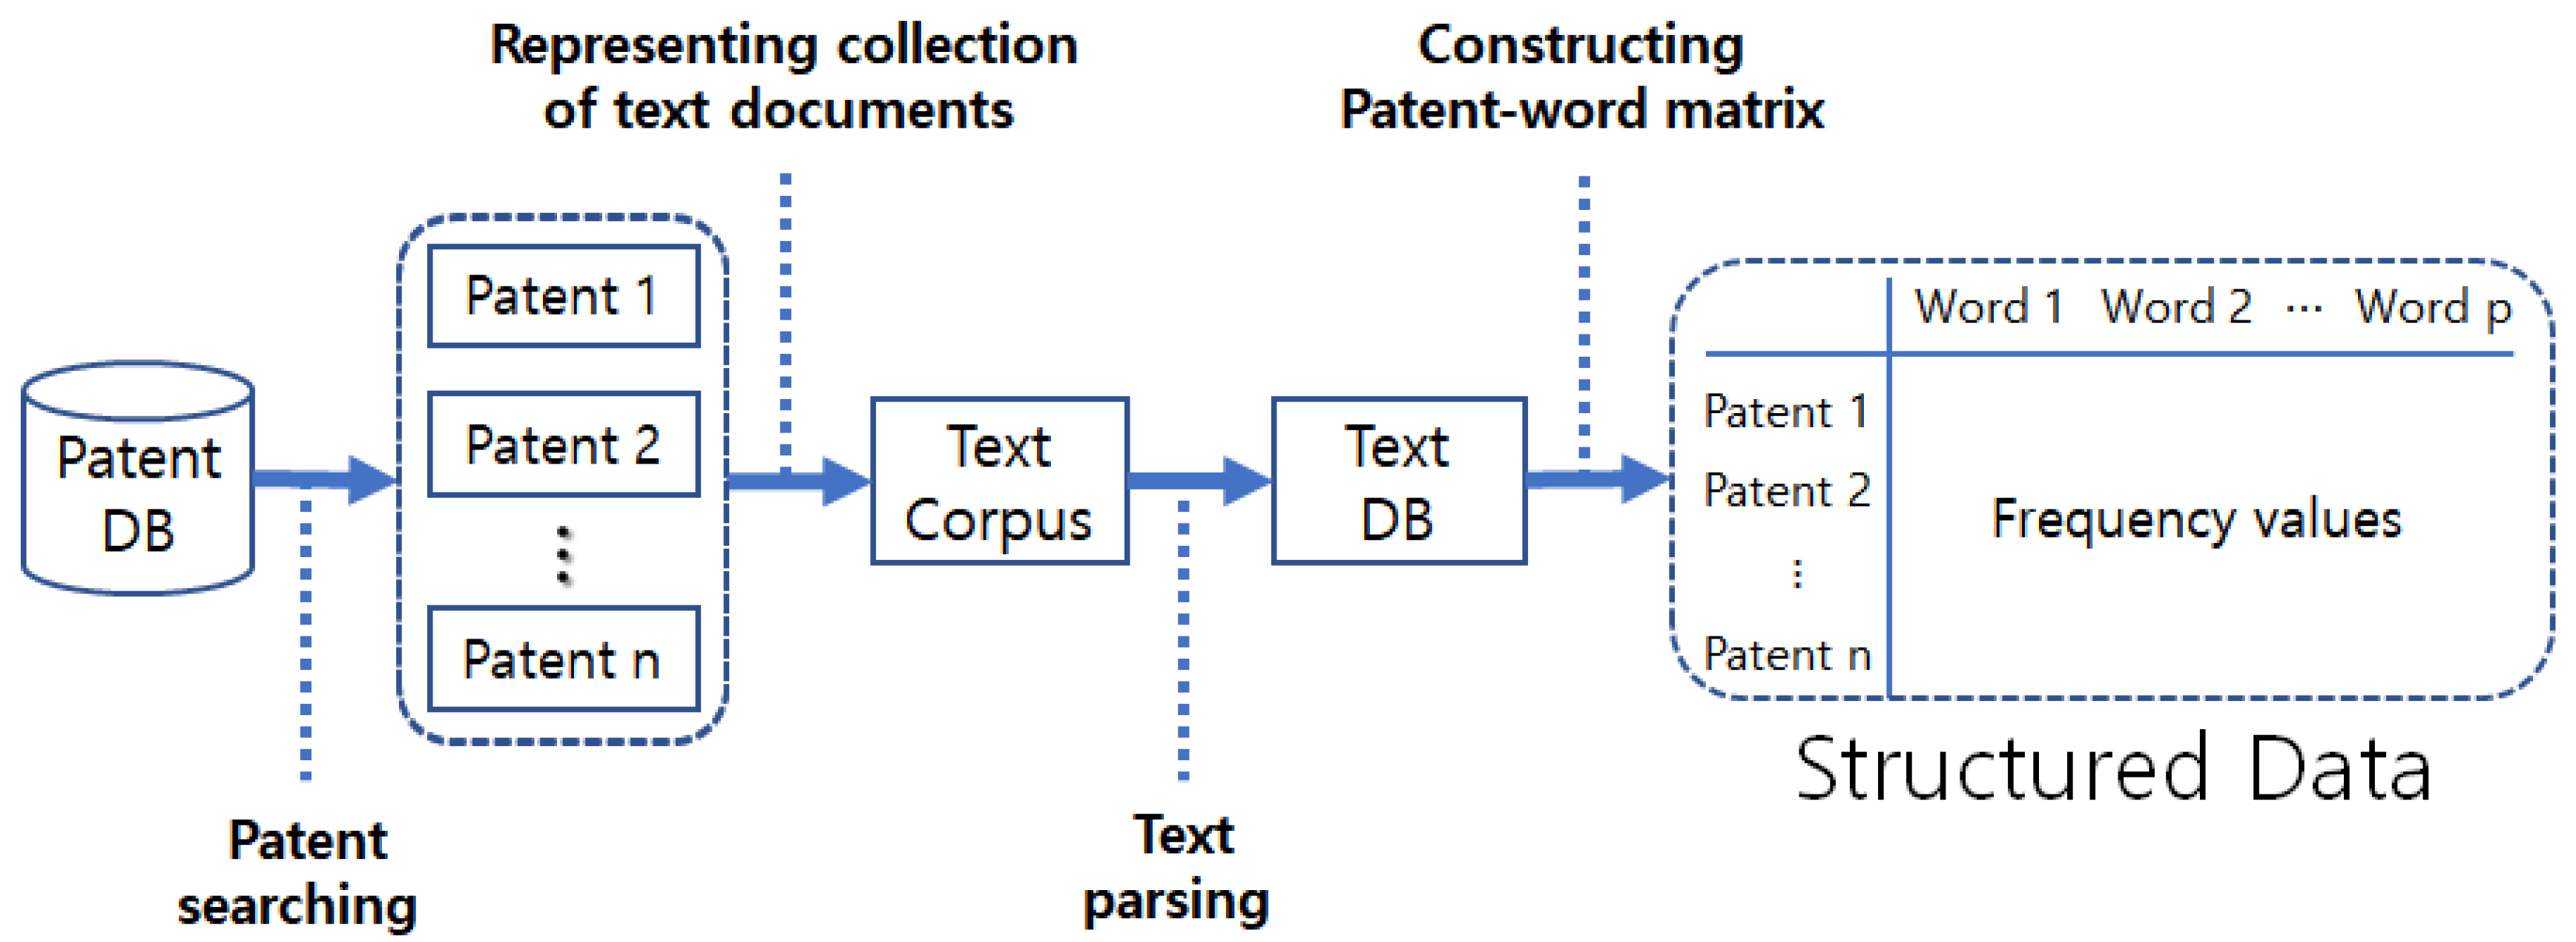
- Representing collection of text documents from valid patent data.
- (2-2)
- Parsing text collection to build text database (DB).
- (2-3)
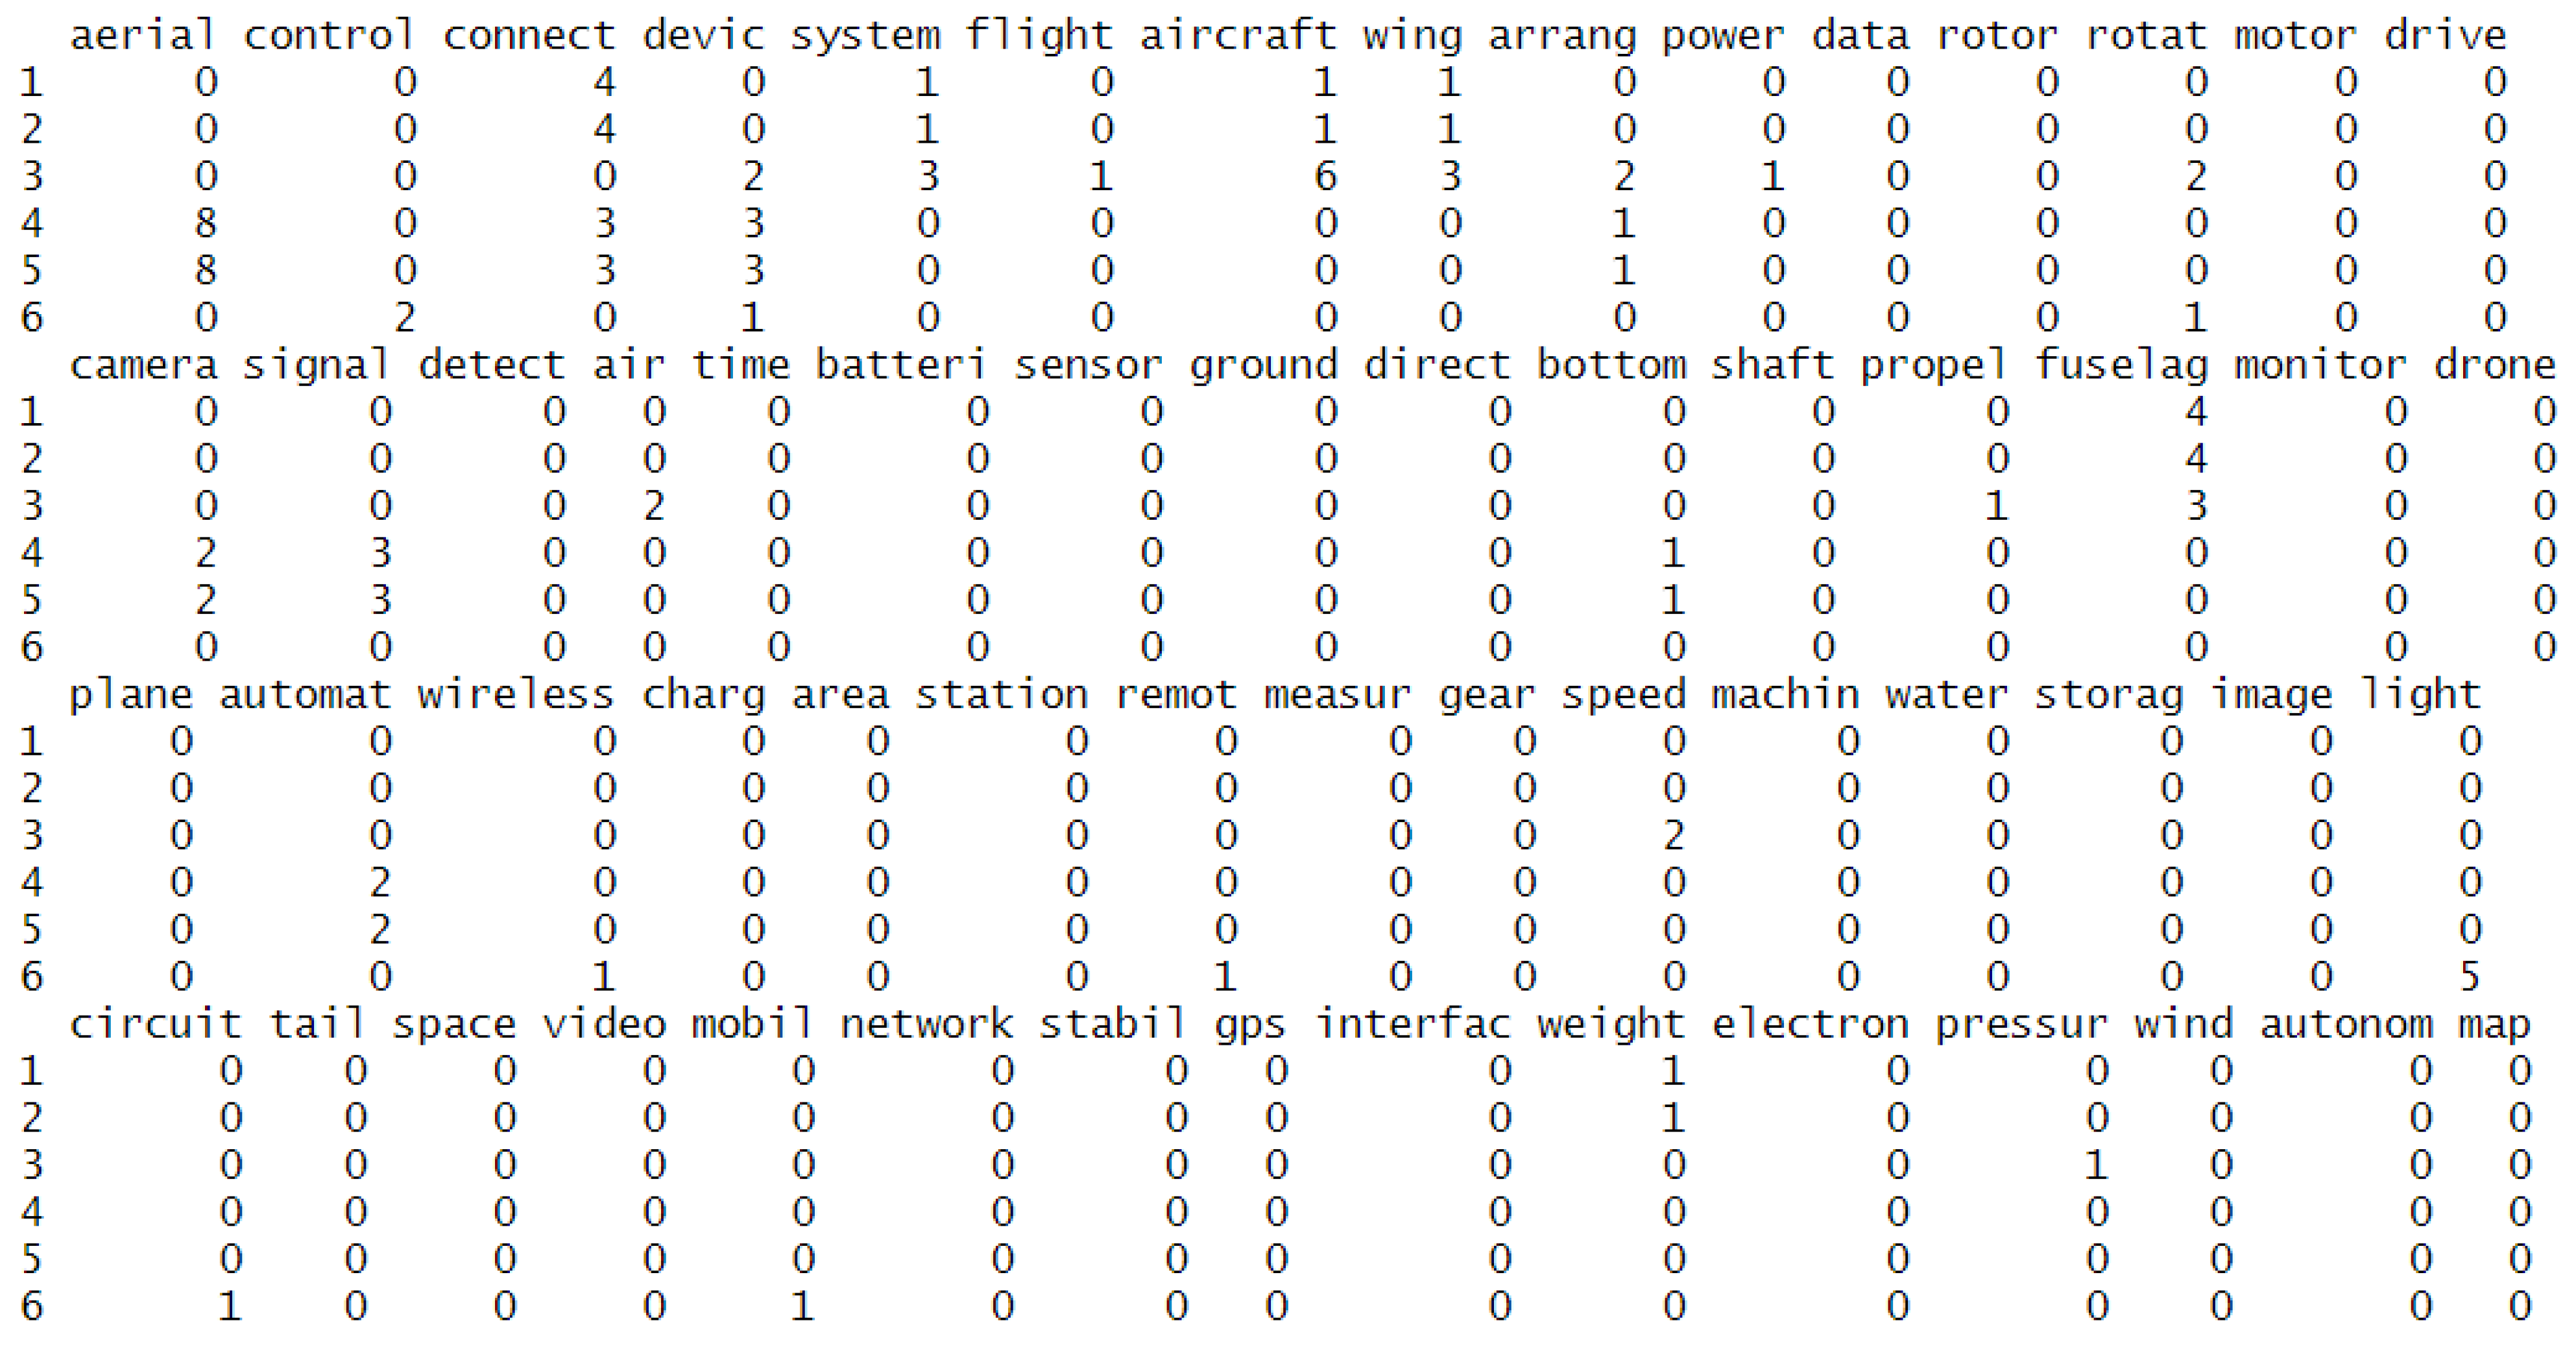
- Constructing the patent–keyword matrix as structured data.
- (Step 3)
- Visualizing Patent Keywords
- (3-1)
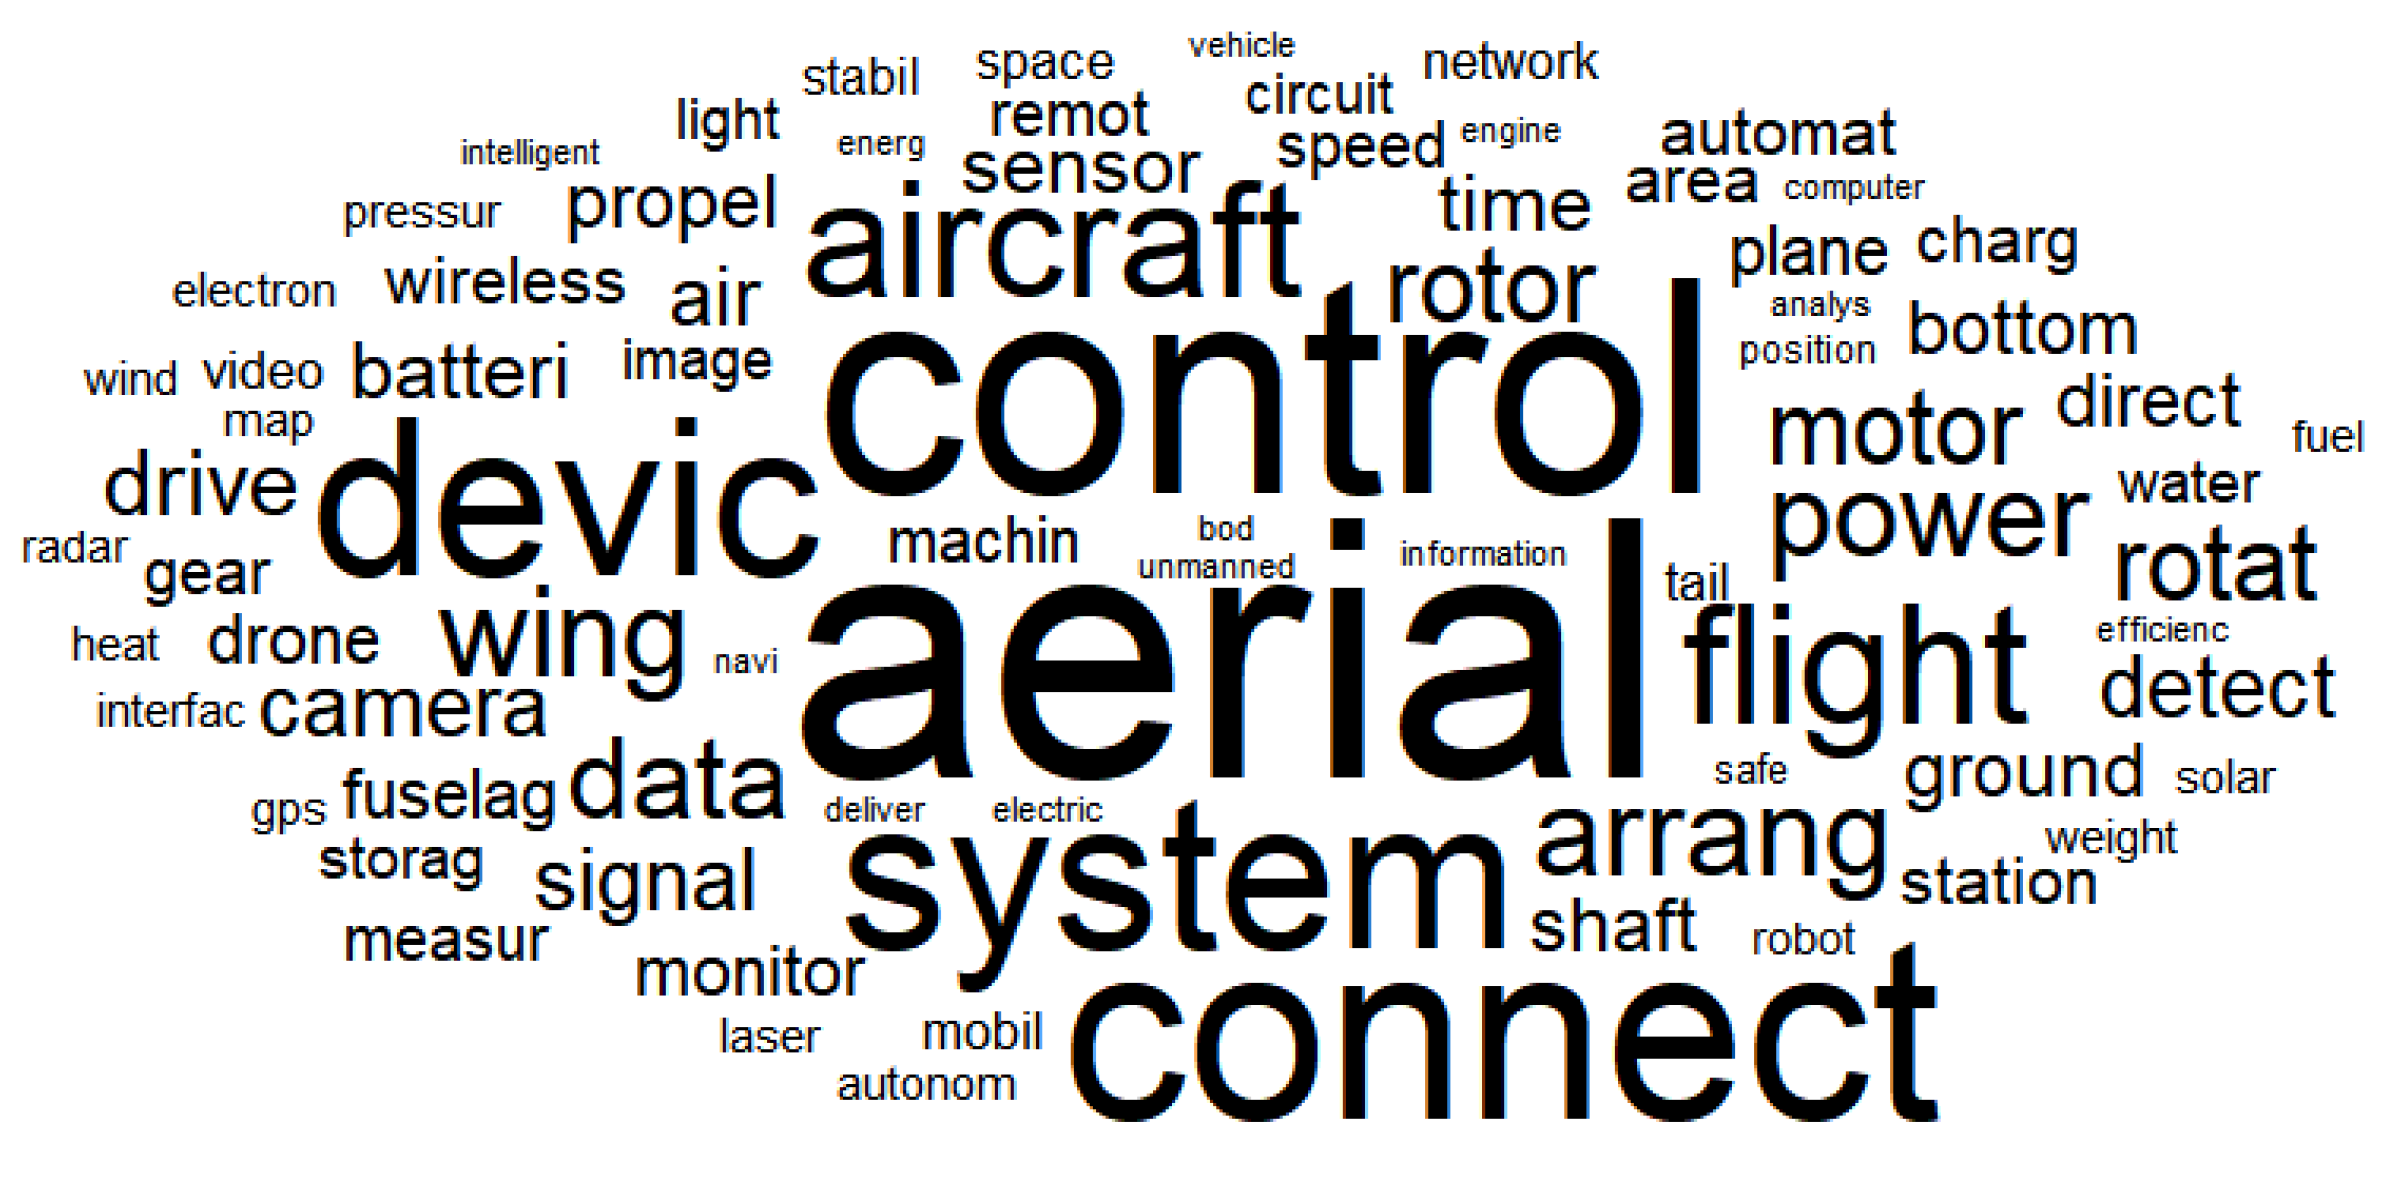
- Generating word cloud for finding top frequency keywords.
- (3-2)
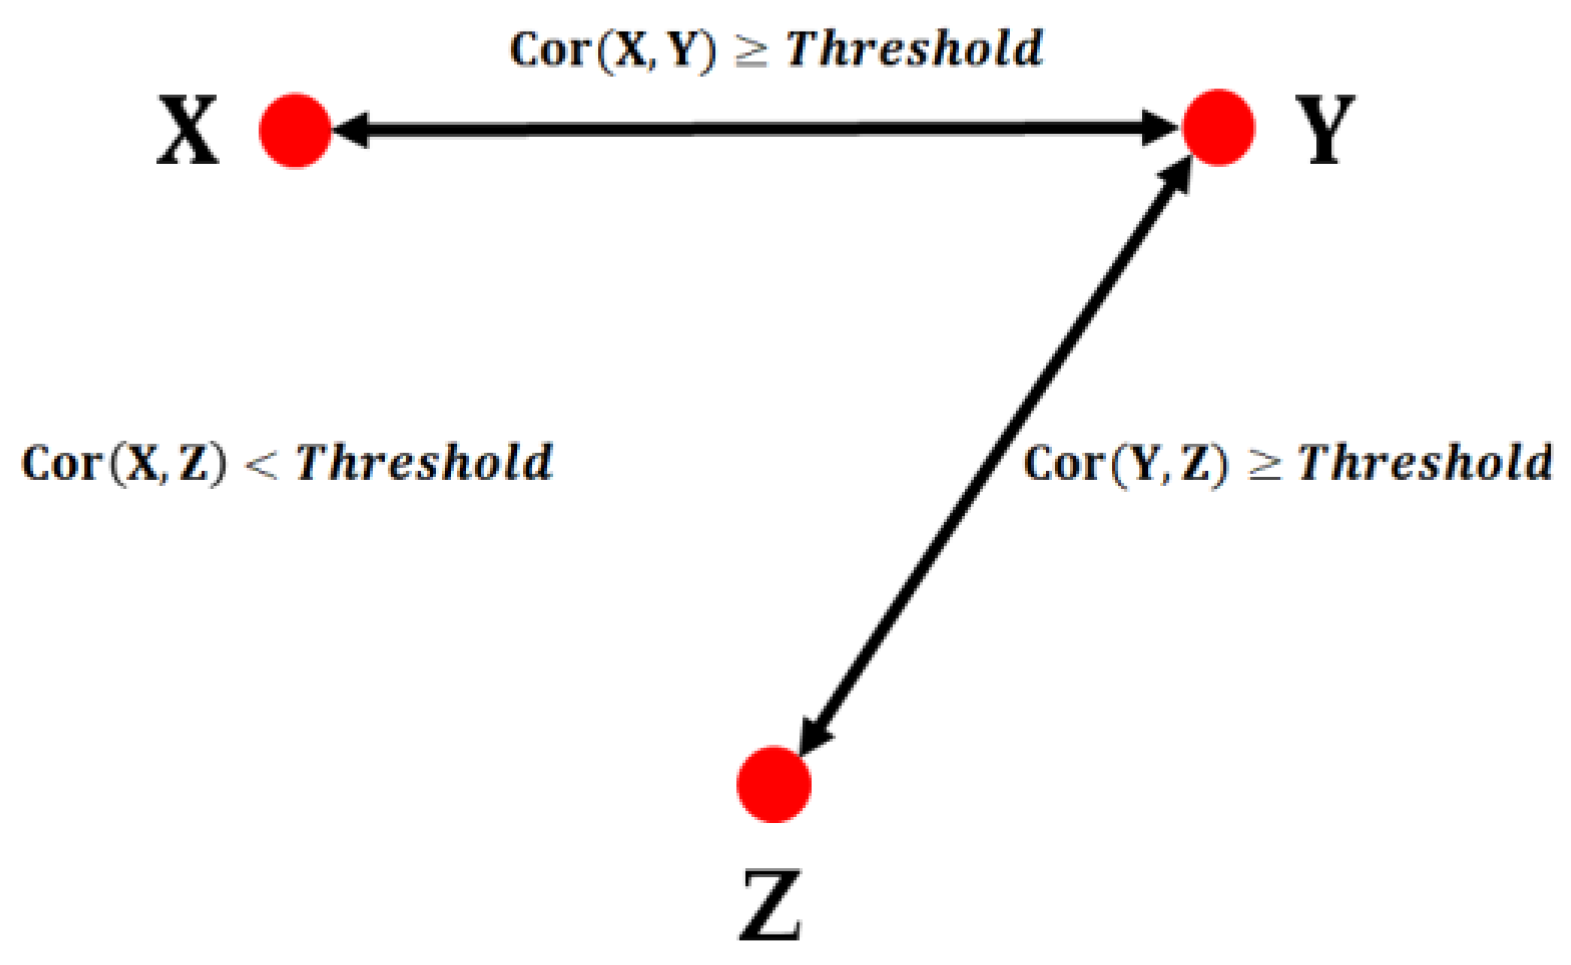
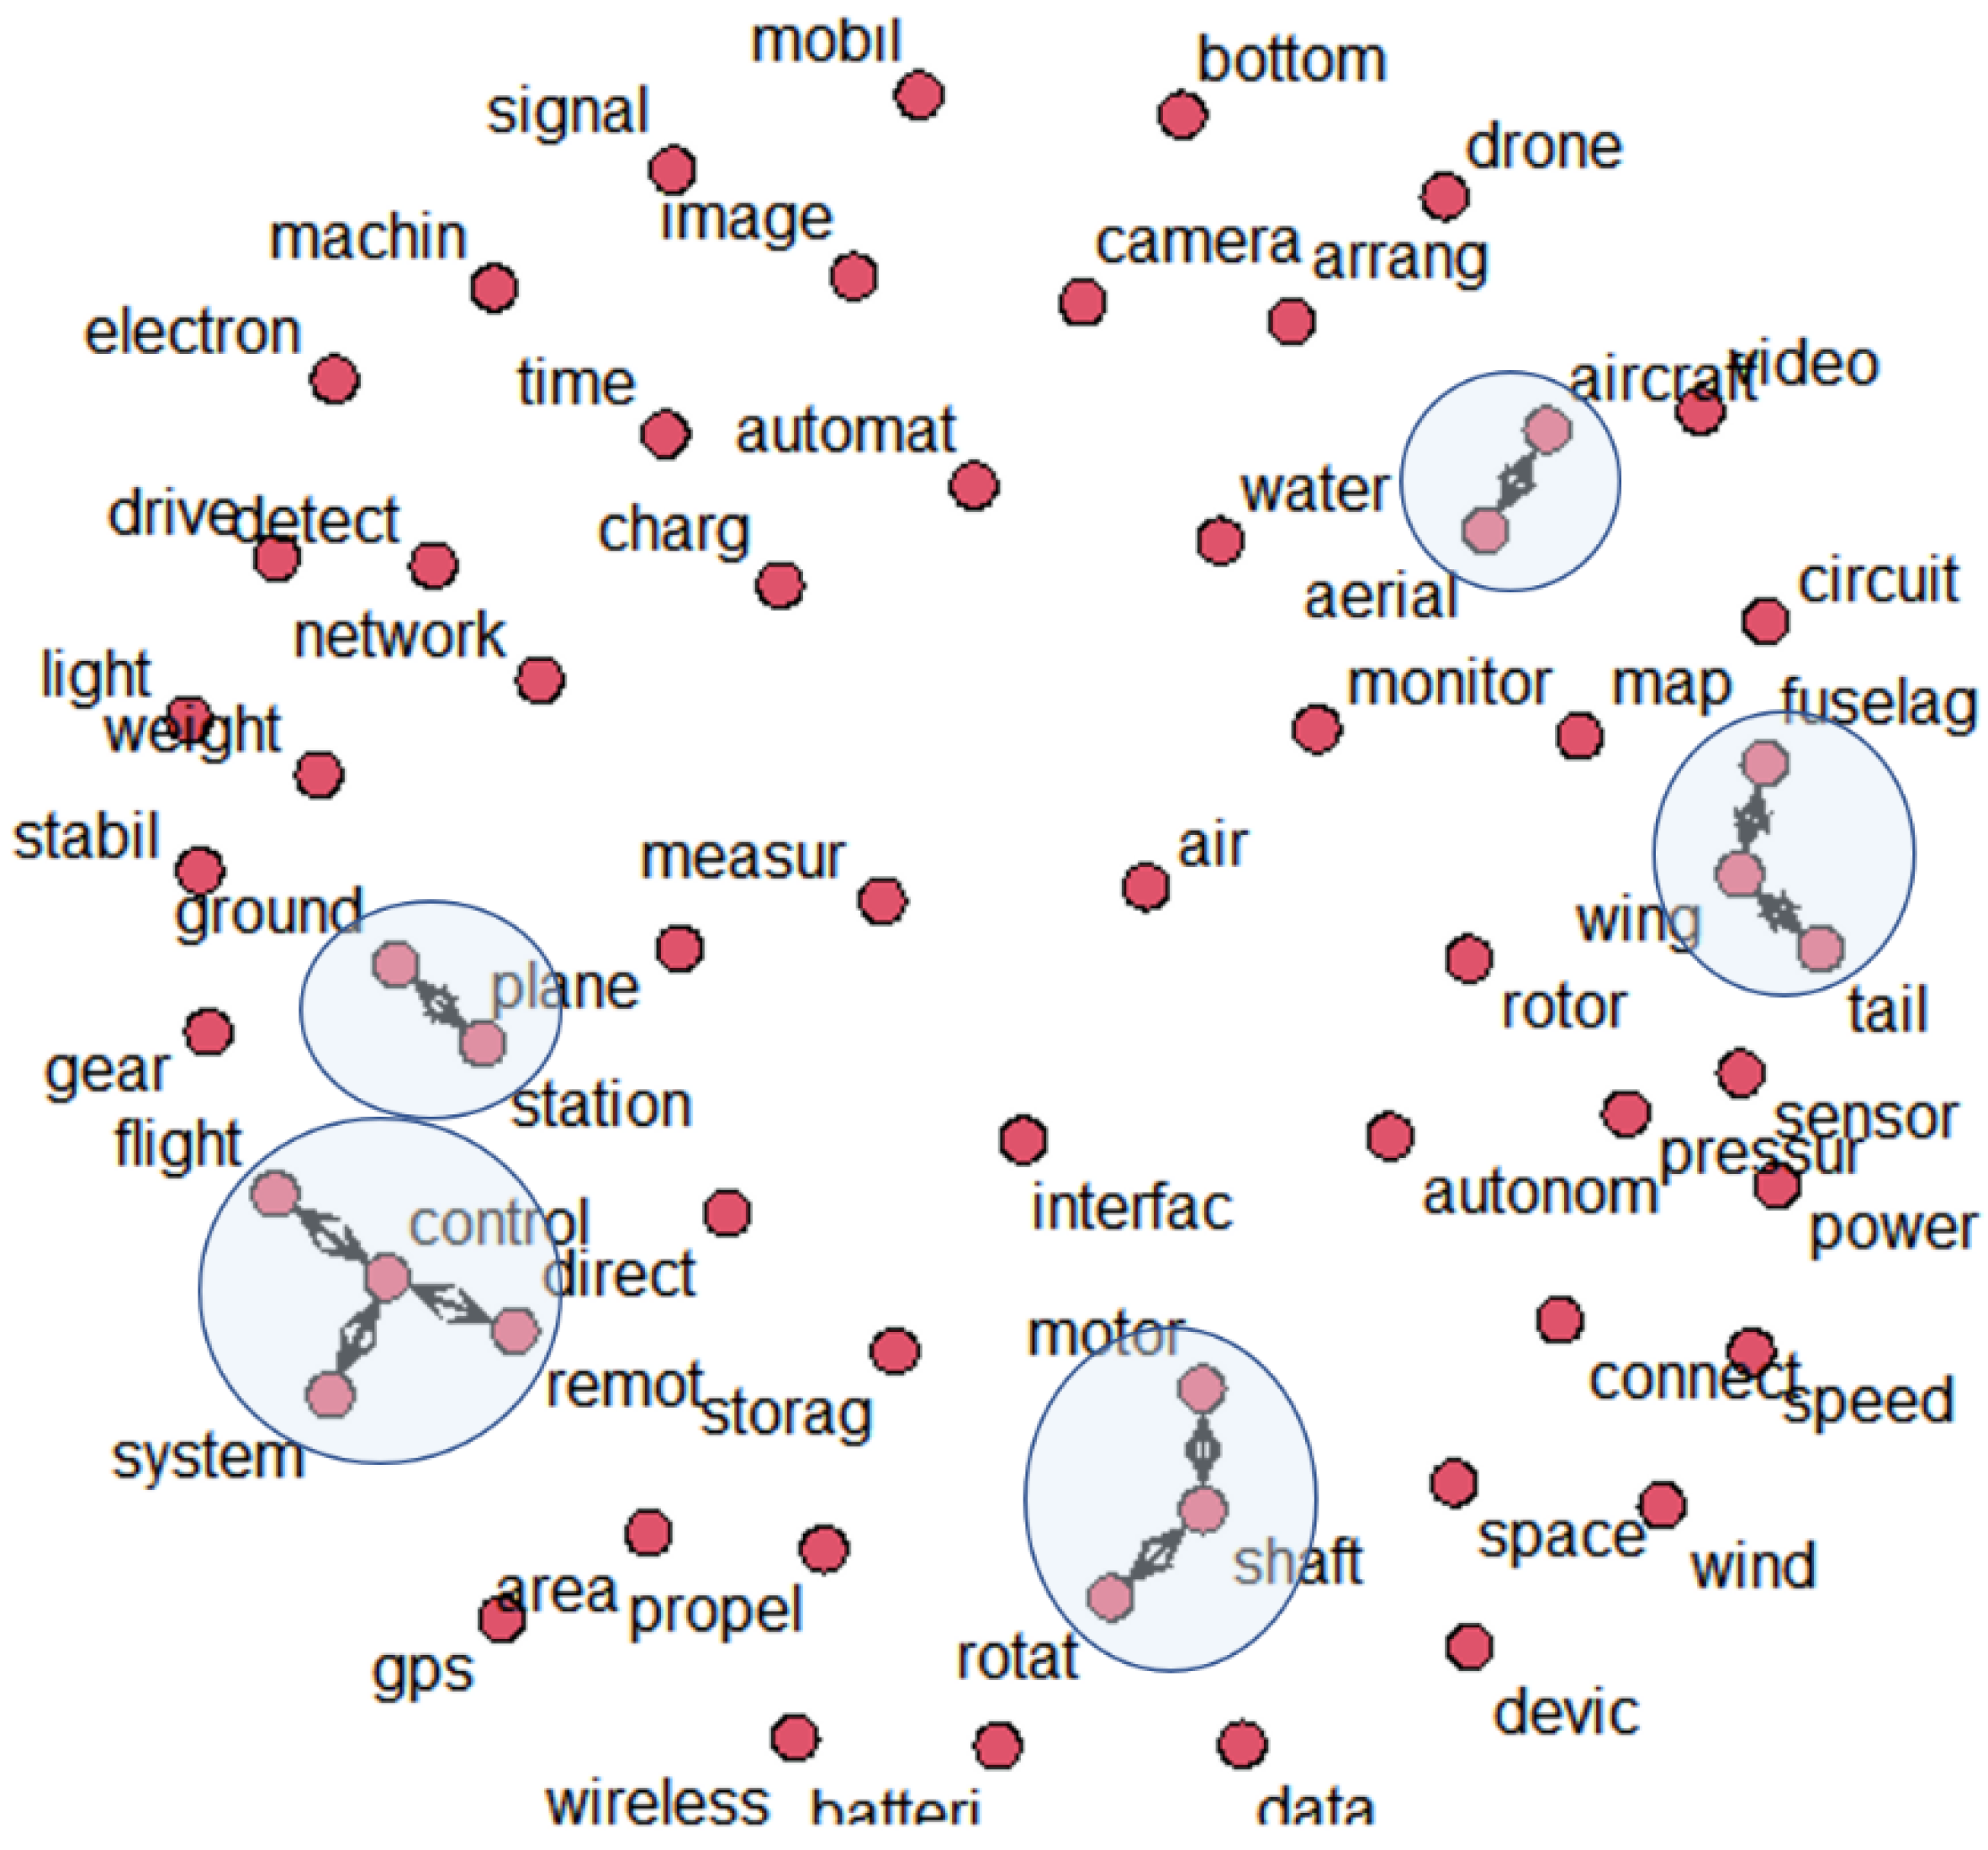
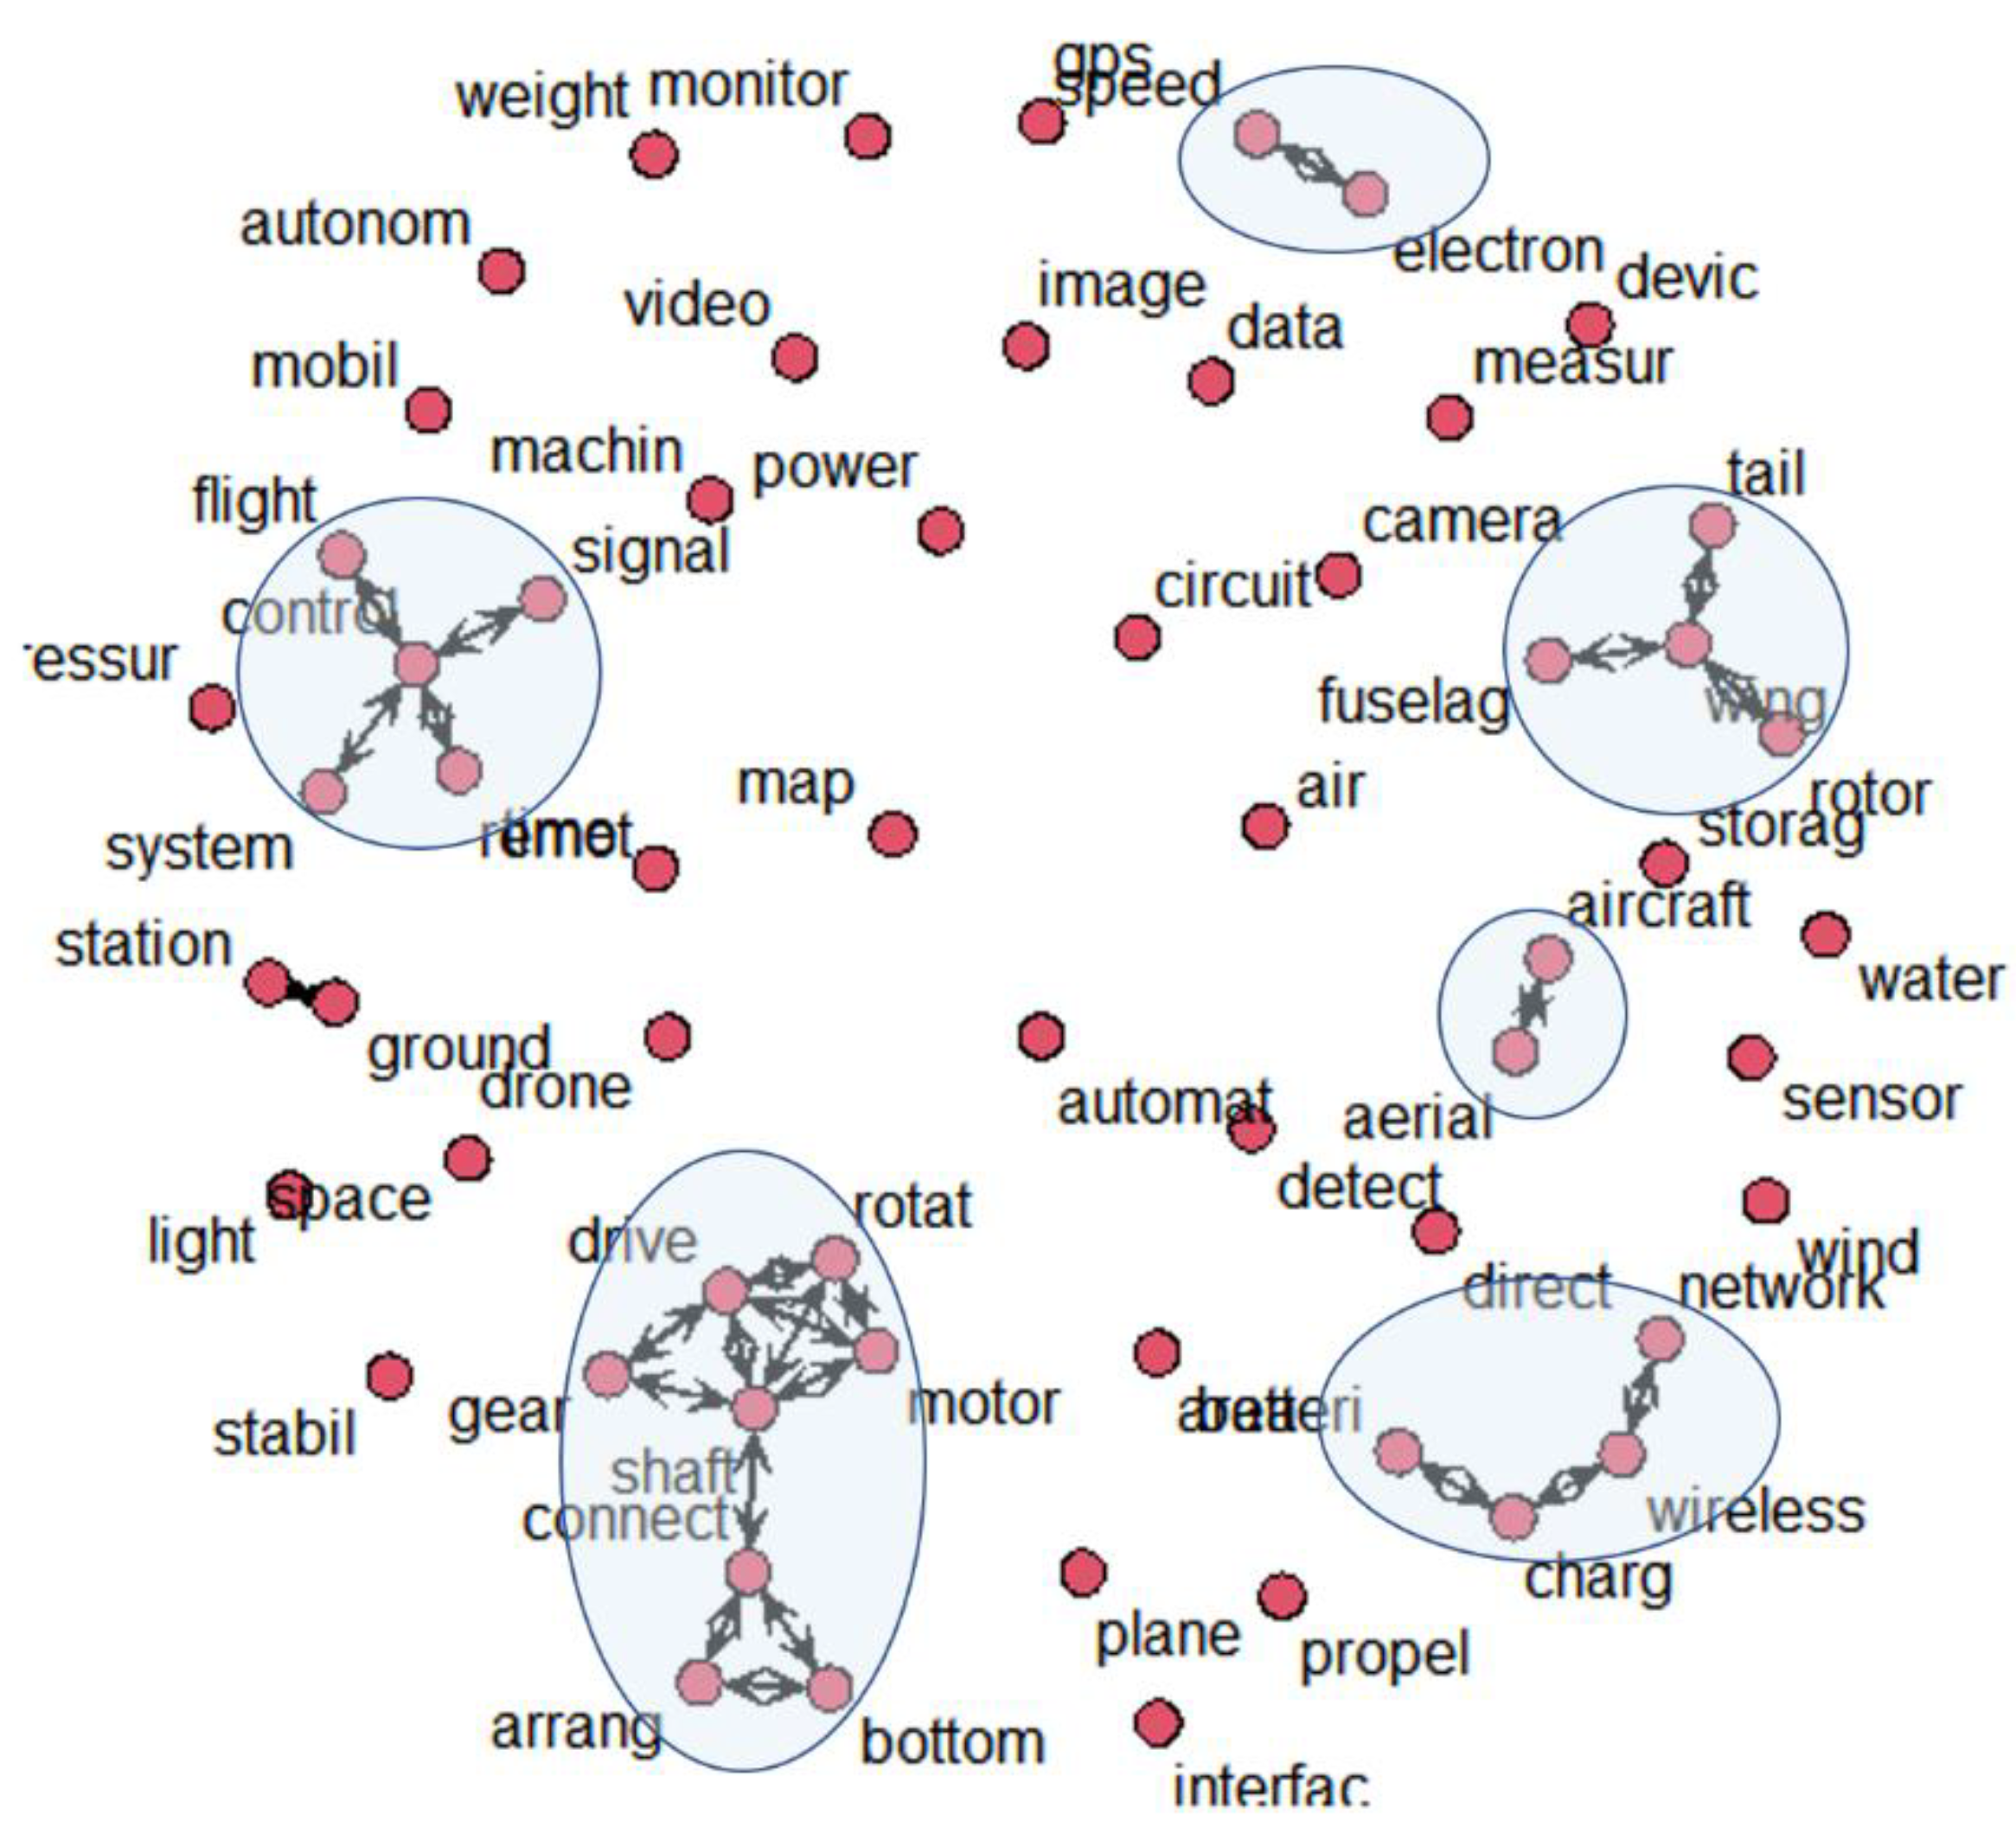
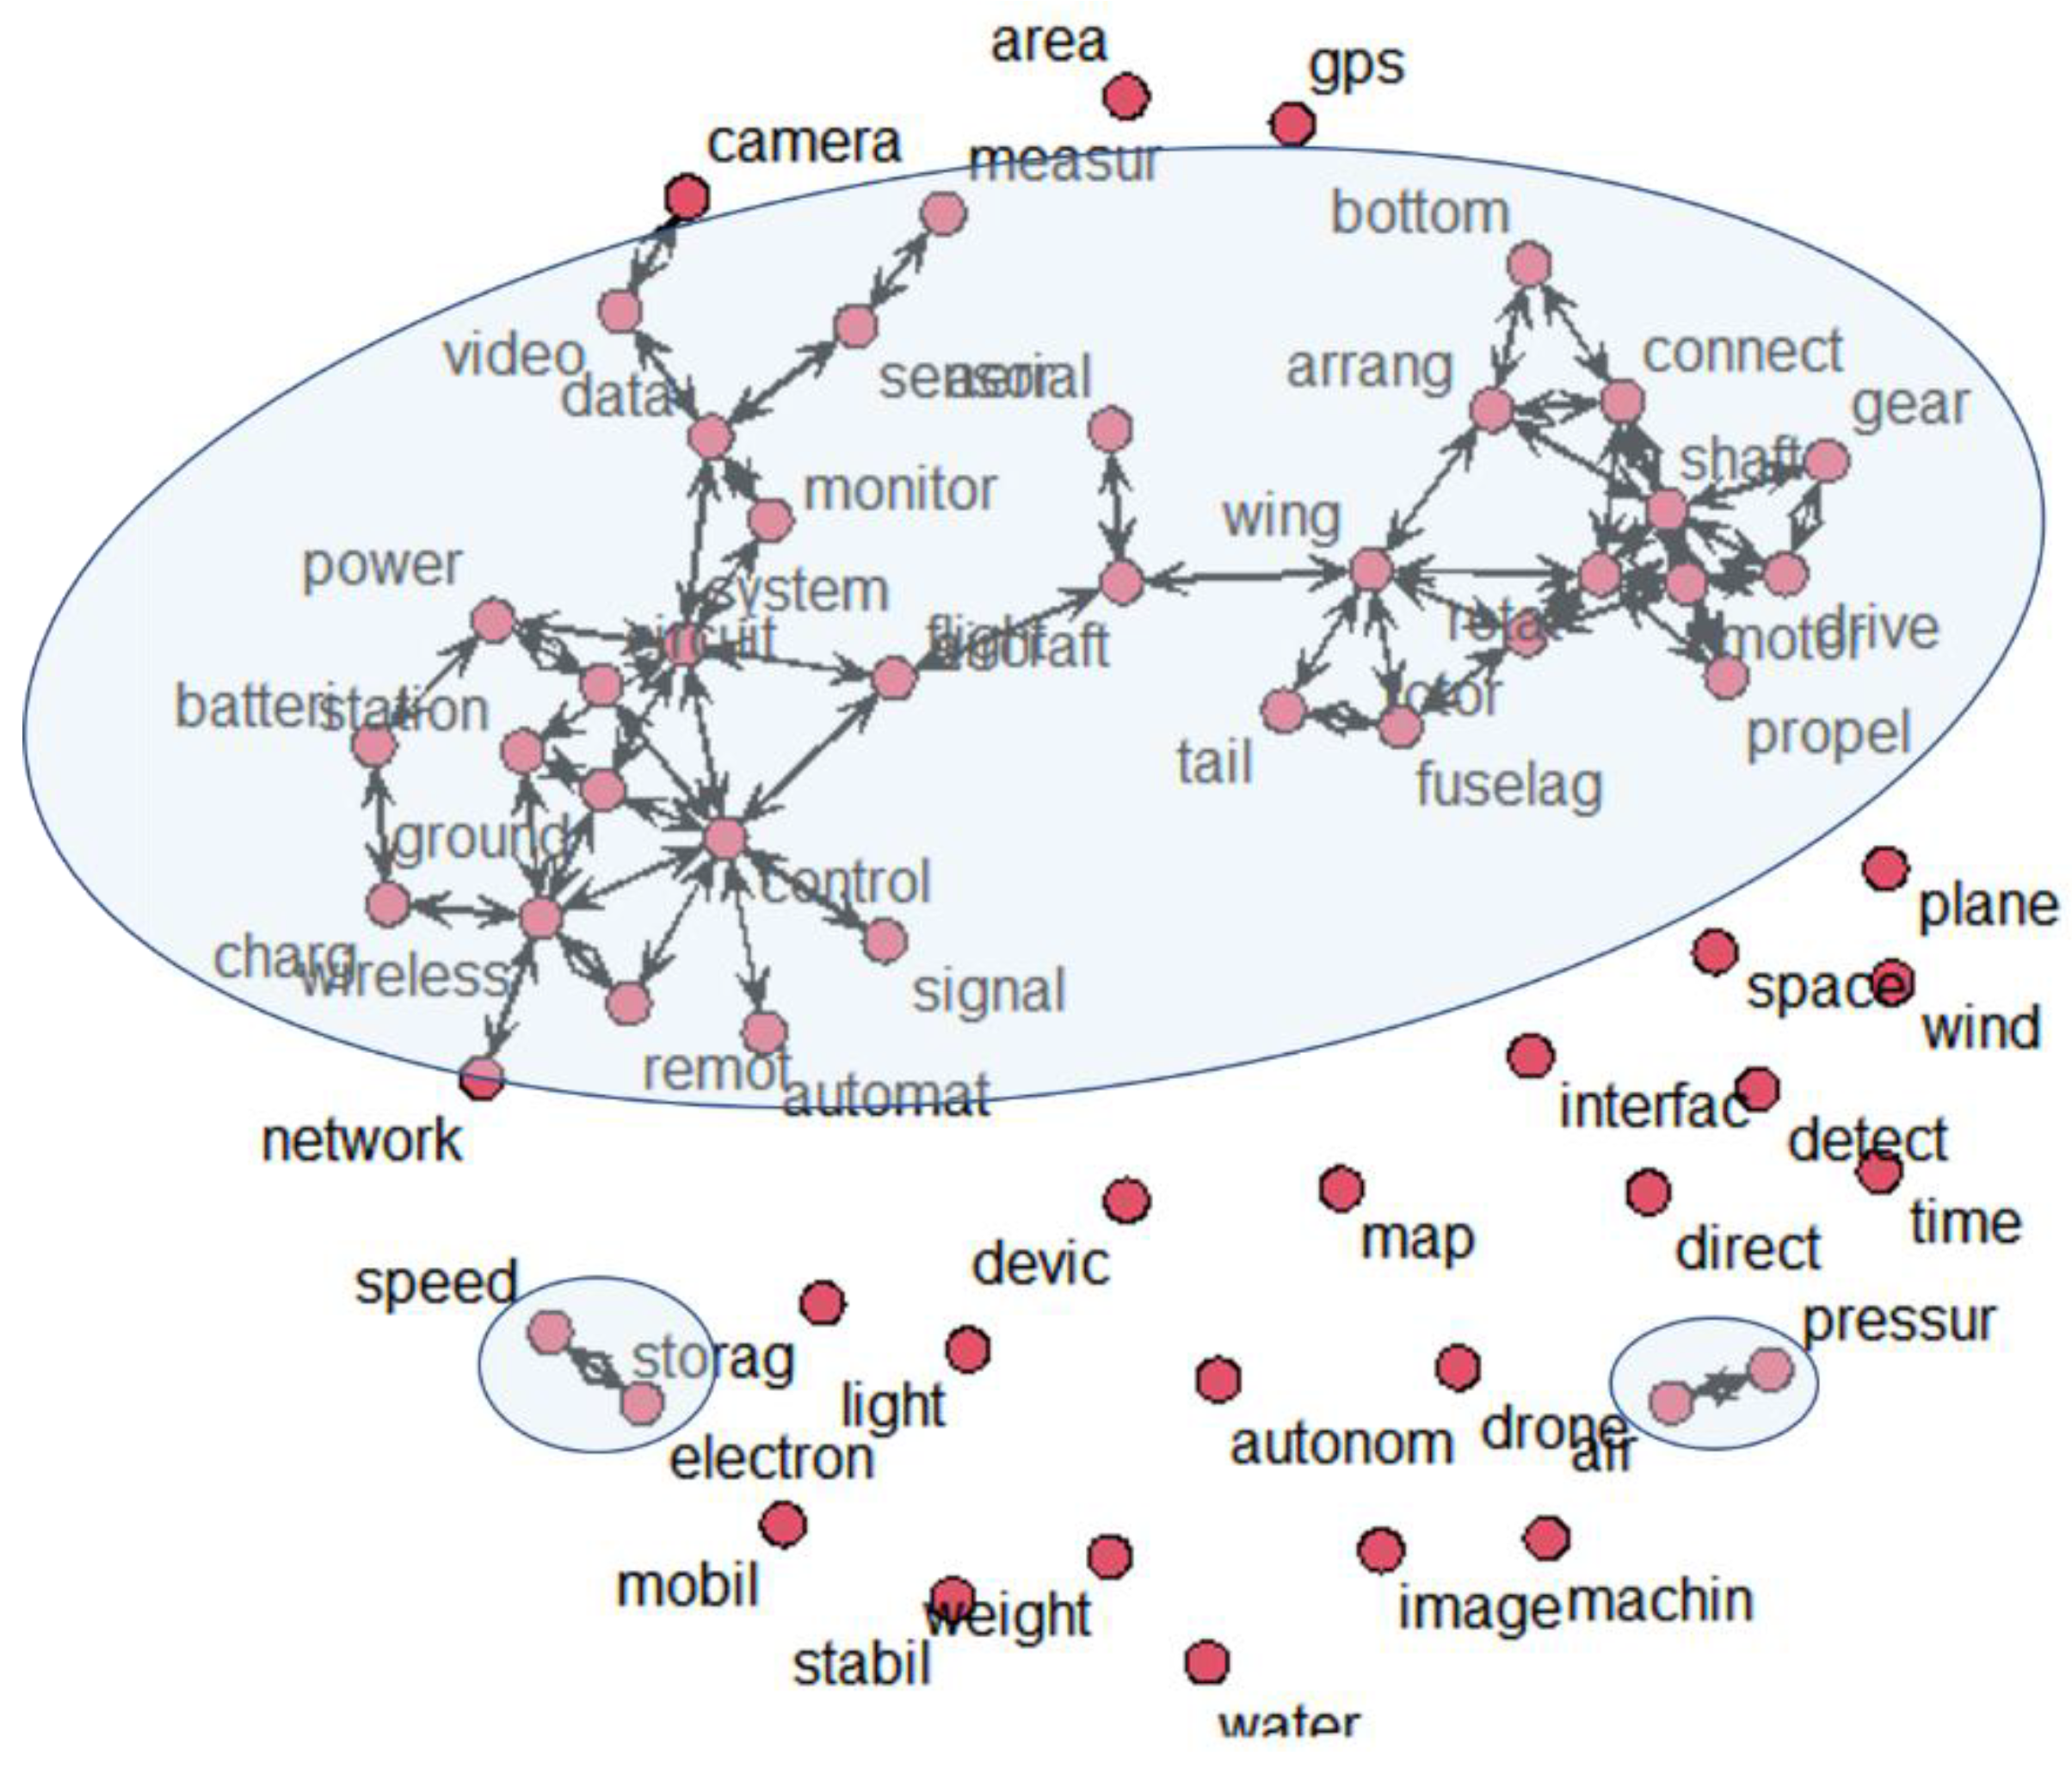
- Making correlation networks between all keywords.
- (3-3)
- Calculating degree values of all keywords for ranking of core keywords.
- (Step 4)
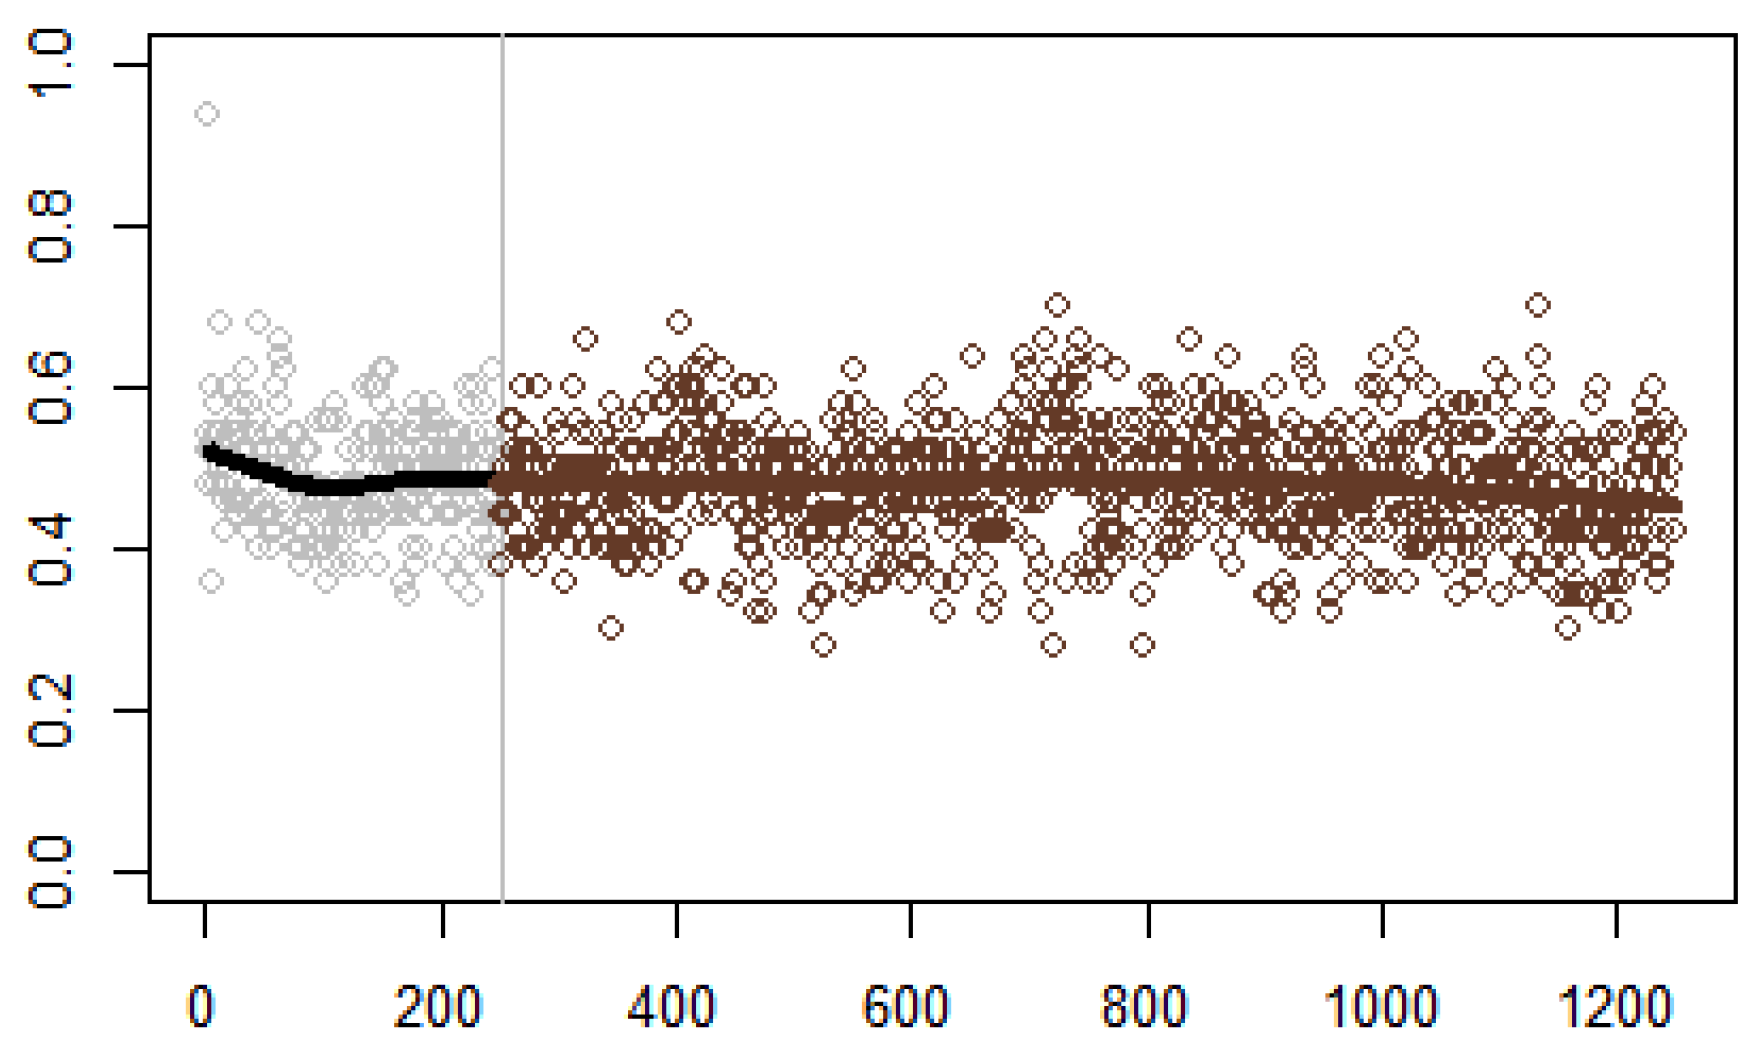
- Performing Bayesian Additive Regression Trees (BART) model
- (4-1)
- Comparing p-values of explanatory keywords using a multiple regression model.
- (4-2)
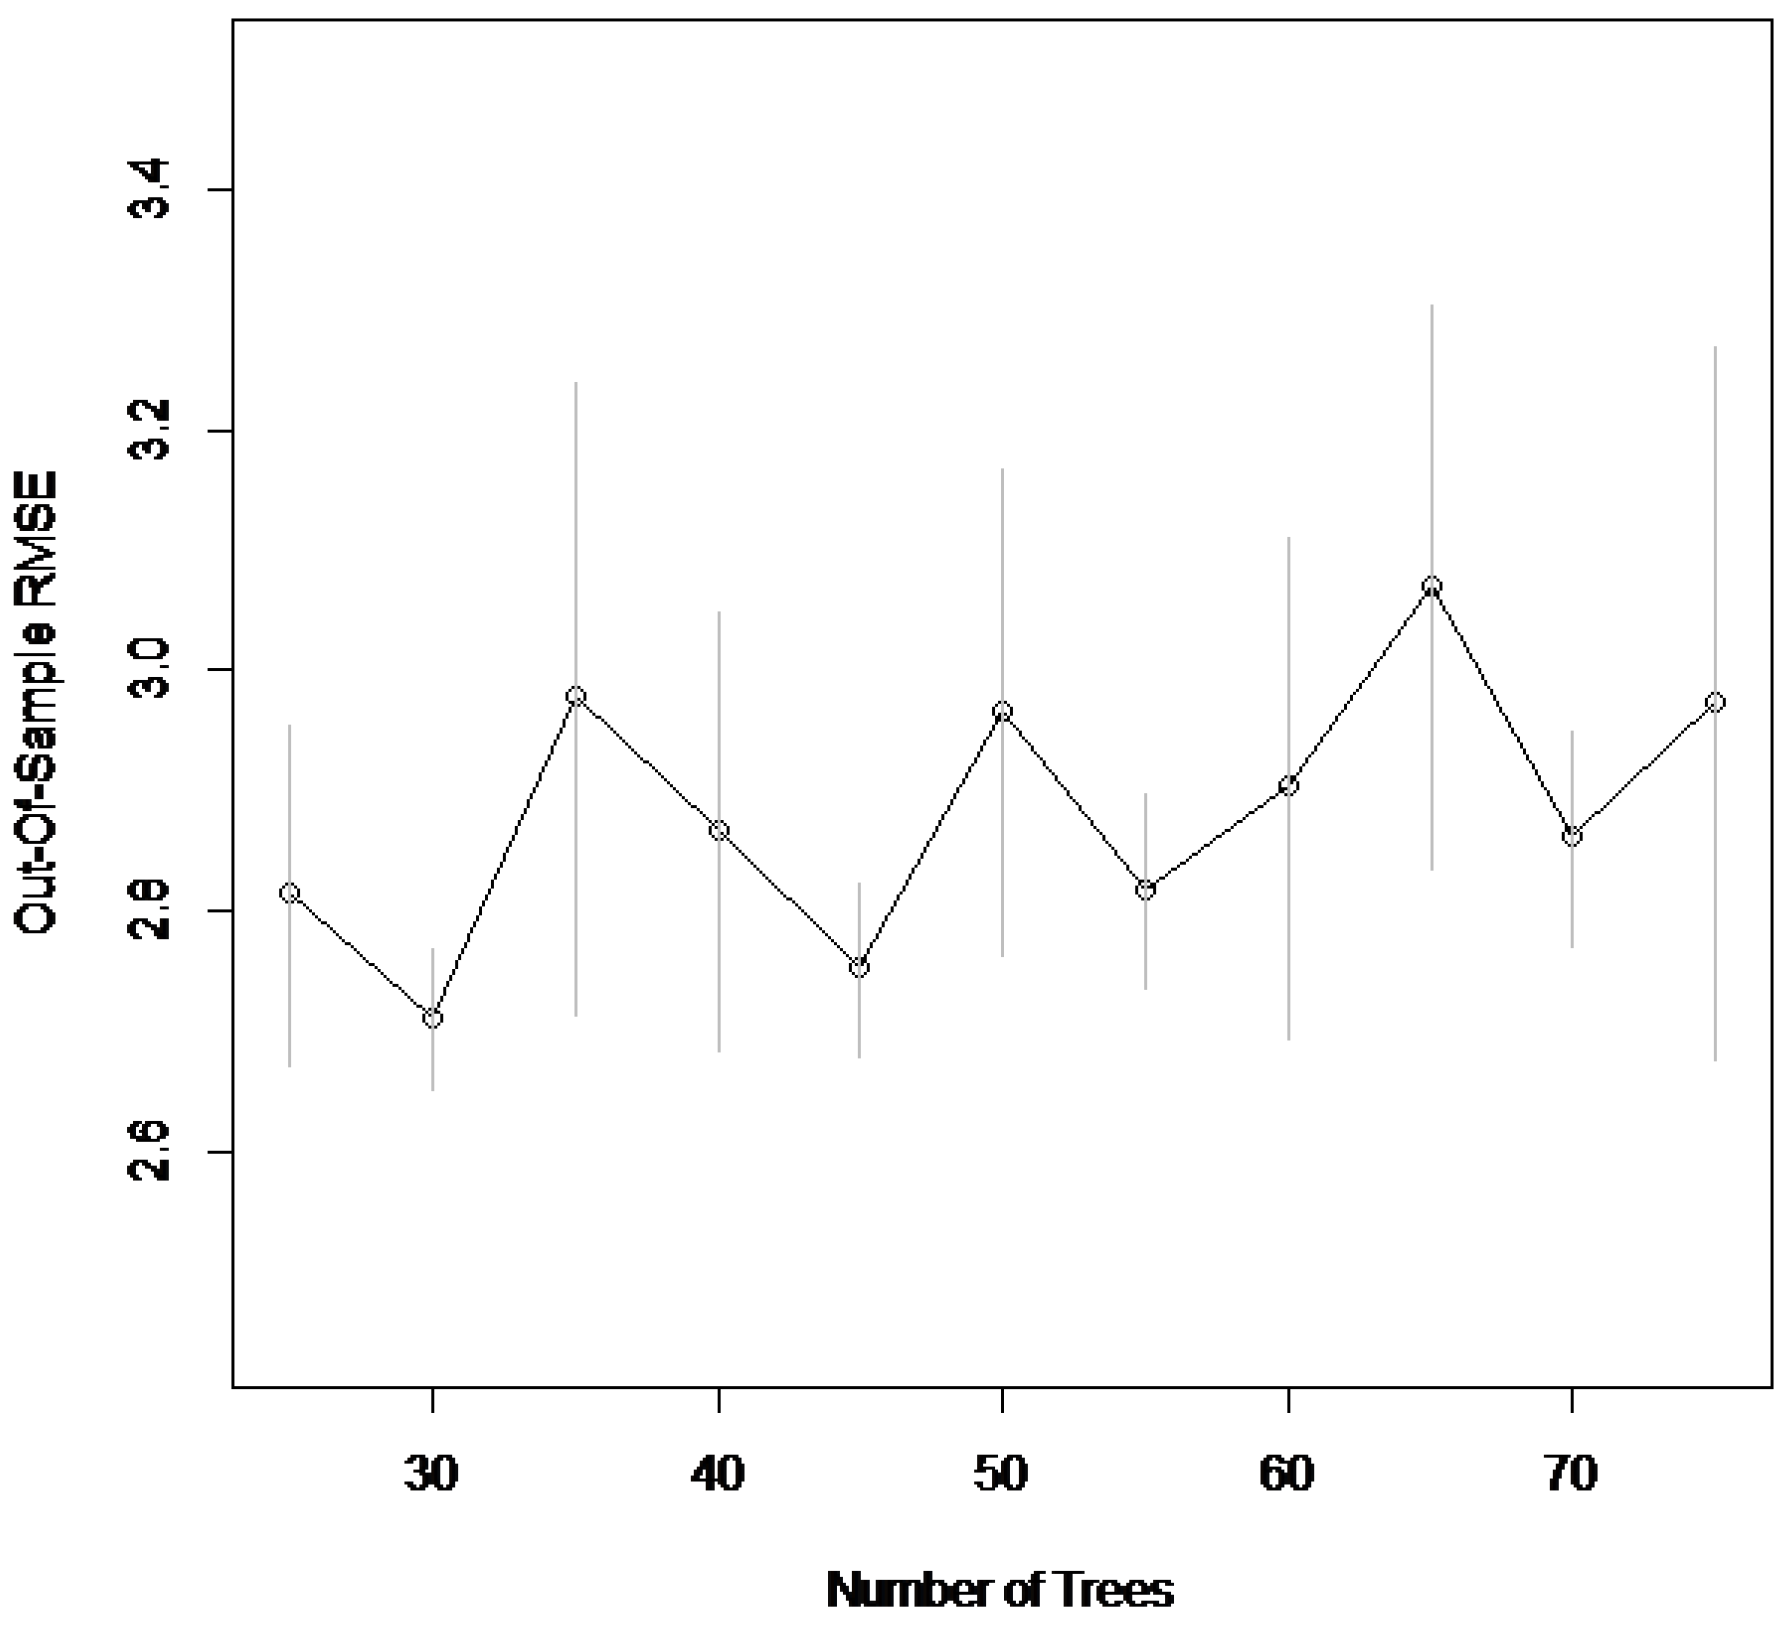
- Selecting important keywords using BART modeling.
- (4-3)
- Building technology scenarios of drone using all results.
3.2. Text Mining
3.3. Structured Data
3.4. Keyword Visualization
3.5. BART Modeling
3.6. Summary of Proposed Methodology
4. Experiments and Results
5. Discussion
6. Conclusions, Limitations, and Future Research
Author Contributions
Funding
Conflicts of Interest
References
- Nouacer, R.; Hussein, M.; Espinoza, H.; Ouhammou, Y.; Ladeira, M.; Castiñeira, R. Towards a framework of key technologies for drones. Microprocess. Microsyst. 2020, 77, 103142. [Google Scholar] [CrossRef]
- Chen, J.; Wang, G.; Luo, L.; Gong, W.; Cheng, Z. Building Area Estimation in Drone Aerial Images Based on Mask R-CNN. IEEE Geosci. Remote Sens. Lett. 2021, 18, 891–894. [Google Scholar] [CrossRef]
- Holden, P.B.; Rebelo, A.J.; New, M.G. Mapping invasive alien trees in water towers: A combined approach using satellite data fusion, drone technology and expert engagement. Remote Sens. Appl. Soc. Environ. 2021, 21, 100448. [Google Scholar] [CrossRef]
- Kornatowski, P.M.; Mintchev, S.; Floreano, D. An origami-inspired cargo drone. In Proceedings of the IEEE/RSJ International Conference on Intelligent Robots and Systems, Vancouver, BC, Canada, 24–28 September 2017; pp. 6855–6862. [Google Scholar]
- Suzuki, S. Recent researches on innovative drone technologies in robotics field. Adv. Robot. 2018, 32, 1008–1022. [Google Scholar] [CrossRef]
- Tejado-Ramos, J.; Chocarro-León, M.; Barrero-Béjar, I.; Valverde-Calvo, A.; Ferreras-Moreno, M.; Giraldo-Pavón, F.; Tarragona-Pérez, C. Enhancement of the sustainability of wolfram mining using drone remote sensing technology. Remote Sens. Appl. Soc. Environ. 2021, 23, 100542. [Google Scholar] [CrossRef]
- Tzelepi, M.; Tefas, A. Graph Embedded Convolutional Neural Networks in Human Crowd Detection for Drone Flight Safety. IEEE Trans. Emerg. Top. Comput. Intell. 2021, 5, 191–204. [Google Scholar] [CrossRef]
- Kwon, H.; Kim, J.; Park, Y. Applying LSA text mining technique in envisioning social impacts of emerging technologies: The case of drone technology. Technovation 2017, 60–61, 15–28. [Google Scholar] [CrossRef]
- Hunt, D.; Nguyen, L.; Rodgers, M. Patent Searching Tools & Techniques; Wiley: Hoboken, NJ, USA, 2007. [Google Scholar]
- Roper, A.T.; Cunningham, S.W.; Porter, A.L.; Mason, T.W.; Rossini, F.A.; Banks, J. Forecasting and Management of Technology; John Wiley & Sons: Hoboken, NJ, USA, 2011. [Google Scholar]
- Feng, X.; Fuhai, L. Patent Text Mining and Informetric-based Patent Technology Morphological Analysis: An Empirical Study. Technol. Anal. Strateg. Manag. 2021, 24, 467–479. [Google Scholar] [CrossRef]
- Uhm, D.; Ryu, J.; Jun, S. Patent Data Analysis of Artificial Intelligence Using Bayesian Interval Estimation. Appl. Sci. 2020, 10, 570. [Google Scholar] [CrossRef] [Green Version]
- USPTO. The United States Patent and Trademark Office. Available online: http://www.uspto.gov (accessed on 15 March 2021).
- WIPSON. WIPS Corporation. Available online: http://www.wipson.com (accessed on 1 April 2021).
- KIPRIS. Korea Intellectual Property Rights Information Service. Available online: www.kipris.or.kr (accessed on 1 April 2021).
- Berman, J.J. Principles and Practice of Big Data: Preparing, Sharing, and Analyzing Complex Information, 2nd ed.; Academic Press: London, UK, 2018. [Google Scholar]
- Ryu, J.; Jun, S. A Superpopulation Model for Patent Big Data Analysis. Int. J. Softw. Eng. Its Appl. 2016, 10, 153–162. [Google Scholar] [CrossRef]
- Park, S.; Lee, S.; Jun, S. Patent Big Data Analysis using Fuzzy Learning. Int. J. Fuzzy Syst. 2017, 19, 1158–1167. [Google Scholar] [CrossRef]
- Chakraborty, M.; Byshkin, M.; Crestani, F. Patent citation network analysis: A perspective from descriptive statistics and ERGMs. PLoS ONE 2020, 15, e0241797. [Google Scholar] [CrossRef] [PubMed]
- Bruce, P.; Bruce, A.; Gedeck, P. Practical Statistics for Data Scientists; O’Reilly Media: Sebastopol, CA, USA, 2020. [Google Scholar]
- Han, J.; Kamber, M.; Pei, J. Data Mining: Concepts and Techniques, 3rd ed.; Morgan Kaufmann: Waltham, MA, USA, 2012. [Google Scholar]
- Feinerer, I.; Hornik, K.; Meyer, D. Text mining infrastructure in R. J. Stat. Softw. 2008, 25, 1–54. [Google Scholar] [CrossRef] [Green Version]
- Feinerer, I.; Hornik, K. Package ‘tm’ Version 0.7-8, Text Mining Package; CRAN of R Project; R Foundation for Statistical Computing: Vienna, Austria, 2020. [Google Scholar]
- R Development Core Team. R: A Language and Environment for Statistical Computing; R Foundation for Statistical Computing: Vienna, Austria; Available online: http://www.R-project.org (accessed on 1 April 2021).
- Abazi-Bexheti, L.; Kadriu, A.; Apostolova, M. Word Cloud Analytics of the Computer Science Research Publications’ Titles over the Past Half Century. In Proceedings of the 43rd International Convention on Information, Communication and Electronic Technology, Opatija, Croatia, 28 September–2 October 2020; pp. 887–892. [Google Scholar]
- Heimerl, F.; Lohmann, S.; Lange, S.; Ertl, T. Word Cloud Explorer: Text Analytics Based on Word Clouds. In Proceedings of the 47th Hawaii International Conference on System Sciences, Waikoloa, HI, USA, 6–9 January 2014; pp. 1833–1842. [Google Scholar]
- Montgomery, D.C.; Peck, E.A.; Vining, G.G. Introduction to Linear Regression Analysis; John Wiley & Sons: Hoboken, NJ, USA, 2012. [Google Scholar]
- Hogg, R.V.; Tanis, E.A.; Zimmerman, D.L. Probability and Statistical Inference, 9th ed.; Pearson: Essex, UK, 2015. [Google Scholar]
- Chipman, H.A.; George, E.I.; McCulloch, R.E. BART: Bayesian Additive Regression Trees. Ann. Appl. Stat. 2010, 4, 266–298. [Google Scholar] [CrossRef]
- Kapelner, A.; Bleich, J. bartMachine: Machine Learning with Bayesian Additive Regression Trees. J. Stat. Softw. 2016, 70, 1–40. [Google Scholar] [CrossRef] [Green Version]
- Bleich, J.; Kapelner, A.; Jensen, S.T.; George, E.I. Variable Selection for BART: An Application to Gene Regulation. Ann. Appl. Stat. 2014, 8, 1750–1781. [Google Scholar] [CrossRef] [Green Version]
- Sparapani, R.; Spanbauer, C.; McCulloch, R. Nonparametric Machine Learning and Efficient Computation with Bayesian Additive Regression Trees: The BART R Package. J. Stat. Softw. 2021, 97, 1–66. [Google Scholar] [CrossRef]
- Gelman, A.; Carlin, J.B.; Stern, H.S.; Dunson, D.B.; Vehtari, A.; Rubin, D.B. Bayesian Data Analysis, 3rd ed.; Chapman & Hall/CRC Press: Boca Raton, FL, USA, 2013. [Google Scholar]
- Rice, J.A. Mathematical Statistics and Data Analysis, 2nd ed.; Duxbury Press: Belmont, CA, USA, 1995. [Google Scholar]
- Du, Q.; Li, N.; Yang, S.; Sun, D.; Liu, W. Integrating KNN and Gradient Boosting Decision Tree for Recommendation. In Proceedings of the IEEE 5th Advanced Information Technology, Electronic and Automation Control Conference, Chongqing, China, 12–14 March 2021; pp. 2042–2049. [Google Scholar]
- Wu, W.; Xia, Y.; Jin, W. Predicting Bus Passenger Flow and Prioritizing Influential Factors Using Multi-Source Data: Scaled Stacking Gradient Boosting Decision Trees. IEEE Trans. Intell. Transp. Syst. 2021, 22, 2510–2523. [Google Scholar] [CrossRef]


| Reference | Technology Field | Methodology | Analysis Purpose |
|---|---|---|---|
| 11 | Liquid crystal display wide viewing angle | Text mining, factor analysis, morphological analysis | Evaluating morphological configuration |
| 12 | Artificial intelligence | Text mining, statistical inference, Bayesian statistics | Technology forecasting |
| 17 | Smart devices of Apple | Superpopulation model, linear regression | Technology structure |
| 18 | Three dimensional printing | Text mining, fuzzy regression, fuzzy clustering | Technology clustering, R&D planning |
| 19 | General technology | Citation network analysis, exponential random graph models | Technology citation and network |
| SWOT | Description |
|---|---|
| Strength | Aircraft manufacturing and communication technologies, and their infrastructure Willingness to develop drones at national level |
| Weakness | Lack of intelligent software technology for drone operation Exclusive drone technology focused on developed countries |
| Opportunity | Continuous growth of drone market Expansion of drone services linked to other industries |
| Threat | Possibility of using drones that endanger human privacy Use of drones as weapons |
| Ranking | Keywords |
|---|---|
| 1~30 | aerial, control, connect, devic, system, flight, aircraft, wing, arrang, power, data, rotor, rotat, motor, drive, camera, signal, detect, air, time, batteri, sensor, ground, direct, bottom, shaft, propel, fuselag, monitor, drone |
| 31~60 | plane, automat, wireless, charg, area, station, remot, measur, gear, speed, machin, water, storag, image, light, circuit, tail, space, video, mobil, network, stabil, gps, interfac, weight, electron, pressur, wind, autonom, map |
| Keyword | Correlation Coefficient | Keyword | Correlation Coefficient | ||||
|---|---|---|---|---|---|---|---|
| 0.2 | 0.15 | 0.1 | 0.2 | 0.15 | 0.1 | ||
| aerial | 2 | 2 | 2 | plane | 0 | 0 | 0 |
| control | 6 | 8 | 16 | automat | 0 | 0 | 2 |
| connect | 0 | 6 | 10 | wireless | 0 | 4 | 12 |
| devic | 0 | 0 | 0 | charg | 0 | 4 | 4 |
| system | 2 | 2 | 14 | area | 0 | 0 | 0 |
| flight | 2 | 2 | 6 | station | 2 | 2 | 6 |
| aircraft | 2 | 2 | 6 | remot | 2 | 2 | 4 |
| wing | 4 | 6 | 12 | measur | 0 | 0 | 2 |
| arrang | 0 | 4 | 8 | gear | 0 | 4 | 4 |
| power | 0 | 0 | 6 | speed | 0 | 2 | 2 |
| data | 0 | 0 | 8 | machin | 0 | 0 | 0 |
| rotor | 0 | 2 | 10 | water | 0 | 0 | 0 |
| rotat | 2 | 6 | 14 | storag | 0 | 0 | 0 |
| motor | 2 | 6 | 12 | image | 0 | 0 | 0 |
| drive | 0 | 8 | 8 | light | 0 | 0 | 0 |
| camera | 0 | 0 | 2 | circuit | 0 | 0 | 4 |
| signal | 0 | 2 | 2 | tail | 2 | 2 | 4 |
| detect | 0 | 0 | 0 | space | 0 | 0 | 0 |
| air | 0 | 0 | 2 | video | 0 | 0 | 4 |
| time | 0 | 0 | 0 | mobil | 0 | 0 | 0 |
| batteri | 0 | 2 | 4 | network | 0 | 2 | 2 |
| sensor | 0 | 0 | 4 | stabil | 0 | 0 | 0 |
| ground | 2 | 2 | 8 | gps | 0 | 0 | 0 |
| direct | 0 | 0 | 0 | interfac | 0 | 0 | 0 |
| bottom | 0 | 4 | 4 | weight | 0 | 0 | 0 |
| shaft | 4 | 10 | 16 | electron | 0 | 2 | 2 |
| propel | 0 | 0 | 6 | pressur | 0 | 0 | 2 |
| fuselag | 2 | 2 | 6 | wind | 0 | 0 | 0 |
| monitor | 0 | 0 | 4 | autonom | 0 | 0 | 0 |
| drone | 0 | 0 | 0 | map | 0 | 0 | 0 |
| Explanatory | t | p-Value | Explanatory | t | p-Value |
|---|---|---|---|---|---|
| (Intercept) | 43.988 | 0.0001 | plane | −7.298 | 0.0001 |
| aerial | −26.258 | 0.0001 | automat | −2.119 | 0.0341 |
| control | −1.144 | 0.2527 | wireless | −0.921 | 0.357 |
| connect | −10.456 | 0.0001 | charg | 1.945 | 0.0518 |
| devic | −0.285 | 0.7759 | area | 4.639 | 0.0001 |
| system | 1.821 | 0.0686 | station | 11.029 | 0.0001 |
| flight | −0.587 | 0.5574 | remot | 1.618 | 0.1057 |
| aircraft | −17.125 | 0.0001 | measur | −1.655 | 0.0979 |
| wing | −0.643 | 0.5205 | gear | −2.839 | 0.0045 |
| arrang | −4.414 | 0.0001 | speed | −1.251 | 0.211 |
| power | −2.567 | 0.0103 | machin | −0.952 | 0.3413 |
| data | 3.203 | 0.0014 | water | −2.597 | 0.0094 |
| rotor | −4.426 | 0.0001 | storag | −0.458 | 0.6468 |
| rotat | −2.672 | 0.0075 | image | −9.271 | 0.0001 |
| motor | −2.273 | 0.0231 | light | −2.157 | 0.031 |
| drive | −2.837 | 0.0045 | circuit | −3.514 | 0.0004 |
| camera | 1.667 | 0.0956 | tail | −2.01 | 0.0445 |
| signal | 3.379 | 0.0007 | space | −1.985 | 0.0472 |
| detect | −0.994 | 0.3202 | video | −0.67 | 0.5025 |
| air | −4.641 | 0.0001 | mobil | 0.131 | 0.8956 |
| time | −6.071 | 0.0001 | network | 6.67 | 0.0001 |
| batteri | −3.209 | 0.0013 | stabil | −2.956 | 0.0031 |
| sensor | 2.424 | 0.0153 | gps | −1.282 | 0.1997 |
| ground | −6.253 | 0.0001 | interfac | 0.715 | 0.4748 |
| direct | 2.631 | 0.0085 | weight | −0.538 | 0.5909 |
| bottom | −4.616 | 0.0001 | electron | 0.685 | 0.4931 |
| shaft | −1.3 | 0.1937 | pressur | −3.873 | 0.0001 |
| propel | −0.234 | 0.8151 | wind | −0.067 | 0.9462 |
| fuselag | −4.189 | 0.0001 | autonom | 7.722 | 0.0001 |
| monitor | −1.254 | 0.21 | map | −1.416 | 0.1569 |
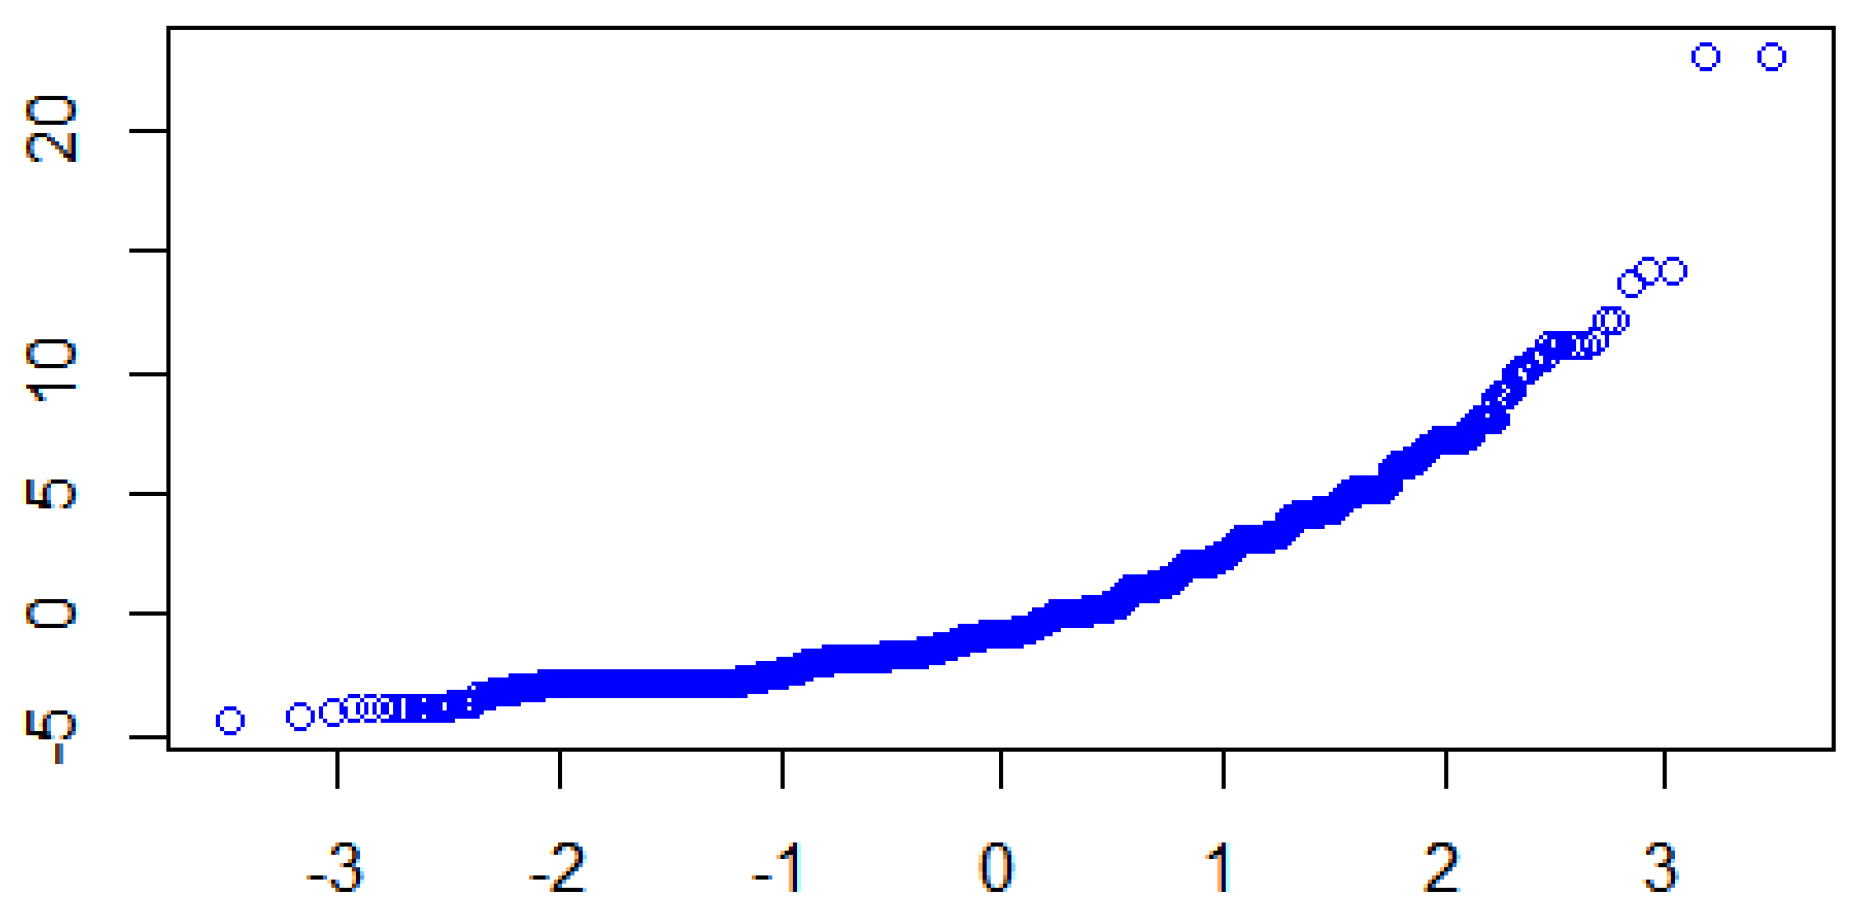
| Test Method | p-Value |
|---|---|
| Shapiro–Wilk | <0.0001 |
| Kolmogorov–Smirnov | <0.0001 |
| Scenario | Technology Description | Keyword |
|---|---|---|
| First | Technology to improve flight control and safety of the fuselage by collecting and analyzing visual information around the drone | aircraft, automat, autonom, camera, data, direct, drive, fuselag, gear, image, network, plane, rotat, sensor, shaft, signal, space, stabil, tail, wing |
| Second | Technology that collects surrounding information based on sensor signals and uses it to generate and control power for flight | aerial, area, arrang, circuit, control, data, detect, flight, fuselag, machin, measur, monitor, motor, power, pressur, propel, remot, sensor, signal, speed |
| Third | Technology to control efficient battery storage and operation for drone flight | aerial, aircraft, batteri, bottom, charg, control, electron, flight, ground, interfac, motor, power, pressur, speed, station, storag, system, water, weight, wind |
Publisher’s Note: MDPI stays neutral with regard to jurisdictional claims in published maps and institutional affiliations. |
© 2022 by the authors. Licensee MDPI, Basel, Switzerland. This article is an open access article distributed under the terms and conditions of the Creative Commons Attribution (CC BY) license (https://creativecommons.org/licenses/by/4.0/).
Share and Cite
Park, S.; Jun, S. Patent Analysis Using Bayesian Data Analysis and Network Modeling. Appl. Sci. 2022, 12, 1423. https://doi.org/10.3390/app12031423
Park S, Jun S. Patent Analysis Using Bayesian Data Analysis and Network Modeling. Applied Sciences. 2022; 12(3):1423. https://doi.org/10.3390/app12031423
Chicago/Turabian StylePark, Sangsung, and Sunghae Jun. 2022. "Patent Analysis Using Bayesian Data Analysis and Network Modeling" Applied Sciences 12, no. 3: 1423. https://doi.org/10.3390/app12031423
APA StylePark, S., & Jun, S. (2022). Patent Analysis Using Bayesian Data Analysis and Network Modeling. Applied Sciences, 12(3), 1423. https://doi.org/10.3390/app12031423