
Natural Para Rubber in Road Embankment Stabilization


Abstract
:1. Introduction
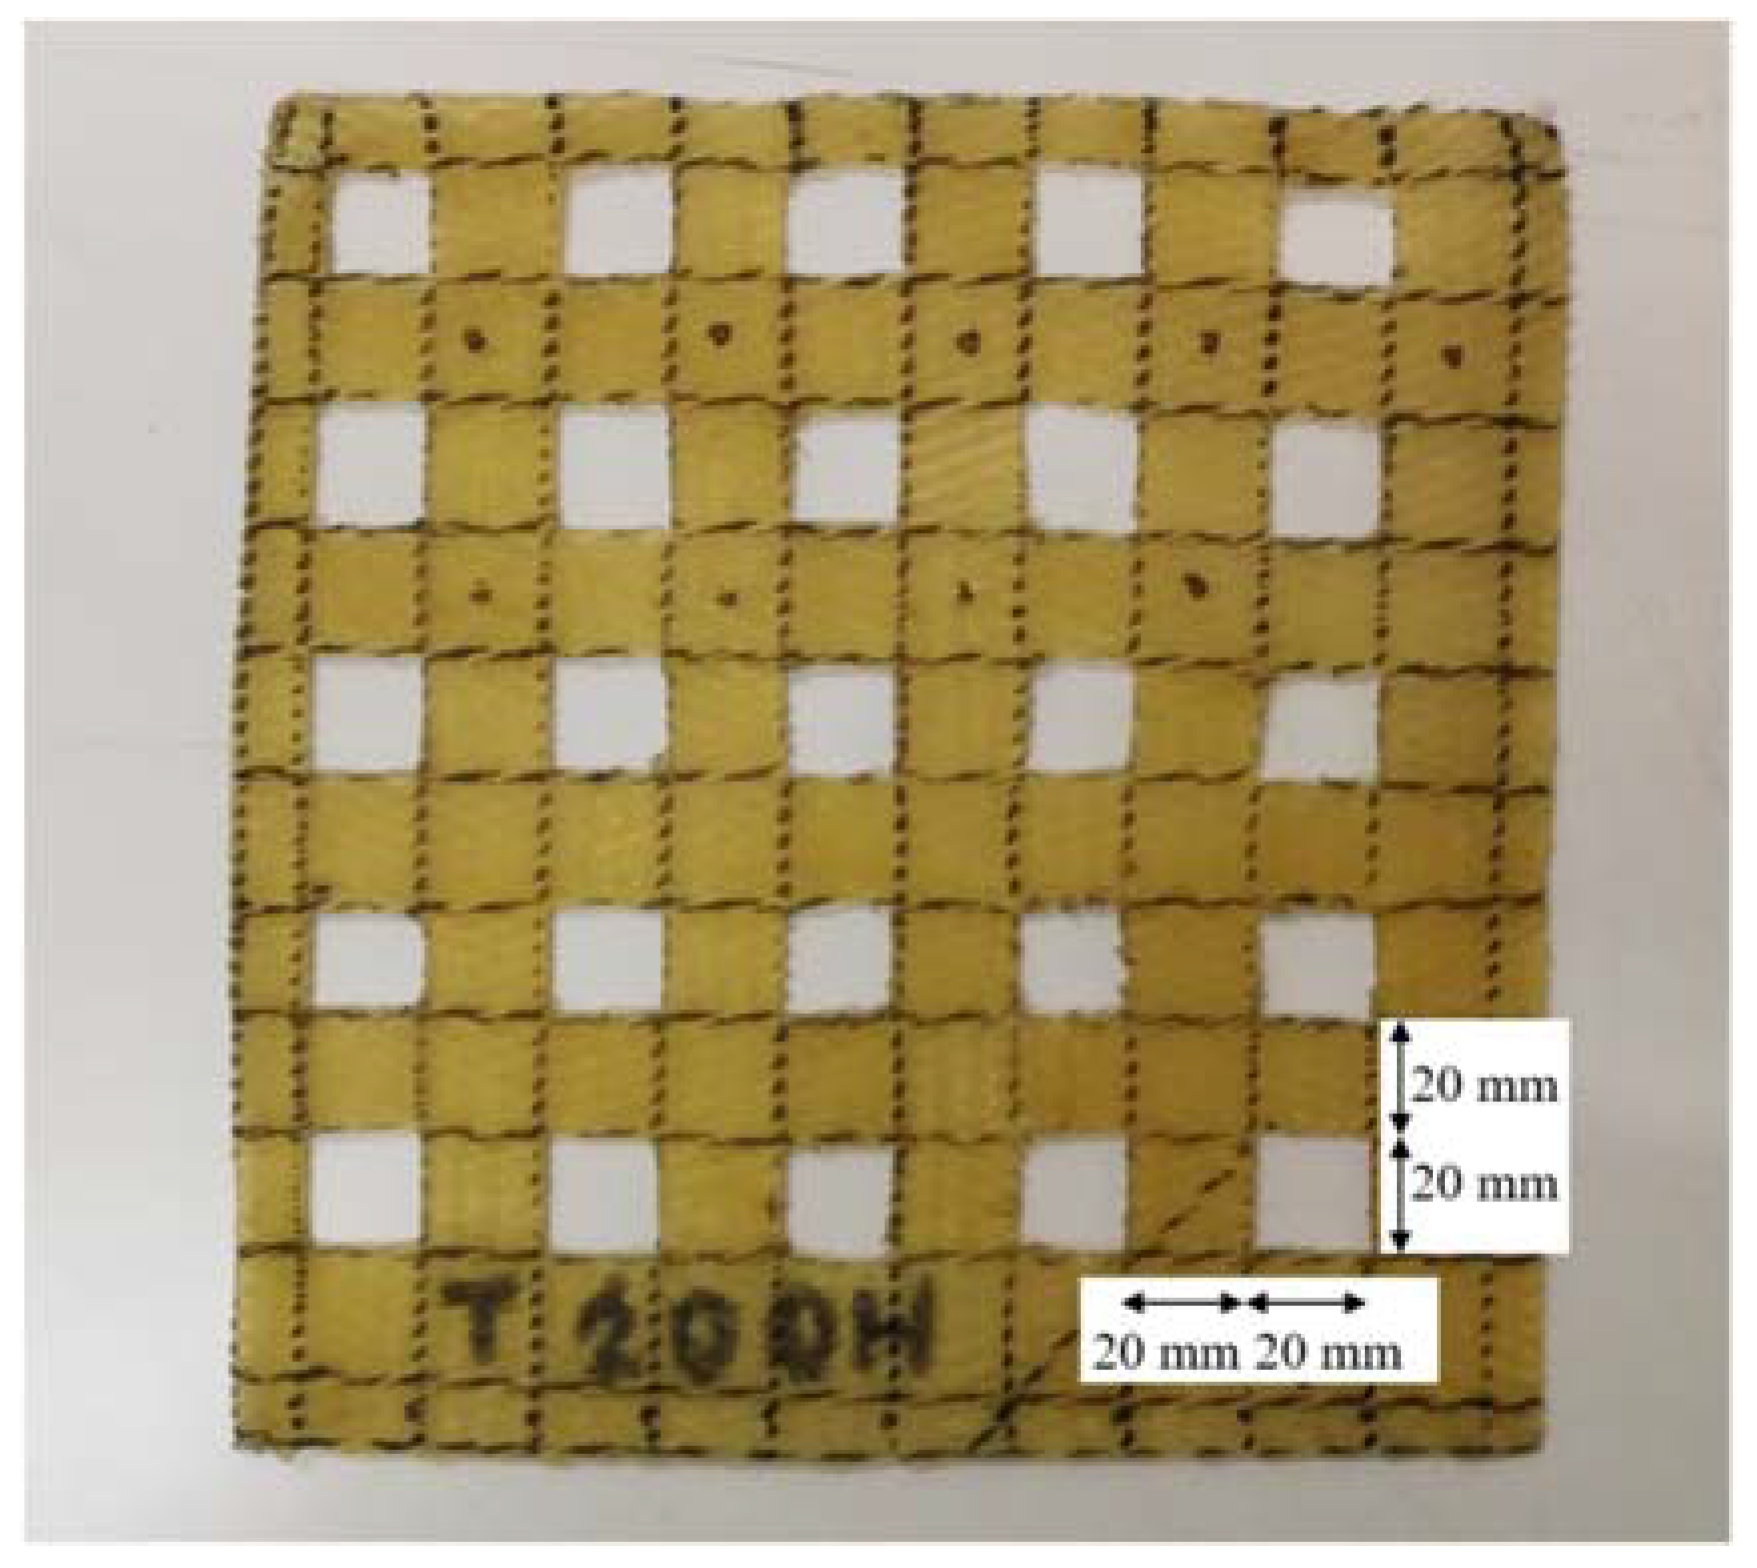
2. Properties of RSS
3. Preliminary Study of RSS as Reinforcing Materials
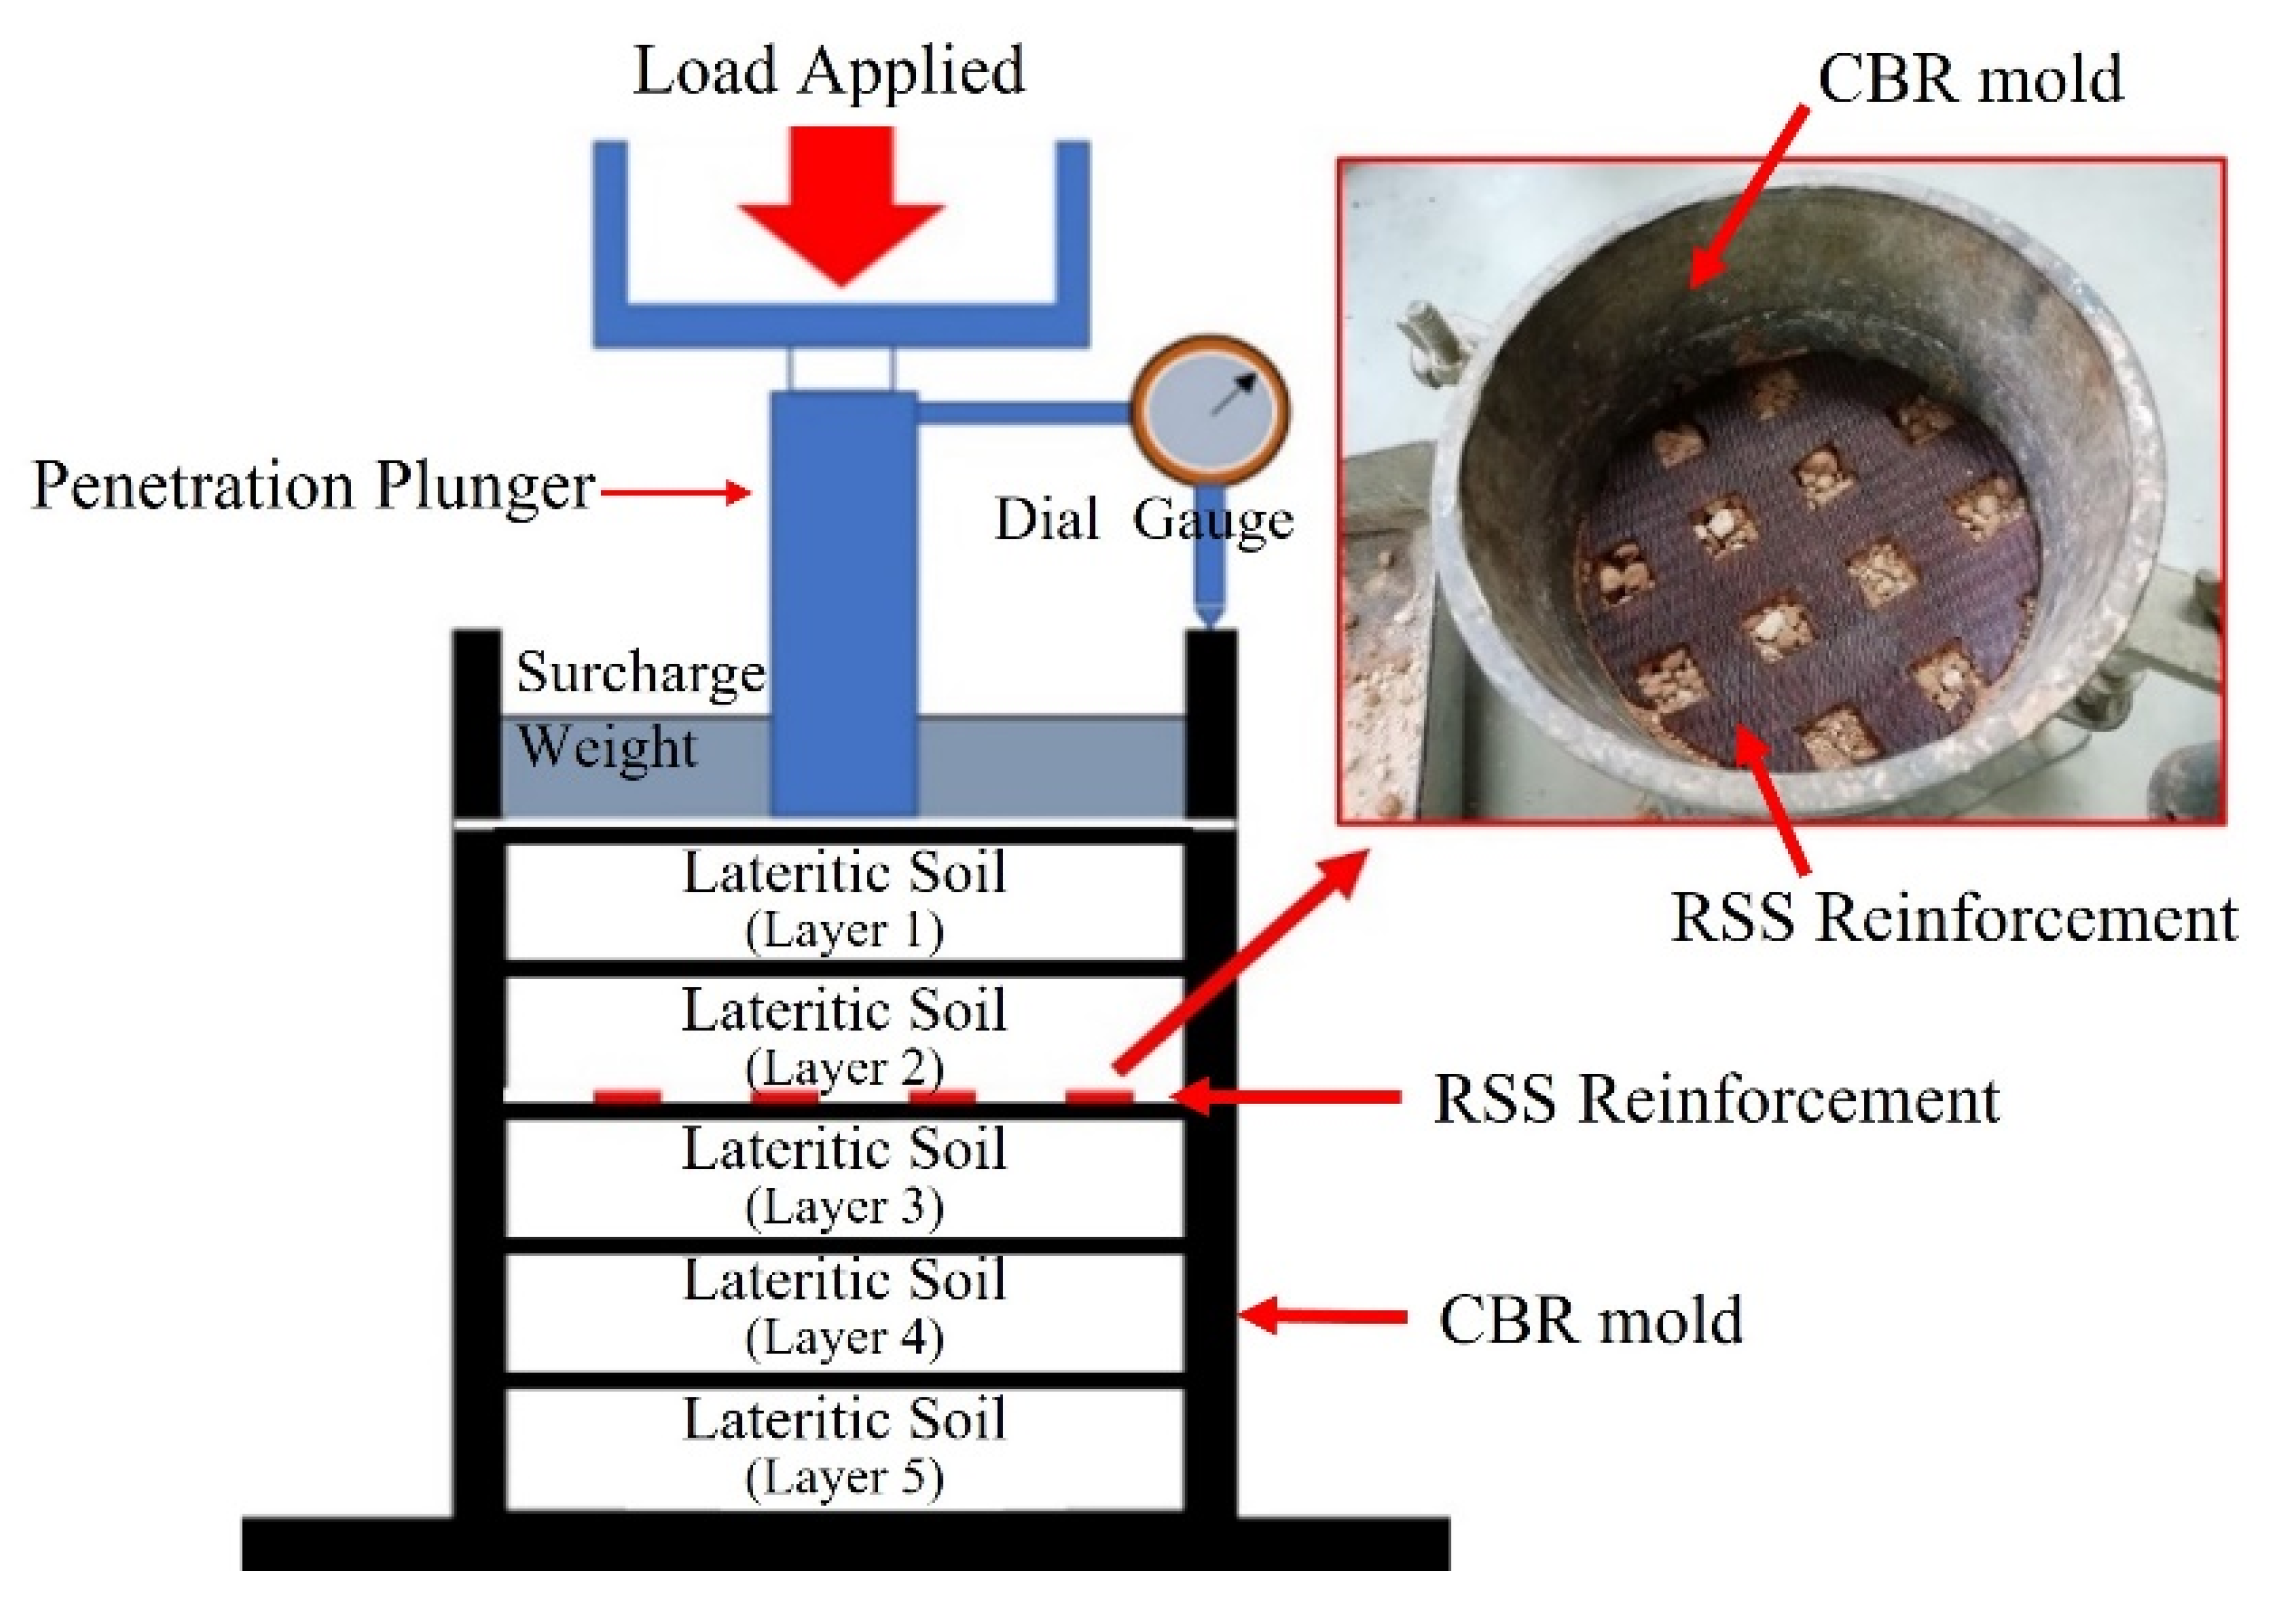
CBR Testing
4. Numerical Simulation
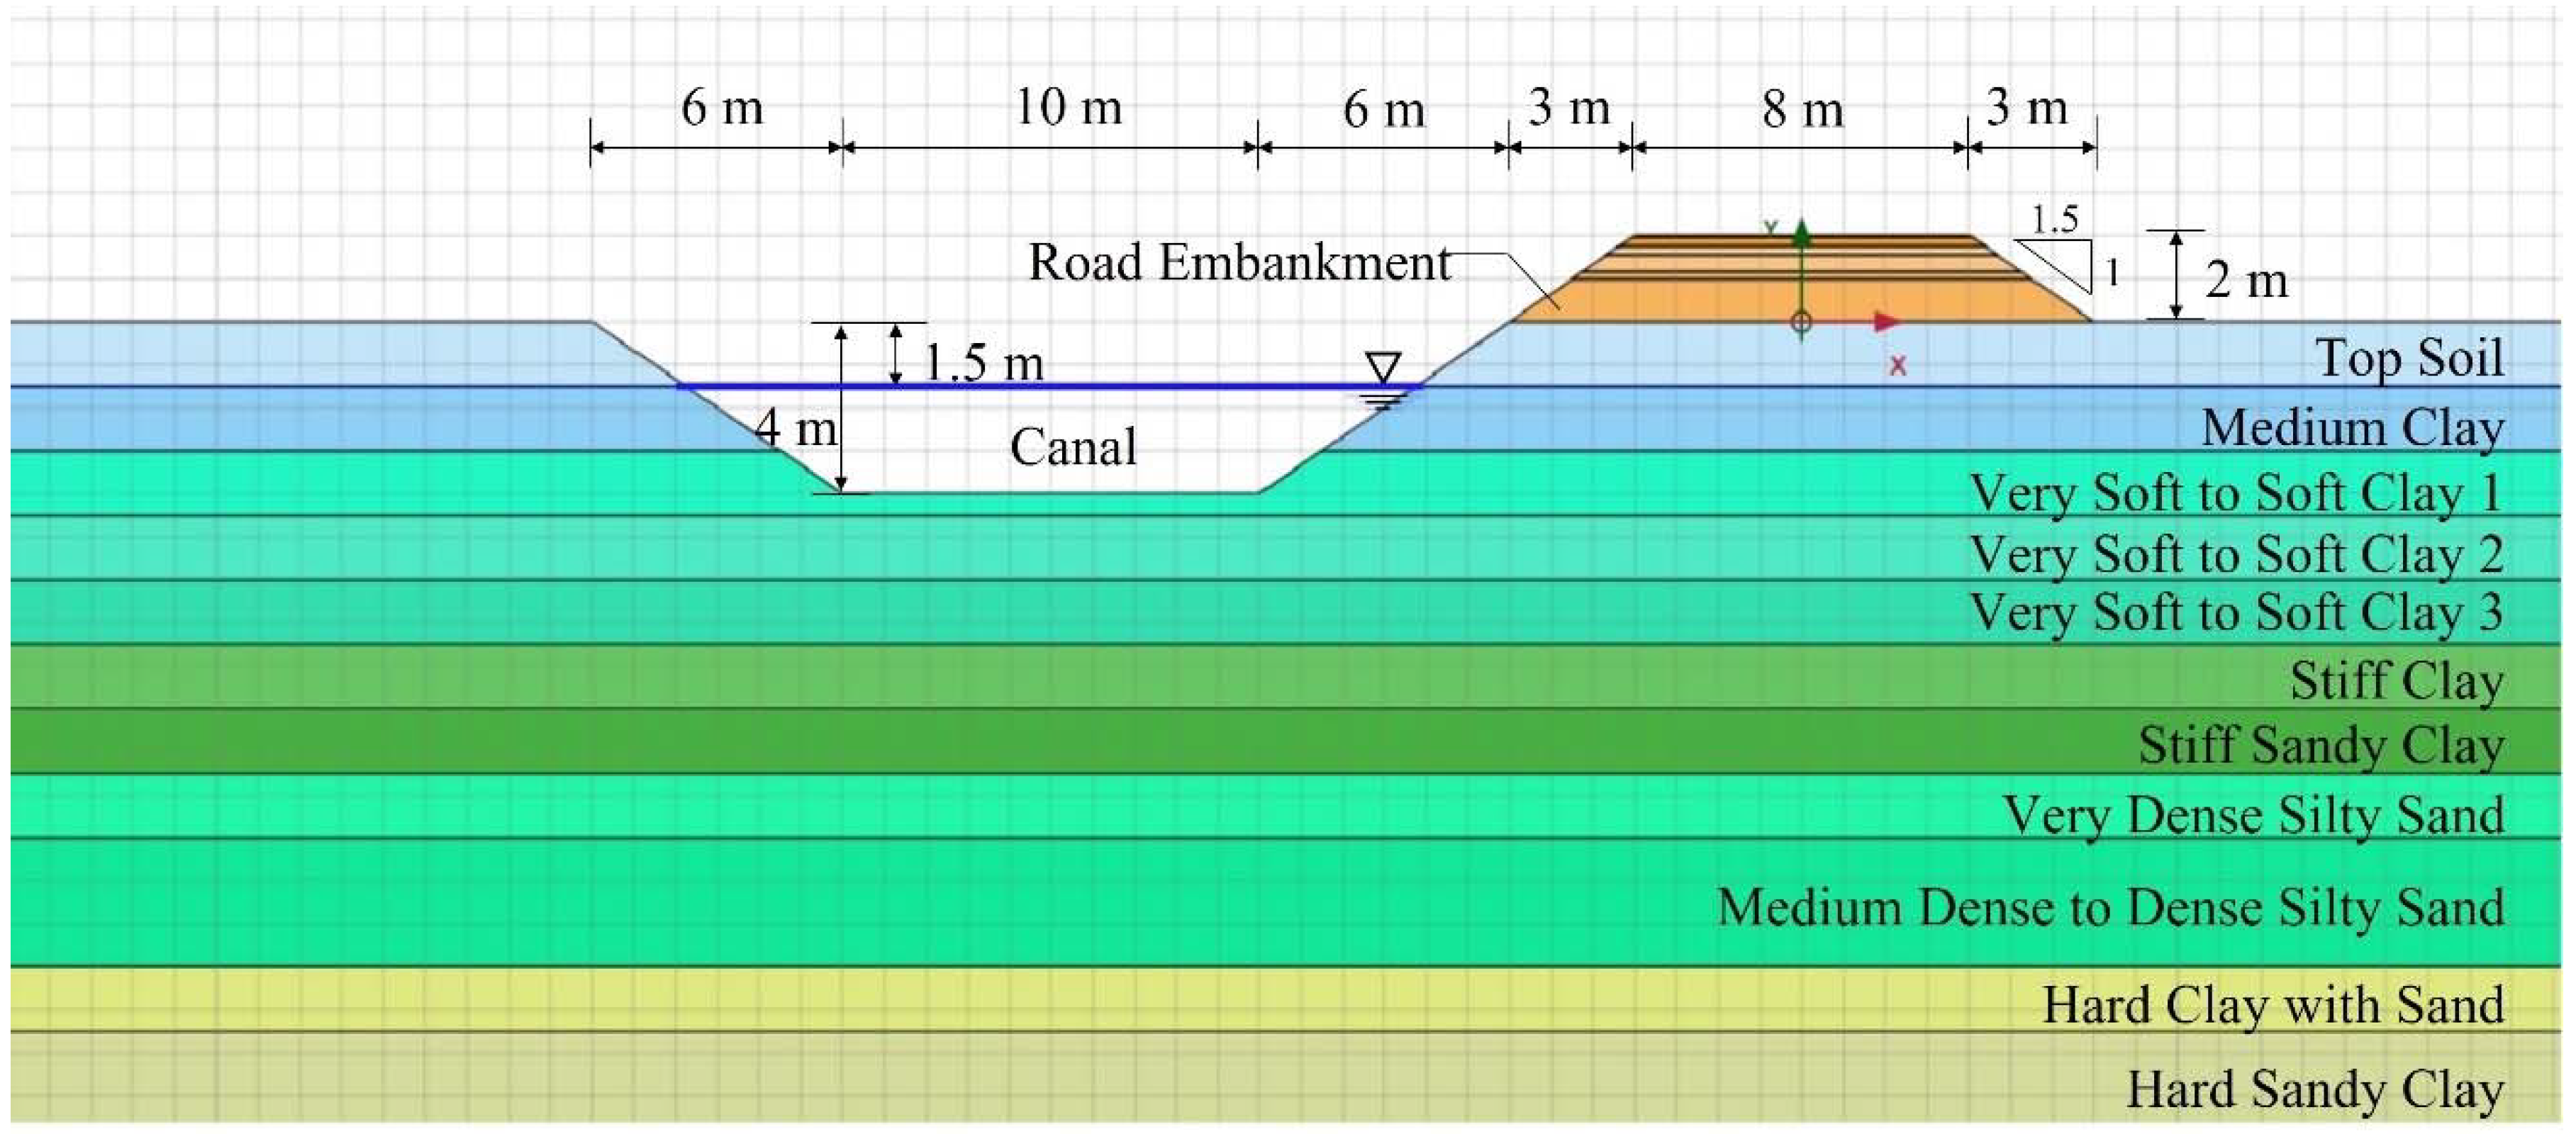
4.1. Validation Site
4.2. Model Geometry and Materials Properties
4.2.1. Geometry of Road Embankment
4.2.2. Subsoil and Road Embankment Properties in FEM Model
4.2.3. RSS Properties in FEM Model
5. Variable Assignment in FEM Model
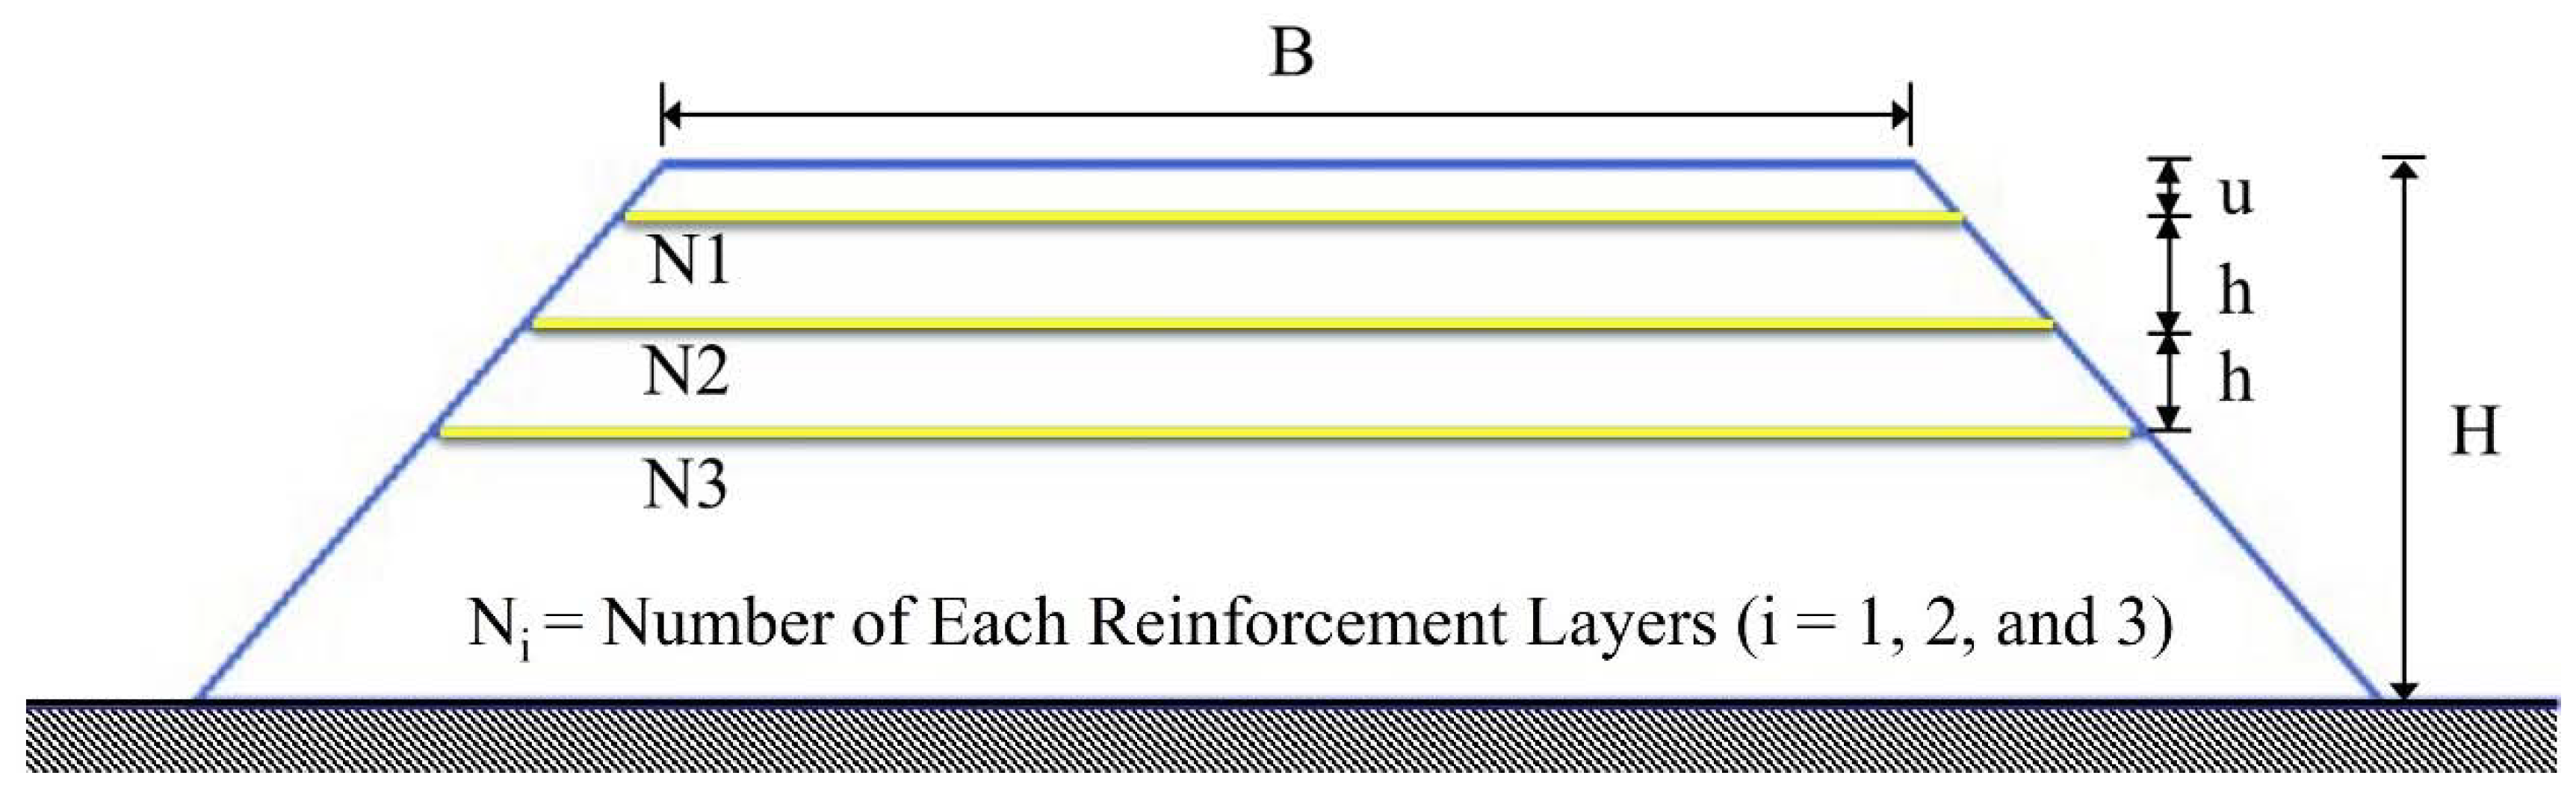
5.1. The Concept of Reinforcement Conditions
- (1)
- A surcharge load acts on the full width of a road embankment (for this study, a surcharge load = 10 kN/m);
- (2)
- H is constant (for this study, H = 2.00 m height);
- (3)
- u, h, and N are different in different positions;
- (4)
- The effect of a side slope is ignored.
5.2. Analysis Conditions
5.3. Factor of Safety Analysis
6. Analysis of Results
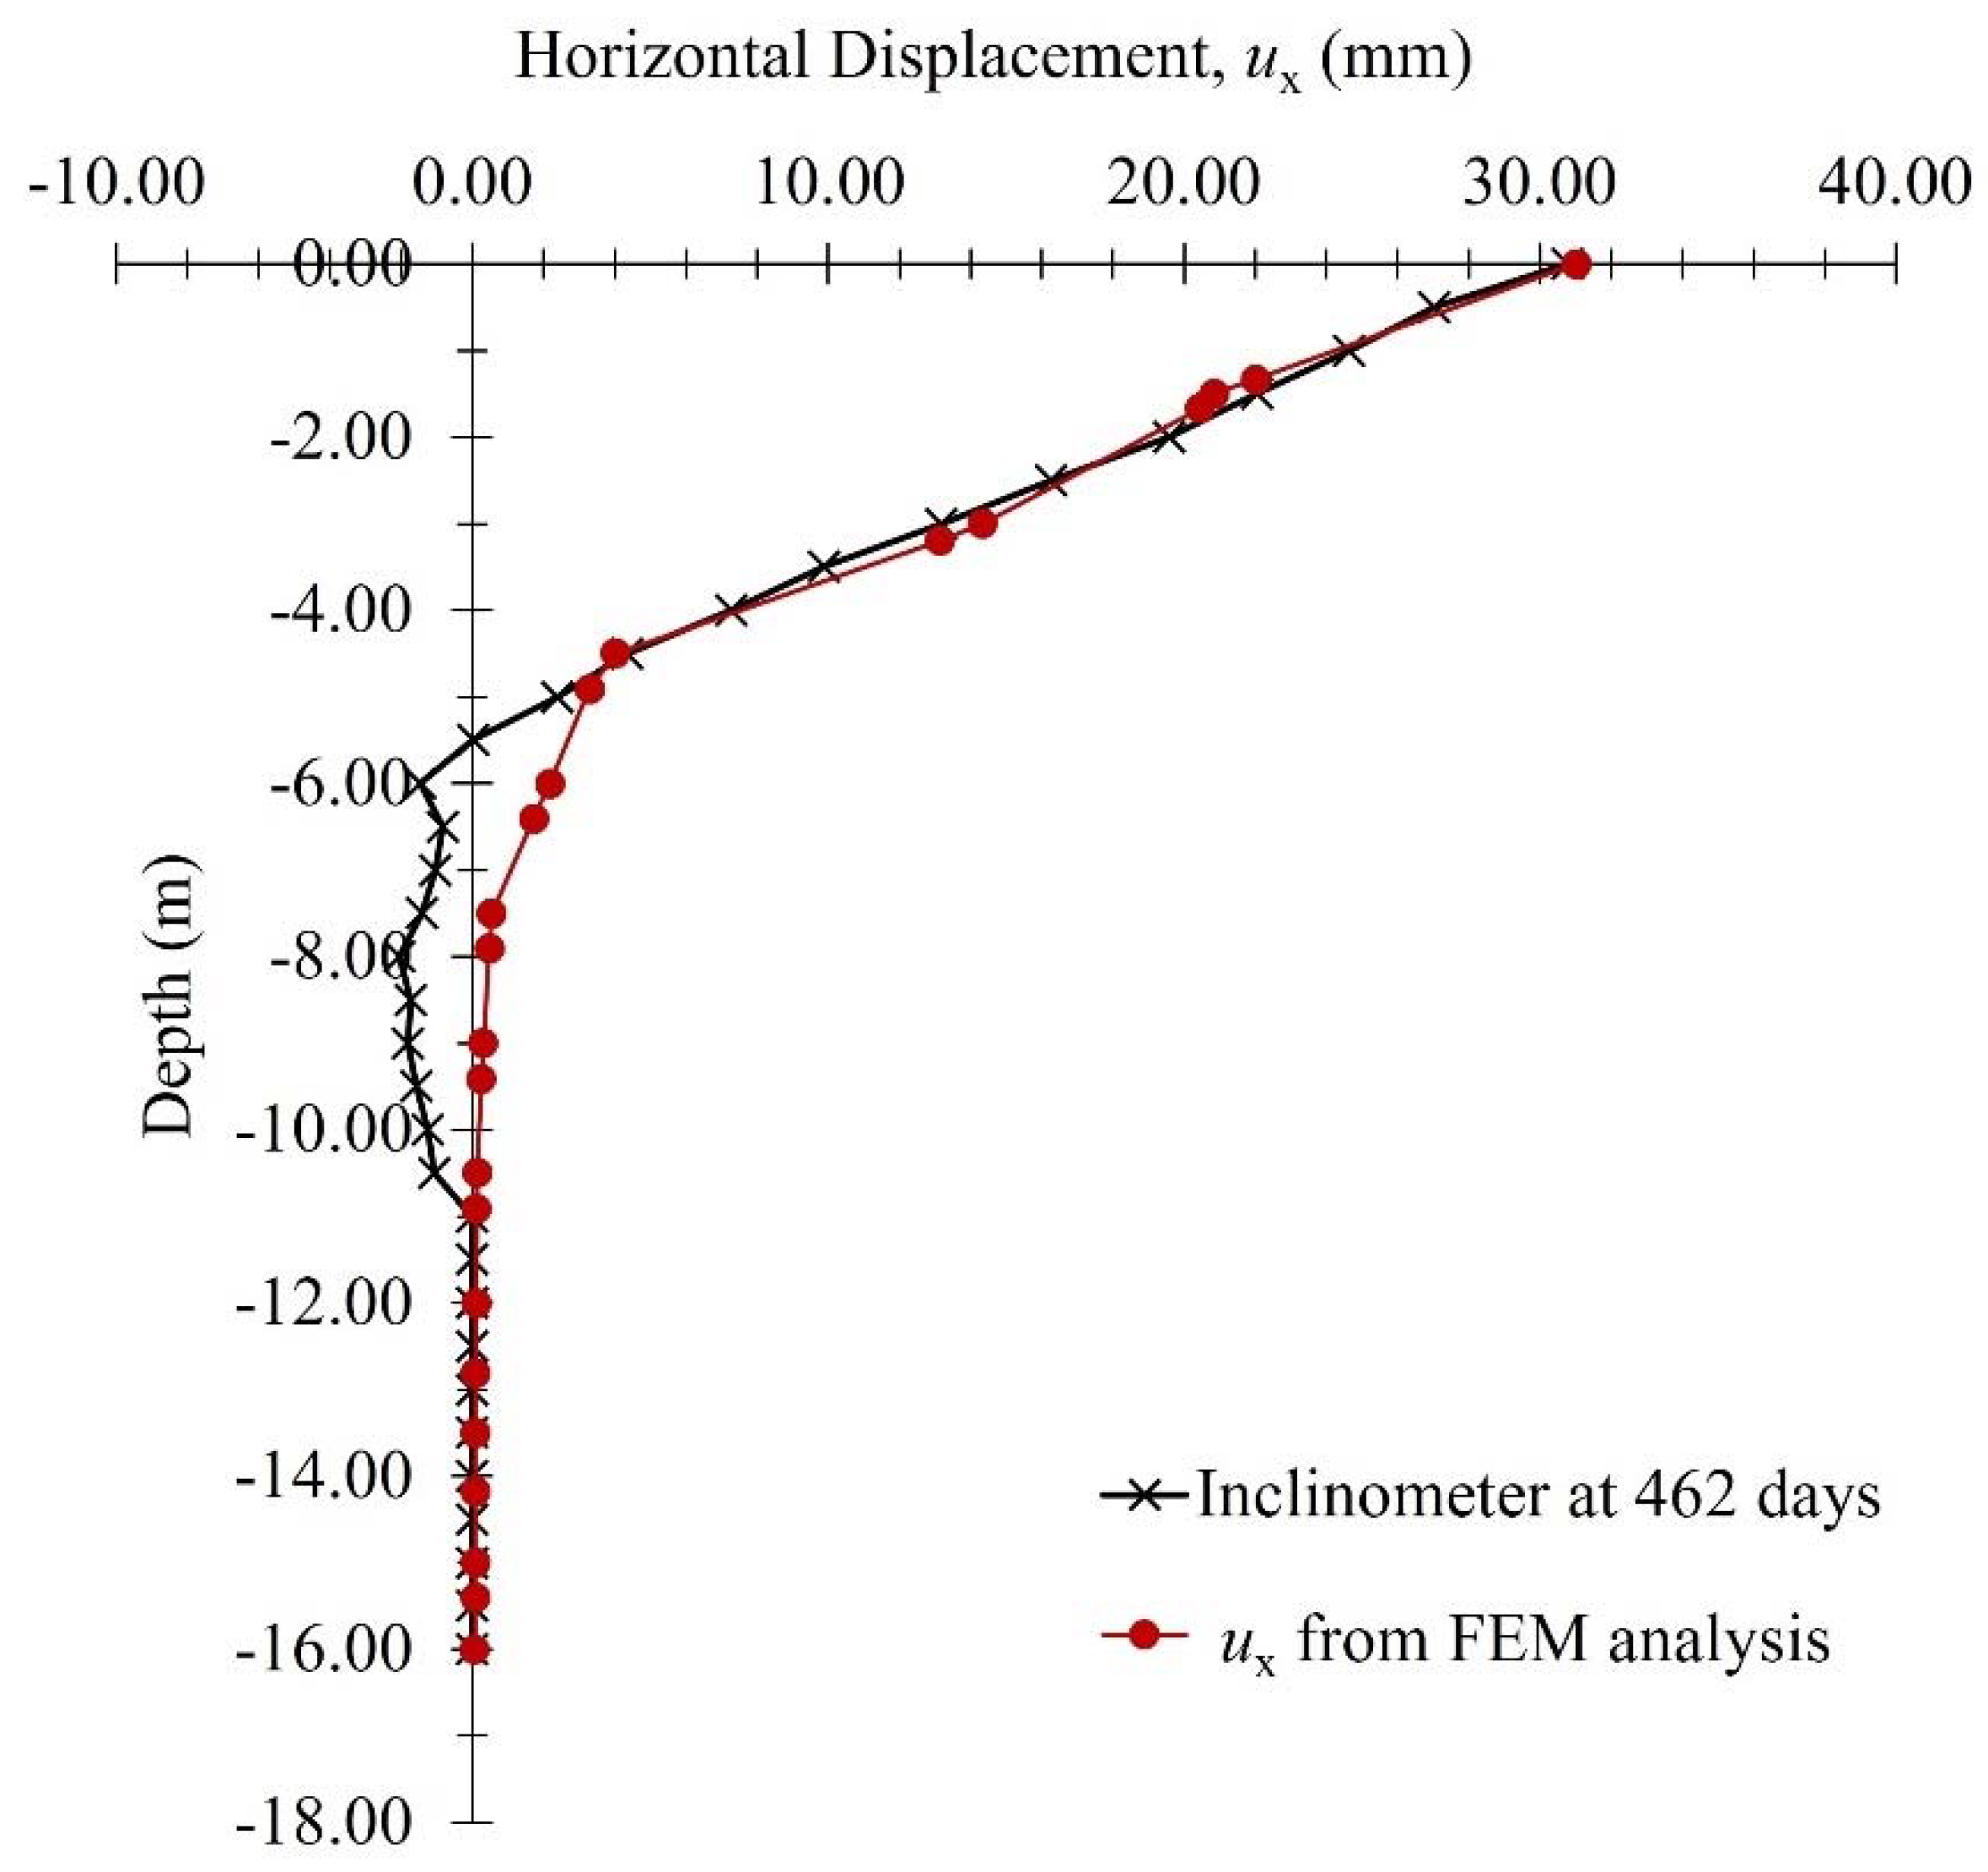
6.1. Model Validation
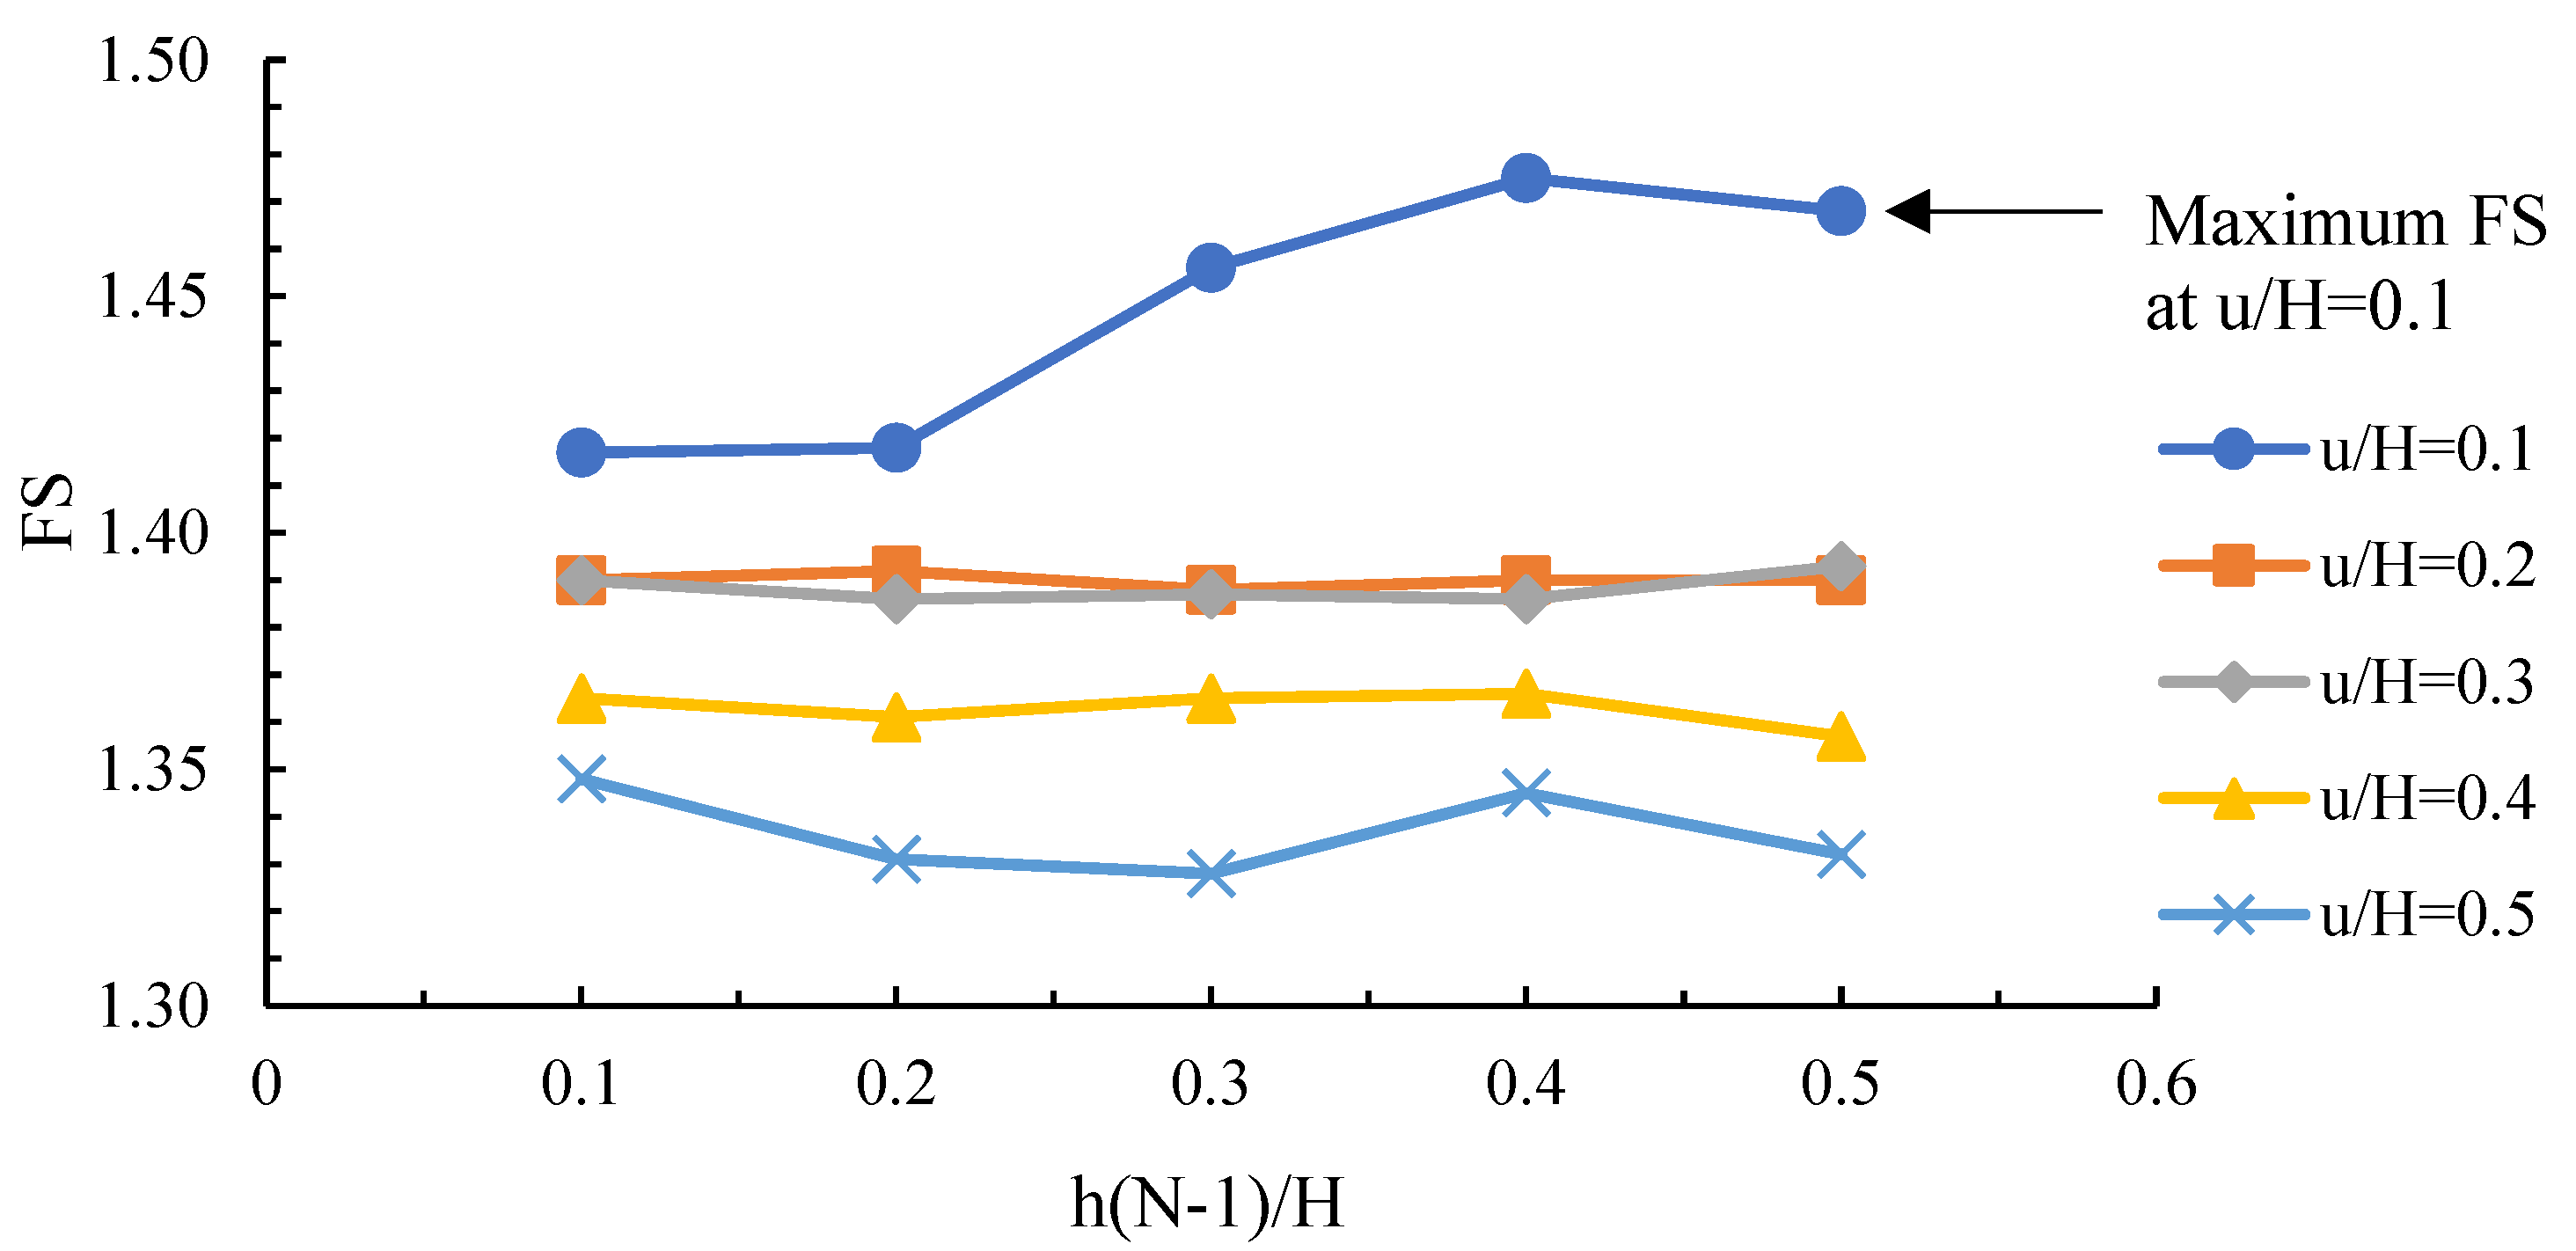
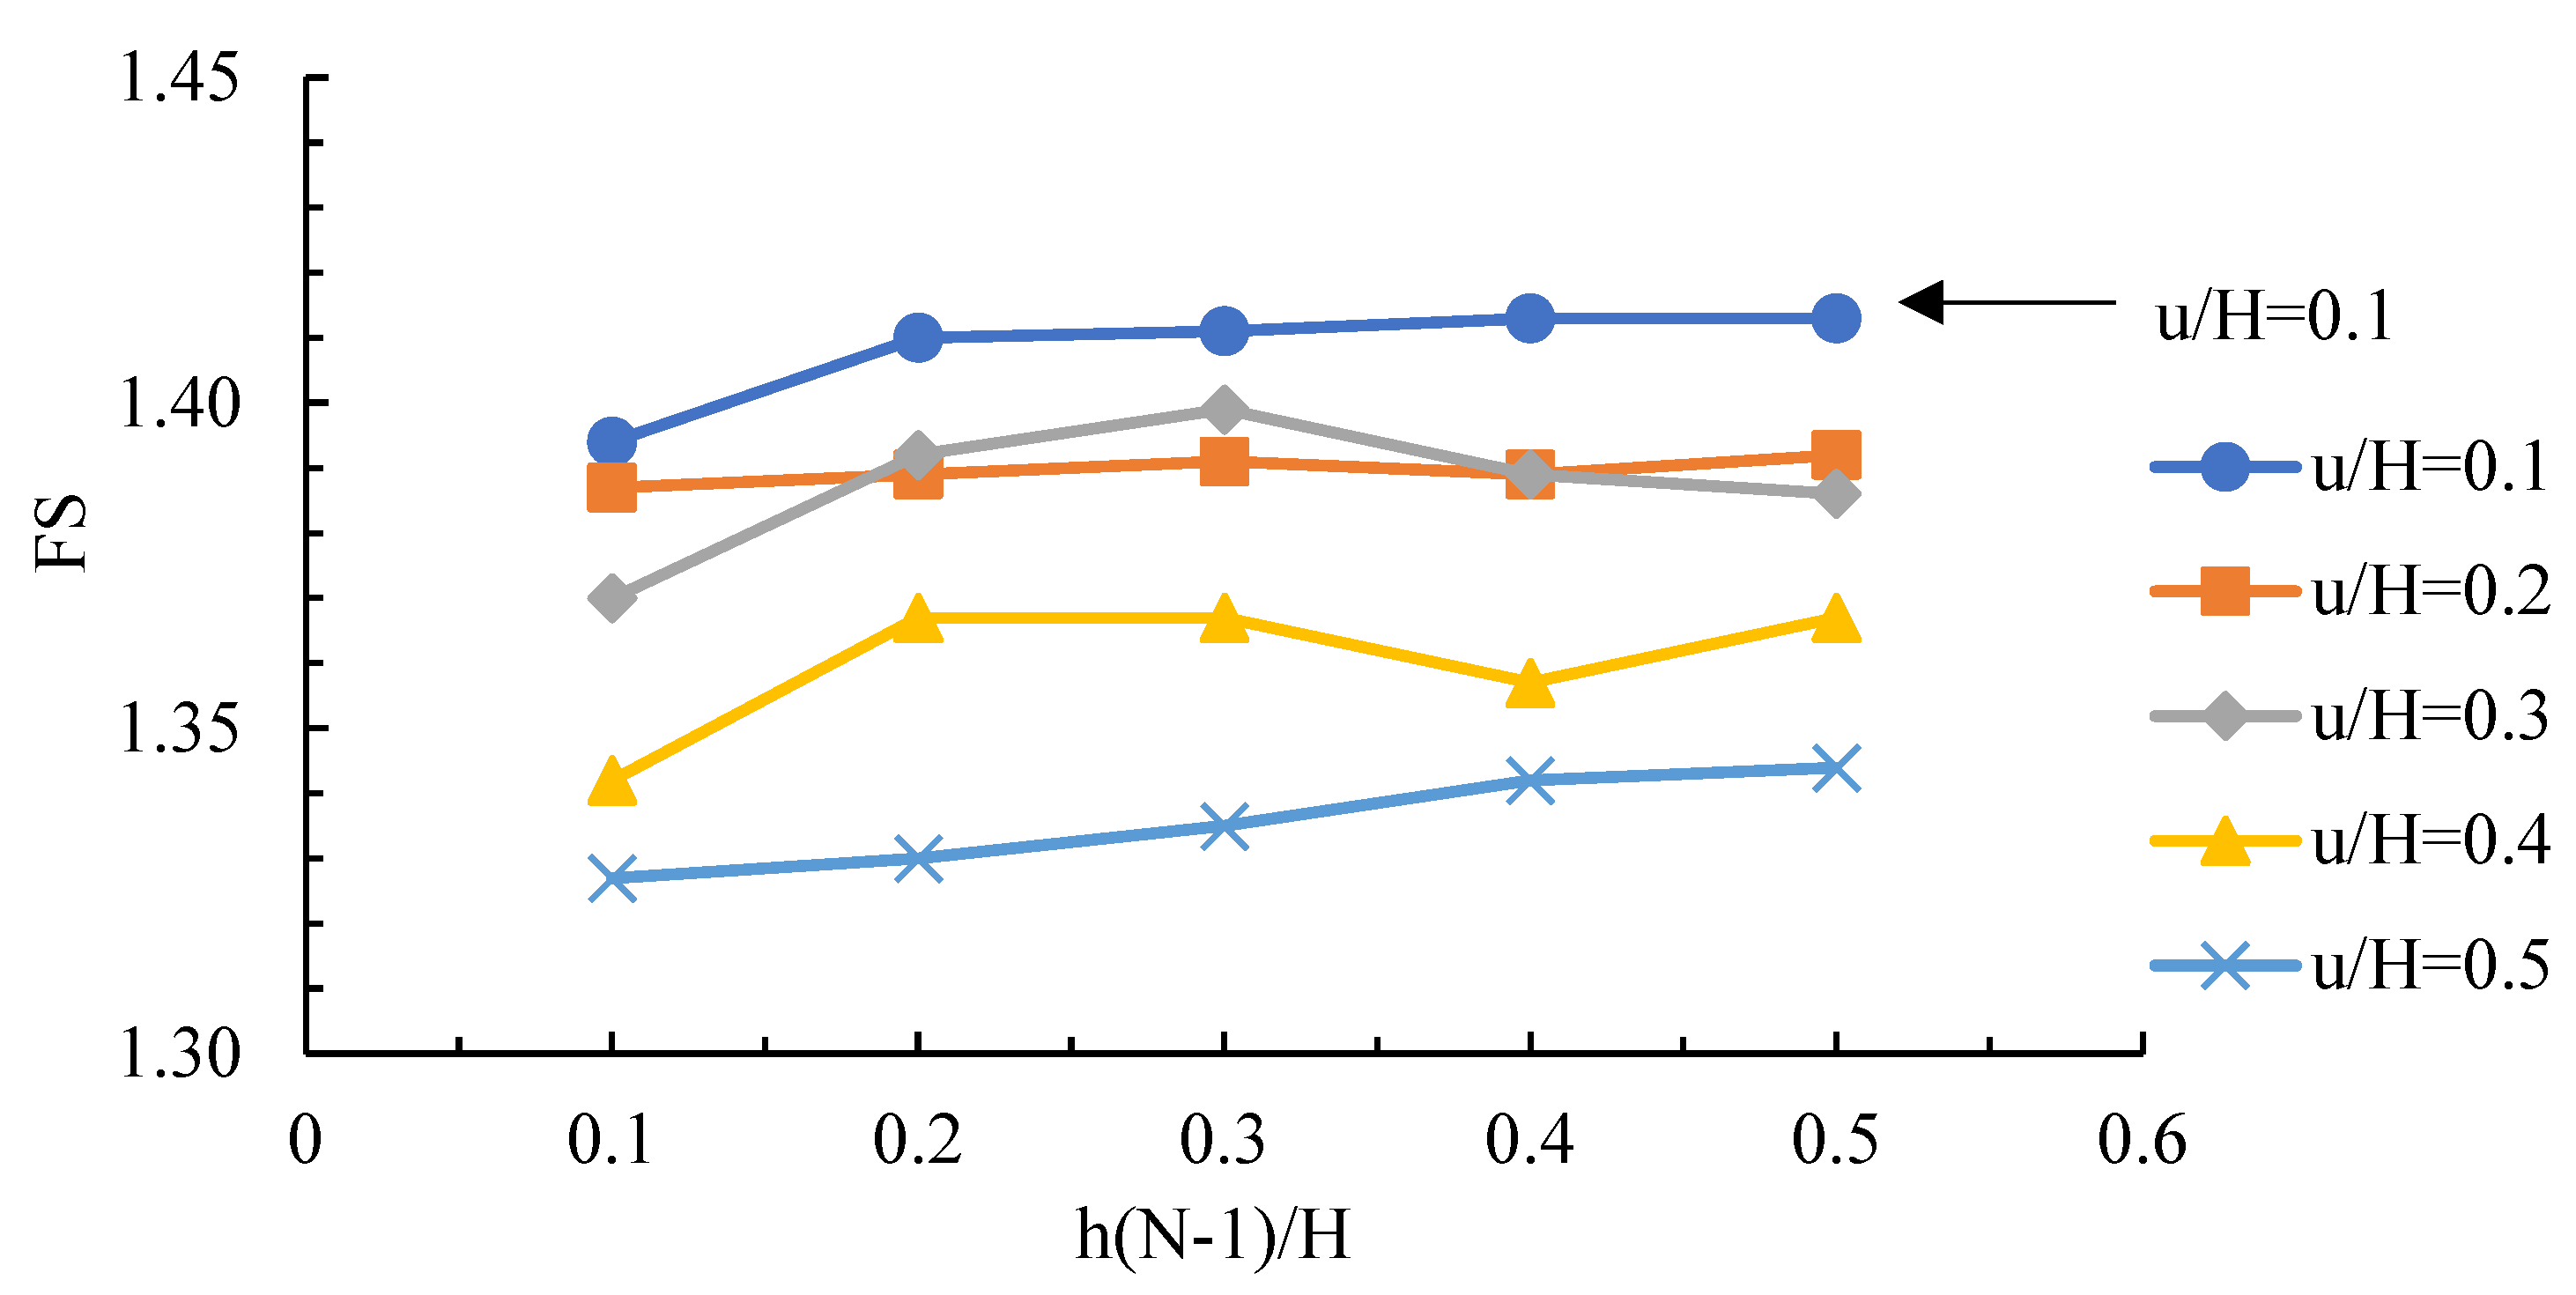
6.2. Optimal Layer and Position of RSS Reinforced Road Embankment
7. Conclusions
Author Contributions
Funding
Institutional Review Board Statement
Informed Consent Statement
Data Availability Statement
Acknowledgments
Conflicts of Interest
References
- Tailor, R.M.; Shah, N.C. Applications of innovative materials for performance improvement of flexible pavement over expansive subgrade. Int. J. Geomate 2015, 8, 1197–1202. [Google Scholar] [CrossRef]
- Shah, M.M.; Afzalur, R.M.; Islam, M.M.; Hossain, M.S. Effectiveness of jute geotextiles in flexible pavement construction. Int. J. Geomate 2016, 10, 1644–1648. [Google Scholar]
- Anitha, J. Effect of geosynthetics on soft subgrade-literature review. Int. Res. J. Eng. Technol. 2017, 4, 1446–1448. [Google Scholar]
- Geogrids in Roadway and Pavement Systems. Available online: https://globalsynthetics.com.au/wp-content/uploads/2016/01/Global-Synthetics-Geogrids-in-Roadway-Pavement-Systems.pdf (accessed on 10 September 2021).
- Moayed, R.Z.; Nazari, M. Effect of utilization of geosynthetic of reducing the required thickness of subbase layer of a two layered soil. World Acad. Sci. Eng. Tech. 2011, 49, 963–967. [Google Scholar]
- Koerner, R.M. Designing with Geosynthetics, 6th ed.; Prentice Hall: Upper Saddle River, NJ, USA, 2012. [Google Scholar]
- Ullagaddi, P.B.; Nagara, T.K. Investigation on geosynthetic reinforced two layered soil system. In Proceedings of the International Conferences on Case Histories in Geotechnical Engineering, Chicago, IL, USA, 2 May 2013. [Google Scholar]
- Goud, N.; Umashankar, B. Planar reinforcements for flexible pavements. In Proceedings of the International Conference on Geotechniques for Infrastructure Project, Thiruvananthapuram, India, 27–28 February 2017. [Google Scholar]
- Ziegler, M. Application of geogrid reinforced constructions: History, recent and future developments. Procedia Eng. 2017, 172, 42–51. [Google Scholar] [CrossRef]
- Olaniyan, O.S.; Akolade, A.S. Reinforcement of subgrade soils with the use of geogrids. Int. J. Sci. Res. 2014, 3, 2579–2584. Available online: https://www.ijsr.net/get_abstract.php?paper_id=2014772 (accessed on 12 October 2021).
- Charles, A.A.; Yaw, A.T.; Samuel, K. Effects of soil properties and geogrid placement on CBR enhancement of lateritic soil for road pavement layers. Am. J. Civ. Eng. Archit. 2016, 4, 62–66. [Google Scholar] [CrossRef]
- El Sawwaf, M. Behavior of strip footing on geogrid reinforced sand over a soft clay slope. Geotext. Geomembr. 2007, 25, 50–60. [Google Scholar] [CrossRef]
- Alamshahi, S.; Hataf, N. Bearing capacity of strip footings on sand slopes reinforced with geogrid and grid anchors. Geotext. Geomembr. 2009, 27, 217–226. [Google Scholar] [CrossRef]
- Esmaeili, M.; Naderi, B.; Neyestanaki, H.K.; Khodaverdian, A. Investigating the effect of geogrid on stabilization of high railway embankments. Soils Found. 2018, 58, 319–332. [Google Scholar] [CrossRef]
- Artidteang, S.; Bergado, D.T.; Chaiyaput, S.; Tanchaisawat, T. Embankment reinforced with limited life geotextiles on soft clay. Proc. Inst. Civ. Eng. Ground Improv. 2015, 168, 130–143. [Google Scholar] [CrossRef]
- Artidteang, S.; Tanchaisawat, T.; Bergado, D.T.; Chaiyaput, S. Natural fibers in reinforcement and erosion control applications with limited life geosynthetics. In Ground Improvement Case Histories: Compaction, Grouting and Geosynthetics; Elsevier: Amsterdam, The Netherlands, 2015; pp. 717–740. [Google Scholar] [CrossRef]
- Ismail, H.; Ahmad, Z.; Mohd Ishak, Z.A. Comparison of cetyltrimethylammonium maleate and sulphenamide as an accelerator in carbon black filled natural rubber compounds. Polym. Test. 2001, 20, 607–614. [Google Scholar] [CrossRef]
- Hayashi, Y. Production of natural rubber from Para rubber tree. Plant Biotechnol. J. 2009, 26, 67–70. [Google Scholar] [CrossRef] [Green Version]
- Morton, M. Rubber Technology; Springer Science and Business Media: Boston, MA, USA, 2013. [Google Scholar]
- Deepanya, V.; Suveero, K. Floor tiles made from the mixture of para rubber and plastic wastes from factories. J. Community Dev. Life Qual. 2018, 4, 451–460. [Google Scholar]
- Khamput, P.; Suweero, K. Using of para-rubber to develop properties of concrete block mixed with ethylene vinyl acetate plastic in masonry. Int. J. Environ. Rural Dev. 2014, 5, 86–92. [Google Scholar]
- Pinwiset, K.; Raksuntorn, W.; Witchayangkoon, B. An investigation and test of natural rubber latex soil cement road. Int. Trans. J. Eng. Manag. App. Sci. Technol. 2018, 9, 67–74. [Google Scholar] [CrossRef]
- Pahusuwanno, S.; Inkliang, K.; Hanhongart, B. A study of para soil cement road construction. In Proceedings of the 11th THAICID National Symposium, Nontaburi, Thailand, 20 June 2018. (In Thai). [Google Scholar]
- Rubber Authority of Thailand. Available online: https://www.rubber.co.th/download/technical_data_of_rubber_61.pdf (accessed on 1 September 2021). (In Thai)
- Han, B.; Ling, J.; Shu, X.; Gong, H.; Huang, B. Laboratory investigation of particle size effects on the shear behavior of aggregate-geogrid interface. Constr. Build. Mater. 2017, 158, 1015–1025. [Google Scholar] [CrossRef]
- ASTM D5199-12; Standard Test Method for Measuring the Nominal Thickness of Geosynthetics. Annual Book of ASTM Standard. ASTM International: Philadelphia, PA, USA, 2019.
- ASTM D4595-17; Standard Test Method for Tensile Properties of Geotextiles by the Wide-Width Strip Method. Annual Book of ASTM Standard. ASTM International: Philadelphia, PA, USA, 2017.
- Al-Omari, R.R.; Fekheraldin, M.K. Measurement of tensile properties of geogrids. In Proceedings of the 2nd International Conference on Geotechnique, Construction Materials and Environment, Kuala Lumpur, Malaysia, 14–16 November 2012. [Google Scholar]
- DH-S 205/2532The Standard of Subbase Course. Standards for Highway Construction; Department of Highway: Bangkok, Thailand, 1989. (In Thai)
- Ruedeeviroj, S.; Duangdeun, P. Effect of gradation and fine particles in soil mass on engineering properties of lateritic soil mixed with fly ash. In Proceedings of the 10th National Convention on Civil Engineering, (In Thai). Pataya, Thailand, 2–4 May 2005. [Google Scholar]
- AASHTO T 89; Standard Method of Test for Determining the Liquid Limit of Soils. American Association of State Highway and Transportation Officials (AASHTO): Washington, DC, USA, 2013.
- AASHTO T 90; Standard Method of Test for Determining the Plastic Limit and Plasticity Index of Soils. American Association of State Highway and Transportation Officials (AASHTO): Washington, DC, USA, 2020.
- ASTM D1883-99; Standard Test Method for CBR (California Bearing Ratio) of Laboratory-Compacted Soils. ASTM International: West Conshohocken, PA, USA, 1999.
- ASTM D1557-07; Standard Test Methods for Laboratory Compaction Characteristics of Soil Using Modified Effort (56,000 ft-lbf/ft3 (2700 kN-m/m3)). ASTM International: West Conshohocken, PA, USA, 2007.
- Ahmed Kamel, M.; Chandra, S.; Kumar, P. Behaviour of subgrade soil reinforced with geogrid. Int. J. Pavement Eng. 2004, 5, 201–209. [Google Scholar] [CrossRef]
- Nagrale, P.P.; Sawant, P.H.; Pusadkar, S.S. Laboratory investigation of reinforced sub grade soils. In Proceedings of the Indian Geotechnical Conference, Mumbai, India, 16–18 December 2010. [Google Scholar]
- Saad, F.I.; Namir, G.A.; Dhuha, E.M. Effect of reinforcement on improve surface pavement for weak subgrade conditions. Int. J. Geomate 2016, 1, 2188–2193. [Google Scholar]
- Udomchai, A.; Hoy, M.; Horpibulsuk, S.; Chinkulkijniwat, A.; Arulrajah, A. Failure of riverbank protection structure and remedial approach: A case study in Suraburi province, Thailand. Eng. Fail. Anal. 2018, 91, 243–254. [Google Scholar] [CrossRef]
- Chaiyaput, S.; Suksawat, T.; Ayawanna, J. Evaluation of the road failure using resistivity and screw driving sounding testing techniques: A case study in Ang Thong province, Thailand. Eng. Fail. Anal. 2021, 121, 105171. [Google Scholar] [CrossRef]
- Chaiyaput, S.; Sutti, N.; Suksawat, T.; Ayawanna, J. Electrical Resistivity Survey for Evaluating the Undrained Shear Strength of Soft Bangkok Clay at Some of the Canal-Side Road Investigation Sites. Bull. Eng. Geol. Environ. 2022, 81, 27. [Google Scholar] [CrossRef]
- Chaiyaput, S.; Bergado, D.T. Reconfirmation of Skempton-Bjerrum 2D to 3D Settlement Conversion using FEM of Full Scale Embankments. Lowl. Technol. Int. 2018, 20, 1–14. [Google Scholar]
- Chaiyaput, S.; Bergado, D.T.; Artidteang, S. Measured and Simulated Results of a Kenaf Limited Life Geosynthetics (LLGs) Reinforced Test Embankment on Soft Clay. Geotext. Geomembr. 2014, 42, 39–47. [Google Scholar] [CrossRef]
- PLAXIS Vietnam Seminar. Advanced Computational Geotechnics; PLAXIS Vietnam Seminar: Ho Chi Minh City, Vietnam, 2008. [Google Scholar]
- Likitlersuang, S.; Surarak, C.; Wanatowski, D.; Oh, E.; Balasubramaniam, A. Finite element analysis of a deep excavation: A case study from the Bangkok MRT. Soils Found. 2013, 53, 756–773. [Google Scholar] [CrossRef] [Green Version]
- Wulandari, P.S.; Tjandra, D. Analysis of geotextile reinforced road embankment using PLAXIS 2D. Procedia Eng. 2015, 125, 358–362. [Google Scholar] [CrossRef] [Green Version]
- Vermeer, P.A.; Brinkgreve, R.B.J. Finite Element Code for Soil and Rock Analysis; A.A. Balkema: Rotterdam, The Netherland, 1995. [Google Scholar]
- Brinkgreve, R.B.J.; Vermeer, P.A. PLAXIS-Finite Element Code for Soil and Rock Analyses; Plaxis BV. Balkema: Rotterdam, The Netherland, 1998. [Google Scholar]


| Sieve Size | Percent Passing by Weight (%) | ||||||
|---|---|---|---|---|---|---|---|
| Standard of DH-S 205/2532 | In This Research | ||||||
| Grade A | Grade B | Grade C | Grade D | Grade E | Grade E1 | Grade E2 | |
| 2″ (50.00 mm) | 100 | 100 | - | - | - | - | - |
| 1″ (25.00 mm) | - | - | 100 | 100 | 100 | 100 | 100 |
| 3/8″ (9.50 mm) | 30–65 | 40–75 | 50–85 | 60–100 | - | - | - |
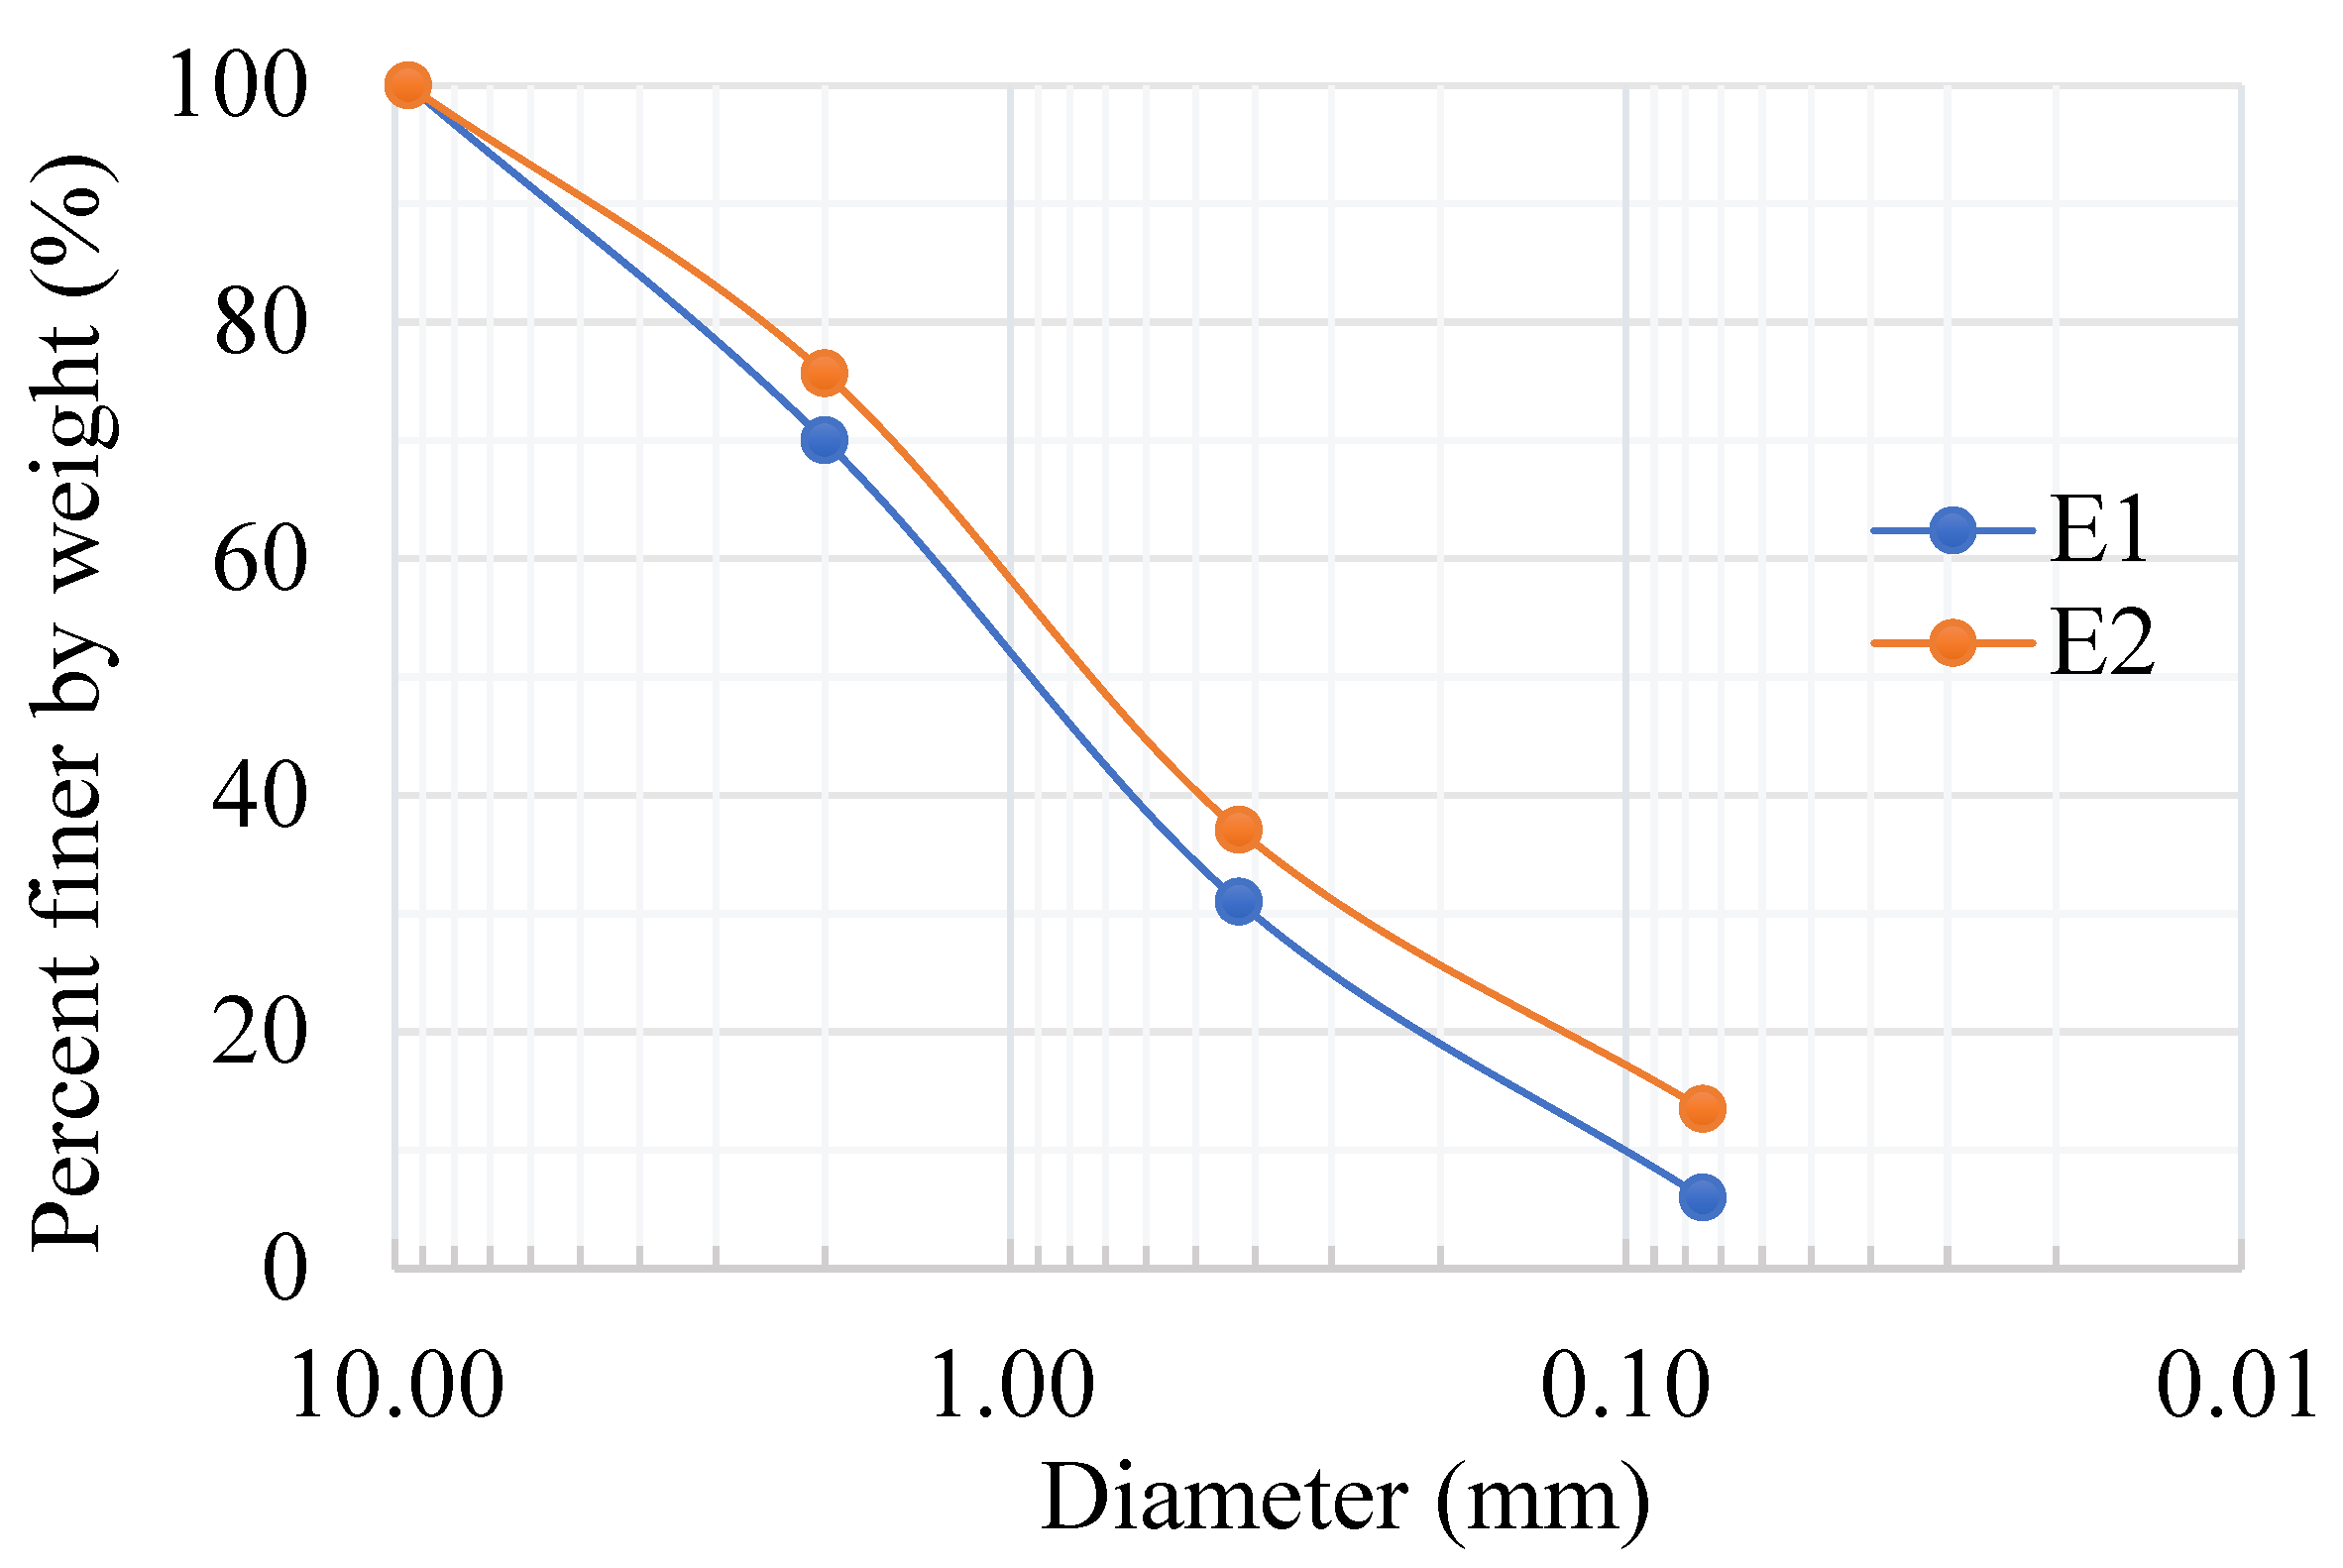
| No. 10 (2.00 mm) | 15–40 | 20–45 | 25–50 | 40–70 | 40–100 | 70 | 75.67 |
| No. 40 (0.425 mm) | 8–20 | 15–30 | 15–30 | 25–45 | 20–50 | 31 | 37.10 |
| No. 200 (0.075 mm) | 2–8 | 5–20 | 5–15 | 5–20 | 6–20 | 6 | 13.51 |
| Soil Types | Testing Conditions | CBR (%) | Percentage Difference (%) | |
|---|---|---|---|---|
| High CBR | Non-reinforced | (E1) | 64.53 | −0.34(Decreased) |
| Reinforced 1 layer | (E1-RSS) | 64.31 | ||
| Low CBR | Non-reinforced | (E2) | 40.56 | +23.15(Increased) |
| Reinforced 1 layer | (E2-RSS) | 49.95 | ||
| Materials | Depth (m) | Model | Behaviors | (kN/m3) | (kN/m3) | (kPa) | (kPa) | (°) | OCR | |||
|---|---|---|---|---|---|---|---|---|---|---|---|---|
| Subsoil | ||||||||||||
| Top soil | 0–1.5 | SSM | Undrained | 15.0 | 13.0 | 0.17 | 0.020 | 14 | 25 | 1.2 | ||
| Medium clay | 1.5–3.0 | SSM | Undrained | 16.5 | 14.5 | 0.12 | 0.020 | 15 | 25 | 1.2 | ||
| Very soft to soft clay 1 | 3.0–4.5 | SSM | Undrained | 15.0 | 13.0 | 0.10 | 0.009 | 14 | 25 | 1.2 | ||
| Very soft to soft clay 2 | 4.5–6.0 | SSM | Undrained | 15.0 | 13.0 | 0.03 | 0.009 | 10 | 25 | 1.2 | ||
| Very soft to soft clay 3 | 6.0–7.5 | SSM | Undrained | 15.0 | 13.0 | 0.03 | 0.009 | 10 | 25 | 1.2 | ||
| Stiff clay | 7.5–9.0 | MCM | Undrained | 21.0 | 19.0 | 19,000 | 0.25 | 95 | ||||
| Stiff sandy clay | 9.0–10.5 | MCM | Undrained | 21.0 | 19.0 | 21,000 | 0.25 | 105 | 10 | |||
| Very dense silty sand | 10.5–12.0 | MCM | Drained | 22.0 | 20.0 | 53,000 | 0.30 | 5 | 40 | |||
| Medium dense to dense silty sand | 12.0–15.0 | MCM | Drained | 22.0 | 20.0 | 53,000 | 0.30 | 5 | 35 | |||
| Hard clay with sand | 15.0–16.5 | MCM | Undrained | 21.0 | 19.0 | 30,000 | 0.25 | 150 | 10 | |||
| Hard sandy clay | 16.5–19.0 | MCM | Undrained | 22.0 | 20.0 | 54,000 | 0.25 | 270 | 10 | |||
| Road Embankment [45] | ||||||||||||
| Materials | Model | Behaviors | (kN/m3) | (kN/m3) | (kPa) | ψ(°) | ||||||
| Fill material | MCM | Drained | 18.0 | 18.00 | 50,000 | 0.3 | 3.00 | 0.8 | ||||
| Material | Mesh Type | Apertures Size (mm) | Thickness (mm) | Ultimate Tensile Strength, Tult (kN/m) | Axial Stiffness, EA (kN/m) |
| RSS—geogrid | Rectangular apertures | 20 × 20 | 7.591 | 1.313 | 3.460 |
| No. of RSS Layers, N | Conditions | Reinforcing Positions | ||||||
|---|---|---|---|---|---|---|---|---|
| Spacing | From the Road Surface | From the Ground Surface (m) | ||||||
| h(N − 1) | h(m) | u | u (m) | N1 | N2 | N3 | ||
| N = 0 | N0 | - | - | - | - | - | - | - |
| N = 1 | N1-u1 | - | - | 0.1H | 0.20 | 1.80 | - | - |
| N1-u2 | - | - | 0.2H | 0.40 | 1.60 | - | - | |
| N1-u3 | - | - | 0.3H | 0.60 | 1.40 | - | - | |
| N1-u4 | - | - | 0.4H | 0.80 | 1.20 | - | - | |
| N1-u5 | - | - | 0.5H | 1.00 | 1.00 | - | - | |
| N1-u6 | - | - | 0.6H | 1.20 | 0.80 | - | - | |
| N1-u7 | - | - | 0.7H | 1.40 | 0.60 | - | - | |
| N1-u8 | - | - | 0.8H | 1.60 | 0.40 | - | - | |
| N1-u9 | - | - | 0.9H | 1.80 | 0.20 | - | - | |
| N1-u10 | - | - | 1.0H | 2.00 | 0.00 | - | - | |
| N = 2 | N2-h1u1 | 0.1H | 0.20 | 0.1H | 0.20 | 1.80 | 1.60 | - |
| N2-h1u2 | 0.2H | 0.40 | 1.60 | 1.40 | - | |||
| N2-h1u3 | 0.3H | 0.60 | 1.40 | 1.20 | - | |||
| N2-h1u4 | 0.4H | 0.80 | 1.20 | 1.00 | - | |||
| N2-h1u5 | 0.5H | 1.00 | 1.00 | 0.80 | - | |||
| N2-h2u1 | 0.2H | 0.40 | 0.1H | 0.20 | 1.80 | 1.40 | - | |
| N2-h2u2 | 0.2H | 0.40 | 1.60 | 1.20 | - | |||
| N2-h2u3 | 0.3H | 0.60 | 1.40 | 1.00 | - | |||
| N2-h2u4 | 0.4H | 0.80 | 1.20 | 0.80 | - | |||
| N2-h2u5 | 0.5H | 1.00 | 1.00 | 0.60 | - | |||
| N2-h3u1 | 0.3H | 0.60 | 0.1H | 0.20 | 1.80 | 1.20 | - | |
| N2-h3u2 | 0.2H | 0.40 | 1.60 | 1.00 | - | |||
| N2-h3u3 | 0.3H | 0.60 | 1.40 | 0.80 | - | |||
| N2-h3u4 | 0.4H | 0.80 | 1.20 | 0.60 | - | |||
| N2-h3u5 | 0.5H | 1.00 | 1.00 | 0.40 | - | |||
| N2-h4u1 | 0.4H | 0.80 | 0.1H | 0.20 | 1.80 | 1.00 | - | |
| N2-h4u2 | 0.2H | 0.40 | 1.60 | 0.80 | - | |||
| N2-h4u3 | 0.3H | 0.60 | 1.40 | 0.60 | - | |||
| N2-h4u4 | 0.4H | 0.80 | 1.20 | 0.40 | - | |||
| N2-h4u5 | 0.5H | 1.00 | 1.00 | 0.20 | - | |||
| N2-h5u1 | 0.5H | 1.00 | 0.1H | 0.20 | 1.80 | 0.80 | - | |
| N2-h5u2 | 0.2H | 0.40 | 1.60 | 0.60 | - | |||
| N2-h5u3 | 0.3H | 0.60 | 1.40 | 0.40 | - | |||
| N2-h5u4 | 0.4H | 0.80 | 1.20 | 0.20 | - | |||
| N2-h5u5 | 0.5H | 1.00 | 1.00 | 0.00 | - | |||
| N = 3 | N3-h1u1 | 0.1H | 0.10 | 0.1H | 0.20 | 1.80 | 1.70 | 1.60 |
| N3-h1u2 | 0.2H | 0.40 | 1.60 | 1.50 | 1.40 | |||
| N3-h1u3 | 0.3H | 0.60 | 1.40 | 1.30 | 1.20 | |||
| N3-h1u4 | 0.4H | 0.80 | 1.20 | 1.10 | 1.00 | |||
| N3-h1u5 | 0.5H | 1.00 | 1.00 | 0.90 | 0.80 | |||
| N3-h2u1 | 0.2H | 0.20 | 0.1H | 0.20 | 1.80 | 1.60 | 1.40 | |
| N3-h2u2 | 0.2H | 0.40 | 1.60 | 1.40 | 1.20 | |||
| N3-h2u3 | 0.3H | 0.60 | 1.40 | 1.20 | 1.00 | |||
| N3-h2u4 | 0.4H | 0.80 | 1.20 | 1.00 | 0.80 | |||
| N3-h2u5 | 0.5H | 1.00 | 1.00 | 0.80 | 0.60 | |||
| N3-h3u1 | 0.3H | 0.30 | 0.1H | 0.20 | 1.80 | 1.50 | 1.20 | |
| N3-h3u2 | 0.2H | 0.40 | 1.60 | 1.30 | 1.00 | |||
| N3-h3u3 | 0.3H | 0.60 | 1.40 | 1.10 | 0.80 | |||
| N3-h3u4 | 0.4H | 0.80 | 1.20 | 0.90 | 0.60 | |||
| N3-h3u5 | 0.5H | 1.00 | 1.00 | 0.70 | 0.40 | |||
| N3-h4u1 | 0.4H | 0.40 | 0.1H | 0.20 | 1.80 | 1.40 | 1.00 | |
| N3-h4u2 | 0.2H | 0.40 | 1.60 | 1.20 | 0.80 | |||
| N3-h4u3 | 0.3H | 0.60 | 1.40 | 1.00 | 0.60 | |||
| N3-h4u4 | 0.4H | 0.80 | 1.20 | 0.80 | 0.40 | |||
| N3-h4u5 | 0.5H | 1.00 | 1.00 | 0.60 | 0.20 | |||
| N3-h5u1 | 0.5H | 0.50 | 0.1H | 0.20 | 1.80 | 1.30 | 0.80 | |
| N3-h5u2 | 0.2H | 0.40 | 1.60 | 1.10 | 0.60 | |||
| N3-h5u3 | 0.3H | 0.60 | 1.40 | 0.90 | 0.40 | |||
| N3-h5u4 | 0.4H | 0.80 | 1.20 | 0.70 | 0.20 | |||
| N3-h5u5 | 0.5H | 1.00 | 1.00 | 0.50 | 0.00 | |||
Publisher’s Note: MDPI stays neutral with regard to jurisdictional claims in published maps and institutional affiliations. |
© 2022 by the authors. Licensee MDPI, Basel, Switzerland. This article is an open access article distributed under the terms and conditions of the Creative Commons Attribution (CC BY) license (https://creativecommons.org/licenses/by/4.0/).
Share and Cite
Chaiyaput, S.; Arwaedo, N.; Jamsawang, P.; Ayawanna, J. Natural Para Rubber in Road Embankment Stabilization. Appl. Sci. 2022, 12, 1394. https://doi.org/10.3390/app12031394
Chaiyaput S, Arwaedo N, Jamsawang P, Ayawanna J. Natural Para Rubber in Road Embankment Stabilization. Applied Sciences. 2022; 12(3):1394. https://doi.org/10.3390/app12031394
Chicago/Turabian StyleChaiyaput, Salisa, Nakib Arwaedo, Pitthaya Jamsawang, and Jiratchaya Ayawanna. 2022. "Natural Para Rubber in Road Embankment Stabilization" Applied Sciences 12, no. 3: 1394. https://doi.org/10.3390/app12031394
APA StyleChaiyaput, S., Arwaedo, N., Jamsawang, P., & Ayawanna, J. (2022). Natural Para Rubber in Road Embankment Stabilization. Applied Sciences, 12(3), 1394. https://doi.org/10.3390/app12031394