1. Introduction
Diesel engines are usually used in many applications for transport, industry, power generation, agricultural and military sectors. Clean combustion achieved by adaptive control of engine operation using the injection rate-shaping has received nowadays major significance to ensure increased efficiency and low levels of emissions. By adopting a modern combustion system design accompanied with an advanced fuel injection system, high power and torque densities together with low fuel consumption and emissions can be achieved [
1].
Renewable and sustainable alternative fuels such as biofuels can be a solution to the increased demand for fuels and the depletion of oil resources. Also, the association of advanced fuel formulations with highly efficient engine combustion architectures can be a suitable solution for the challenges related to efficiency and emission targets in the short–medium term [
2]. The transport sector is the primary consumer of petroleum-derived fuels. Diesel engines are constructed to run on diesel fuel and the alternative fuel should have similar characteristics. Although many studies have been carried out on alternative fuels for diesel engines, the main obstacle which must be overpassed is the elevated cost of these fuels and the difficulties associated with engine changes enabling the operation with these fuels. Some studies have shown that by fuelling the engine with blends of crude palm oil or biodiesel with diesel, a simultaneous reduction of HC, NO
x and Soot emissions is possible [
3,
4]. In this sense, biodiesel is actually considered the only alternative fuel that can be used without or with small modifications to the diesel engine having a significant effect on emissions mitigation [
5].
In the last decades, several experimental and numerical studies have been developed aimed to examine the effect of various shapes of the rate of injection on diesel engine operation. Most of them showed that the adoption of single injection strategies with modified shapes of the rate of injection can be a very efficient method for decreasing NO
x emissions at some loading conditions [
6]. Also, the combustion-generated noise can be reduced if there is a lower initial injected fuel mass, thus slowing down the early rapid rise of the heat release and peak pressure rise rate [
7]. In other studies, the adoption of different shapes of the rate of injection has been achieved considering split injection strategies [
8,
9,
10]. Changing the main injection shape has an important effect on the air–fuel mixing process, ignition delay and pollutant emissions. According to [
8], it is likely to attain low NO
x and Soot emissions at the same time by using the proper rate shape.
The experimental study conducted by Macian et al. [
11] shows that boot and ramp rate of injection profiles have an important influence over the premixed combustion phase and the ignition location without changing the injection pressure or the final fuel mass flow rate. According to [
12], NO
x forms in zones that are close to the stoichiometric and Soot forms in zones with equivalence ratios between two and four. Therefore, the variation of fuel delivery through the change of injection rate shape can be a valuable method of emission control. Desantes et al. [
13,
14] observed important reductions in NO
x emissions with increasing boot length or decreasing boot pressure. Less efficient mixing conditions are provided when the boot shape length is increased, which amplifies Soot emissions drastically. An improved mixing can be obtained if the boot pressure is increased, which provides rapid burning rates, with higher NO
x and lower Soot emissions.
Using computational fluid dynamics (CFD) software, Shrestha et al. [
15] observed notable differences in the ignition delays among the considered rate shapes with the same start and duration of injection. Using a right-angled triangle shape with greater pressure at the end of the injection event leads to the lowest NO
x, but the highest Soot emissions. If the peak pressure is provided at the start of the injection event low values of Soot emissions are reported. Hountalas et al. [
16] examined the opportunity of applying a phenomenological multi-zone model modified accordingly to consider various injection rates. Considering the entire engine behaviour, the boot rate with bigger pressure at the end of the injection process was the best shape, while the constant rate was the least effective. Shuai et al. [
17] used seven rate shapes, the start of injection for each of them being tuned so that all determined the same trigger point of the main heat release. The rectangular shape and the boot-type shape delivering the peak velocity at the end of the injection can reduce Soot, HC, and CO emissions in comparison to the trapezoidal, triangular and respectively to the boot-type shapes, which deliver the peak injection velocity at the start of the injection event.
According to Tay et al. [
18,
19,
20], the triangular shapes of injection present bigger in-cylinder pressure rise rates relative to the ramp injection profiles. The duration of the combustion process decreases when the initial injection rate is higher and increases when a larger amount of fuel is introduced in the last part of the injection process. The ignition delay period lengthens when initial injection velocities are decreasing. If boot shapes with higher pressures at the end of the injection event are used, the combustion phasing occurs differently, and the NO emissions are usually decreasing in comparison with the conventional rectangular injection rate. When the boot injection rate is lower, greater Soot particles are formed.
Zhixia He et al. [
21] performed a numerical study based on the adoption of four injection rate shapes (saddle, rectangle, triangle, and hump) considering constant injected fuel quantity and injection period. The start of the injection event for hump and saddle rates appears before the start of the injection for the triangle rate. Higher NO
x emissions were formed for these shapes as a result of the greater high-temperature area and this is the consequence of bigger initial injection pressure promoting improved atomization and reduced ignition delay. The Soot emissions for hump rate were improved compared to the other shapes because of the higher pressure in the later injection period that improves the mixing of fuel and air.
Five shapes of the rate of injection were studied in [
22]. The highest peak combustion temperature was reached for the triangle shape (highest NO
x emissions) as a result of the greater rate at a certain injection moment. The rectangle shape represented the optimum for Soot and NO
x emissions. The slope shape offered a moderate level of HC and the minimum CO emissions. As a result of delayed heat release, the wedge shape led to a low level of NO
x, but a high level of Soot emissions. The trapezoid shape offered the lowest Soot and a moderate level of NO
x emissions.
Mohan et al. [
23] investigated different boot injection profiles by varying the pressure and length of the shape for a biodiesel-fuelled engine. Simulation results revealed that NO
x emissions were reduced when a lower fuel quantity has been introduced in the initial stage of injection and thus a lower fuel injection velocity resulted. The long boot length and high boot pressure shapes can be the solution to achieve the compromise between NO
x and Soot.
There are many research papers dedicated to studying the consequences of changing the injection rate shape on diesel engine combustion process and emissions formation using different CFD software. Although CFD tools are highly efficient, they consume a lot of time and computing resources. In this study, the AVL-MCC zero-dimensional combustion model which is included in the AVL BOOST software, dedicated mainly to the internal combustion engine operation by simulation, was the key part of the research activity. This zero-dimensional approach offers accurate results in the computation of the combustion characteristics, performance, efficiency, and pollutant emissions of a tractor diesel engine fuelled with B20 (20% biodiesel from rapeseed oil and 80% diesel) and diesel using various rate profiles of the injection pulse. The model was calibrated for two engine operating conditions (maximum brake torque and maximum brake power) using the experimental data registered on the engine test bench. There is a lack of information in the literature about the effects of injection rate shaping when fuelling the diesel engine with biodiesel B20, a perspective fuel in the current context in which solutions to reduce CO2 emissions are required. Thus, the novelty of this study consists in the presentation of original results, which fill the existing gap in the literature concerning the influence of the rate of injection shape on performance and emissions of a diesel engine fuelled with biodiesel B20. This study evaluates which pollutant emissions, like nitrogen oxides (NOx) and Soot, can be reduced without significant power losses or considerable growths in brake-specific fuel consumption when the shape of the injection rate is changed. Highlighting the linear correlation existing between the amount of fuel injected during the initial combustion phase and the values of NOx and Soot is another important element of originality. The study intentions were to determine an optimal ROI shape when the classical diesel fuel is replaced by B20 using the analysis of combustion characteristics. The results are presented comparatively for both fuels considering two meaningful operating conditions of an agricultural tractor diesel engine: the maximum brake torque (R1) and the maximum brake power (R2). The engine operation with the optimum injection rate shape (Boot 2) showed that it is possible to obtain a simultaneous reduction of NOx and Soot emissions by 17%, respectively 9% for diesel fuel on R1 test condition and by 28%, respectively 12% on R2 test condition. The replacement of diesel fuel by biodiesel B20 generates similar reductions of NOx and Soot by 11%, respectively 4% on R1 test condition and by 22%, respectively 7% on R2 test condition.
2. Experimental Details
The investigation was performed on a naturally aspirated, four-stroke tractor diesel engine UTB 2404055, which develops 48 kW at 2400 rpm constant speed. The engine specifications are presented in
Table 1.
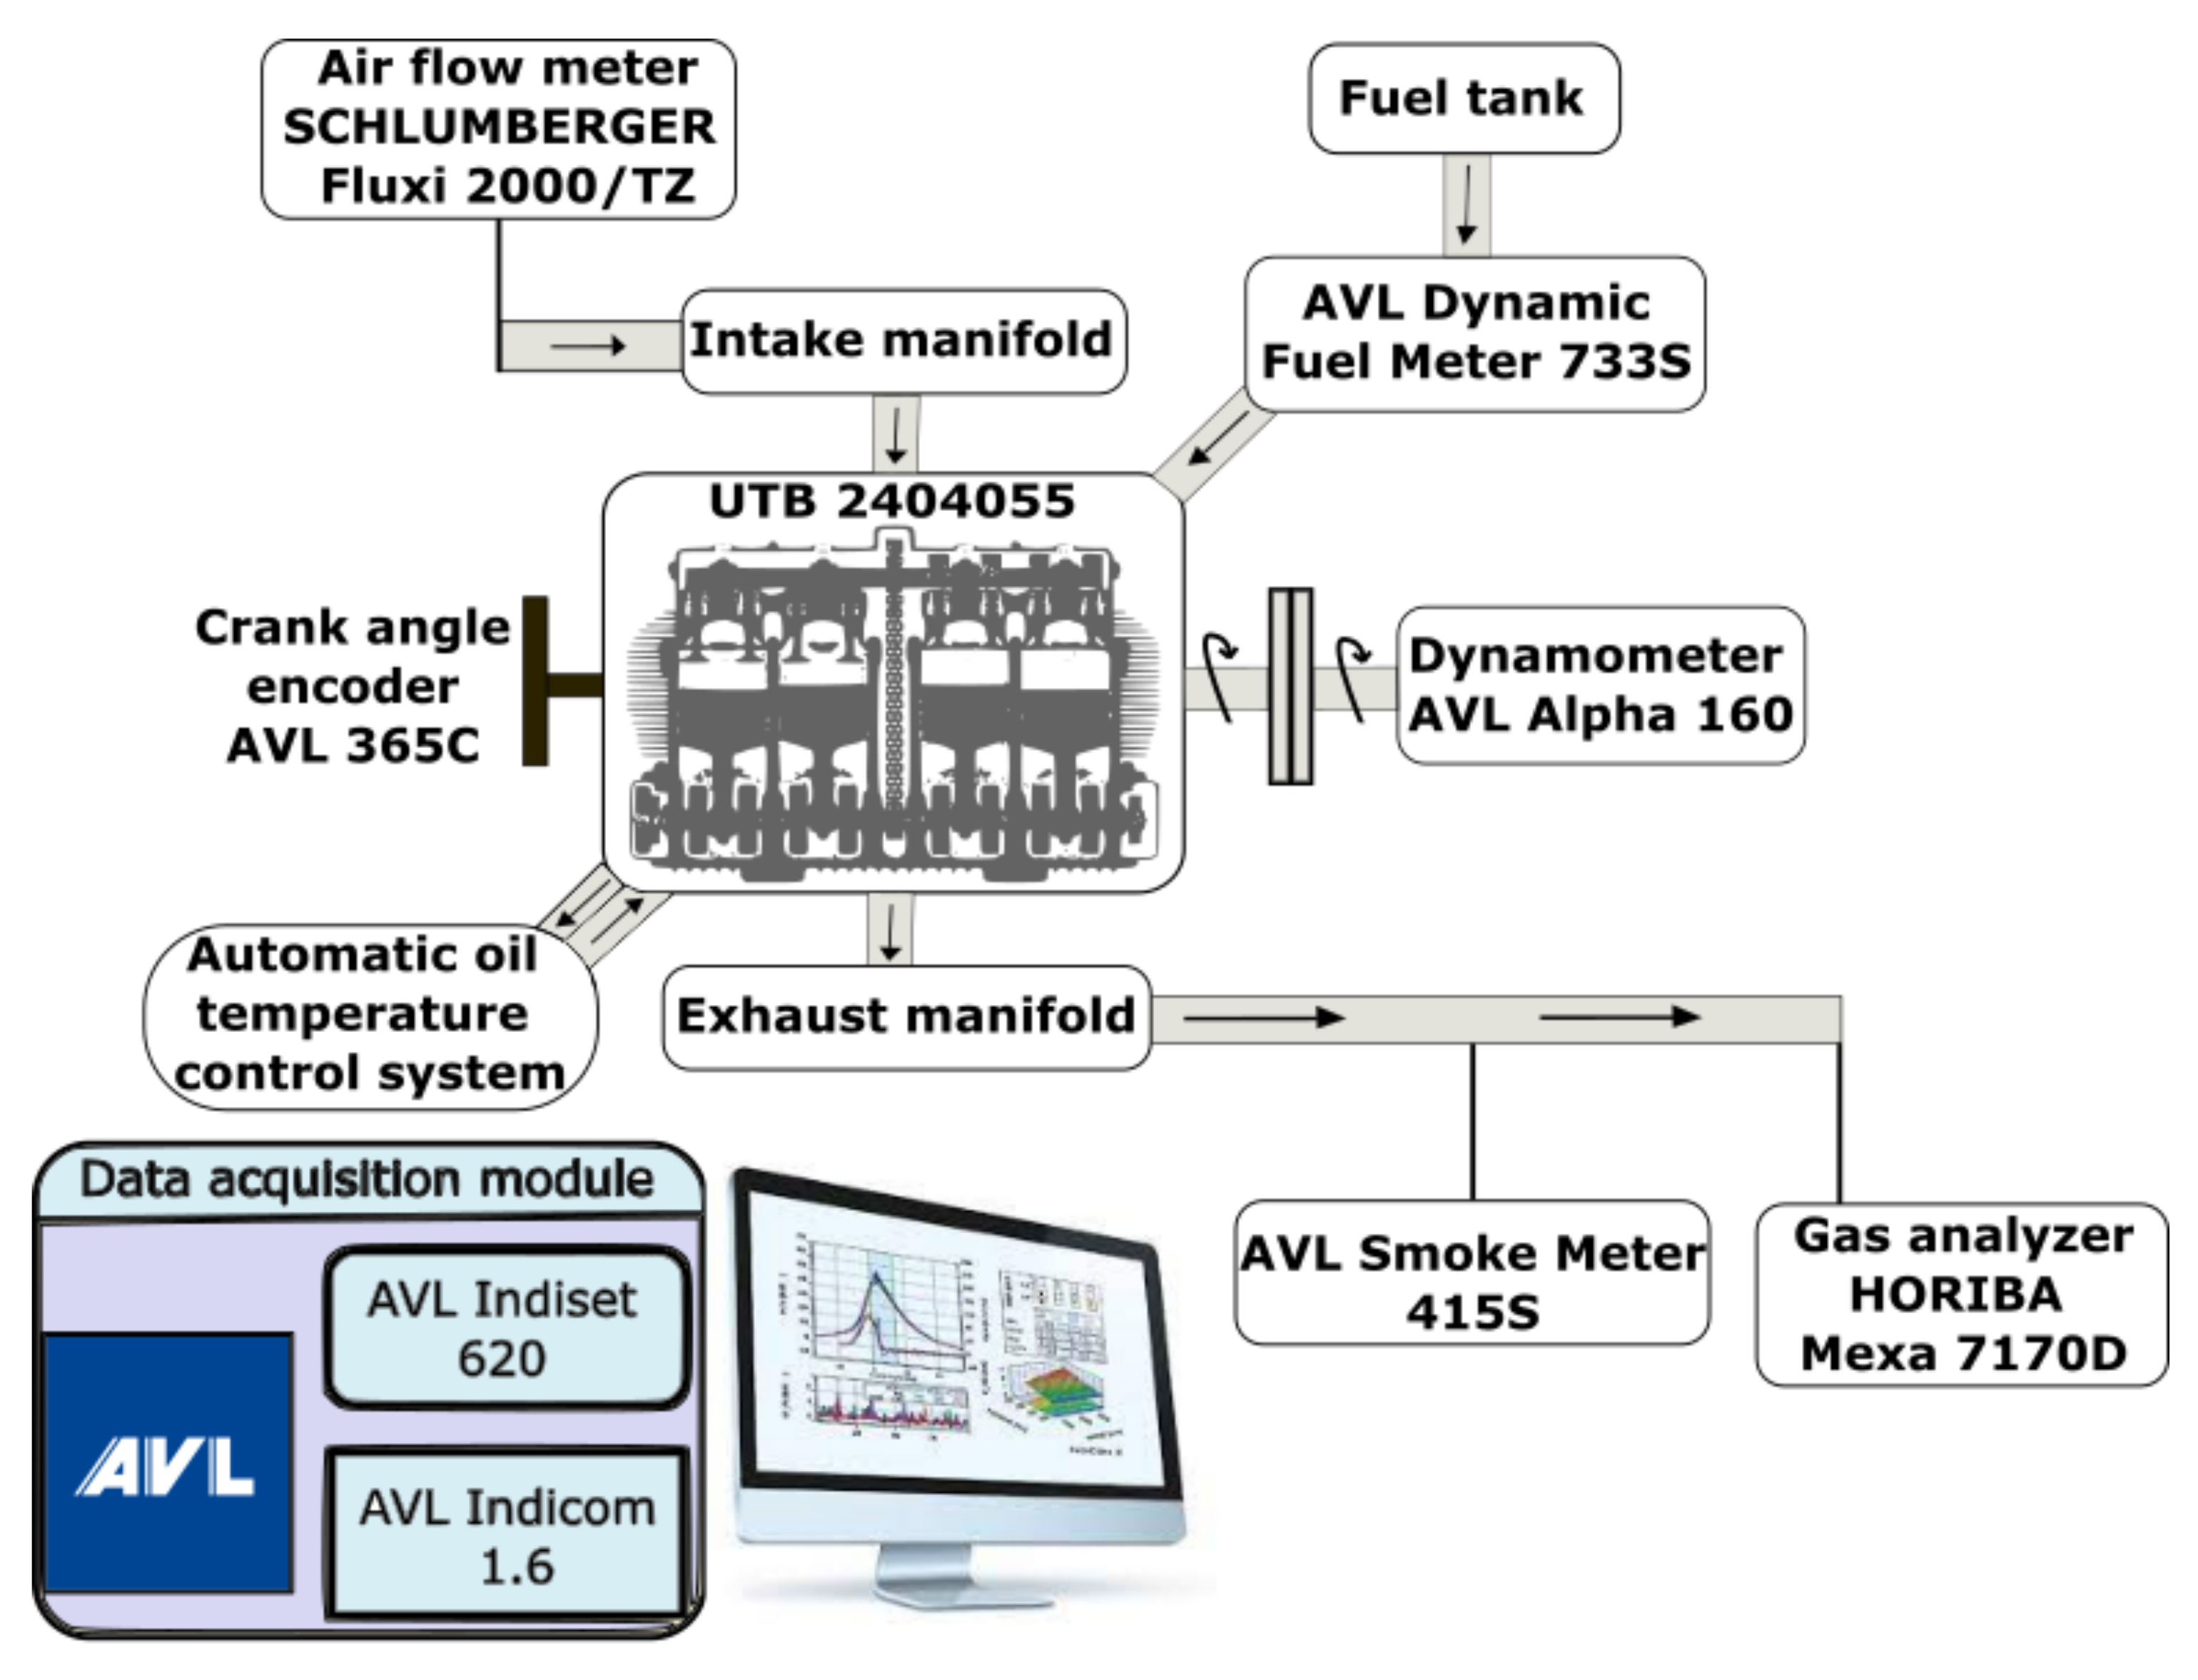
The engine was installed in a test cell provided with the corresponding instrumentation for experimental investigation (
Figure 1). The test bench was equipped with an AVL Alpha 160 eddy current dynamometer which accurately measures the engine instant torque and speed. The unit under test is monitored and controlled by the AVL EMCON 400. The SCHLUMBERGER Fluxi 2000/TZ volumetric flow meter was used to measure the engine air consumption. The AVL Dynamic Fuel Meter 733S and AVL Fuel Temperature Controller 753C were used to measure the engine fuel consumption. The HORIBA Mexa 7170D gas analyser was used to measure the exhaust emissions of CO
2, CO, NO
x and THC and to calculate the relative air–fuel ratio, while the AVL 415S measured the exhaust smoke expressed as Filter Smoke Number (FSN). The temperature and pressure of the exhaust gases, cooling water, intake air, oil as well as the atmospheric temperature and pressure were measured with appropriate devices through the signal conditioning system AVL FEM BOX and recorded by the AVL Puma Open v1.4 equipment. The data acquisition system for pressure diagrams consisted of an AVL 365C crank angle encoder and two AVL GM12D piezoelectric pressure transducers which were mounted in different cylinders and connected to the AVL 3066A02 charge amplifiers.
The injector needle lift was recorded for one cylinder using a proximity sensor incorporated in a Perkins-Lucas injector. The AVL 3066A01 charge amplifier and AVL QL21D transducer equipped the high-pressure line of this injector. The fuel pressure measurement system at the injection pump consisted of an AVL 3009 A03 charge amplifier and an AVL 31 DP pressure transducer. An AVL IndiSet 620 data acquisition module recorded high-speed variation parameters using the AVL Indicom 1.6 software.
In this work, the experimental data were collected for engine maximum brake torque–R1 (full load, 1400 rpm) and maximum brake power–R2 (full load, 2400 rpm) conditions when fuelling was successively made with diesel fuel and biodiesel B20. For every operating point, at least 3 tests were performed, each of them consisting in the registration of 200 consecutive cycles recorded cycle by cycle, an average cycle and statistical data. The relative deviations of the in-cylinder pressure variation comparative to the mean values were below 3%. The oil temperature stayed within 90 ± 5 °C throughout the experiments. This was done using a heat exchanger equipped with two OMRON E5CN temperature controllers and electrovalves. The temperature of the engine cooling water was maintained between 70 and 75 °C. The experimental data which were averaged have been considered as the basis for the calibration of the simulation model.
Table 2 shows the measuring accuracy values for the main equipment used in this study.
It is well known that carbon dioxide (CO
2) is one of the harmful emissions of piston engines with a massive influence on the greenhouse effect, which induces the global warming phenomenon. To combat this undesirable phenomenon, continuously reducing carbon dioxide emissions must be promoted. One way to achieve this important goal is by using biofuels. Currently, commercial diesel fuel in the European Union has a content of 7%
v/v biodiesel (B7). The slow increase in the biofuel percentage allows the technological development of motor vehicles, the aim being to use high percentages of biofuel in the future to further reduce CO
2 emissions. For this reason, biodiesel B20 was considered important in this study, representing a potentially viable solution for the next future as it has only 20% volumetric fraction rapeseed biodiesel in its composition. In Romania, large rapeseed crops are cultivated. For the experiments developed in this study, the rapeseed biodiesel was obtained from an authorized local supplier. The fuel complies with the European standard EN 14214.
Table 3 displays some physicochemical properties of fuels used in the present study.
3. Simulation Details
The assessment of the injection rate shape effects on performance and emissions was made by simulation using the AVL BOOST software including the AVL MCC combustion model (mixing controlled combustion). This model evaluates the rate of heat release in direct injection compression ignition (DICI) engines [
25]. The NO
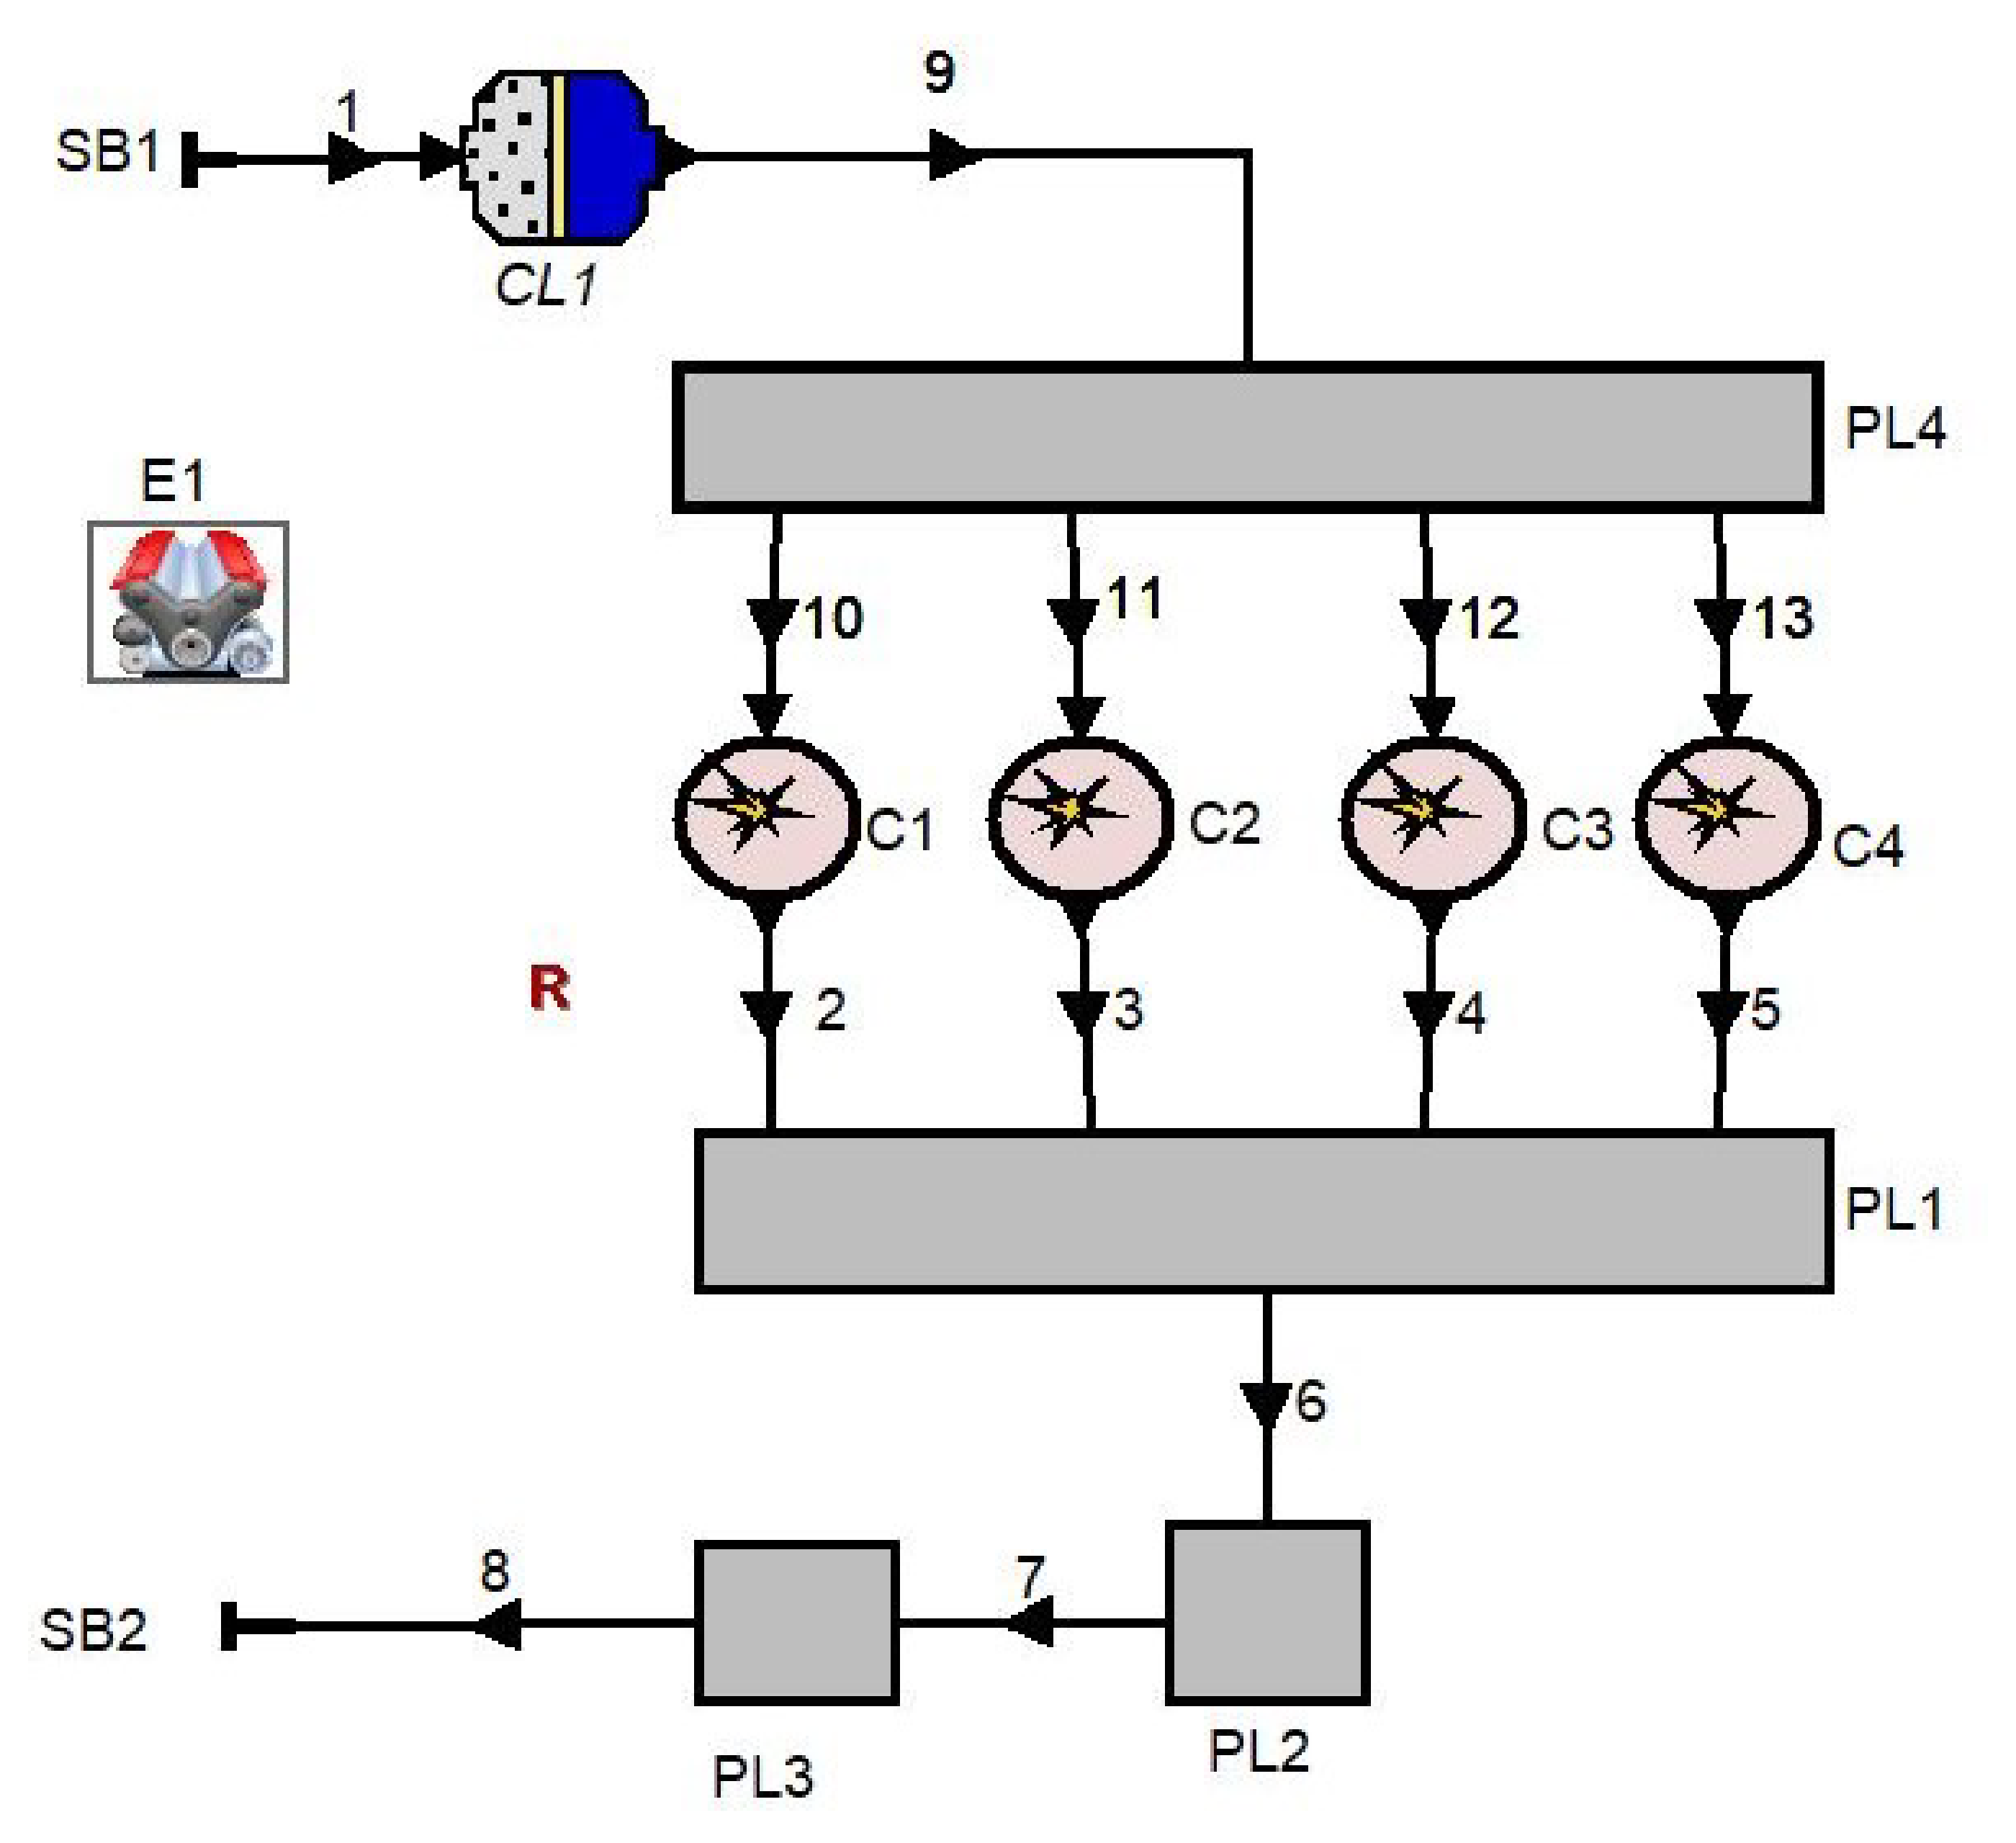
x formation is based on the extended Zeldovich mechanism coupled with three additional reactions for N2O formation. The Soot estimation is performed by a mechanism consisting of two reactions of formation and oxidation which are based on chemical kinetics. The AVL MCC model requires the introduction of specific values for some physical properties and several normalised model parameters.
Figure 2 shows the symbolic model of the engine and the AVL MCC normalized parameters.
The model calibration was performed for the Top-Hat (TH) shape of the rate of injection (ROI).
Table 4 shows the values adopted and introduced in the AVL MCC combustion model for the normalized parameters and the physical data corresponding to both fuels and engine operating conditions.
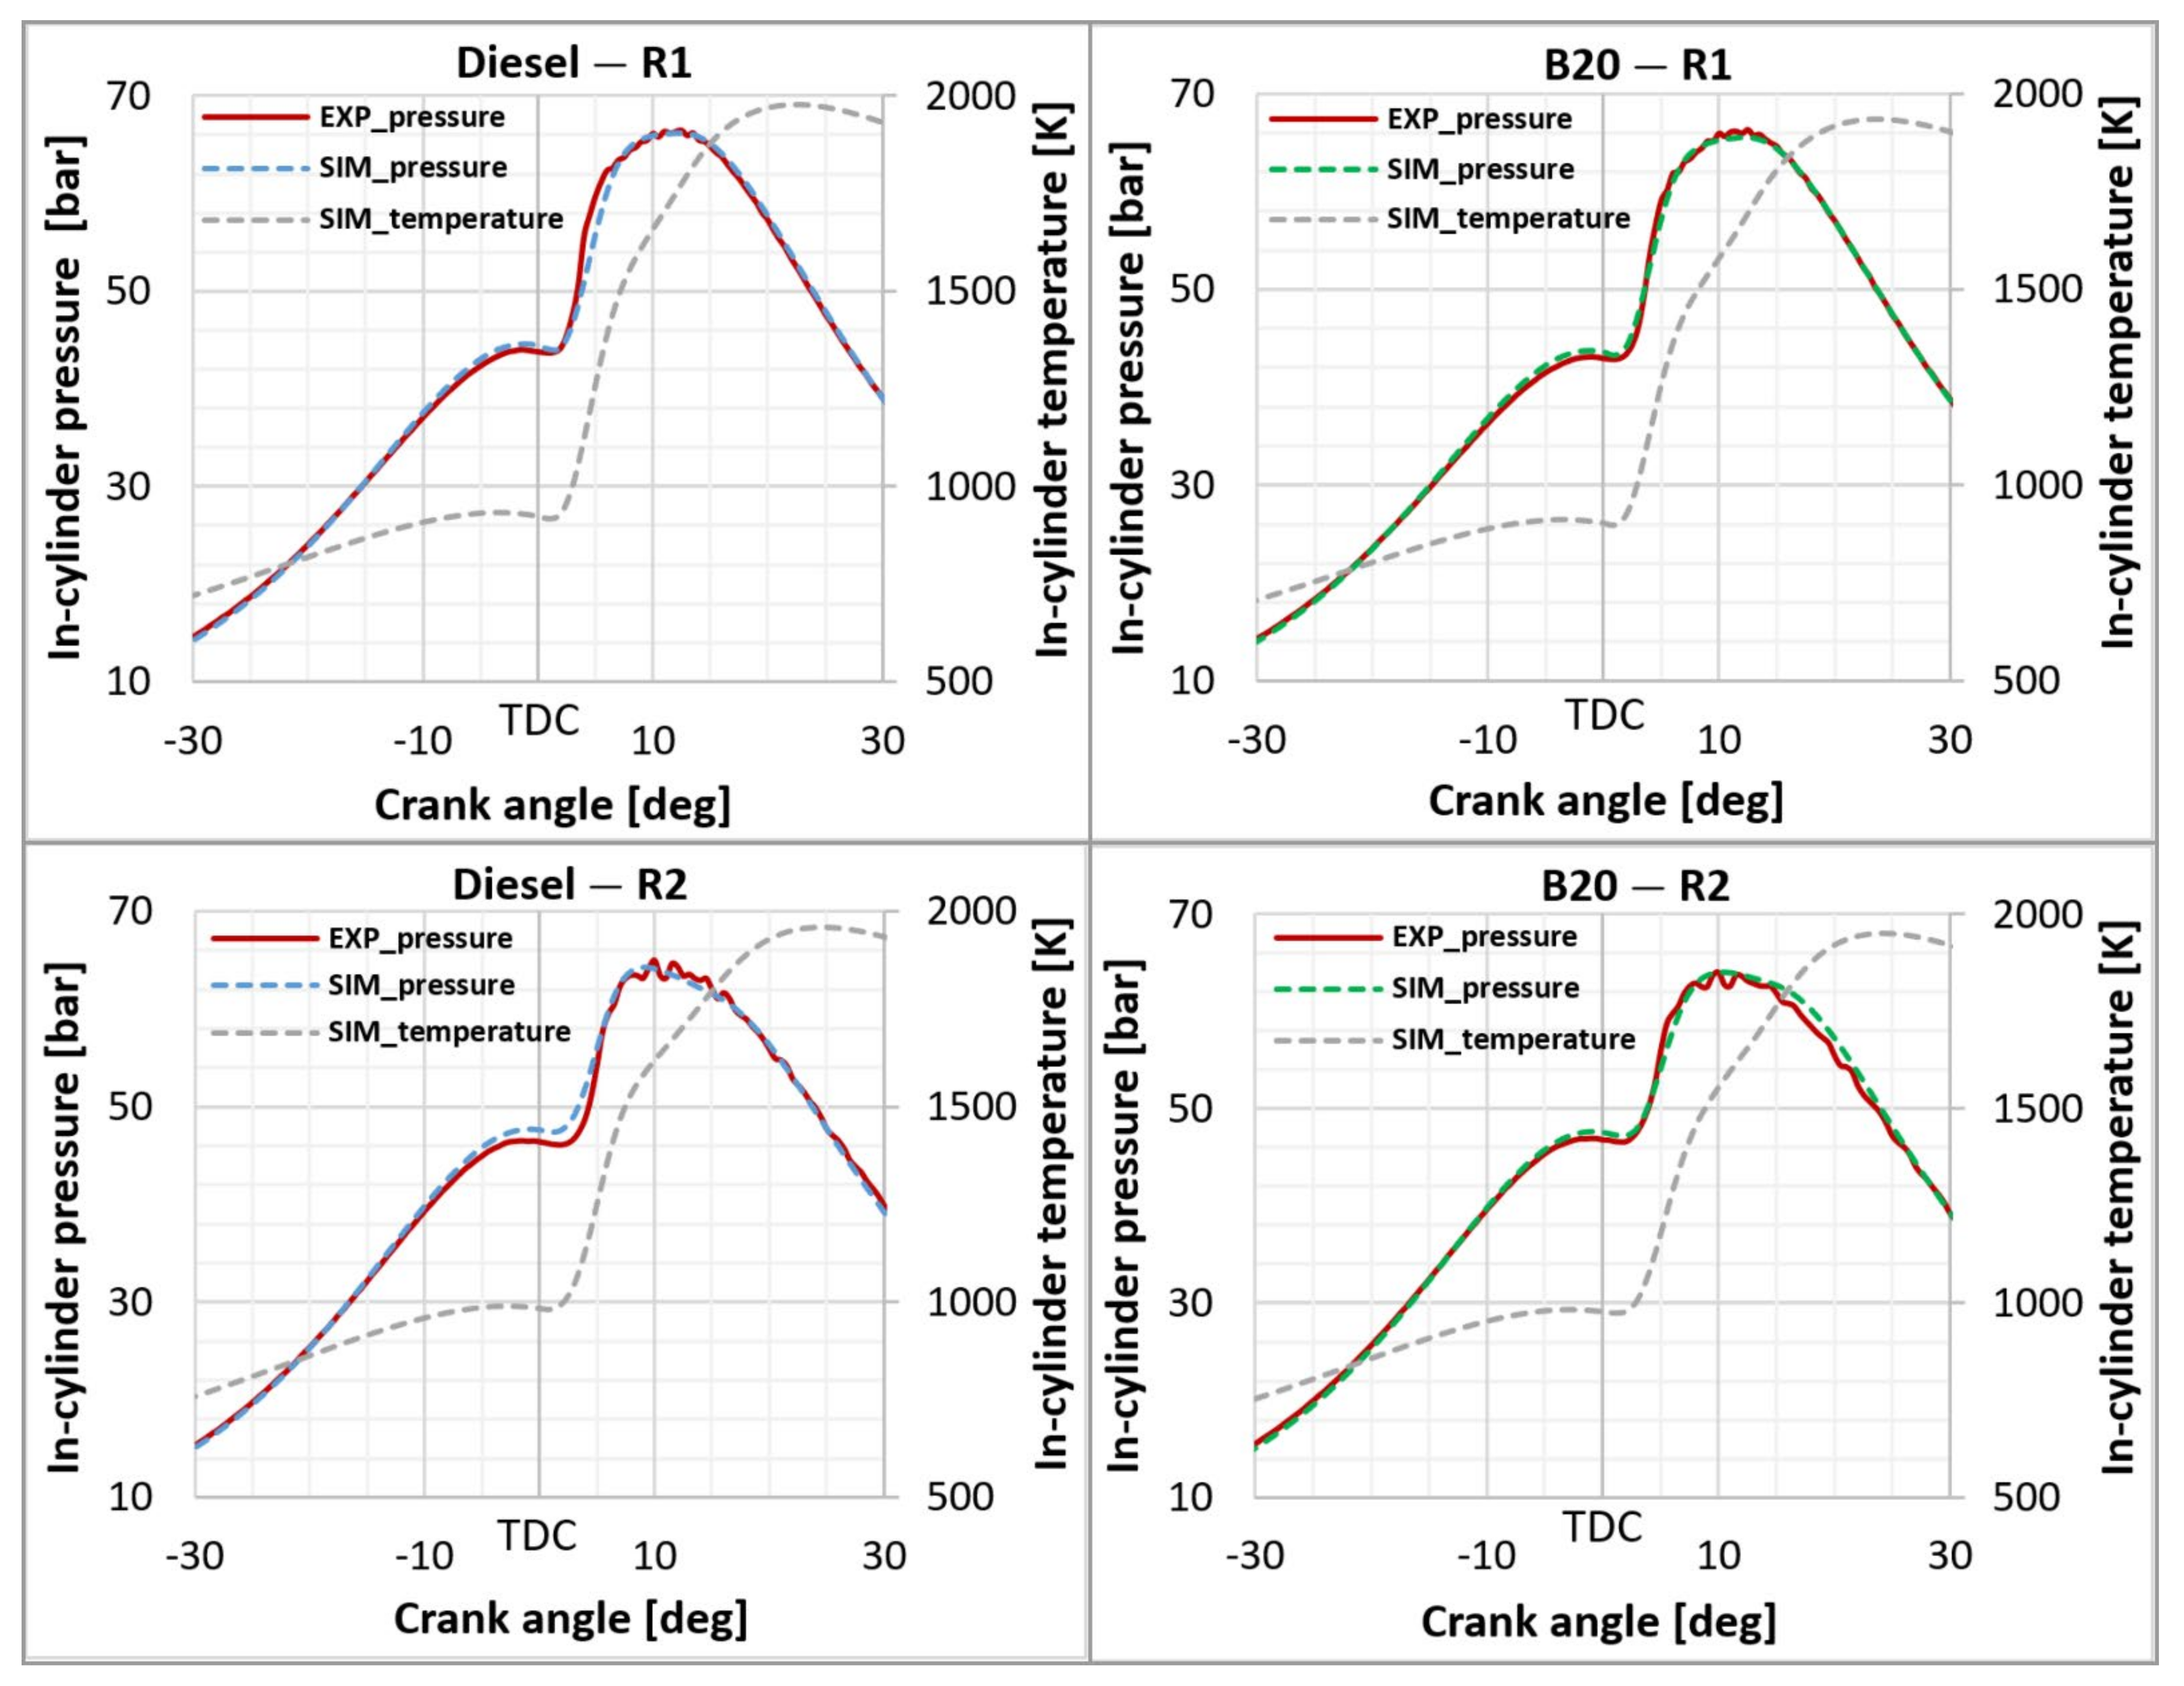
An initial stage of the simulation study consisted in the model calibration. This was done based on the comparison made between the experimental and simulated in-cylinder pressure traces and the values of engine parameters expressing performance (brake power-BP), efficiency (brake-specific fuel consumption (BSFC)) and emissions (nitrogen oxides-NO
x and Soot). The relative deviations for all parameters considered relevant to the model calibration remained below 3% for both tested fuels and engine operating conditions, as shown in
Table 5.
The experimental pressure traces and the numerically determined temperature and pressure curves are revealed in
Figure 3. It shows a normal variation of cylinder charge temperature by crankshaft position with the maximum values reached after TDC for both engine operating conditions and tested fuels. It can be noticed that the peak in-cylinder temperature has higher values for diesel fuel than for biodiesel B20, regardless of the engine operating condition.
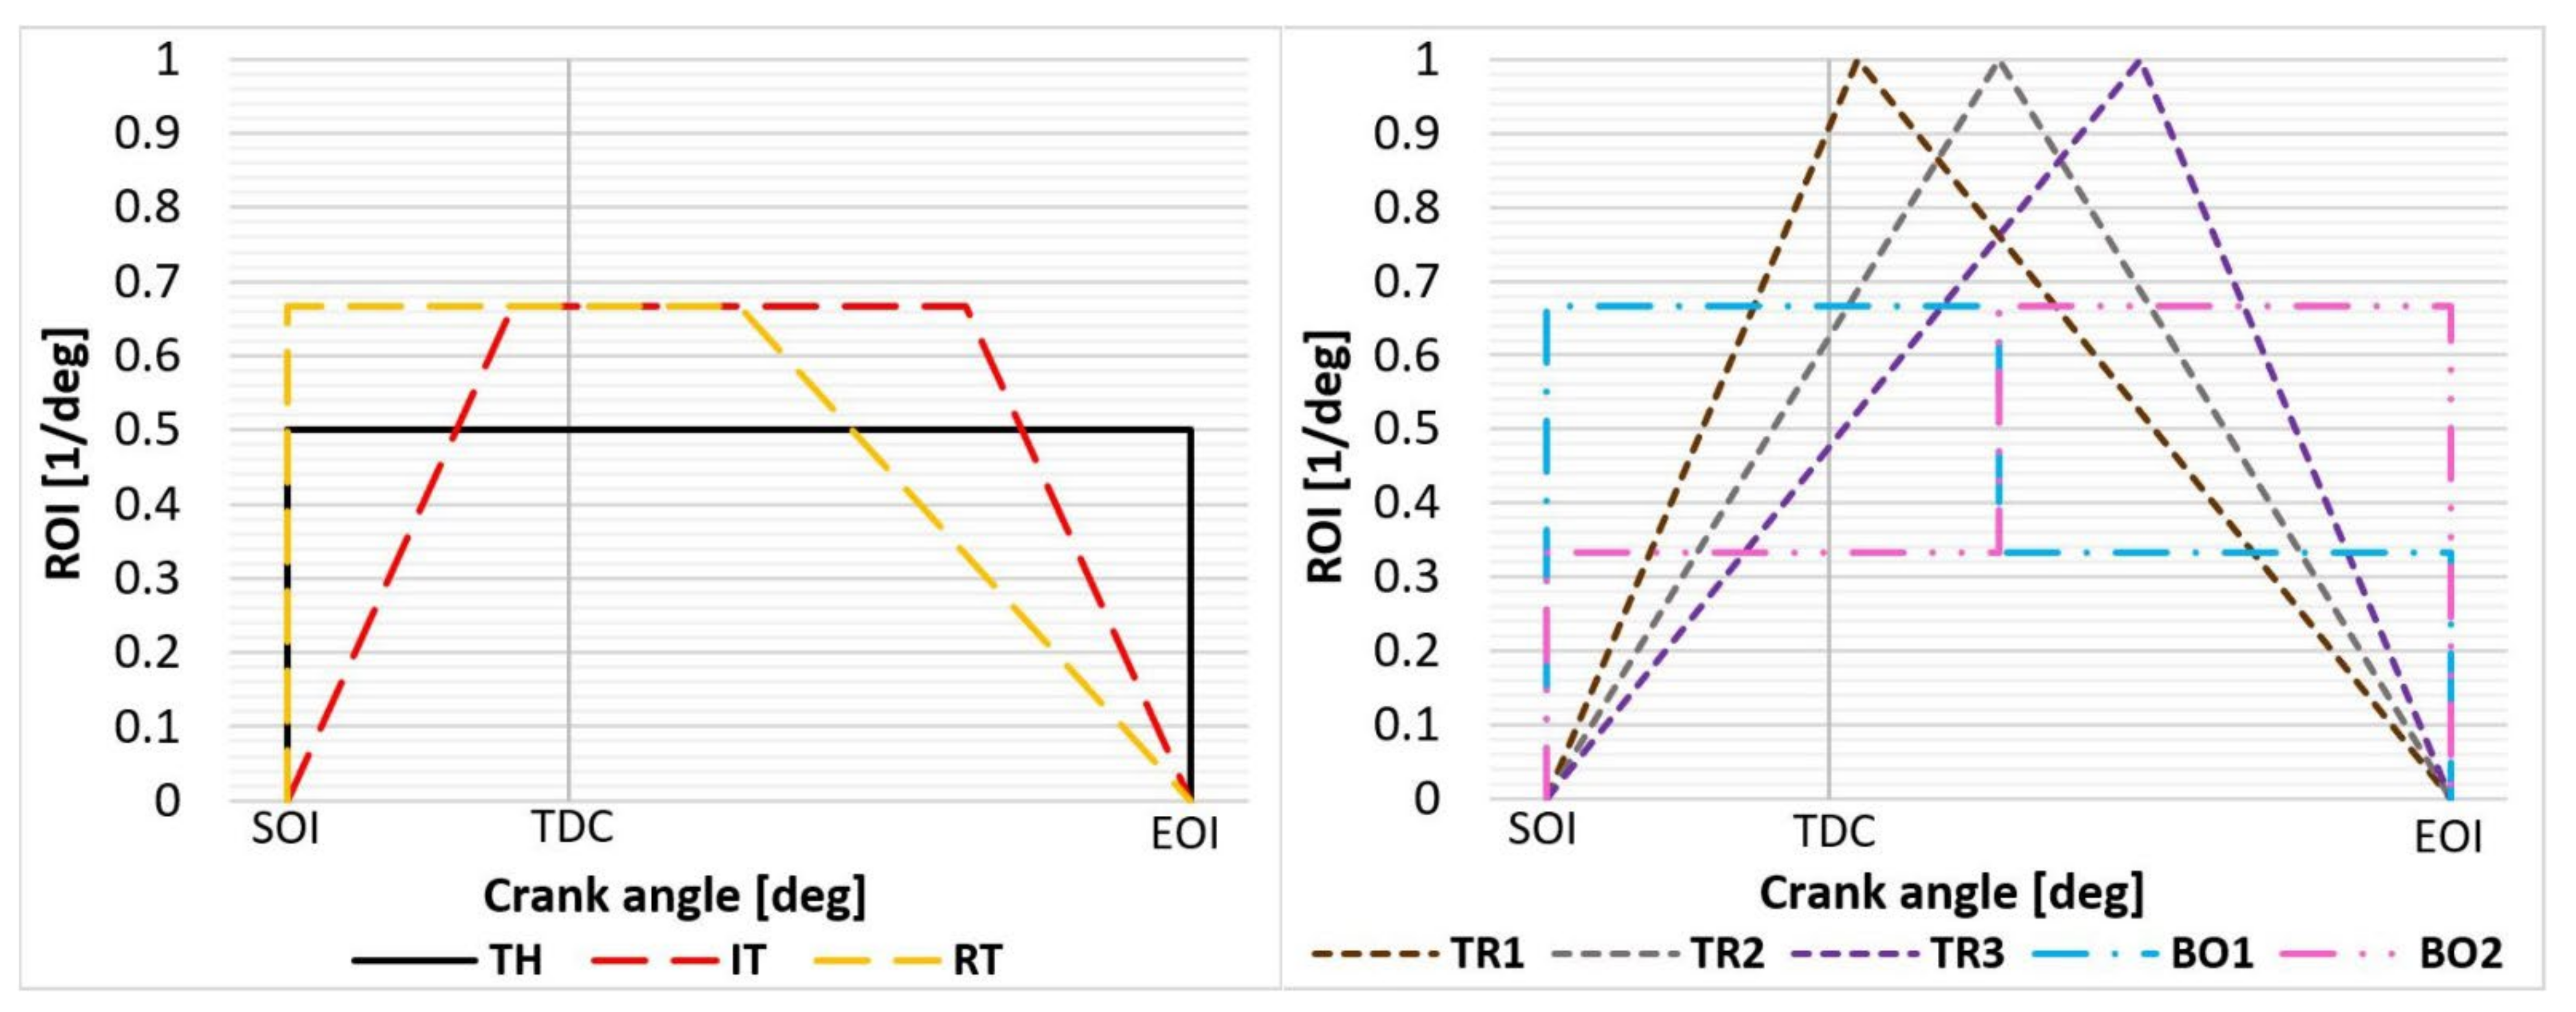
A next stage of the simulation work consisted in modifying the shape of the original injection rate (Top-Hat) by keeping the same area, initiation event (start of injection-SOI) and duration up to the end of the injection (EOI). The following acronyms of the ROI shapes are applied: Top-Hat (TH); Isosceles Trapezoid (IT); Right Trapezoid (RT); Triangle 1 (TR1); Triangle 2 (TR2); Triangle 3 (TR3); Boot 1 (BO1); Boot 2 (BO2).
The ROI variations relative to the crankshaft angular position are illustrated in
Figure 4. The start of injection and the end of injection (SOI/EOI) were considered as −5 °CA/11 °CA for R1 (full load, 1400 rpm) and, respectively, −5.5 °CA/13 °CA for R2 (full load, 2400 rpm). Both events were related to the top dead center end of compression (TDC).
4. Results and Discussion
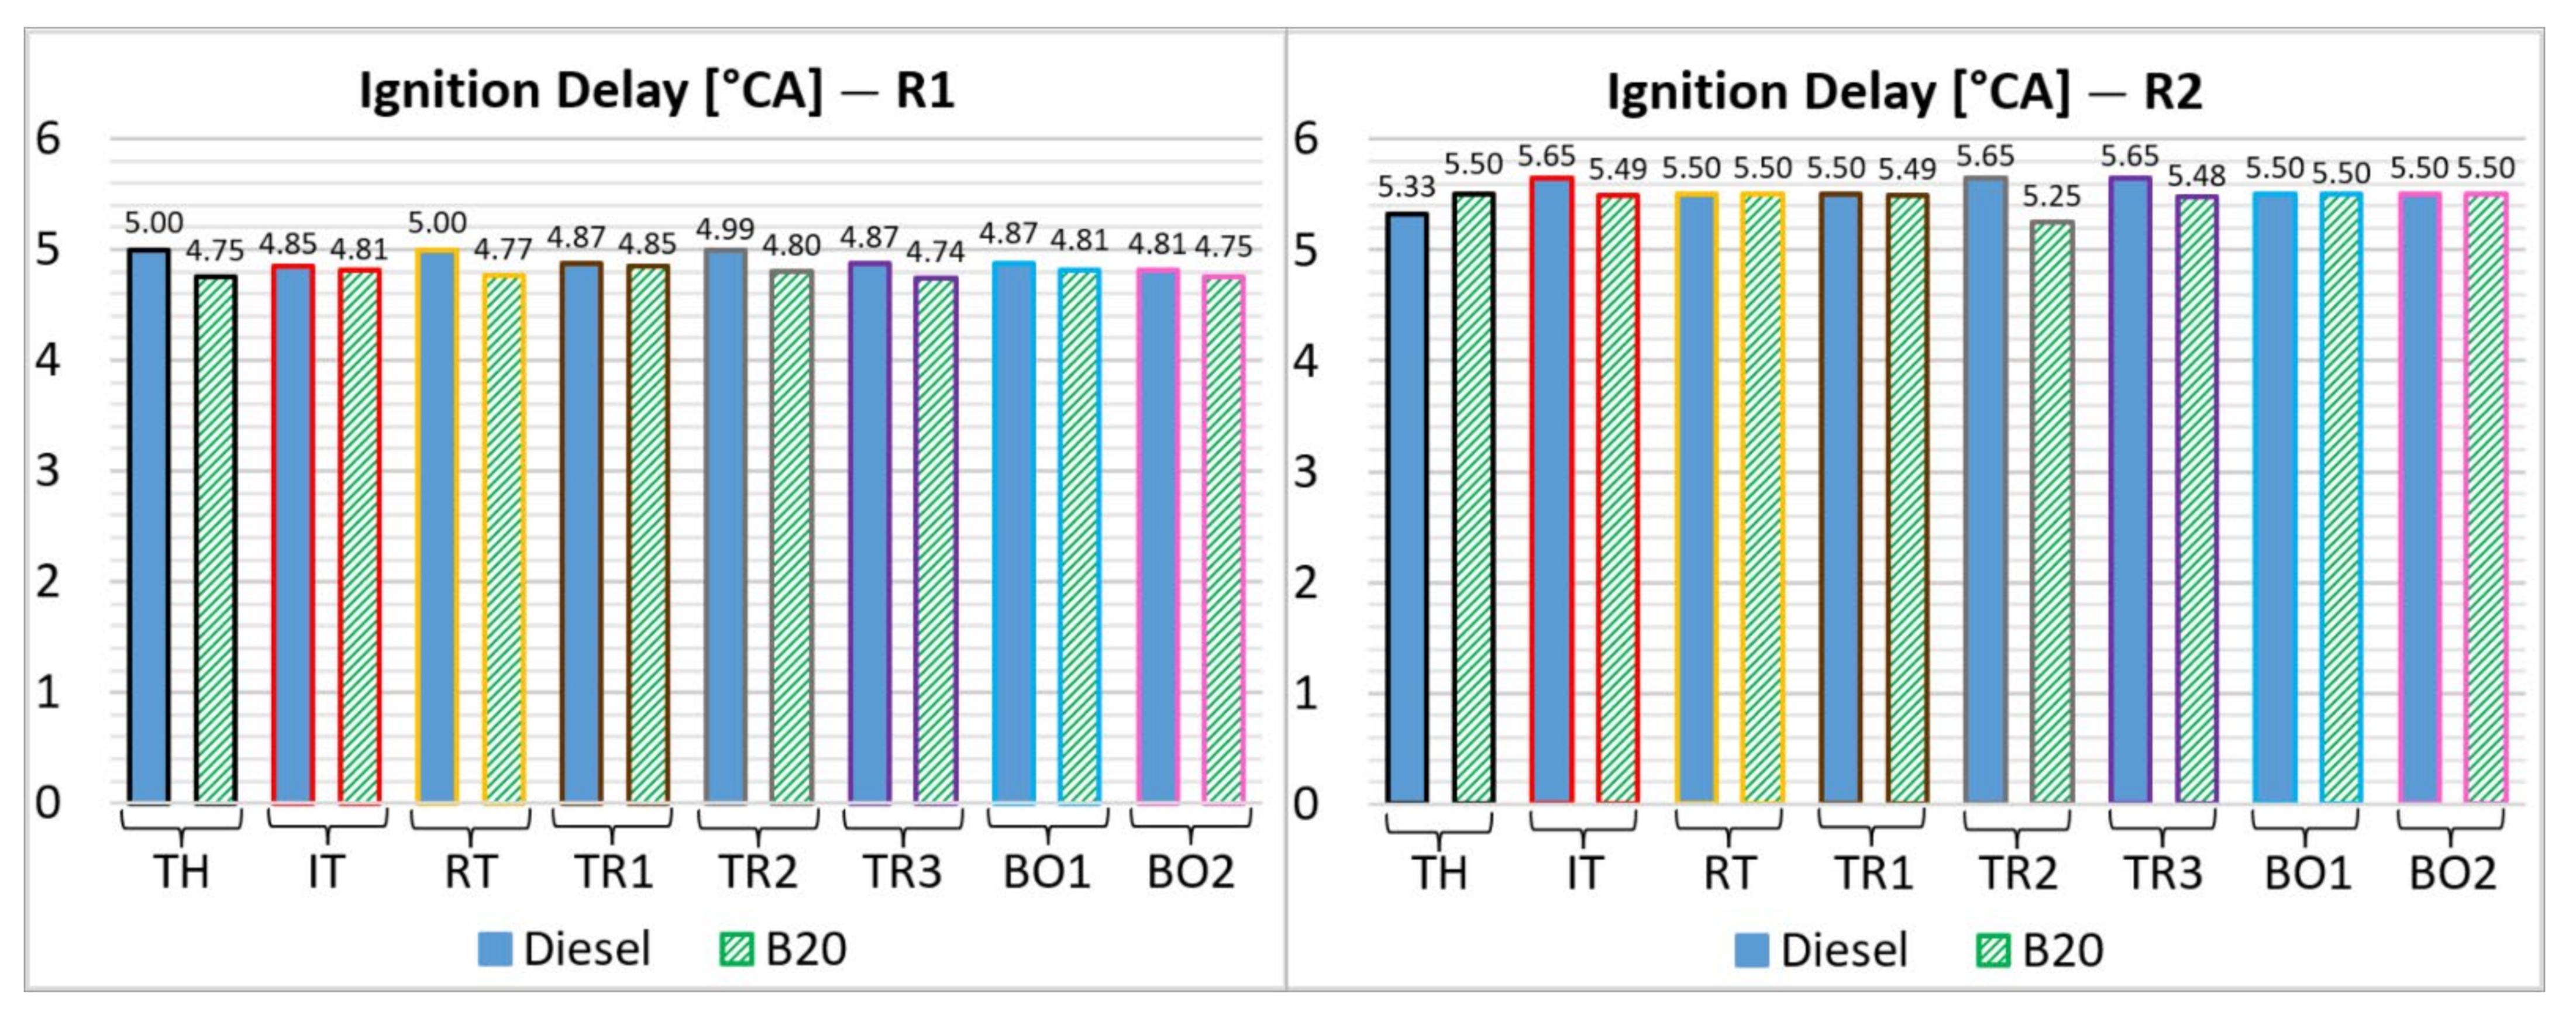
Figure 5 illustrates the values of the ignition delay dependent on the ROI shape. The ignition delay in a diesel engine represents the duration between the start of injection and the start of combustion (SOC). In this study, the SOC was defined by the zero value of the rate of heat release. As seen in the following figure, the ignition delay is slightly influenced by the ROI shape and confirms the results from [
11]. As it depends on the physical parameters, namely the cylinder charge pressure and temperature during the injection timing, respectively on the chemical parameters, such as fuel chemical composition and structure, fuel cetane number, it can be noticed a very small variation of this parameter relative to the ROI shape. Because the percentage of biodiesel in the B20 composition is low and its cetane number is approximately the same as diesel fuel, the differences for ignition delay between these two fuels are small. Concerning the ignition delay in [
18,
21], where the considered shapes of injection rates are somehow different relative to those from this study, not equivalent results have been obtained for diesel fuel, kerosene, and kerosene–diesel blends.
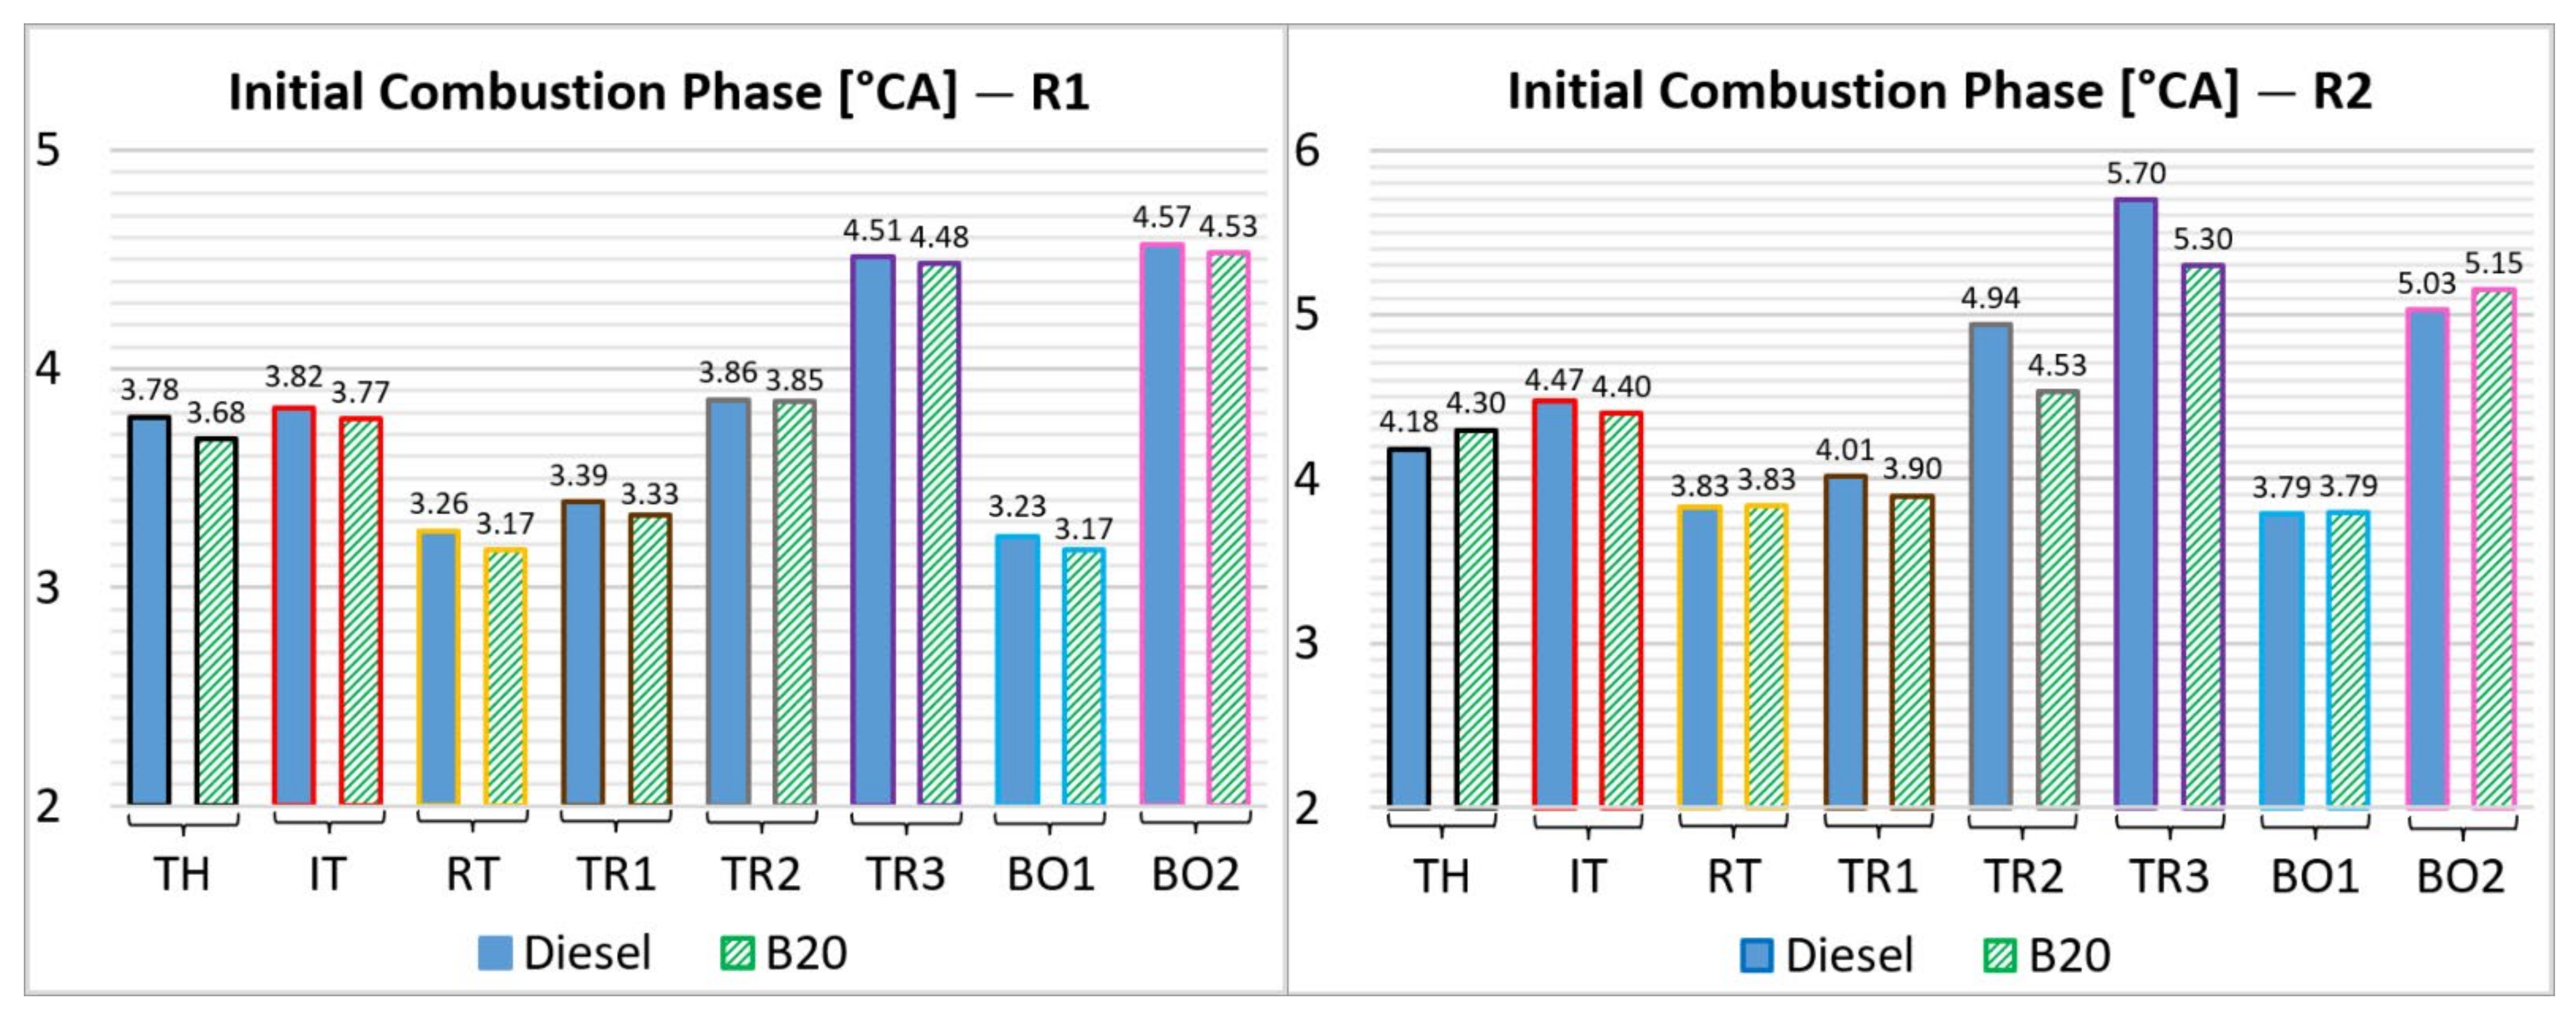
In
Figure 6 are shown the evolutions of the initial combustion phase relative to the ROI shape. The initial combustion stage is characterized by the combustion of the premixed charge, being considered as the period between the start of combustion and the event when 10% of the mass fraction is burned (MFB10%). This period is strongly influenced by the amount of fuel injected, accumulated, vaporized, and mixed with air during the ignition delay. For the R1 engine test condition, the minimum values are obtained using the BO1 shape with a reduction of 14.6% for diesel fuel and 13.9% for B20 relative to the considered reference shape (TH). For the R2 test condition, the minimum values are obtained when using the same BO1 shape with a reduction of 9.3% for diesel fuel and, respectively, 11.9% for B20. The maximum values on the R1 test condition are obtained using the BO2 shape with an increase of 20.9% for diesel fuel and 23.1% for B20, while on the R2 these are obtained using the TR3 shape with an increase of 36.4% for diesel fuel and 23.3% for B20. This finding could be explained by the lesser fuel quantity injected during the ignition delay. The values of the initial combustion stage are comparable, having approximately similar variations for both fuels.
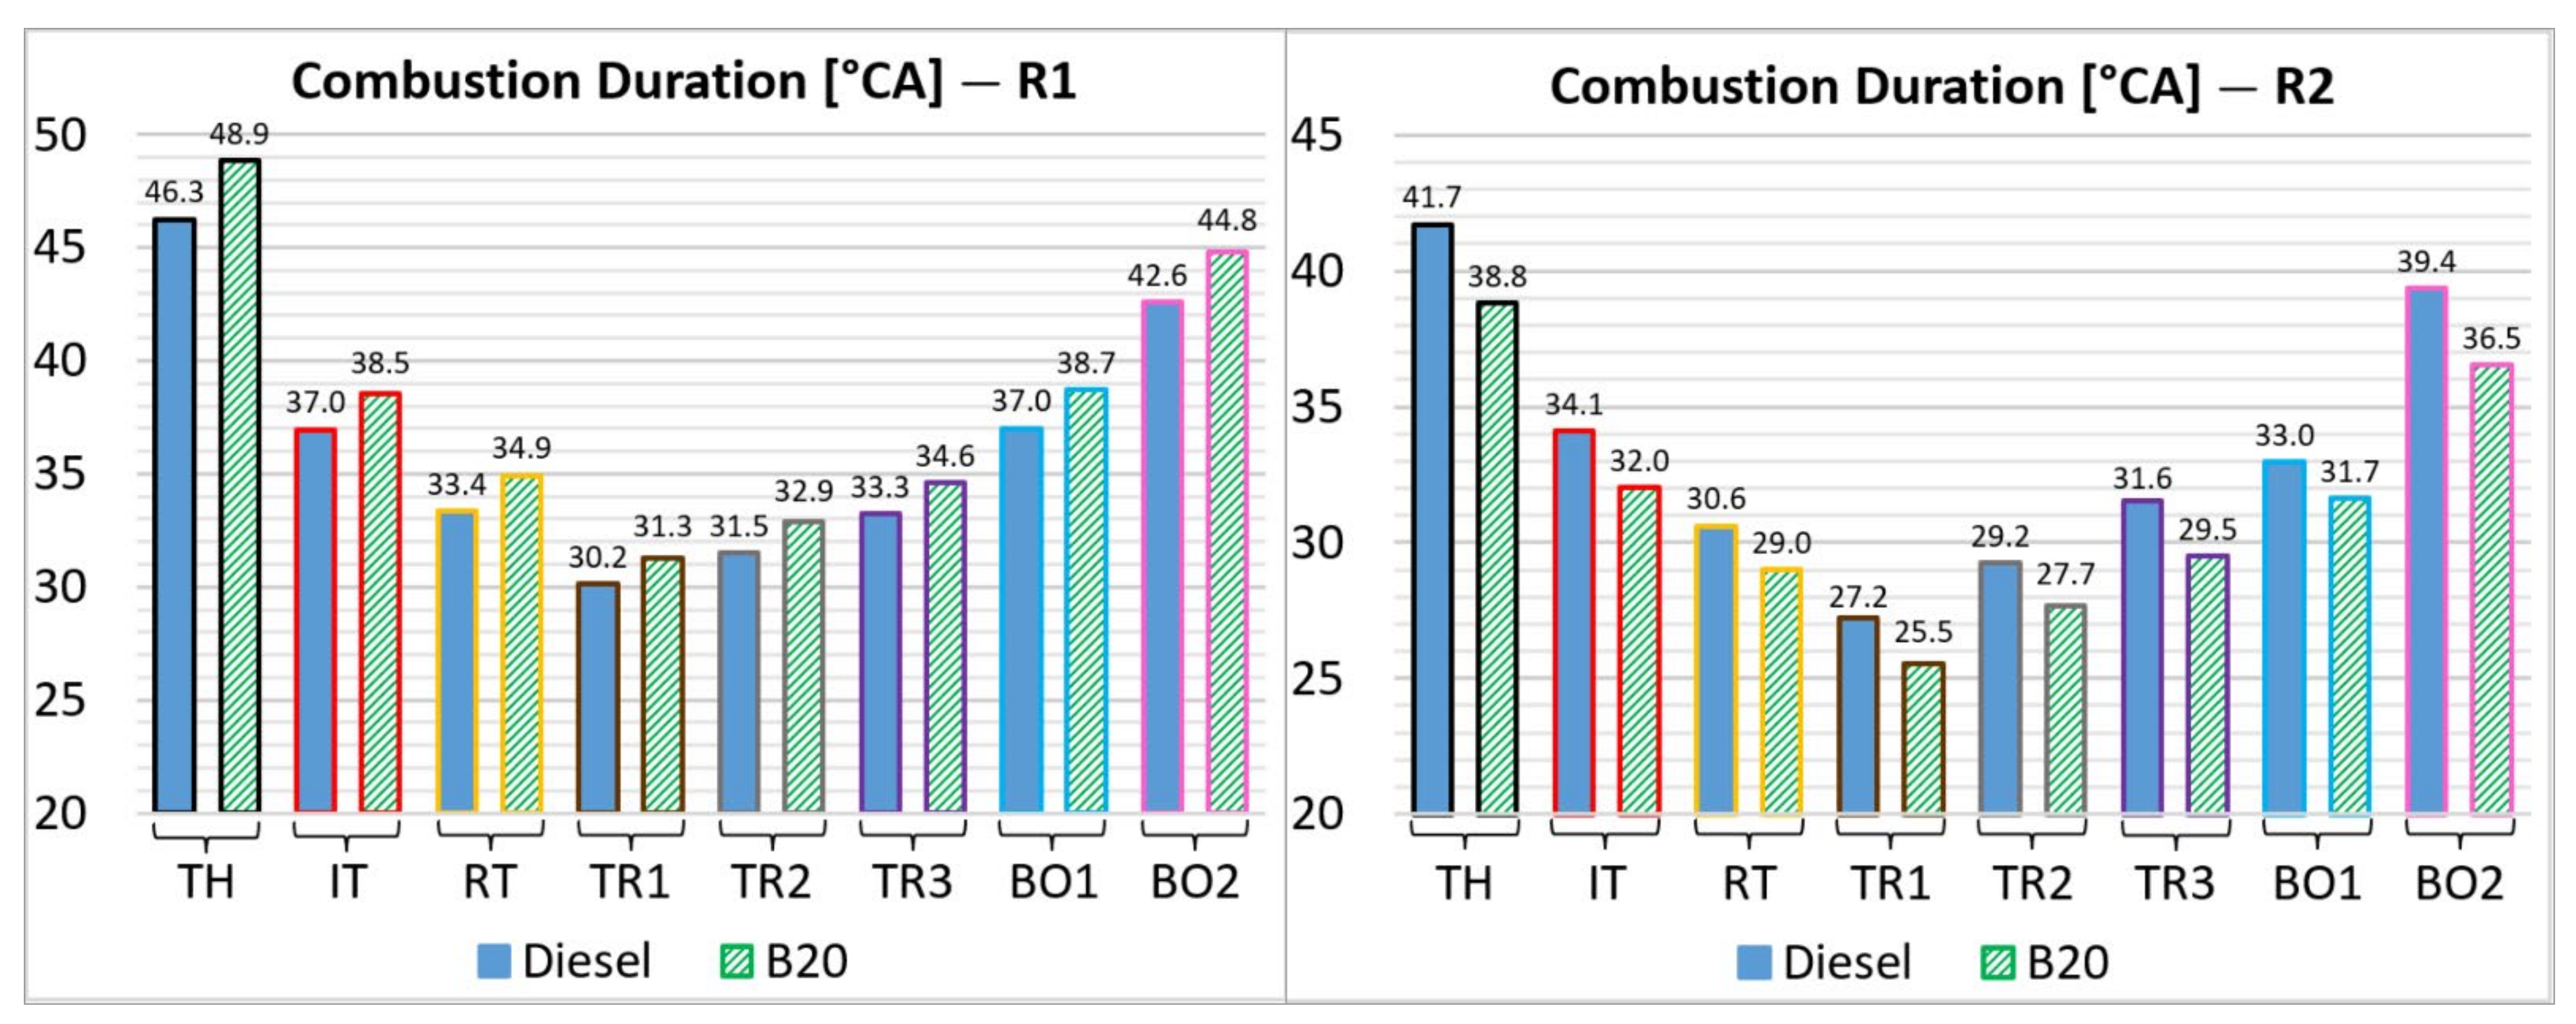
Figure 7 shows the values of total combustion duration versus the ROI shape. The combustion duration is considered as the interval between the start of combustion and the instant when 95% of the mass fraction is burned. The minimum values are obtained for the TR1 shape with a reduction of 34.8% for diesel fuel at both engine test conditions (R1 and R2) and 36% for B20 at R1, respectively, 34.3% at R2. It can thus be pointed out that triangular shapes ensure the fastest combustion by promoting the premixed phase, which clearly explains the occurrence of the highest peak in-cylinder temperatures among the studied ROI shapes (
Figure 8). For both fuels, the maximum combustion duration is reached when using the TH shape. A constant fuel injection speed leads to a longer combustion duration because the fuel is evenly distributed throughout the whole injection process compared to a fast injection when a high amount of fuel concentrates over a certain part of the injection process, which causes a short combustion duration. In such conditions, the combustion process is shifted towards a slower mixing-controlled combustion phase. When using B20 instead of diesel, the fuel mass flow increases by 4.1% for R1 and only by 1.5% for R2. If considering the lower heating value of the fuels, the energy released per cycle is higher when using B20 than using diesel fuel for R1 and lower for R2, which involves a longer combustion duration for R1 and a shorter one for R2. Concerning the influence of the rate of injection shape on combustion duration, comparable results have been reported in [
14,
18,
20] when using diesel fuel.
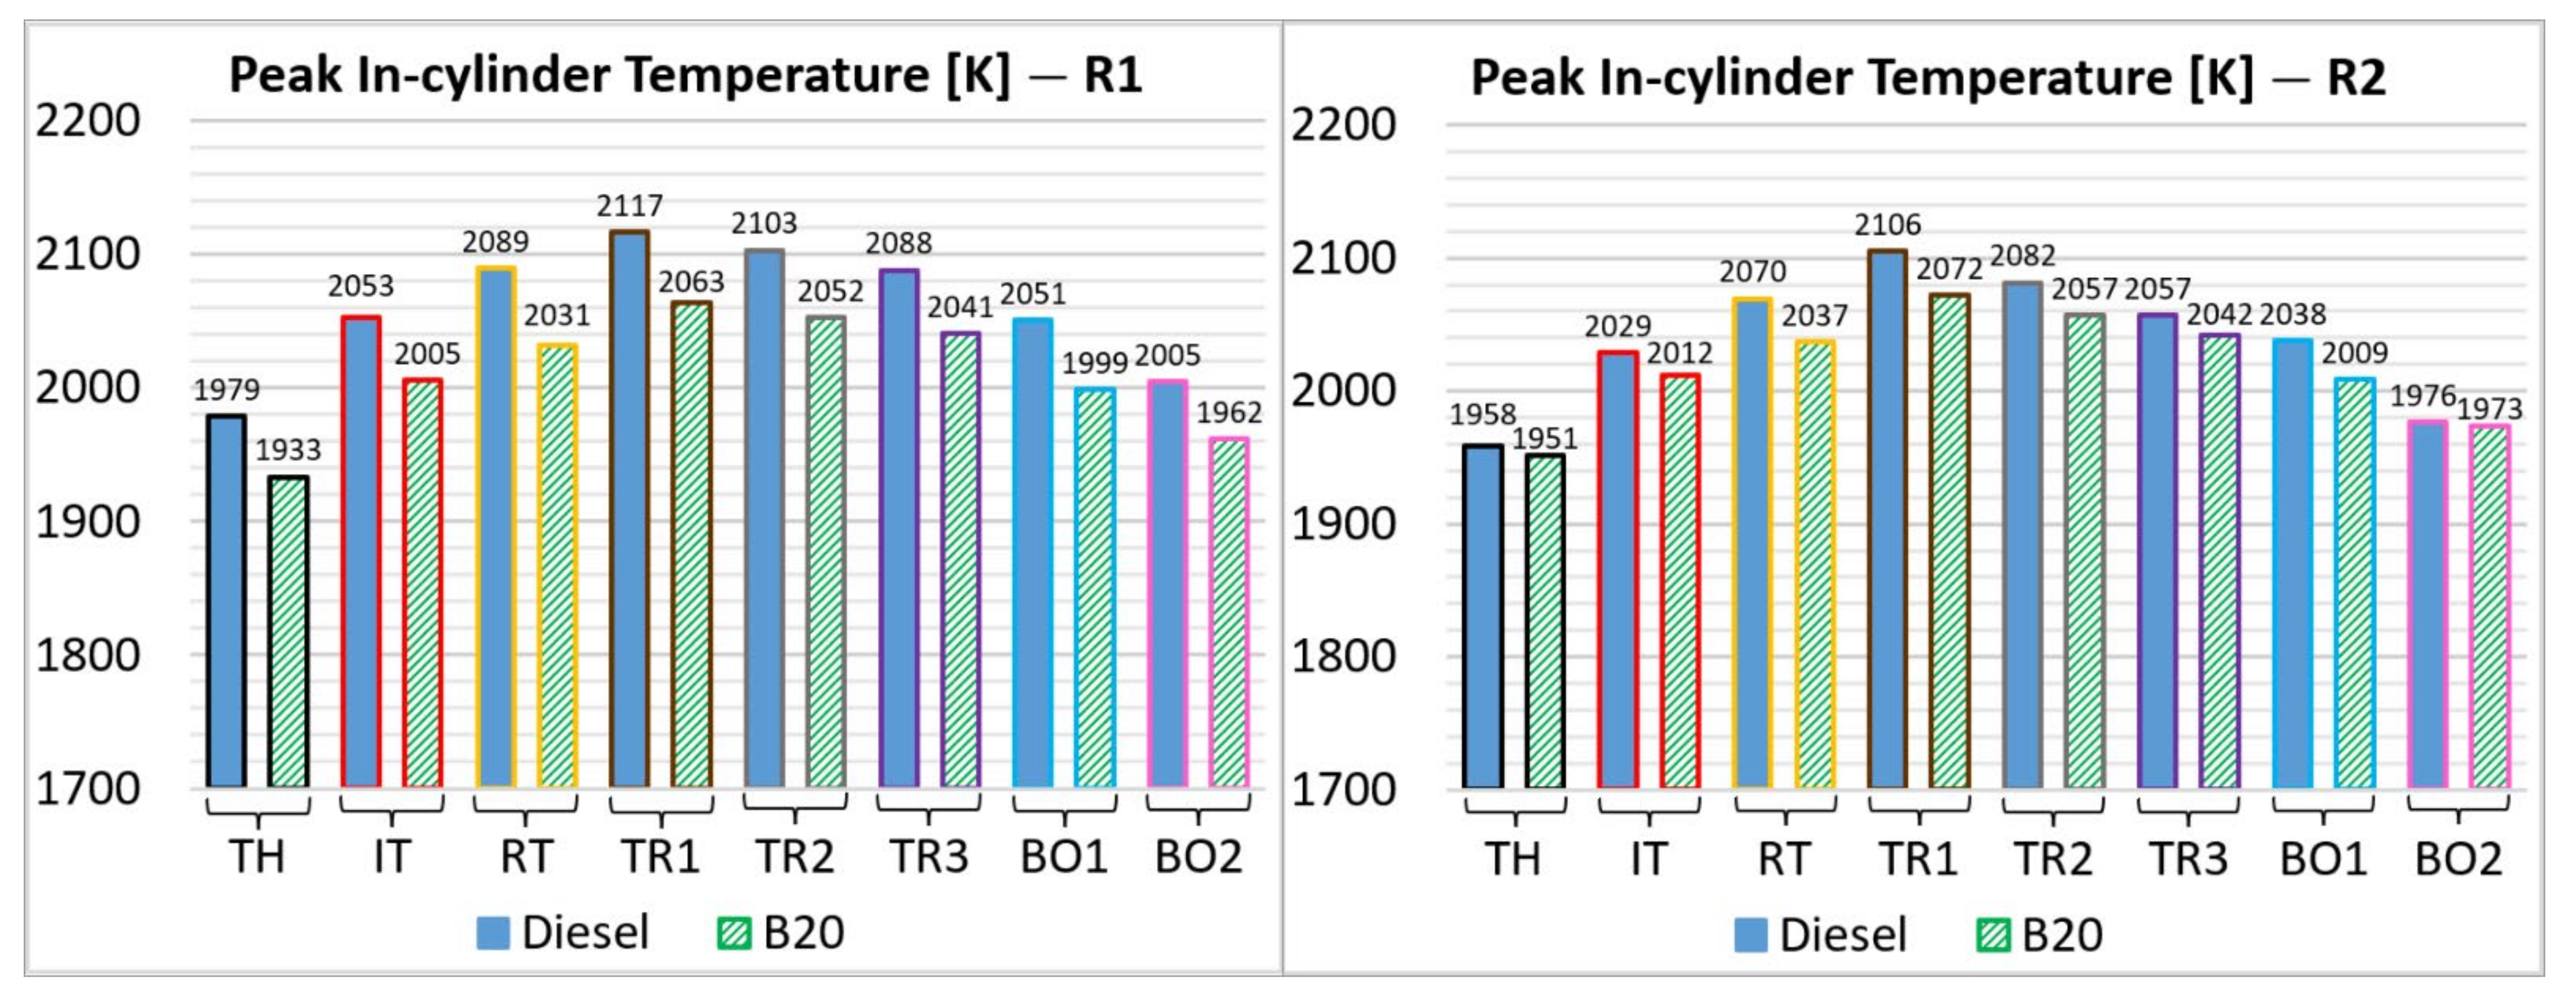
In
Figure 8 are displayed the values of peak in-cylinder temperature versus the ROI shape. The maximum values are obtained for the TR1 shape with an increase of 7% for diesel fuel, 6.7% for B20 on R1 and, respectively, 7.6% for diesel fuel, 6.2% for B20 on R2 relative to the reference TH shape. The minimum values are reached for the reference shape that was used for the model calibration. The shapes which promote the premixed combustion determine higher peak in-cylinder temperatures contrary to the TH and BO2 shapes, which develop the diffusive combustion. The values obtained when using diesel fuel are constantly greater than those achieved when using B20 due to the lower heating value, which is higher for diesel fuel than for B20 (41.87 MJ/kg compared to 40.59 MJ/kg). Similar results regarding the influence of the rate of injection shape on the peak in-cylinder temperature when using diesel fuel were reported in [
14,
15,
22].
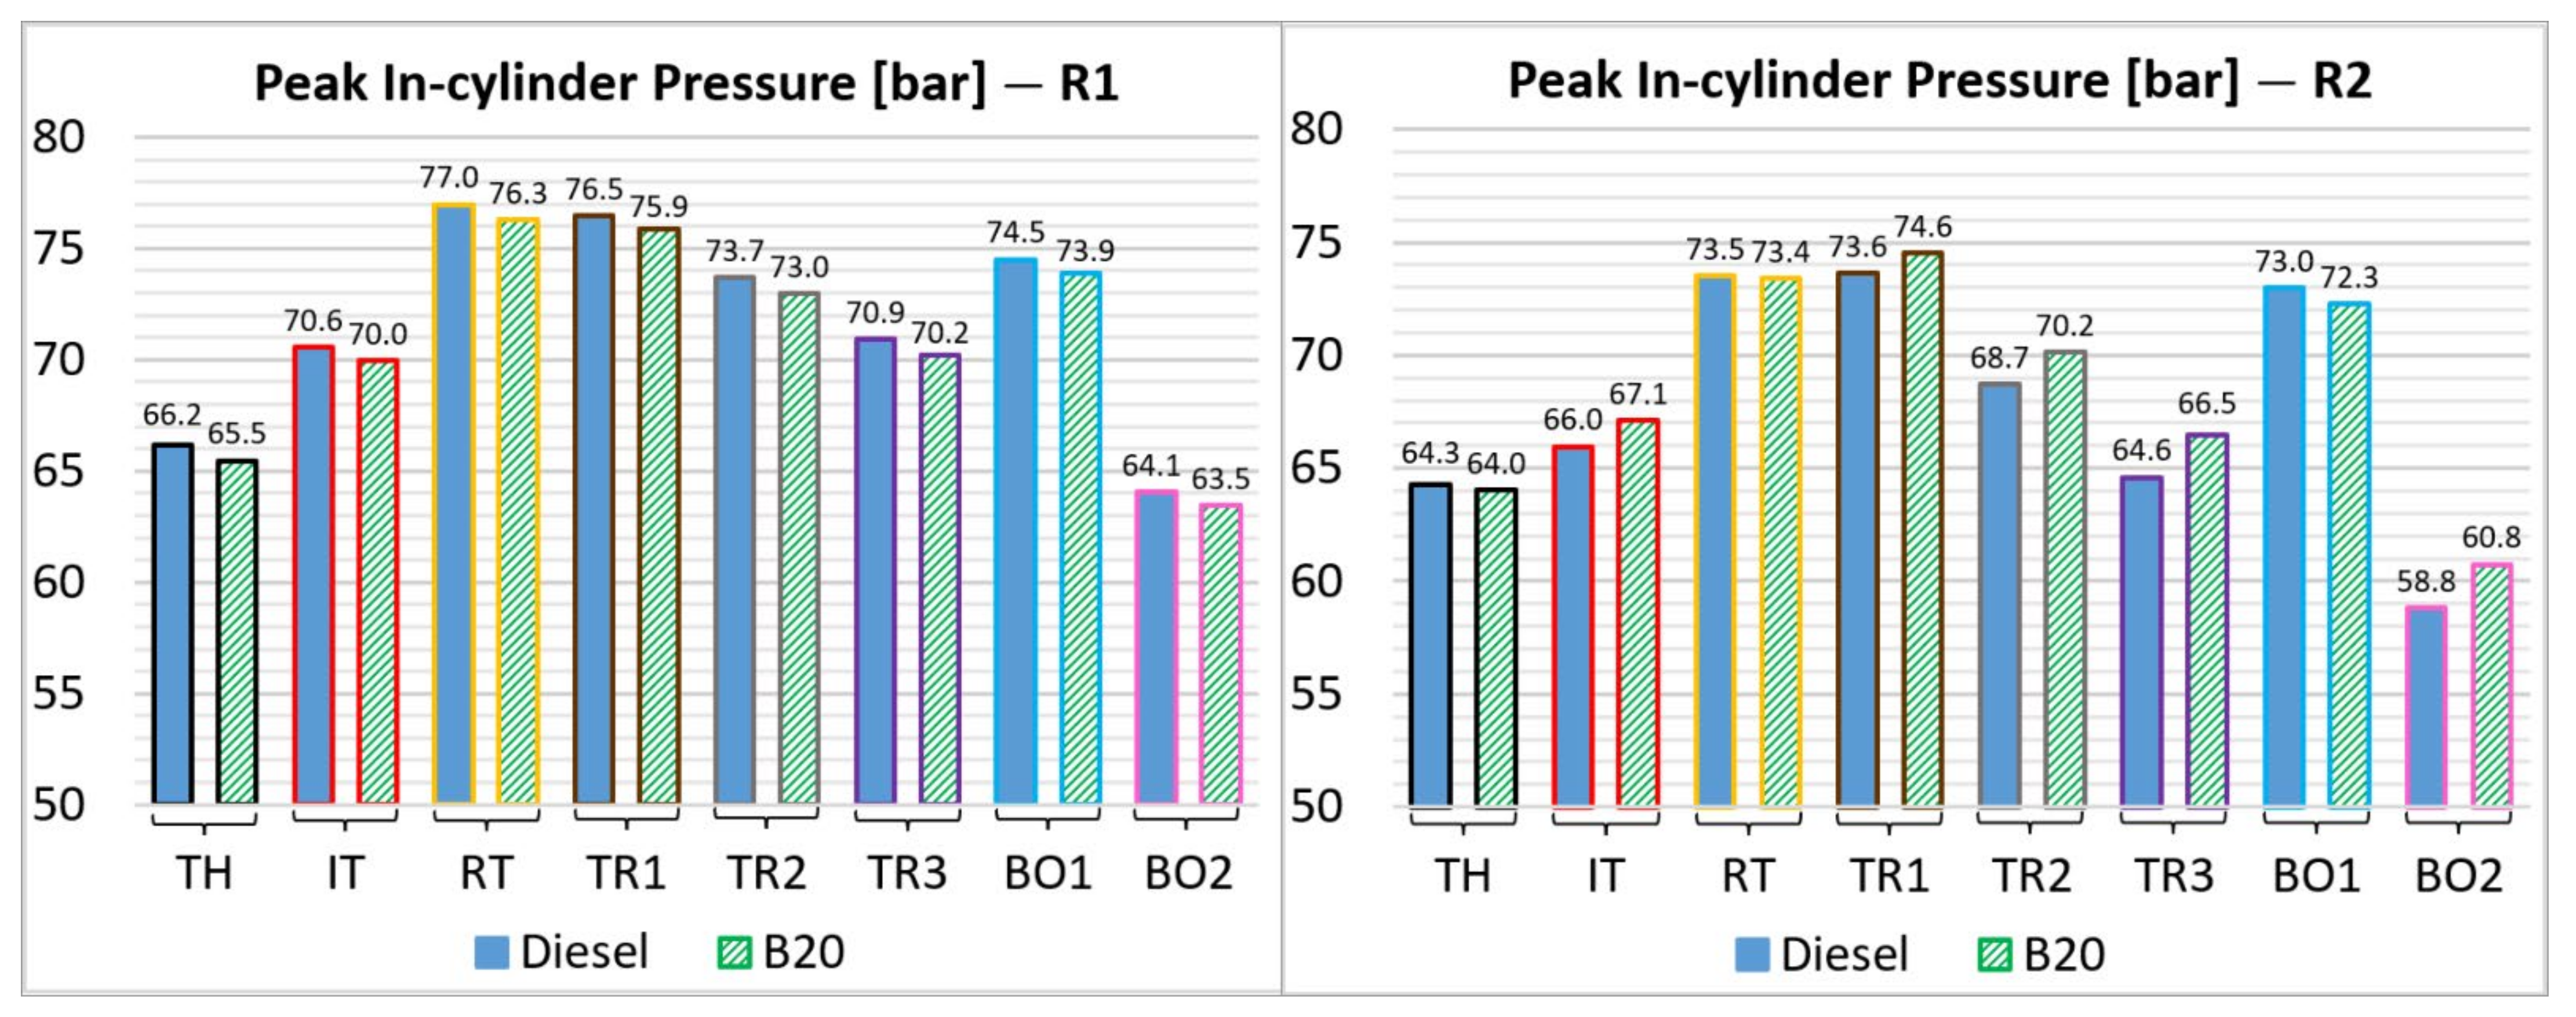
Figure 9 shows the dependence of peak in-cylinder pressure values on the ROI shape. The minimum values are reached for the BO2 shape with decreases of 3.1% for both fuels on the R1 operating condition, respectively 8.6% for diesel fuel and 5% for B20 on R2 because most of the fuel is late injected, at the beginning of the expansion stroke. For the R1 condition, the highest values are obtained with the RT shape presenting increases of 16.3% for diesel fuel and 16.5% for B20. For the R2 condition, such maximal values are obtained with the TR1 shape showing increases of 14.5% for diesel fuel and 16.6% for B20. The maximum values are reached for these shapes, because the fuel amount is rapidly injected at the end of the compression stroke compared to the other shapes. Comparable results on the peak in-cylinder pressure for diesel fuel were reported in [
7,
15,
18,
20,
21,
23] for biodiesel usage. The increase in thermal efficiency when using triangular shapes is also reported in [
18].
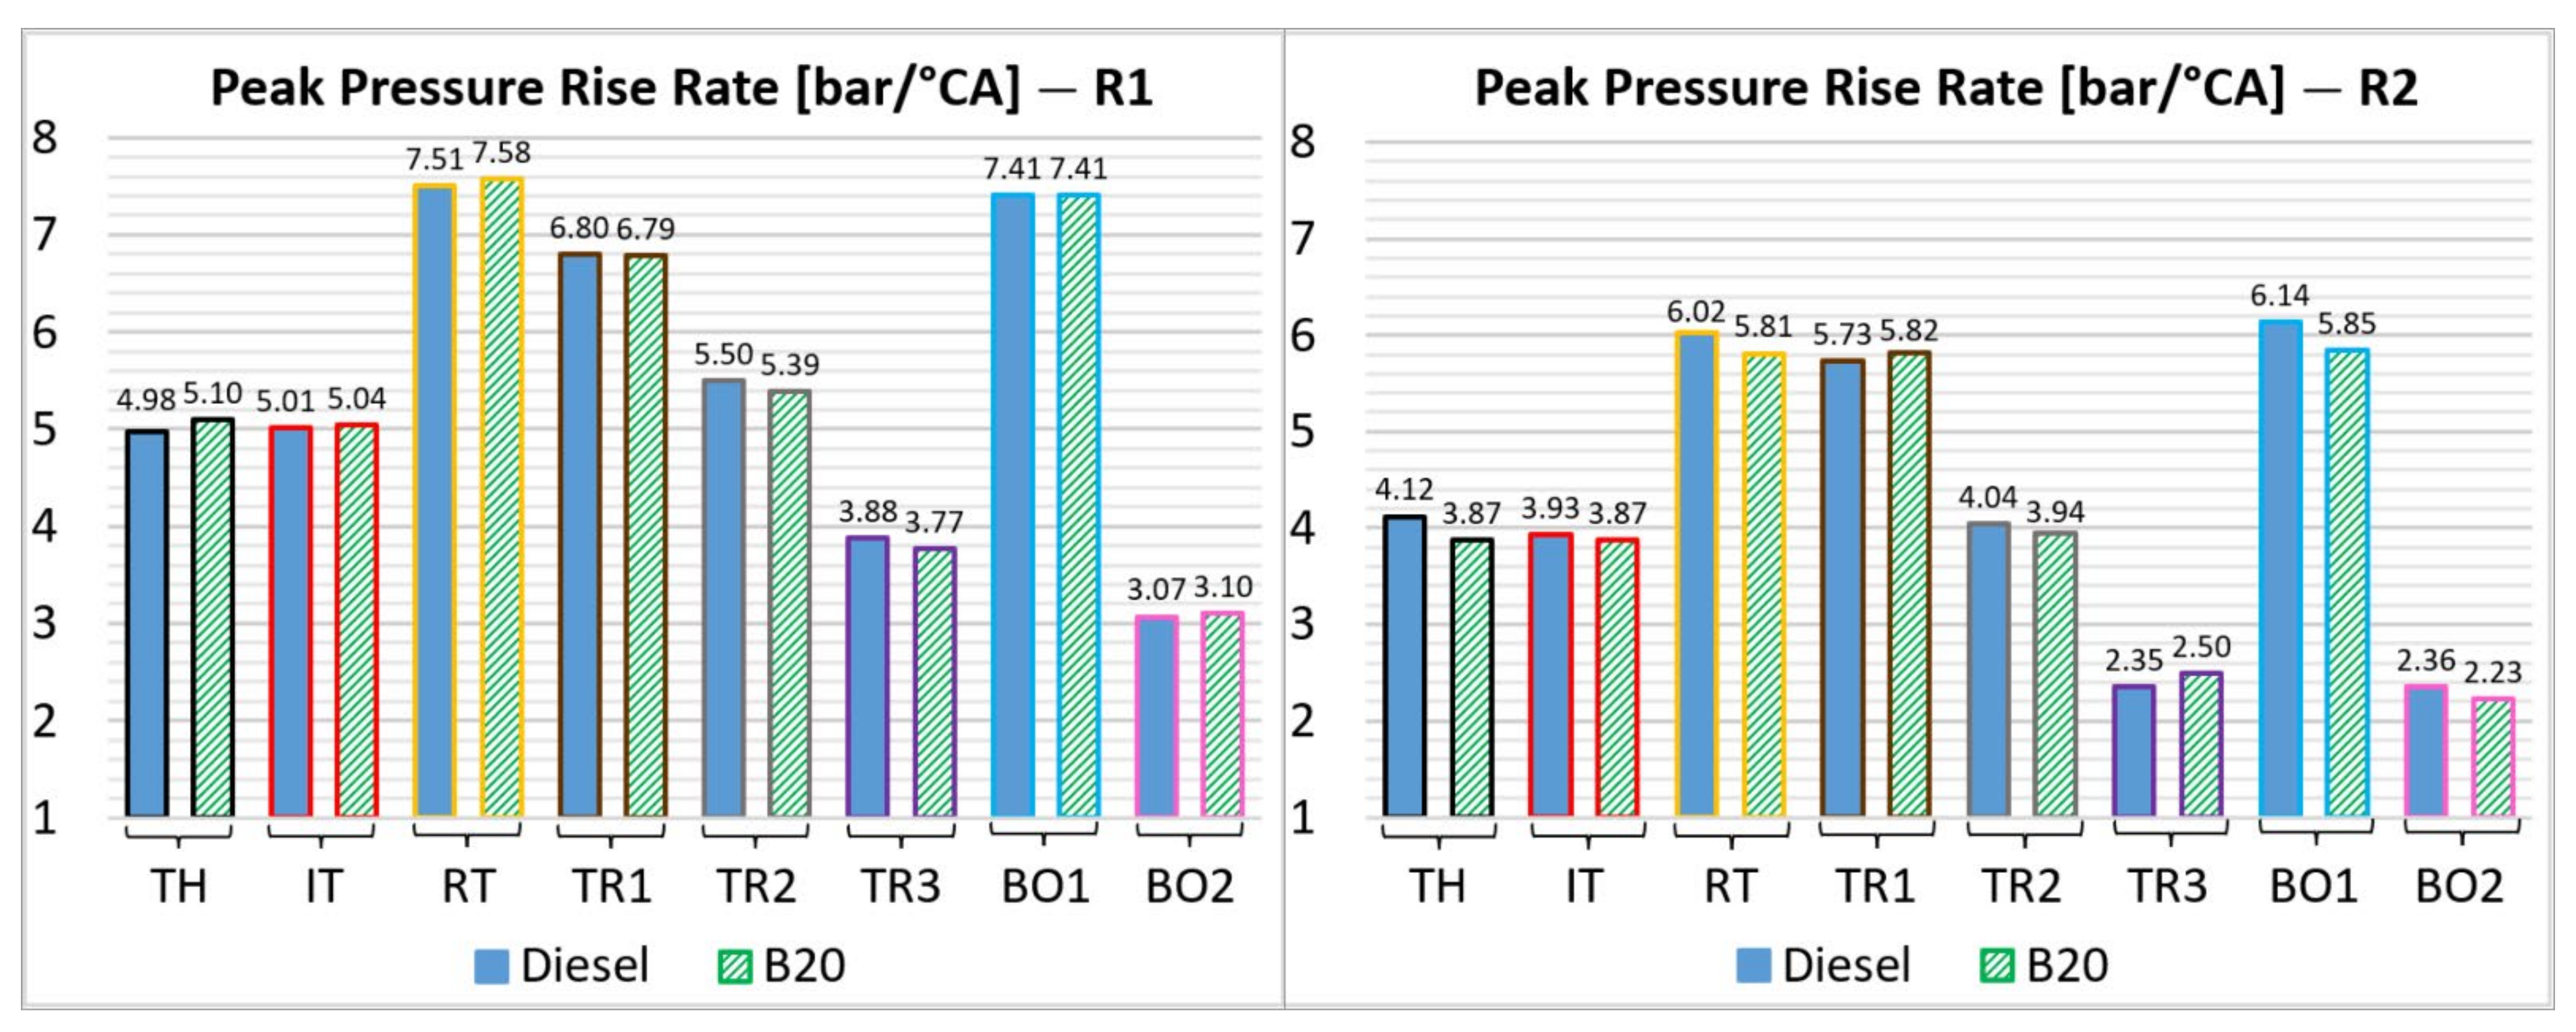
It is known that the peak in-cylinder pressure rise rate has a strong influence on the engine noise.
Figure 10 exhibits the values of this parameter relative to the ROI shape. For the same reason mentioned in the comments of
Figure 9, the minimum values of peak pressure rise rate are obtained by using the BO2 shape with reductions of 38.4% for diesel fuel and 39.2% for B20 on the R1 condition, respectively of 42.7% for diesel fuel and 42.4% for B20 on the R2 condition. The maximum values are achieved on the R1 when using the RT shape displaying increases of 50.8% for diesel fuel and 48.6% for B20, while on the R2 by using the BO1 shape, the increases are 49% for diesel fuel and, respectively, 51.2% for B20. Similar conclusions regarding the influence of the rate of injection shape on peak pressure rise rate when using diesel fuel were reported in [
18]. It was emphasized that triangular rate-shape injections give higher in-cylinder pressure rise rates as compared to ramp rate-shape injections and, furthermore, the injection rate shaping causes combustion phasing to occur.
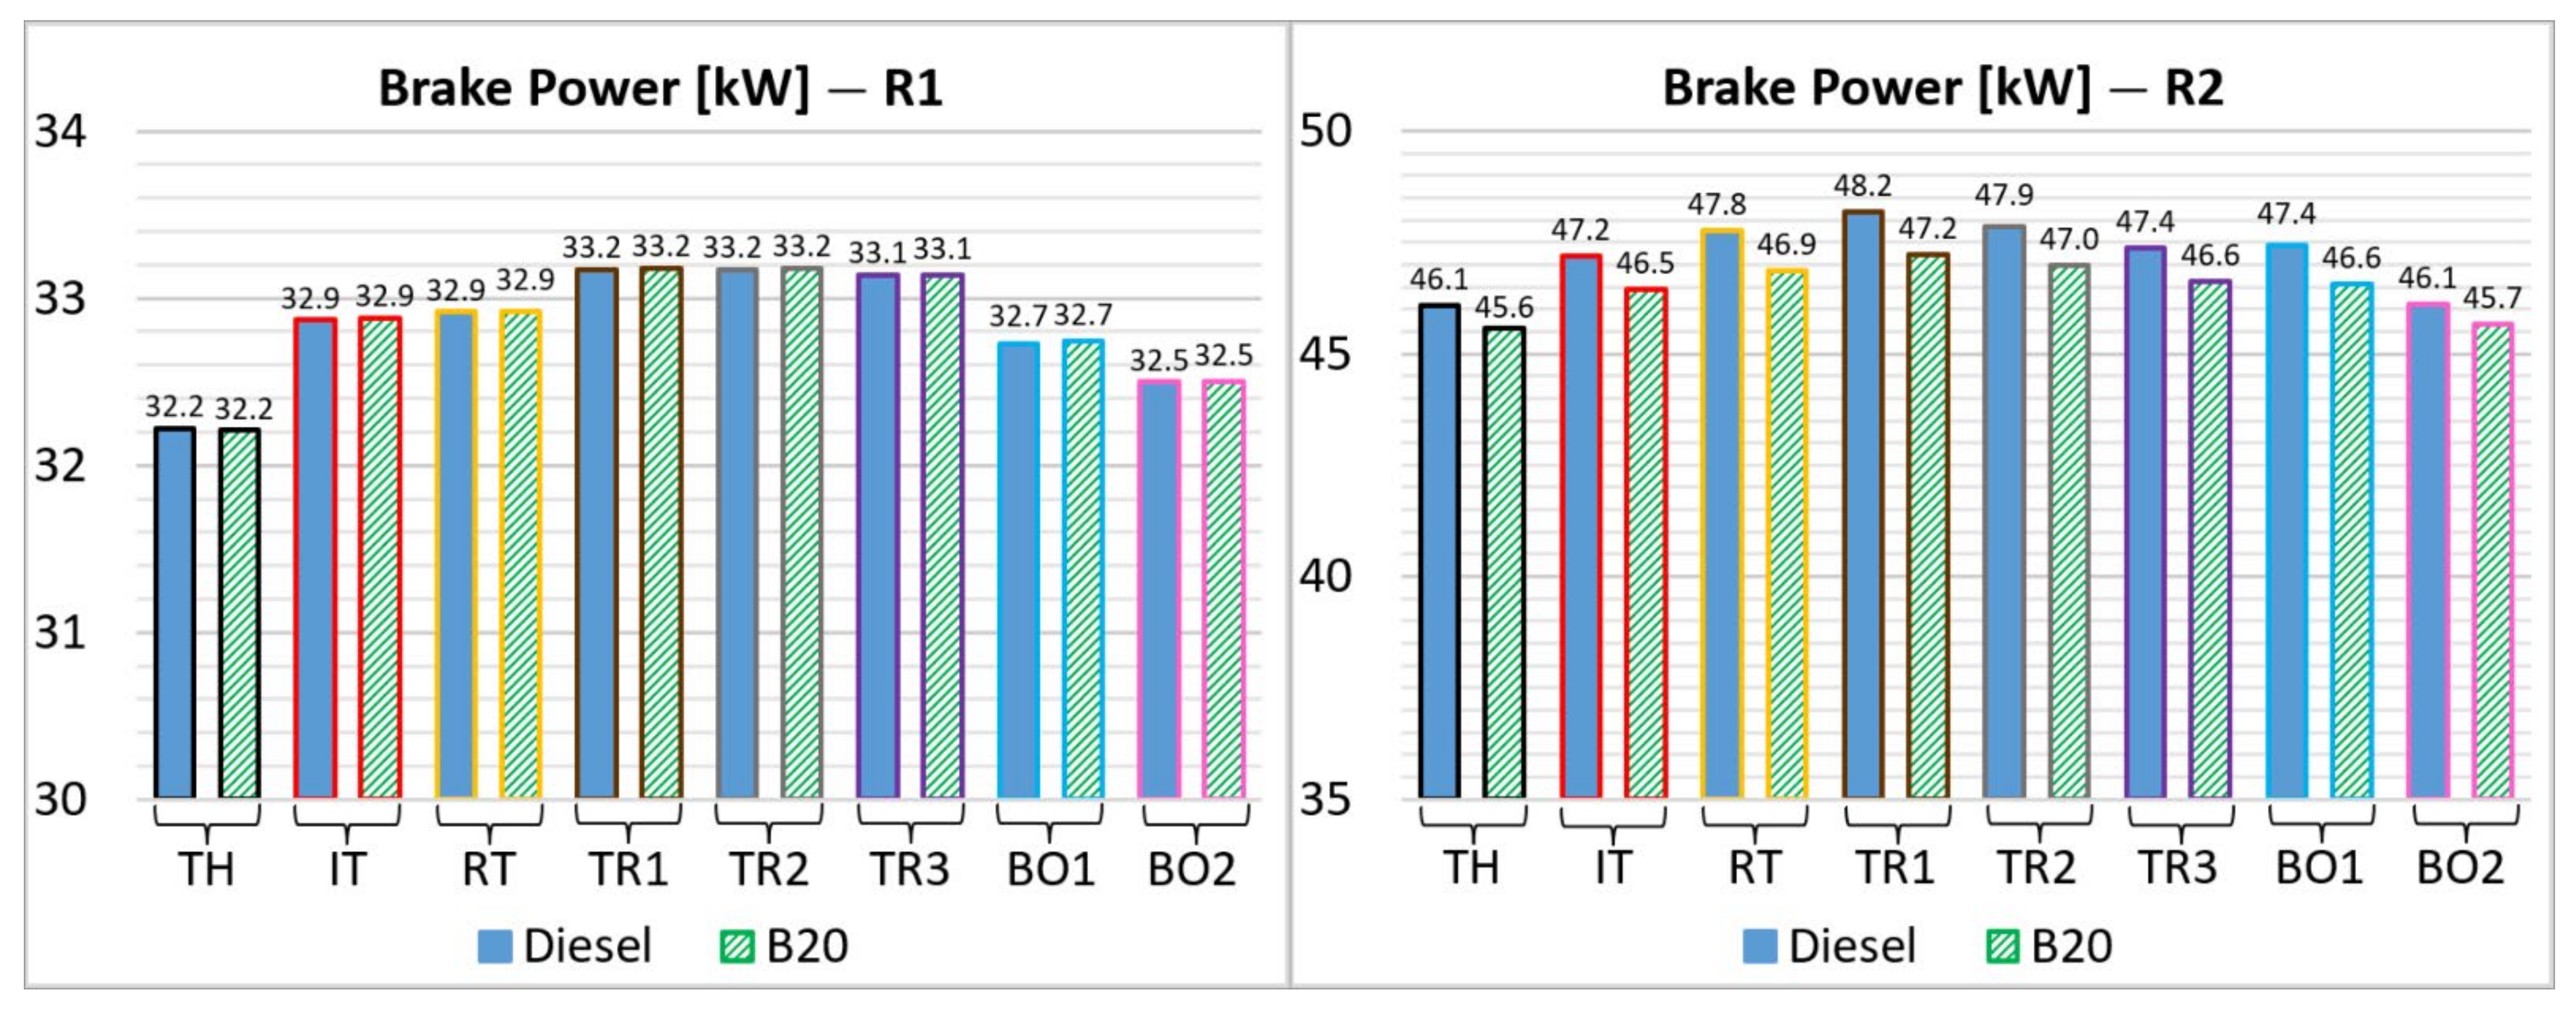
In
Figure 11 are displayed the values of brake power versus the ROI shape. It can be noticed that, for the R1 operating condition, all the triangular shapes offer maximum performance in respect to the reference TH shape with an average increase of 3% for diesel fuel and B20. At the same time, similar results are registered with the TR1 shape on the R2 operating condition, with an increase of 4.6% for diesel fuel and 3.5% for B20. These results occurred because, for all triangular shapes, the combustion durations are shorter and the combustion process is well situated relative to the region with minimum cylinder volume variation, leading thus to higher peak in-cylinder temperatures and increased efficiency values of engine operation. Using the BO2 shape, lower power was obtained. The brake power has almost the same value for both fuels on the R1 test condition, because the increase in fuel consumption of 4.1% when fuelling with B20 relative to diesel fuel is high enough to compensate for the decrease of 3.1% in the lower heating value. However, in the R2 operating state, the increase in fuel consumption of B20 is only 1.5% and this cannot compensate for its reduced lower heating value, the brake power standing smaller for all the injection shapes considered.
The variation of brake-specific fuel consumption (BSFC) generated by the alteration of the injection rate shape is presented in
Figure 12. The triangular shapes offering the highest engine brake power involve the lowest values of BSFC (high performance and efficiency). For these shapes, on R1 there are reductions in BSFC of 2.9% for both fuels, and for TR1 on R2 the reductions are 4.3% for diesel fuel, respectively of 3.5% for B20. The TH and BO2 shapes with minimum performances lead to maximum values of BSFC. There are not practically significant differences in the BSFC variation with the ROI shapes for B20 relative to diesel fuel, because the altering of the ROI shape does not significantly change the brake power variation when switching from diesel fuel to B20. The slightly elevated values of BSFC in the case of B20 usage, for all the ROI shapes considered, are determined by the higher amounts of fuel injected. The physical properties of biodiesel, notably viscosity and density, are responsible for the higher injected amounts of B20 fuel. In [
13], it was also highlighted that the boot-like rate shapes which concentrate higher amounts of fuel at the end of the injection process produce a general increase in BSFC.
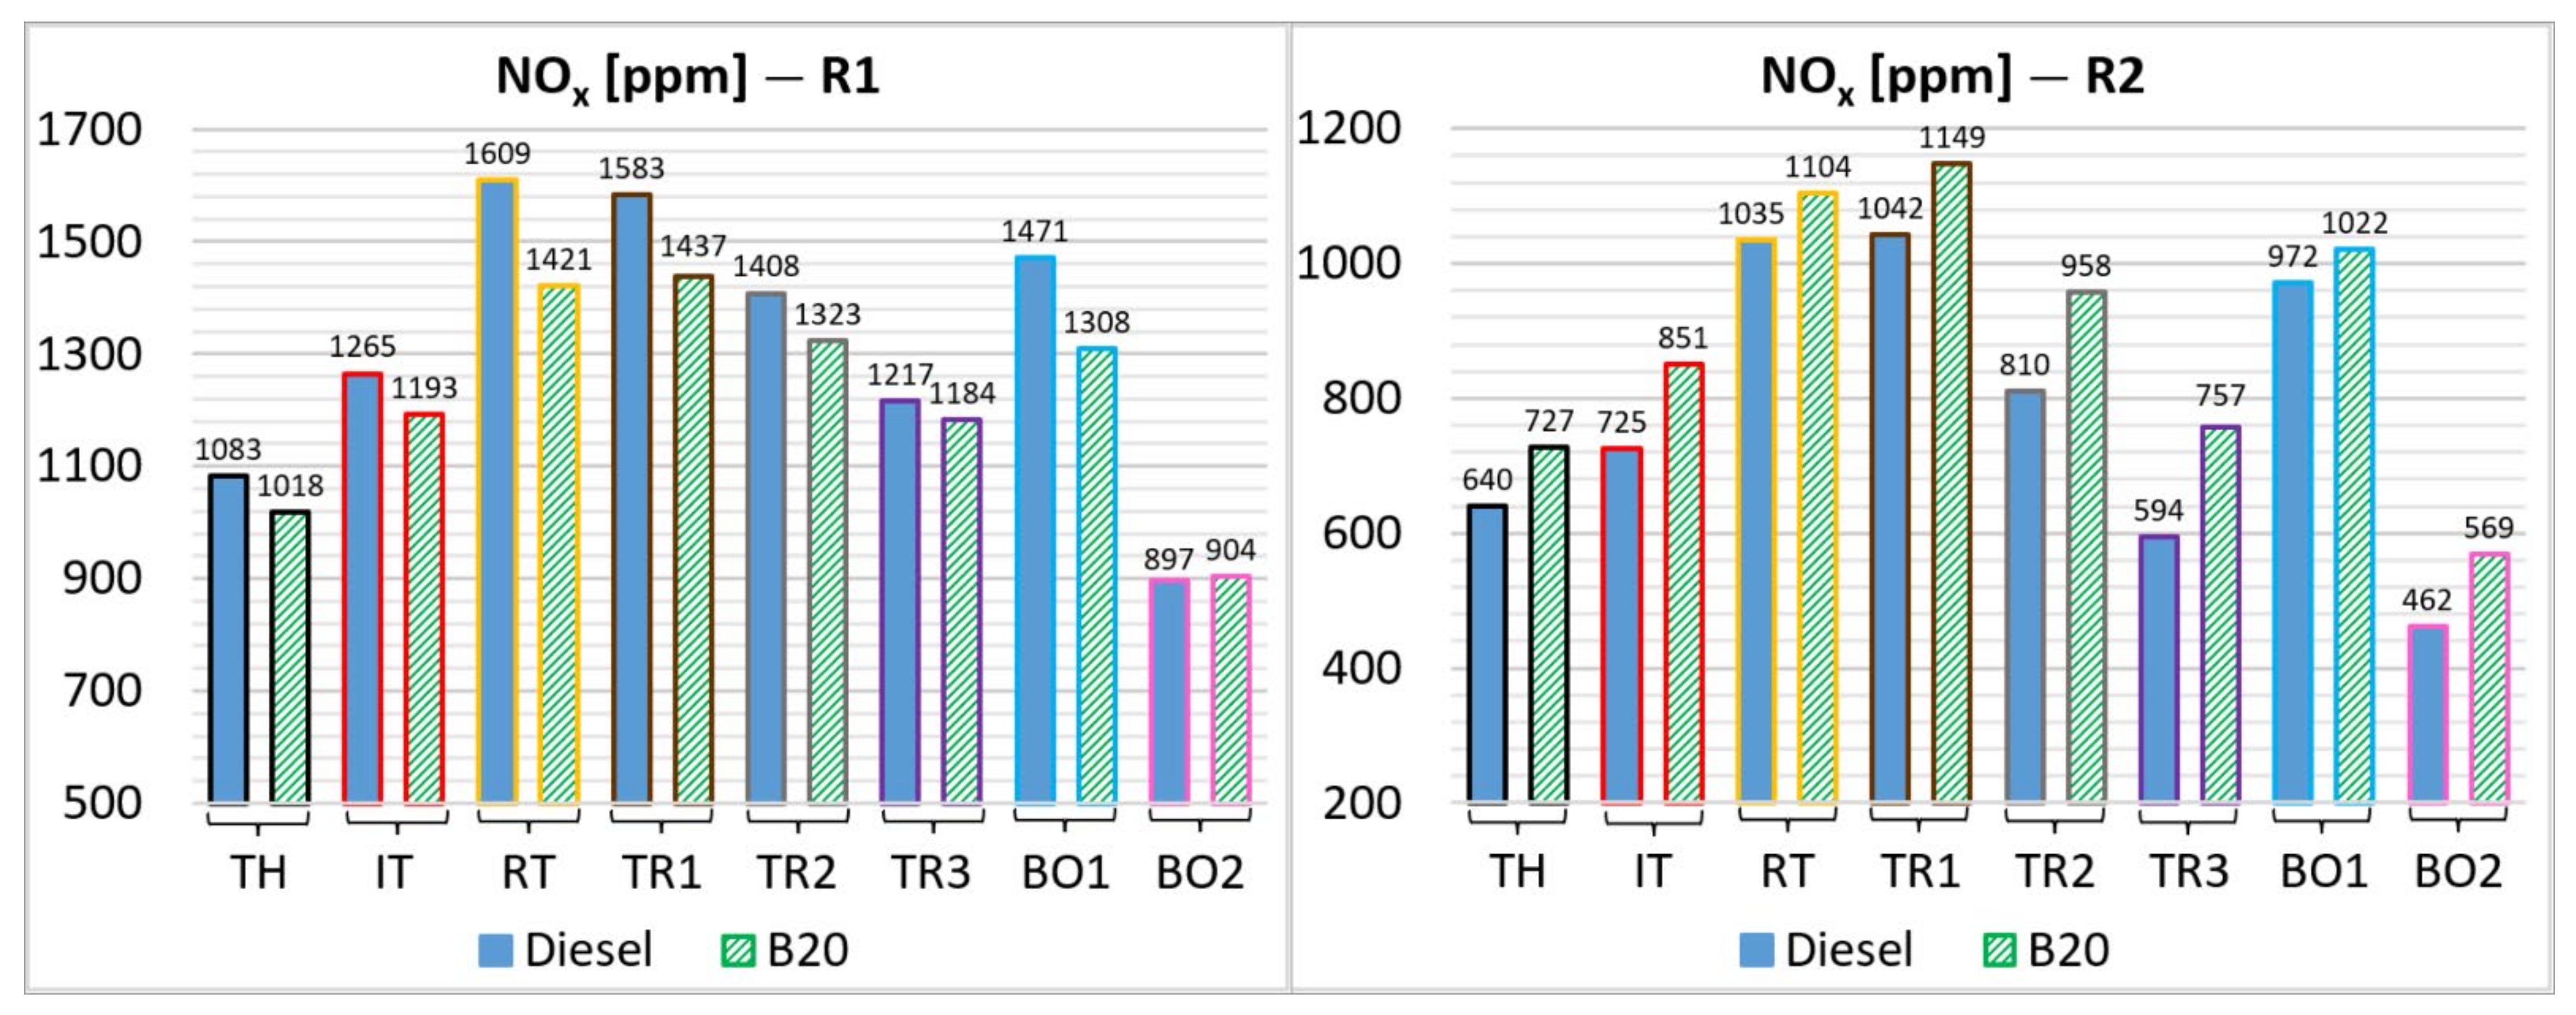
Figure 13 shows the variation of nitrogen oxides (NO
x) emissions depending on the ROI shape. The minimum values are obtained for the BO2 shape with decreases of 17.2% for diesel fuel and 11.2% for B20 on R1. Higher reductions of 27.8% for diesel fuel and 21.7% for B20 are registered on R2 due to the combined effect of smaller peak in-cylinder temperatures and the development of diffusion combustion. The maximum values of NO
x are obtained for RT and TR1 shapes with average increases on R1 by 47.4% for diesel fuel, and 40.4% for B20, respectively on R2 by 62.3% for diesel fuel, and 55% for B20, because, with these shapes, the highest values of peak in-cylinder temperature are attained. For the R2 test condition, although the peak in-cylinder temperatures are lower when using B20 than diesel fuel, the NO
x emissions are higher due to its superior oxygen content. However, this effect is overpassed, and the trend is reversed in the case of the R1 test condition because of the elevated differences existing between the two fuels in terms of peak cylinder temperatures and combustion durations. Comparable results regarding the NO
x emissions when using diesel fuel were reported in [
9,
10,
12,
13,
15,
18,
21,
22]. However, different results are presented in [
7], where, for some increases applied at the beginning of the injection rate on certain boot shapes, the decrease of NO
x emissions was registered.
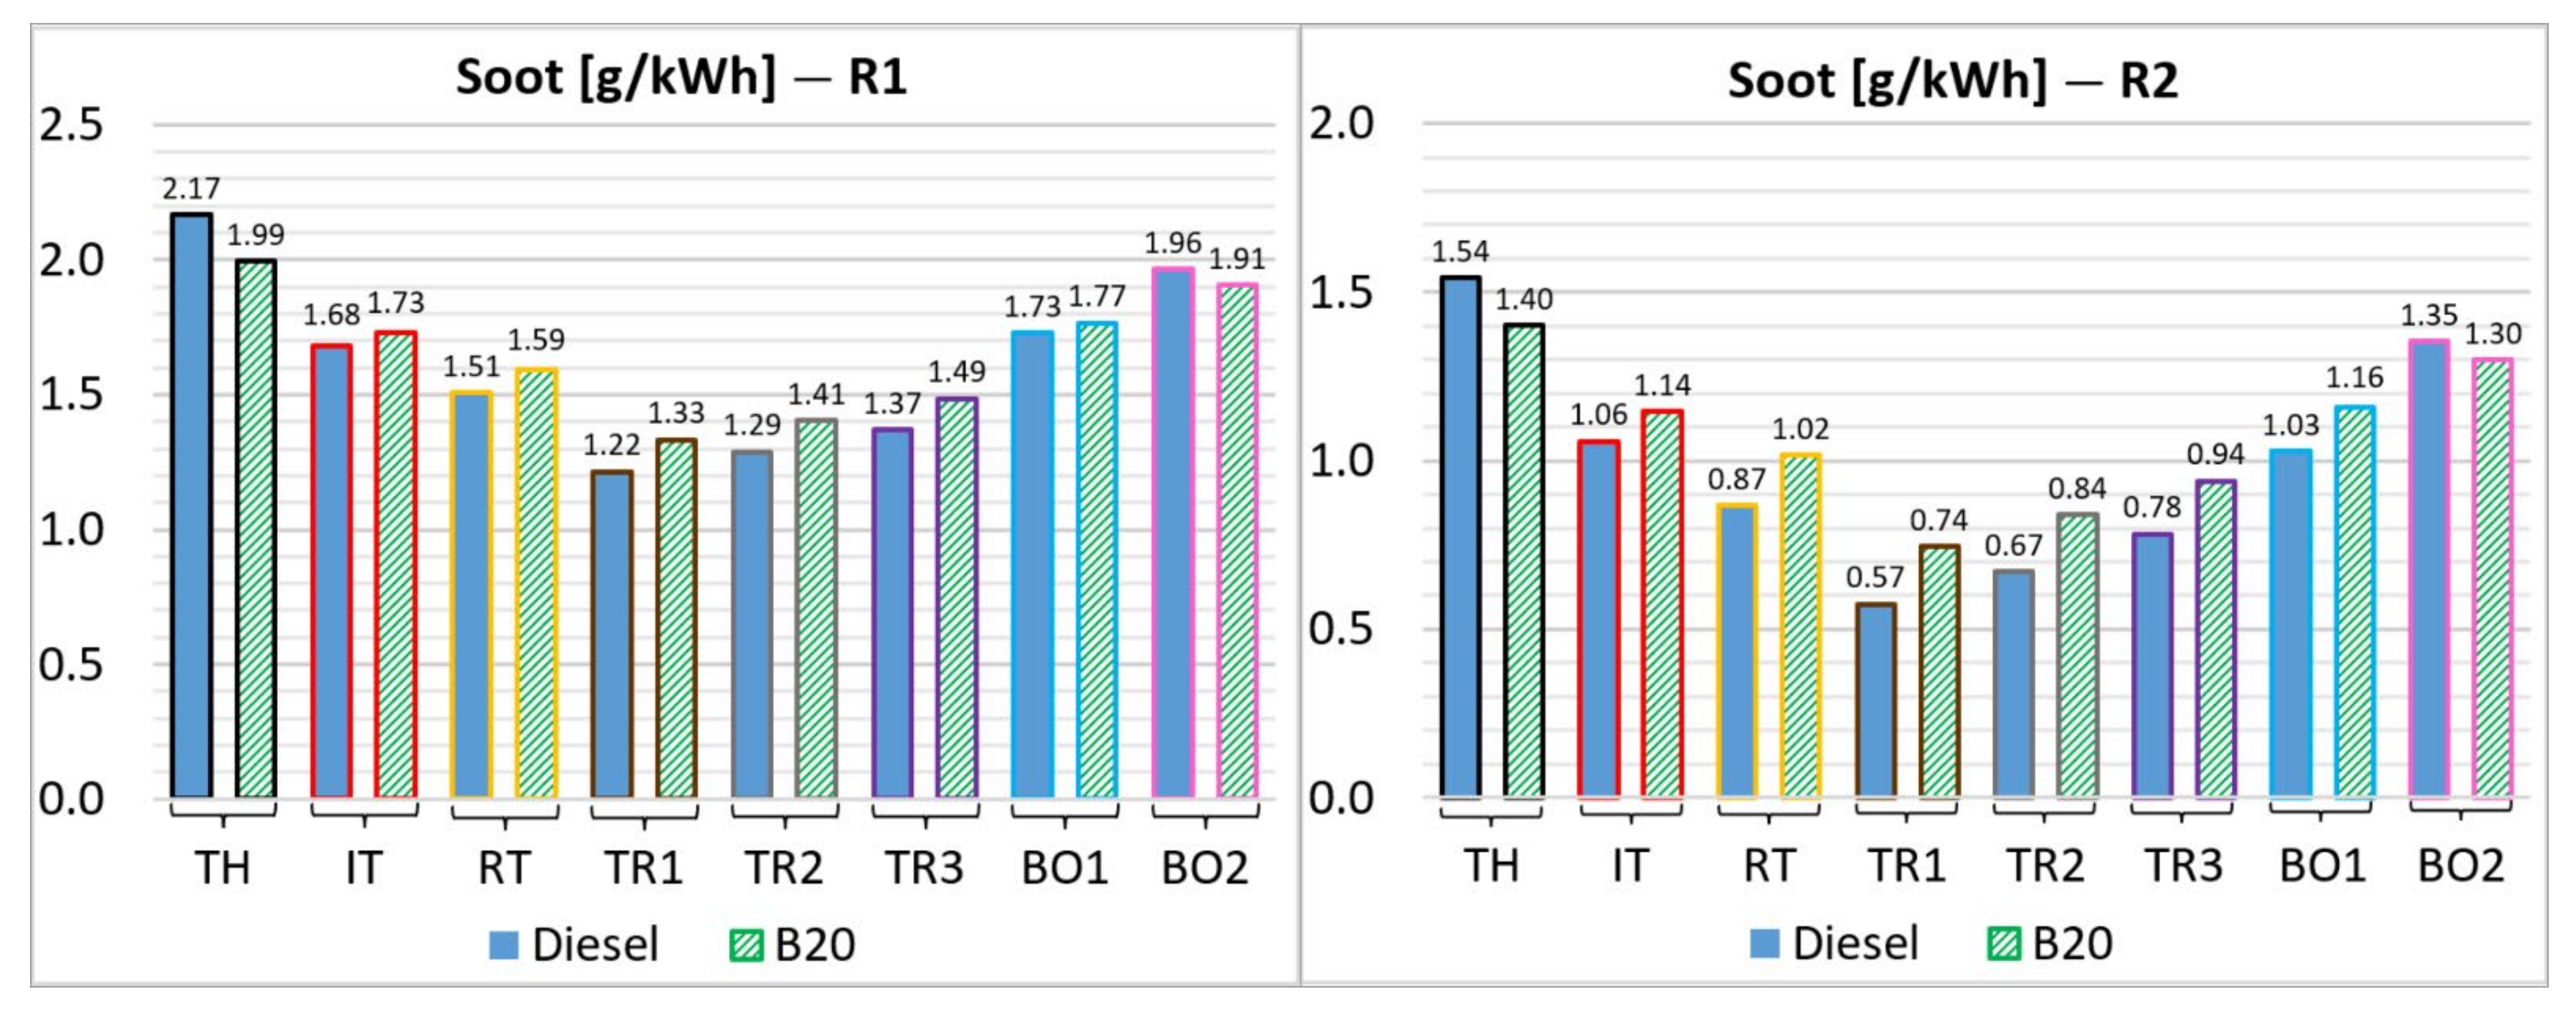
Figure 14 exhibits the values of Soot emissions relative to the ROI shapes. The minimum values are obtained for the TR1 shape with reductions of 43.8% for diesel fuel and 33.2% for B20 on R1. For the other operating condition R2, the Soot reduction with the TR1 shape relative to the TH is 63% for diesel fuel and, respectively, 47.1% for B20. The ROI shapes, which concentrate a large amount of fuel injected up to the ignition time, enhance the mixing process and promote faster burning rates, which lead to higher NO
x and lower Soot emissions. For both fuels, the maximum Soot values are obtained with the TH shape. Similar results on Soot emissions for diesel fuel usage have been reported in [
9,
10,
13,
15,
22]. Nevertheless, some different results were presented in [
7], where, for increased values of injection rate at the beginning of the injection process on certain boot shapes, higher Soot emissions were disclosed.
As previously noted, the premixed combustion phase significantly influences the NO
x and Soot emissions generation process. In this sense, a final part of this study was dedicated to the link existing between the amount of fuel injected in the initial stage of combustion and the values of pollutant emissions. For such analysis, the connection existing between the surface area under the ROI shapes (between the SOI– and MFB10% events) and the magnitude of NO
x and Soot emission values was evaluated. The calculated values of surface area are presented in
Table 6 for each ROI shape. The BO1, RT and TR1 shapes presented relative to the TH reference shape higher values of this surface area with average increases for both fuels of 25.8%, 24% and 19.2% on the R1 operating condition and, respectively, of 28.1%, 25.7% and 26.5% for the R2 test condition.
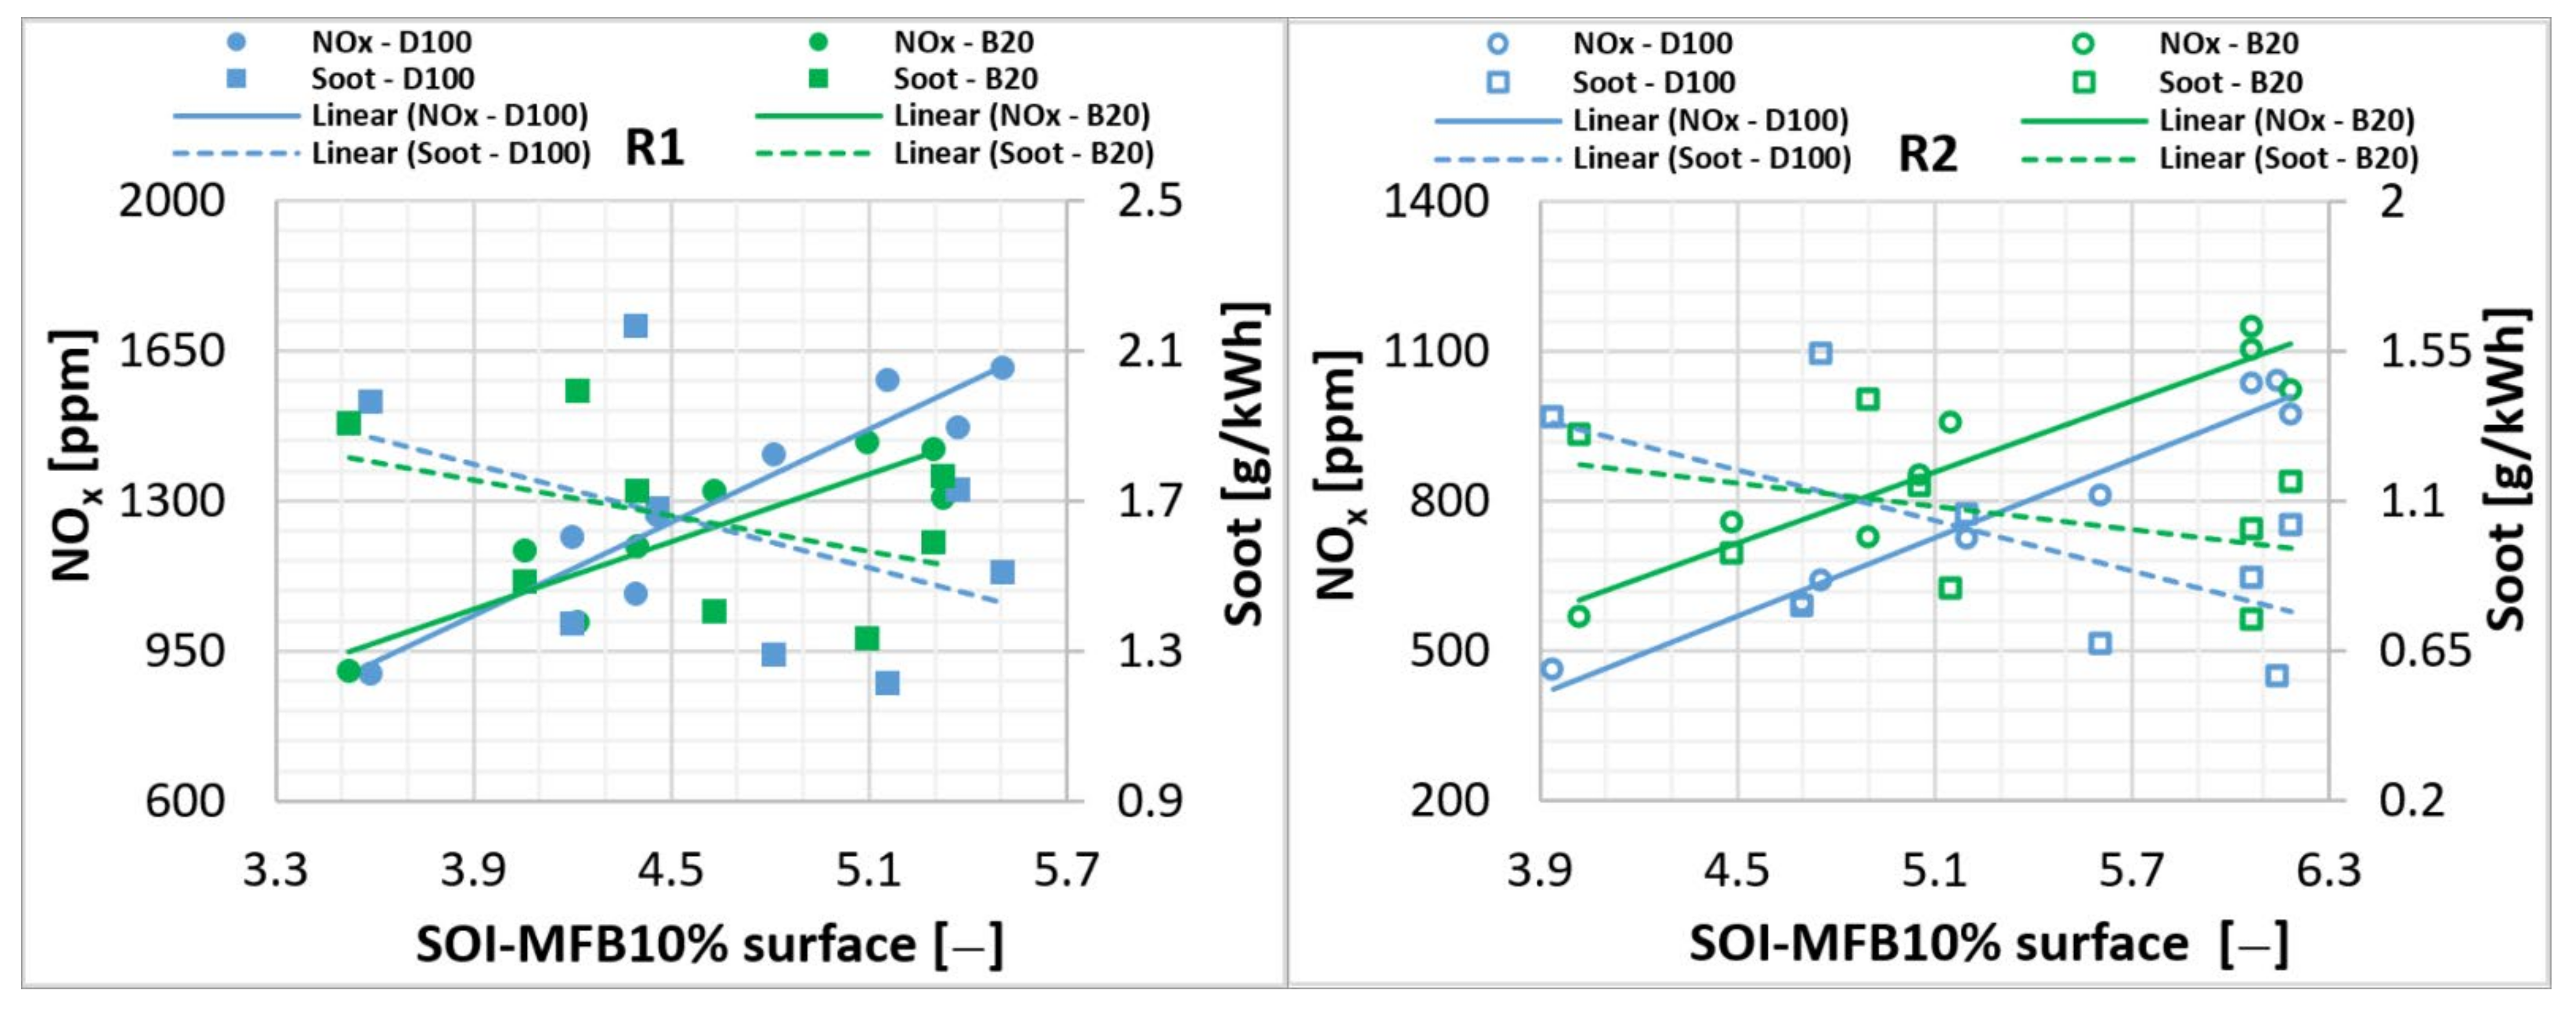
Figure 15 shows the variations of NO
x and Soot emissions versus this surface area of injected fuel amount during the initial combustion stage. The correlation which can be detected is practically linear for both engine operating conditions and both fuels. An increase of 53% in the injection area for diesel fuel on R1 (from 3.6 to 5.5) is leading to an increase of 76% in NO
x on the trendline. A similar trend is registered for B20 too, but with a smaller increase of 50%. The Soot variation is however reversed, its decrease being of 24% for diesel fuel and 16% for B20 on the trendline, over the same range of the injection area. In the case of R2, the correlation remains linear, but it presents some differences existing between diesel fuel and biodiesel B20 mostly for NO
x. The slopes of linear correlation for NO
x seem to have the same values for both fuels, but on B20, superior absolute values are registered. An increase of 57% of the injection area (from 3.9 to 6.2) is leading to a rise of 138% in NO
x emissions on the trendline for diesel fuel. On the same domain of the injection area, the average growth of NO
x emissions is smaller for B20, being around 86%. The Soot variation remains quasi similar for both fuels with a dropping on the trendline by 43% for diesel fuel and, respectively, 21% for B20.


