Abstract
The project FUXYA2020 was intended to design and prototype a low-cost basic energy dispersive X-ray fluorescence spectrometer for all those cases where there is not enough financial support to buy a commercial device. Indeed, home-made instruments are ideal when funds are low but constant over the years, as this approach allows the costs to be spread over a longer period of time. The FUXYA2020 was intended mostly for cultural heritage (CH) applications: we optimized the geometry to meet the requirements for both low Z matrix objects, such as glasses and ceramics, and medium-high Z materials, such as metals; besides, we designed a positioning system through Arduino components to obtain good results and repeatability for samples with a complex geometry. The FUXYA2020’s performance was tested both for qualitative and quantitative analyses, the former on pigment layers, and the latter on gold-based certified alloys, exploiting Axil-QXAS software for data elaboration. The classification of ancient ceramics based on multivariate analysis obtained through R environment was also carried out. The qualitative data on pigments have also been compared with the same data obtained by a commercial XRF spectrometer, demonstrating how our very simple and inexpensive prototype can be of great help for a rapid and reliable characterization of cultural heritage materials whenever commercial devices are unaffordable.
1. Introduction
Energy dispersive X-ray fluorescence (EDXRF) is a very suitable analysis method for the examination of cultural heritage materials and is widely used, thanks to its relative straightforwardness of use and its totally non-destructive character, allowing for analysis without any sample preparation. EDXRF has numerous applications in this field, as it is able to detect elements from sodium to uranium, and in certain cases can go down to carbon [1], moreover the data treatment (e.g., qualitative analysis, PCA [2,3], semi-quantitative analysis [4,5,6], quantitative analysis) makes this technique suitable to answer numerous questions. Thus, EDXRF is commonly used to perform provenance studies on ceramics, coins and glass [3,7,8,9], to evaluate corrosion processes on metals [10,11], find restorations in paintings [12,13,14] or fake objects [15], or to identify worn out pigmentation in ancient polychromies [16,17,18,19]. These are just few examples of potential applications.
Anyway, we also must consider that XRF investigates deep into the artifacts (depending on the energy of the fluorescence radiation and the composition of the sample, the volume investigated can be a few tens of micrometers for light matrices to less than one micrometer for metals). The technique is then not always suitable when the aim is to distinguish the composition of the different layers composing the sample, and it is only a comprehensive elemental composition that is obtained. The only way to distinguish the layers is to get a priori knowledge of the composition of the sample, or to analyze the bulk if feasible. Nevertheless, new set-ups are now also being developed to analyze layered samples [20,21,22]: for example, performing an angular scanning [23,24,25], evaluating the ratio of the fluorescence lines [26,27], exploiting MA-XRF mapping [28,29,30], or through Monte Carlo simulations [11,31,32].
In the last twenty years, several portable and handheld EDXRF spectrometers have become commercially available, each with its own distinguishing features and fields of application. Their diversity of designs and their features affect the final price of this kind of instrumentation, making it accessible to a small circle of researchers. It must be pointed out that some hand-held instruments do not offer the easy possibility of working on raw spectra, but only to gain a quantitative evaluation of element concentrations [2,33]. This aspect makes these instrumentations fake user-friendly, as they require high skills to handle and customize the routines and analytical modes provided by the manufacturer. Moreover, not all the materials pertaining to the cultural heritage field can be described in terms of element concentration, as, for instance, is the case of pigments [34], where dilution, binder and layer thickness highly affect the possibility (and the meaningfulness) of having a quantitative evaluation. The same applies to the study of any layered sample, such as lustered or glazed ceramics [35], or to ink decorations [16]. From these starting considerations, in the last decade some research groups have developed their own homemade spectrometers; some of them clearly demonstrated that basic spectrometers can be useful for the characterization of CH materials held in the Museums [36]. In 2010, a research group from the Physics Institute of the UNAM, Mexico, developed SANDRA (sistema de analisis no destructivo por rayos X or system for non-destructive analysis using X-rays) especially for the study of Mexican Cultural Heritage collections [37]. This system is equipped with changeable tubes (namely, 75 W Mo, Rh and W X-ray tubes) and detectors (Amptek Si-PIN and Cd-Te detector) that are selected and combined depending on the elemental range of interest. One year later, LABEC laboratory of Istituto Nazionale di Fisica Nucleare (INFN), in collaboration with ICVBC of Consiglio Nazionale delle Ricerche (CNR), developed a custom-realized portable XRF spectrometer [38]. The system features a high efficiency for a wide range of elements down to sodium, thanks to the use of two tubes with different anodes and to the presence of a continuous helium flow in front of the tubes and the detector, with the declared aim to overcome the usually limited performance of compact XRF systems for in situ analyses. An interesting project was presented in Campos et al. [39], where a low-cost portable system for in situ elemental mapping by XRF was developed. The basic components (i.e., X-ray tube and detector) are very close to ours, but the final aim, and thus the design, are highly different, because, for a good scanning system, more attention must be given to the positioning system, the acquisition time and the ability to reconstruct elemental maps with good spatial resolution, while quantitative analyses is not considered.
Some homemade micro-XRF spectrometers were also studied [40], but their discussion is out of the scope of the present paper.
The aim of the FUXYA2020 (fluorescence X-ray analysis) project was to create a low-cost portable prototype for EDXRF analysis that was compact, lightweight, easily transportable, and attachable to a tripod for convenient positioning. In the FUXYA system, the two most expensive elements are obviously represented by the X-ray source and the detection unit. These are mandatory for a reliable spectrometer, but with a homemade project it is possible to spread the purchasing on different periods. In the following, we will discuss the design, the choice of elements and the performances of FUXYA2020 when it is used for the characterization of cultural heritage materials, namely pigments, ceramics, and metal alloys. Despite its basic features, the FUXYA spectrometer demonstrates its capability for work with rapid and reliable characterization on cultural heritage materials whenever commercial devices are unaffordable.
2. FUXYA2020 Design and Characteristics
2.1. X-ray Source
The X-ray source used is the MINI-X2 X-ray tube (Amptek, Bedford, MA, USA) with a maximum power of 4 W (50 kV, 200 µA) and a transmission rhodium anode. The choice of this material for the anode was made for several reasons: the characteristic lines of the K series of rhodium are present at relatively high energies and produce very definite Compton and Rayleigh diffusions that can be useful for the quantitative analysis of light matrix materials [3,6,41,42]; rhodium is rarely present in cultural heritage materials and this decreases the possibility of interference with the sample. Indeed, when choosing the anode, it is of the utmost importance to consider that the element of the anode cannot be evaluated in the samples, and that the anode line may interfere with the fluorescence line of the element of interest present in the sample. Employing a silver anode in the field of cultural heritage, for example, will limit the analysis of silver in metal sample, and thus, will limit the analytical capability of the instrument. In Table 1, we summarized the interferences of the four anode materials available for the MINI-X2 X-ray tube, where the inference is highlighted if the energy of anode characteristic line differs from the line of the element for less than 250 eV. The lines considered are Kα, Kβ, Lα, Lβ, Mα, while we do not consider the noise due to the detection system.

Table 1.
Interference of the anode material lines on different elements, the interference is detected if any line of the analyte has an energy difference of less than 250 eV with any line of the anode.
The Mini-X2 focuses radiation in the designated output direction, and we verified the radiation levels external to the X-ray tube housing with the brass safety plug on. Nonetheless, the FUXYA system was housed in a radiation shielded chamber allowing the operator to work from outside the chamber. For maximum safety, the door switch and the red warning light were integrated with the Mini-X2 interlock circuit.
Two brass collimators with aluminum inserts (with 1 mm and 2 mm diameter holes) are provided to geometrically decrease the diameter of the outgoing X-ray beam in order to have a fairly small measuring spot, suitable for applications in cultural heritage [43].
The Mini-X2 is also equipped with a set of filters to modify the output spectrum of the tube, filters are used to improve the signal-to-noise ratio for the elements of interest and attenuate the unwanted characteristic lines of the anode and the materials of which the X-ray tube is made [44]. In Figure 1, we report the different spectra produced by the X-ray tube when equipped with the available filters, namely: Al (254 μm), Cu, Mo, Ag, W (25.4 μm). Spectrum emitted with no filter was given by the producer, while filtered ones were obtained by calculating for each energy the radiation absorption given by the specific filter. The choice of filter usually depends on the source anode. If the K lines of the anode are used to excite the sample, one can employ filters made of the same material of the anode, absorbing the energies above the absorption edge, and obtaining a quasi-bichromatic source. Otherwise, we can employ the element with atomic number Z = ZA − 2 or Z = ZA − 1, where ZA is the atomic number of the anode; in this case the absorption edge of the filter falls between the Kα and Kβ lines of the source, highly absorbing the latter, and transmitting the former, obtaining in this way a quasi-monochromatic source. Finally, usually an Al filter can be employed to absorb the bremsstrahlung at low energies, increasing the signal to noise, S/N, ratio for low Z elements.
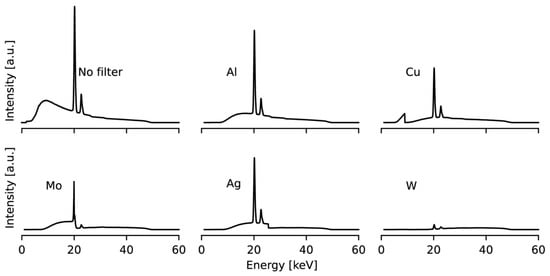
Figure 1.
Attenuation of X-ray tube spectra by Al (254 μm), Cu, Mo, Ag and W (25.4 μm) filters.
2.2. Detector
The X-ray detector used is a complete SDD spectrometer (XGL-SPCM-DANTE-25 model) from XGLAB Bruker Nano Analytics, Milan, Italy, with 17 mm2 active area, 500 μm thickness and 12.5 μm Be window. The energy resolution for an SDD detector is usually given as FWHM of the Mn Kα line (5.9 keV); for our spectrometer, the nominal energy resolution is 140 eV with peak-shaping time of 96 ns, or 125 eV with 1 μs peak-shaping time. In our working conditions (0.8 μs shaping time) we measured the detector resolution on a pure metal Mn target obtaining 130 eV as expected; for count rate of about 1 Mcps, we have a dead time of about 2%. In order to better detect the X-ray fluorescence emitted by the sample eliminating fluorescence from the detector itself, it is necessary to use collimators in front of the detector Be window, in addition to the internal one. We used a 2 mm lead collimator completely lined in pure aluminum (total thickness of the collimator 5 mm), so that no detectable lines are added. To allow an easy change of the collimator, whose best diameter can vary depending on the object to be studied, a cap for the detector window has been designed and 3D printed. This expedient also introduces an indirect protection to the thin Be window, but slightly increases the distance between the detector and the sample. In the geometric configuration of the FUXYA system, the angle between the X-ray tube and the detector was set at 90° (Figure 2) in order to better separate the Compton scattering peak from the Rayleigh scattering peak and to obtain information about light elements when necessary [45].
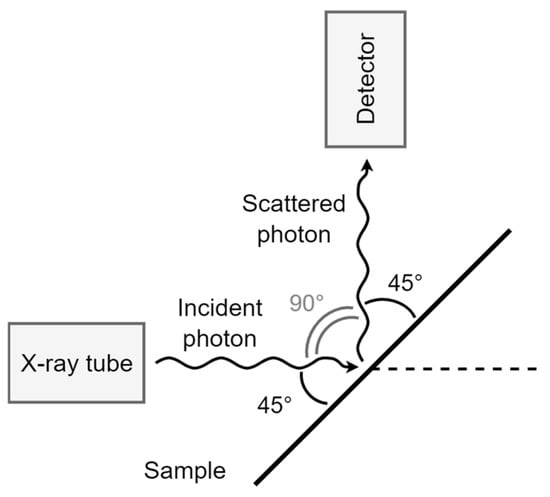
Figure 2.
Geometrical configuration of FUXYA2020 spectrometer.
2.3. Assembling
Once the geometric configuration of the tube-detector was established, the final integration between these two components was designed using a 3D design software (Figure 3). The enclosure includes a base with four support feet at the bottom, and three holes to secure a Manfrotto 200PL rapid plate so that it can be attached to a tripod. In addition, the X-ray source and the detector unit have been positioned so that the intersection point between the X-ray beam from the X-ray tube and the detector axis, i.e., the “focus” of the instrument, is about 10 mm away from the base of the instrument; the distance between the X-ray tube and the sample is thus about 14 mm, while that between the sample and the detector is about 34 mm. The current distance between the instrument and the sample can be reduced simply by shifting the components on their axis; nevertheless, choosing a 45°–45° geometry, the size of the detector head must be considered. If a significantly lower distance is preferred, the geometry should be changed, either by reducing the scattering angle and keeping the irradiation angle equal to the detection angle, or by maintaining a 90° scattering angle with a different geometry (such as a 60°–30° geometry).
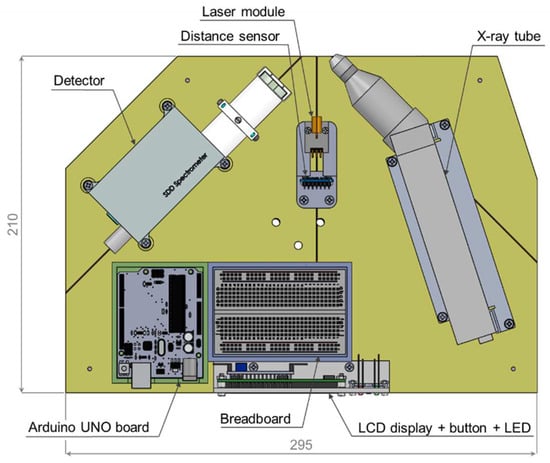
Figure 3.
Positioning of the components for FUXYA2020 spectrometer. Dimensions are given in mm.
Thanks to the 3D design software [46], the measurement spot is easily calculated on a flat sample: when using the 1 mm collimator for the X-ray tube, the area irradiated on the sample is about 8 mm2 and has an obviously elliptical shape (Figure 4). To complete the FUXYA2020 system, a cover was created, which includes a cooling system exploiting two USB fans (5 V), one positioned at the top, in correspondence with the detector, and the other laterally, close to the X-ray tube (Figure 5).
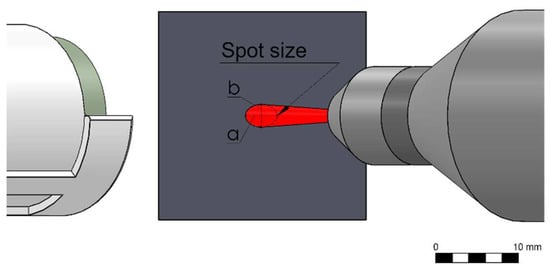
Figure 4.
Sample irradiated area when using the 1 mm collimator for the X-ray tube (a ≅ 1.91 mm, b ≅ 1.35 mm).
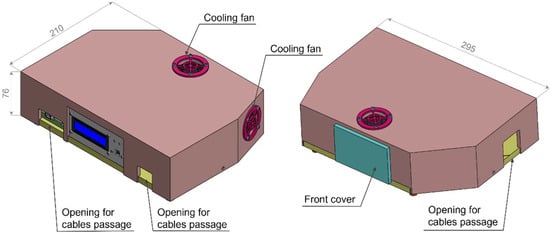
Figure 5.
FUXYA2020 external case. Dimensions are given in mm.
Furthermore, inside the case we placed a positioning system run through an Arduino UNO board and composed of the following electronic components (Figure 3): a laser sensor module (KY-008) with a spot size of 5 mm (outer diameter of 6 mm) to verify the investigated area, and a VL6180X time of flight (ToF) distance sensor to position the sample in correspondence with the focus of the instrument, maximizing the spectra intensity and allowing repeatable and comparable measurements. The VL6180X is an optical module that includes a proximity sensor, an ambient light sensor, and a VCSEL (vertical cavity surface emitting laser) light source which emits in the near-IR at a wavelength of 850 nm. The distance sensor has a spatial resolution of 1 mm and an accuracy of about 1% at 50 mm distance. We did not choose an ultrasonic sensor as it is not suitable for non-flat surfaces; moreover, differently from an IR sensor (whose range of distance is also out of the scope of the present project), ToF measure should be independent from the sample reflectance. We also integrated an I2C 1602 LCD display to show the distance measured by the sensor, a button to easily turn on and off the laser module and two LED diodes that light up according to the distance from the sample. All these components can be bought at a low price, according to the financial availability of the research group.
To make a low-cost instrument, all the structural components of the FUXYA system were 3D printed in PLA (polylactic acid) except for the base, which was cut out from a PVC sheet for greater structural strength (Figure 6). The maximum footprint of the FUXYA system is 295 × 210 × 76 mm, similar to the size of an A4 sheet of paper.
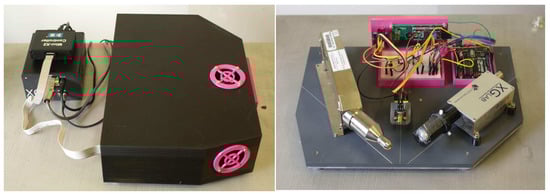
Figure 6.
FUXYA spectrometer and its internal set up.
3. FUXYA2020 Performance on Real Cases in Cultural Heritage Field
The FUXYA’s performance was tested on the qualitative analyses of pigment layers, on semi-quantitative analyses of archaeological ceramics for provenance classification and on quantitative analyses on gold alloys, thus covering three main materials in the CH field. For the first material, we had compared the minimum detection limit (MDL) for the pigment characterizing elements obtained from FUXYA and the one achieved with a commercial spectrometer. In the case of ceramics studies, the results obtained by applying a semiquantitative analysis were checked with the archaeological evidence and finally the element concentrations from quantitative analysis on metal alloys were compared with the certified values.
3.1. Pigments
In the last 20 years, EDXRF has proved to be a very suitable and widely used tool for the examination of paintings, also for its fast response and its totally non-invasive character [47]. Analysis of pigment layers using the FUXYA was conducted on laboratory-made panels (Figure 7), choosing single layers (monolayers) of historical and modern pigments, as reported in Table 2. The unfiltered tube spectrum was used as incident radiation, thanks to the low background of the instrument at low energies. The operating conditions were 40 kV and 0.06 mA, with an acquisition time of 200 s for each measurement. As many factors influence the pigment stratigraphy (binder, dilution, and thickness of the layers, which also depend on many factors) when dealing with pigment layers, it is more useful and sensible to perform a qualitative analysis, as a quantitative analysis is not only not feasible but will not be useful to characterize the nature of the pigment.
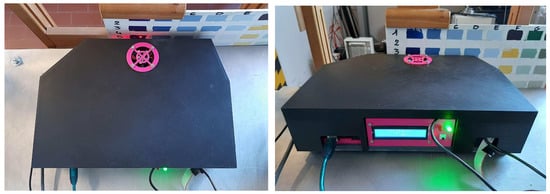
Figure 7.
Analysis of pigment layers by FUXYA spectrometer: the laser beam for positioning and the red light indicating the correct distance are visible.
Table 2.
Pigment layers considered and elements detected by FUXYA spectrometer. (*) Layer B6, labelled as Mount Amiata cinnabar, revealed to be a counterfeit pigment.
Test panels of pure pigment layers were painted on different substrates, with different binders: panel A (binder: egg tempera) is a wooden board with gypsum preparation, while panel B (acrylic binder) is an industrial canvas applied on cardboard. The pigments used for these tests were natural and artificial lapis lazuli, smalt blue, cobalt blue, azurite, verdigris, titanium green, umber, lead yellow, minium, cinnabar, red ochre, burnt sienna (panel A) and cerulean blue, Naples yellow, malachite, cinnabar, chromium orange (panel B). As the pigments layers are very thin, during an XRF measurement is possible to detect elements coming from the preparation underneath (except in cases where heavy metals are used, such as lead), thus preparation of both panels was also investigated as reference. For panel, A, Ca, Sr and S traces were detected from gypsum preparation, with impurities of P, Fe, Cu, Zn, Zr; for panel B, the analyses determined the presence of titanium white (Ti dioxide) and Ca, with impurities of P, Fe, Cu, and Zn. These elements are reported in Table 2 only when attributable to pigment layers; each spectrum also presents the K emission of Ar from the atmosphere. As evident from Table 2, all pigments were positively detected within the XRF limits, except sample B6, Mount Amiata cinnabar, which revealed itself to be a case of forgery, as no presence of Hg (nor any other red chromophore) was detected. The barium presence can be attributed to barium sulphate, commonly used as a pigment extender with lakes. A rapid check with other analytical techniques confirmed the use of a red lake with a mixture of white pigments, coherently with FUXYA results. Further comments should also be done on sample A12, burnt sienna earth, where Mn could be expected. Indeed, sienna is a yellow ochre, containing from 50% to more than 70% iron oxide (Fe2O3), (the higher the iron concentration, the better the quality) [47] and, even if it is often considered a mixture of Mn and Fe oxides, Mn oxide (gray or black in color) is quite low, and it is present in quantities up to 10% [48], while a greater amount of Mn oxides are typical of umbers. Coherently, some spectra databases [49] indicate sienna earth also in the absence of Mn.
In Figure 8, the spectra acquired with FUXYA spectrometer on lapis lazuli layered pigment (sample A1 in Table 2) is reported; the Si Kα lines are evident in the enlargement of low energy region.
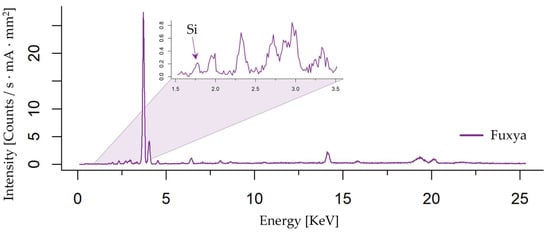
Figure 8.
Spectra obtained by FUXYA for Layer A1, lapis lazuli (Si K line is highlighted in the blown up area).
Besides verifying the capability of our spectrometer to identify pigments, pigment spectra were also used to verify the ability to distinguish the signal with respect to fluctuations of the background. With this aim, peak areas were normalized to the acquisition time and anode current, and the instrumental limit of determination (ILD) was defined as: , according to the definition usually given for the concentration MDL [50]. We did not normalize with respect to the irradiated surface on the sample, as we wanted to compare performance in standard working conditions for each spectrometer. We did not opt for the normally used MDL as, in this case, the passage to concentration values would be aleatory; anyway, ILD and MDL are proportional. Moreover, ILD depends on the instrument, the specimen matrix composition and the element considered and can thus be used for comparing the performance of different instruments used in the same analytical context. The results (see Table 3) were then compared with those obtained measuring the same samples with a commercial portable micro-XRF spectrometer (Bruker ARTAX 200) equipped with a Mo anode X-ray tube, collimated down to 0.65 mm in diameter (excited sample area of 0.33 mm2). The Artax 200 mounts an SDD detector and exploits the principle of optical triangulation for the adjustment of the distance between sample and measuring head, and a CCD camera to visualize the sample. The system has an exchangeable filter slide with three filter positions; in this work, no filter has been used. The working conditions were 40 kV and 0.6 mA with an acquisition time of 200 s for each measurement; the distance between the analyzed spot and both the source and the detector was 1.3 cm. Bruker Spectra 5.1 software was used to perform peak deconvolution. As evident from Table 3, even if the results are similar to those obtained in a former publication [51], they cannot be directly compared, as in that case the Artax source was filtered by a 12.5 μm Mo transmission filter. It is worth noting that, in this same paper, the MDL for the Assing Lithos portable and Niton handheld spectrometers were also considered; in particular, our spectrometer can be compared with Lithos for dimensions, features and portability, showing a better performance when using non-filtered X-ray tube emission in standard working conditions.
Table 3.
Comparison of ILD in cps/mA of different elements.
When dealing with qualitative XRF analysis, an obvious limit is the difficulty in detecting low energy signals, as for instance for Sb and Sn L lines, and Si K lines, because the probability of emission is lower for light elements and for L lines. To better visualize the different performances, in Figure 9, we report the comparison between FUXYA and Artax spectra for samples A8 and B2 in their standard operating conditions. The spectra of the considered yellow layers are reported in linear scale for both FUXYA and Artax spectrometers. Spectra have been normalized for the measurement time, the applied amperage and the irradiated area. The FUXYA spectra show a lower intensity, but also a lower background; for this reason, we can see trace element peaks in a clearer way. Moreover, the better resolution allows us to better distinguish Si and P peaks. It is worth saying that even though Sn and Sb can be easily detected by their K lines with FUXYA device when non-filtered radiation is used, we are considering their L emissions as a clear example of the sensitivity at lower energies which is increased in the FUXYA system thanks to the lower background. Moreover, the detection of both K and L series for such elements can help in reconstructing the stratigraphy of the pigment layers
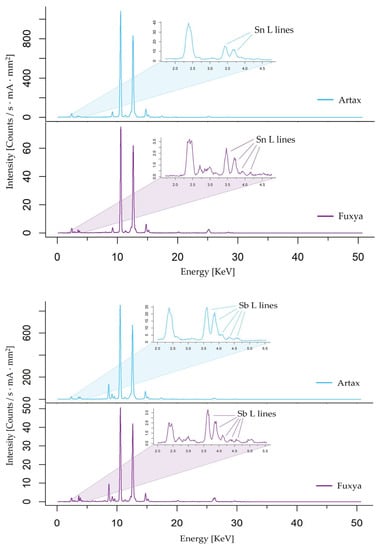
Figure 9.
Spectra of the yellow layers A8 (upper) and B2 (lower) for both FUXYA and Artax spectrometers. Spectra have been normalized for the measurement time, the applied amperage, and the irradiated area.
Please note that the air path of the detection system is not the same: in fact, in FUXYA the detector is placed further away with respect to the Artax. This different geometry is responsible for the different order of magnitude in spectra intensities both for the different air paths, and for the subsequent different solid angles. In addition, the FUXYA spectra show the scattered L lined from Rh anode of the X-ray tube between 2.6 and 3.1 keV.
3.2. Ceramics
A semi-quantitative test on archaeological ceramics samples has also been done, verifying the possibility of using the FUXYA spectrometer for archaeological material classification. Eight Roman amphorae were considered, of which the factory, and thus the production place, were known from archaeological information, such as seals, as summarized in Table 4. No archaeological consideration will be made in this work, as this research is still in progress and we are now interested only in the FUXYA’s performance, but it is worth noting that we chose a small group with the same local provenance, and a few samples of various non-local provenance to have an easy test for our set up.
Table 4.
Analysed ceramics.
We used the unfiltered continuous radiation from the X-ray tube and semi-quantitative evaluation, avoiding the determination of element concentrations [6].
The XRF spectra were acquired on fractures and/or cleaned areas; where necessary, cleaning was performed with pure water on some cotton wool to eliminate visible earth traces. A variable number of measuring points was considered for each sample to check the homogeneity of the artifacts [52]; for a few samples, Cr (7_3), Cu (7_1, 17_4) or Rb (9_3) showed peaks below the detection limit (see Section 3.1); in these few cases, to perform statistical analyses, we substituted the missing data with a random value between 0 and the detection limit itself [8,53]. All the 22 spectra were then considered for statistical analysis on closed data. Statistical elaboration was obtained by using R 3.6.3 [54], a free environment for statistical computing and graphics. It compiles and runs on UNIX platforms, Windows and MacOS. In particular, the FactoMineR 2.4 [55] and pca3d 0.10.2 [56] packages have been used. Data elaboration was performed once again in the perspective of a low-cost project, requiring no expensive licenses. PCA was applied, exploiting the correlation matrix as relative concentrations have different scales and we wanted to standardize data; relative concentration was closed to 100% for multivariate analyses and classification to eliminate the differences among samples due to different silicate presence or firing temperatures, which could induce a varying weight loss also in samples with similar raw materials. This procedure is particularly advisable whenever samples contain indefinite amounts of extraneous material, such as temper (i.e., crushed shell or crushed stone) [8,57].
The working conditions were 40 kV and 0.06 mA with an acquisition time of 200 s for each measurement. The detector proprietary software was used to perform peak deconvolution and calculate areas.
In Figure 10, the loading plot for the first two PCs is reported: even if the cumulative variance is relatively low (61.2%) and the samples are few, the various groups are well separated and allow the discrimination between different provenance which occupies different areas in the PCs cartesian plane. In fact, the local samples (14, 15, 16, 17) were grouped together, well-spaced from the non-local samples.
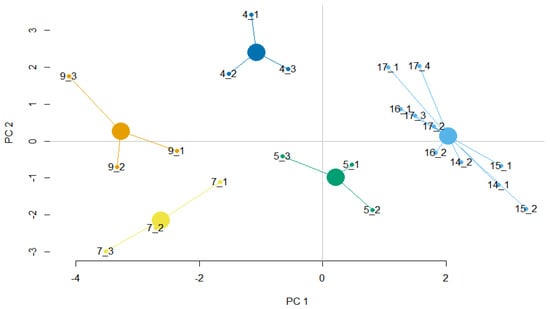
Figure 10.
Loading plot for the first two PCs: cumulative variance is 61.2%; larger dots are the centroids for provenance groups.
3.3. Metals
The FUXYA’s capability to get reliable quantitative evaluation on metal alloys was tested measuring the binary and ternary gold alloys (1 mm thickness) reported in Table 5 with the obtained results. We coupled the X-ray tube with a Cu filter (25.4 μm of thickness) so that incident radiation could be considered quasi-monochromatic at the Rh Kα line at 20.2 keV (see Section 2.1). Spectra deconvolution and elemental determination were made by AXIL/QXAS, a free quantitative analysis package developed by IAEA [58]. Calculations were made considering monochromatic excitation, single element reference standards (i.e., a pure Cu certified metal plate, a pure Ag certified metal plate, a pure Au certified metal plate), individual instrumental constants and applying normalization for the obtained concentrations. The acquisition parameters were 40 kV and 60 µA for 600 s. Characteristic emissions considered were Kα for Cu, and Lα for Ag and Au. The same was done for 100 s acquisitions, still obtaining the right concentrations, even if with higher errors, especially on Ag concentration (data not shown).
Table 5.
Results obtained for quantitative analysis on certified gold alloys for monochromatic incident radiation. Errors are calculated by AXIL/QXAS considering statistical errors on both peaks and background fitting.
4. Conclusions
The FUXYA project produced a compact and light prototype for a low-cost EDXRF portable spectrometer. The home-made solution allowed the costs of the X-ray tube and detector to be spread over a relatively long period of time; all the other components were cheap, and the software used for data analysis was free. The case and the structural components were 3D printed. The maximum dimensions were 295 × 210 × 76 mm3.
FUXYA2020 performance was tested both for qualitative and quantitative analyses, the former on pigments layers, and the latter on gold-based certified alloys, exploiting Axil-QXAS software for data elaboration. The classification of ancient ceramics based on multivariate analysis obtained through R environment was also carried out. Qualitative data on pigments have also been compared with the same data obtained by a commercial XRF spectrometer, demonstrating how our very simple and inexpensive device can be of great help for a rapid and reliable characterization of cultural heritage materials.
For the future, several improvements to the FUXYA system are foreseen, such as the use of a small camera that, together with the laser pointer, would create a better positioning system, based on the principle of optical triangulation, as in the Artax 200 spectrometer. In this way the distance sensor, not very reliable on reflective surfaces, could be replaced.
Another improvement is to use a Raspberry Pi instead of the Arduino UNO board. The main difference between these two systems is that Arduino UNO is a simple microcontroller board that is programmed using the Arduino IDE and can only run the compiled code; while Raspberry Pi is a single-board computer that can operate as a stand-alone system. The necessary software (Mini-X2 Controller for the X-ray tube and DANTE for the detector) could be installed directly on the Raspberry Pi, optimizing the communication between the programs. Eliminating Arduino and the breadboard would also save space so that the source controller and the detector electronics could be housed inside the case, achieving a fully integrated system. All this would lead to completely discarding the laptop in favor of an even more portable and compact system, with no cost increase.
Author Contributions
Conceptualization, L.B.; software, G.R.; validation, G.R., F.M. and J.O.; formal analysis, F.M. and G.R.; investigation, G.R., F.M. and J.O.; writing—original draft preparation, L.B. and G.R.; writing—review and editing, L.B. and A.G.; supervision, L.B. and A.G. All authors have read and agreed to the published version of the manuscript.
Funding
This research received no external funding.
Data Availability Statement
The data presented in this study are available on request from the corresponding author.
Acknowledgments
The authors would like to thank the Physics Department Mechanical Workshop of Università degli Studi di Milano for their suggestions and kind availability.
Conflicts of Interest
The authors declare no conflict of interest.
References
- Uhlir, K.; Griesser, M.; Buzanich, G.; Wobrauschek, P.; Streli, C.; Wegrzynek, D.; Markowicz, A.; Chinea-Cano, E. Applications of a New Portable (Micro) XRF Instrument Having Low-Z Elements Determination Capability in the Field of Works of Art. X-ray Spectrom. 2008, 37, 450–457. [Google Scholar] [CrossRef]
- Idjouadiene, L.; Mostefaoui, T.A.; Djermoune, H.; Ziat, F.; Bonizzoni, L. XRF Analysis of Ancient Numidian Coins: A Comparison between Different Kingdoms. Eur. Phys. J. Plus 2021, 136, 512. [Google Scholar] [CrossRef]
- Idjouadiene, L.; Mostefaoui, T.A.; Djermoune, H.; Bonizzoni, L. Application of X-ray Fluorescence Spectroscopy to Provenance Studies of Algerian Archaeological Pottery. X-ray Spectrom. 2019, 48, 505–512. [Google Scholar] [CrossRef]
- Bonizzoni, L. ED-XRF Analysis for Cultural Heritage: Is Quantitative Evaluation Always Essential? J. Phys. Conf. Ser. 2015, 630, 012001. [Google Scholar] [CrossRef] [Green Version]
- Moioli, P.; Seccaroni, C. Analysis of Art Objects Using a Portable X-ray Fluorescence Spectrometer. X-ray Spectrom. 2000, 29, 48–52. [Google Scholar] [CrossRef]
- Bonizzoni, L.; Galli, A.; Gondola, M.; Martini, M. Comparison between XRF, TXRF, and PXRF Analyses for Provenance Classification of Archaeological Bricks. X-ray Spectrom. 2013, 42, 262–267. [Google Scholar] [CrossRef]
- Saleh, M.; Bonizzoni, L.; Orsilli, J.; Samela, S.; Gargano, M.; Gallo, S.; Galli, A. Application of Statistical Analyses for Lapis Lazuli Stone Provenance Determination by XRL and XRF. Microchem. J. 2020, 154, 104655. [Google Scholar] [CrossRef]
- Bonizzoni, L.; Galli, A.; Milazzo, M. XRF Analysis without Sampling of Etruscan Depurata Pottery for Provenance Classification. X-ray Spectrom. 2010, 39, 346–352. [Google Scholar] [CrossRef]
- Padilla, R.; Espen, P.V.; Torres, P.P.G. The Suitability of XRF Analysis for Compositional Classification of Archaeological Ceramic Fabric: A Comparison with a Previous NAA Study. Anal. Chim. Acta 2006, 558, 283–289. [Google Scholar] [CrossRef]
- Schiavon, N.; de Palmas, A.; Bulla, C.; Piga, G.; Brunetti, A. An Energy-Dispersive X-ray Fluorescence Spectrometry and Monte Carlo Simulation Study of Iron-Age Nuragic Small Bronzes (“Navicelle”) from Sardinia, Italy. Spectrochim. Acta Part B At. Spectrosc. 2016, 123, 42–46. [Google Scholar] [CrossRef]
- Bottaini, C.; Mirão, J.; Figuereido, M.; Candeias, A.; Brunetti, A.; Schiavon, N. Energy Dispersive X-ray Fluorescence Spectroscopy/Monte Carlo Simulation Approach for the Non-Destructive Analysis of Corrosion Patina-Bearing Alloys in Archaeological Bronzes: The Case of the Bowl from the Fareleira 3 Site (Vidigueira, South Portugal). Spectrochim. Acta Part B At. Spectrosc. 2015, 103–104, 9–13. [Google Scholar] [CrossRef]
- dos Santos, H.C.; Caliri, C.; Pappalardo, L.; Catalano, R.; Orlando, A.; Rizzo, F.; Romano, F.P. Real-Time MA-XRF Imaging Spectroscopy of the Virgin with the Child Painted by Antonello de Saliba in 1497. Microchem. J. 2018, 140, 96–104. [Google Scholar] [CrossRef]
- Ruberto, C.; Mazzinghi, A.; Massi, M.; Castelli, L.; Czelusniak, C.; Palla, L.; Gelli, N.; Betuzzi, M.; Impallaria, A.; Brancaccio, R.; et al. Imaging Study of Raffaello’s “La Muta” by a Portable XRF Spectrometer. Microchem. J. 2016, 126, 63–69. [Google Scholar] [CrossRef]
- Vornicu, N.; Bibire, C.; Murariu, E.; Ivanov, D. Analysis of Mural Paintings Using in Situ Non-Invasive XRF, FTIR Spectroscopy and Optical Microscopy. X-ray Spectrom. 2013, 42, 380–387. [Google Scholar] [CrossRef]
- True Versus Forged in the Cultural Heritage Materials: The Role of PXRF Analysis—Galli—2014—X-ray Spectrometry—Wiley Online Library. Available online: https://analyticalsciencejournals.onlinelibrary.wiley.com/doi/10.1002/xrs.2461 (accessed on 11 January 2022).
- Bonizzoni, L.; Bruni, S.; Galli, A.; Gargano, M.; Guglielmi, V.; Ludwig, N.; Lodi, L.; Martini, M. Non-Invasive in Situ Analytical Techniques Working in Synergy: The Application on Graduals Held in the Certosa Di Pavia. Microchem. J. 2015, 126, 172–180. [Google Scholar] [CrossRef]
- Idjouadiene, L.; Mostefaoui, T.A.; Naitbouda, A.; Djermoune, H.; Mechehed, D.E.; Gargano, M.; Bonizzoni, L. First Applications of Non-Invasive Techniques on Algerian Heritage Manuscripts: The LMUHUB ULAHBIB Ancient Manuscript Collection from Kabylia Region (Afniq n Ccix Lmuhub). J. Cult. Herit. 2021, 49, 289–297. [Google Scholar] [CrossRef]
- Kokiasmenou, E.; Caliri, C.; Kantarelou, V.; Germanos Karydas, A.; Romano, F.P.; Brecoulaki, H. Macroscopic XRF Imaging in Unravelling Polychromy on Mycenaean Wall-Paintings from the Palace of Nestor at Pylos. J. Archaeol. Sci. Rep. 2020, 29, 102079. [Google Scholar] [CrossRef]
- Tsatsouli, K.; Nikolaou, E. The Ancient Demetrias Figurines: New Insights on Pigments and Decoration Techniques Used on Hellenistic Clay Figurines. Sci. Technol. Archaeol. Res. 2017, 3, 341–357. [Google Scholar] [CrossRef] [Green Version]
- Bonizzoni, L.; Galli, A.; Poldi, G.; Milazzo, M. In Situ Non-Invasive EDXRF Analysis to Reconstruct Stratigraphy and Thickness of Renaissance Pictorial Multilayers. X-ray Spectrom. 2007, 36, 55–61. [Google Scholar] [CrossRef]
- Bertucci, M.; Bonizzoni, L.; Ludwig, N.; Milazzo, M. A New Model for X-ray Fluorescence Autoabsorption Analysis of Pigment Layers. X-ray Spectrom. 2010, 39, 135–141. [Google Scholar] [CrossRef]
- Bonizzoni, L.; Colombo, C.; Ferrati, S.; Gargano, M.; Greco, M.; Ludwig, N.; Realini, M. A Critical Analysis of the Application of EDXRF Spectrometry on Complex Stratigraphies. X-ray Spectrom. 2011, 40, 247–253. [Google Scholar] [CrossRef]
- Fiorini, C.; Gianoncelli, A.; Longoni, A.; Zaraga, F. Determination of the Thickness of Coatings by Means of a New XRF Spectrometer. X-ray Spectrom. 2002, 31, 92–99. [Google Scholar] [CrossRef]
- Baumann, J.; Kayser, Y.; Kanngießer, B. Grazing Emission X-ray Fluorescence: Novel Concepts and Applications for Nano-Analytics. Phys. Status Solidi 2021, 258, 2000471. [Google Scholar] [CrossRef]
- Baumann, J.; Grötzsch, D.; Scharf, O.; Kodalle, T.; Bergmann, R.; Bilchenko, F.; Mantouvalou, I.; Kanngießer, B. A Compact and Efficient Angle-Resolved X-ray Fluorescence Spectrometer for Elemental Depth Profiling. Spectrochim. Acta Part B At. Spectrosc. 2021, 181, 106216. [Google Scholar] [CrossRef]
- Cesareo, R.; de Assis, J.T.; Roldán, C.; Bustamante, A.D.; Brunetti, A.; Schiavon, N. Multilayered Samples Reconstructed by Measuring Kα/Kβ or Lα/Lβ X-ray Intensity Ratios by EDXRF. Nucl. Instrum. Methods Phys. Res. Sect. B Beam Interact. Mater. At. 2013, 312, 15–22. [Google Scholar] [CrossRef]
- Karimi, M.; Amiri, N.; Tabbakh Shabani, A.A. Thickness Measurement of Coated Ni on Brass Plate Using Kα/Kβ Ratio by XRF Spectrometry. X-ray Spectrom. 2009, 38, 234–238. [Google Scholar] [CrossRef]
- Gargano, M.; Galli, A.; Bonizzoni, L.; Alberti, R.; Aresi, N.; Caccia, M.; Castiglioni, I.; Interlenghi, M.; Salvatore, C.; Ludwig, N.; et al. The Giotto’s Workshop in the XXI Century: Looking inside the “God the Father with Angels” Gable. J. Cult. Herit. 2019, 36, 255–263. [Google Scholar] [CrossRef]
- Orsilli, J.; Galli, A.; Bonizzoni, L.; Caccia, M. More than XRF Mapping: STEAM (Statistically Tailored Elemental Angle Mapper) a Pioneering Analysis Protocol for Pigment Studies. Appl. Sci. 2021, 11, 1446. [Google Scholar] [CrossRef]
- Galli, A.; Caccia, M.; Caglio, S.; Bonizzoni, L.; Castiglioni, I.; Gironda, M.; Alberti, R.; Martini, M. An Innovative Protocol for the Study of Painting Materials Involving the Combined Use of MA-XRF Maps and Hyperspectral Images. Eur. Phys. J. Plus 2021, 137, 22. [Google Scholar] [CrossRef]
- Bottaini, C.; Mirão, J.; Candeias, A.; Catarino, H.; Silva, R.J.; Brunetti, A. Elemental Characterisation of a Collection of Metallic Oil Lamps from South-Western al-Andalus Using EDXRF and Monte Carlo Simulation. Eur. Phys. J. Plus 2019, 134, 365. [Google Scholar] [CrossRef] [Green Version]
- Trojek, T. Iterative Monte Carlo Procedure for Quantitative X-ray Fluorescence Analysis of Copper Alloys with a Covering Layer. Radiat. Phys. Chem. 2020, 167, 108294. [Google Scholar] [CrossRef]
- Fermo, P.; Andreoli, M.; Bonizzoni, L.; Fantauzzi, M.; Giubertoni, G.; Ludwig, N.; Rossi, A. Characterisation of Roman and Byzantine Glasses from the Surroundings of Thugga (Tunisia): Raw Materials and Colours. Microchem. J. 2016, 129, 5–15. [Google Scholar] [CrossRef] [Green Version]
- Bonizzoni, L.; Bruni, S.; Guglielmi, V.; Milazzo, M.; Neri, O. Field and Laboratory Multi-Technique Analysis of Pigments and Organic Painting Media from an Egyptian Coffin (26th Dynasty). Archaeometry 2011, 53, 1212–1230. [Google Scholar] [CrossRef]
- Nuevo, M.J.; Martín Sánchez, A. Application of XRF Spectrometry to the Study of Pigments in Glazed Ceramic Pots. Appl. Radiat. Isot. 2011, 69, 574–579. [Google Scholar] [CrossRef] [PubMed]
- Karydas, A.G. Application of a Portable XRF Spectrometer for the Non-Invasive Analysis of Museum Metal Artefacts. Ann. Chim. 2007, 97, 419–432. [Google Scholar] [CrossRef]
- Ruvalcaba Sil, J.L.; Ramírez Miranda, D.; Aguilar Melo, V.; Picazo, F. SANDRA: A Portable XRF System for the Study of Mexican Cultural Heritage. X-ray Spectrom. 2010, 39, 338–345. [Google Scholar] [CrossRef]
- A Novel Portable XRF Spectrometer with Range of Detection Extended to Low-Z Elements—Migliori—2011—X-ray Spectrometry—Wiley Online Library. Available online: https://analyticalsciencejournals.onlinelibrary.wiley.com/doi/10.1002/xrs.1316 (accessed on 11 January 2022).
- Campos, P.H.O.V.; Appoloni, C.R.; Rizzutto, M.A.; Leite, A.R.; Assis, R.F.; Santos, H.C.; Silva, T.F.; Rodrigues, C.L.; Tabacniks, M.H.; Added, N. A Low-Cost Portable System for Elemental Mapping by XRF Aiming in Situ Analyses. Appl. Radiat. Isot. 2019, 152, 78–85. [Google Scholar] [CrossRef] [PubMed]
- Vittiglio, G.; Bichlmeier, S.; Klinger, P.; Heckel, J.; Fuzhong, W.; Vincze, L.; Janssens, K.; Engström, P.; Rindby, A.; Dietrich, K.; et al. A Compact μ-XRF Spectrometer for (In Situ) Analyses of Cultural Heritage and Forensic Materials. Nucl. Instrum. Methods Phys. Res. Sect. B Beam Interact. Mater. At. 2004, 213, 693–698. [Google Scholar] [CrossRef]
- Galli, A.; Bonizzoni, L.; Martini, M.; Sibilia, E. Archaeometric Study of Fictile Tubes from Three Churches in Milan. Appl. Phys. A 2008, 92, 117–121. [Google Scholar] [CrossRef]
- Ametek, Choosing the Anode Material. 2021. Available online: https://www.amptek.com/-/media/ametekamptek/documents/products/choosing-the-anode-material-in-an-X-ray-tube.pdf (accessed on 30 November 2021).
- Ametek, Mini-X User Manual. 2021. Available online: https://www.amptek.com/-/media/ametekamptek/documents/products/user-manuals/mini-x2-user-manual-rev-b2.pdf (accessed on 11 January 2022).
- Ametek, Amptek Mini-X X-ray Tube Application Note Filters on an X-ray Tube. 2021. Available online: https://www.amptek.com/-/media/ametekamptek/documents/products/filters-application-note.pdf (accessed on 30 November 2021).
- Bonizzoni, L.; Galli, A.; Milazzo, M. Direct Evaluation of Self-Absorption Effects in Dark Matrices by Compton Scattering Measurements. X-ray Spectrom. 2000, 29, 443–448. [Google Scholar] [CrossRef]
- Solidworks, Solidworks Desktop 3D CAD. Available online: http://dl-ak.solidworks.com/nonsecure/training/TOC_PMT2105-ENG_MLD2021.pdf (accessed on 11 January 2022).
- Neelmeijer, C.; Brissaud, I.; Calligaro, T.; Demortier, G.; Hautojärvi, A.; Mäder, M.; Martinot, L.; Schreiner, M.; Tuurnala, T.; Weber, G. Paintings—A Challenge for XRF and PIXE Analysis. X-ray Spectrom. 2000, 29, 101–110. [Google Scholar] [CrossRef]
- Pigment Compendium. Available online: https://www.routledge.com/pigment-compendium/eastaugh-walsh-chaplin-siddall/p/book/9780750689809 (accessed on 11 January 2022).
- Raw Sienna, ColourLex. Available online: https://colourlex.com/project/raw-sienna/ (accessed on 1 December 2021).
- Beckhoff, B.; Kanngieser, B.; Langhoff, N.; Wedell, R.; Wolff, H. Handbook of Practical X-ray Fluorescence Analysis, 2006 ed.; Springer Nature: Basingstoke, UK, 2006; ISBN 978-3-662-49601-5. [Google Scholar]
- Bonizzoni, L.; Caglio, S.; Galli, A.; Poldi, G. Comparison of Three Portable EDXRF Spectrometers for Pigment Characterization. X-Ray Spectrom. 2010, 39, 233–242. [Google Scholar] [CrossRef]
- Marengo, E.; Aceto, M.; Robotti, E.; Liparota, M.C.; Bobba, M.; Pantò, G. Archaeometric Characterisation of Ancient Pottery Belonging to the Archaeological Site of Novalesa Abbey (Piedmont, Italy) by ICP–MS and Spectroscopic Techniques Coupled to Multivariate Statistical Tools. Anal. Chim. Acta 2005, 1–2, 359–375. [Google Scholar] [CrossRef]
- D’Alessandro, A.; Lucarelli, F.; Mandò, P.; Marcazzan, G.; Nava, S.; Prati, P.; Valli, G.; Vecchi, R.; Zucchiatti, A. Hourly Elemental Composition and Sources Identification of Fine and Coarse PM10 Particulate Matter in Four Italian Towns. J. Aerosol Sci. 2003, 34, 243–259. [Google Scholar] [CrossRef]
- R Core Team. R: A Language and Environment for Statistical Computing, R Foundation for Statistical Compu-Ting. 2021. Available online: https://www.r-project.org/ (accessed on 13 December 2021).
- Lê, S.; Josse, J.; Husson, F. FactoMineR: An R Package for Multivariate Analysis. J. Stat. Softw. 2008, 25, 1–18. [Google Scholar] [CrossRef] [Green Version]
- Weiner, J. Pca3d: Three Dimensional PCA Plots. R Package Version 0.10.2. 2020. Available online: https://cran.r-project.org/package=pca3d (accessed on 11 January 2022).
- Aruga, R. Closure of Analytical Chemical Data and Multivariate Classification. Talanta 1998, 47, 1053–1061. [Google Scholar] [CrossRef]
- Kregsamer, P. QXAS—Quantitative X-ray Analysis System (User’s Manual and Guide to X-ray Fluorescence Technique); IAEA Computer Manual Series No. 21 (IAEA/CMS/21/CD); IAEA: Vienna, Austria, 2009. [Google Scholar]
Publisher’s Note: MDPI stays neutral with regard to jurisdictional claims in published maps and institutional affiliations. |
© 2022 by the authors. Licensee MDPI, Basel, Switzerland. This article is an open access article distributed under the terms and conditions of the Creative Commons Attribution (CC BY) license (https://creativecommons.org/licenses/by/4.0/).