1. Introduction
Automobile companies have been focusing on the improvement of cars with excellent acceleration feeling to improve customer satisfaction and establish their unique brand identity in the competitive target market. The acceleration feeling is considered as attractive attribute and a valuable factor affecting customers’ satisfaction and final decision to purchase a vehicle [
1,
2,
3]. A customer expects his/her brand new vehicle to be launched with high performance in the acceleration feeling while driving. Thus, it could degrade customer’s satisfaction level and adversely affect the company’s brand image when this essential expectation is not fully meet [
2]. This implies that automobile companies need to design their cars well by considering the influence of factors affecting the acceleration feeling.
Previous studies have researched the vehicle acceleration feeling for improving the customer satisfaction of drivability. For instance, Chen et al. [
4] evaluated the comfort of drivers’ stepping on the accelerator pedal and found that comfort was varied by such features as pedal stroke, pedal resistance, and seat height. Next, Khamis et al. [
5] investigated the muscle contraction while operating the accelerator pedal using three different foot actions (pressing, half-pressing, and releasing) and revealed that muscle activations were significantly different for each foot action. Lastly, a study by Khamis and Deros [
6] investigated the responses of lower leg muscles in car-pedal operation and found that the medial gastrocnemius muscle has different reactions depending on the pedal action.
The pendulum type of accelerator pedals mostly used in the aforementioned previous studies has been replaced with the organ type, which has better usability. The pendulum type is suspended on the car body using mechanical linkages [
7,
8,
9,
10,
11] and was widely adopted in sedans. The pendulum type of accelerator pedal is designed to ease the driver into the movement of his/her foot from the brake pedal to the accelerator pedal, and vice versa. In addition, it facilitates the easy release of the accelerator without excessive discomfort in the ankle. However, it might be harder to control during sudden action, because of the different trajectories of the accelerator pedal and the natural foot-pressing motion. Due to its disadvantages in usability and simplicity, the organ type is gradually replacing the pendulum type. Since the organ type is placed on the floor of the car [
7,
11], it allows the driver’s foot and the pedal to follow the same moving path when being pressed. It also enables the easy control of the accelerator pedal, and is more comfortable to use over a long period, due to the fact that it stabilizes the driver’s heel position on the floor [
7,
12]. In addition, the organ type can facilitate drive-by-wire technologies, which can detect the pressed position of the pedal using an accelerator position sensor [
13,
14].
The organ type allows the driver two different foot postures (natural vs. rotated) in operating the accelerator pedal. The driver can employ the natural foot posture (
Figure 1a), which lifts off his/her right foot from the brake pedal and moves the foot toward the accelerator pedal. Although this posture can cause more muscle efforts in moving the right foot (including the leg) from the brake pedal to the accelerator pedal, it allows the driver to comfortably press the accelerator pedal with a comfortable foot posture. On the other hand, the rotated foot posture requires the driver to rotate the right foot around the heel toward the accelerator pedal (
Figure 1b). This posture has an advantage in easily switching the pedals without large movement of the leg; however, there might be an inappropriate contact between the sole of the foot and the top surface of accelerator pedal, due to their misalignment. This may require more leg muscle efforts, due to imperfect contact while operating the accelerator pedal.
Operation of car pedals requires an intensive use of the leg and foot, which can cause discomfort and/or fatigue for a prolonged driving period [
15,
16]. The frequent and repetitive movements may result in musculoskeletal burdens of the lower limb. In addition, foot-intensive tasks while operating the accelerator pedal can increase the chances of lower-extremity strain and discomfort. On the other hand, the effects of the operating foot postures on the accelerator pedal on lower-limb muscle activities and foot angles remain unclear, and have not been comprehensively investigated yet. Investigation on these issues can be worthwhile for an ergonomic design of the pedal based on muscle activities and foot motions, providing drivers with low biomechanical load and high comfort while driving.
This study aimed to examine lower-limb muscle activities and foot angles as the function of % stroke (percent of the accelerator pressed) for the two (natural and rotated) operating postures. For this purpose, two research hypotheses were discussed: (1) the rotated posture requires more muscle efforts than the natural posture in pressing the accelerator pedal, (2) the rotated posture escalates more awkward foot posture while pressing the accelerator pedal than the natural posture. This study conducted an experiment with 10 male participants to measure muscle activities and foot angles while pressing the accelerator pedal in the two different operating postures. The findings of this study can help car designers and engineers in the development of new accelerator pedals.
2. Materials and Methods
2.1. Participant
Ten male participants with average driving experience of 19.6 years (SD = 9.3 years; range = 7~32 years) and having a professional driving-test license issued from a car research and testing center were recruited for the experiment in this study. Their average height and weight were 173 cm (SD = 5.9; range = 163~184 cm) and 73.1 kg (SD = 10.1; range = 64~100 kg), respectively. No participants reported any muscular symptoms, medical problem, or discomfort on the experiment day. All participants signed an informed consent form and were given a description of the study objective and procedures prior to participating in the experiment. Their participation in the experiment in this study was compensated for.
2.2. Equipment
A sedan-type car with an organ-type accelerator pedal on the market (launched in 2019) was employed in the present study to examine the lower-limb muscle activities and foot angles while pressing the accelerator pedal using either of the two foot postures (neutral and rotated postures). The dimensions of the accelerator pedal considered in this study were 7.0 cm (width) and 21.0 cm (length). Its initial and fully-pressed angles were measured using a goniometer (Goniometer 12-1006-25, SeedTech, Incheon, Republic of Korea), and were 70° and 60° (operating angle = 10°) from the car floor, respectively.
2.2.1. Electromyography
Electromyography (EMG) was measured for five major muscles (
Figure 2) of the right leg (rectus femoris (RF), medial gastrocnemius (MG), lateral gastrocnemius (LG), tibialis anterior (TA), and peroneus longus (PL) muscles) in relation to operating the accelerator pedal [
6,
9,
16,
17]. The RF is involved in hip flexion and knee extension. Both the MG and LG relate to knee flexion and ankle extension. The TA and PL are involved in ankle flexion/inversion and ankle extension/eversion, respectively. It could be noted that the ankle flexion and extension are also well known as dorsiflexion and plantarflexion, respectively. A TeleMyo DTS surface EMG system (Noraxon Inc., Scottsdale, AZ, USA) was utilized for the EMG measurements using disposable EMG electrodes (10 mm diameter; 3M Korea Ltd., Seoul, Korea). The attached sensors on the muscles of the right leg are shown in
Figure 3. In addition, the sampling rate was set to 1500 Hz. All raw EMG data were root mean squared (RMS) with a window span of 100 msec, and rectified.
Maximum voluntary contraction (MVC) was measured in accordance with the Caldwell protocol [
18] to calculate %MVC. The MVCs for each muscle were recorded while the participants were maintaining their maximum right leg forces. For instance, the MVC of the RF muscle was measured when a participant fully extended his leg. Each participant was requested to maintain his maximum force for approximately 5 seconds, and the EMG data for 3 seconds in the middle was used in calculating the MVC.
Figure 2.
Illustration of EMG and IMU sensor location.
Figure 2.
Illustration of EMG and IMU sensor location.
Figure 3.
Illustration of the sensors location on right foot.
Figure 3.
Illustration of the sensors location on right foot.
2.2.2. Inertial Measurement Unit
In order to measure foot motions, a three-axis inertial measurement unit (Phidget Spatial Precision 3/3/3 High Resolution; Phidgets Inc., Calgary, CA, USA) was used in this study. The IMU sensor was placed on the dorsal side of the participant’s right shoe (
Figure 1). The sampling rate was set to 32 Hz. An experimental software was developed using Visual Studio 2019 (Microsoft Co., Redmond, WA, USA) to record and save the motion data from the sensor. Since the raw data measured from the sensor varied not only by foot posture but also foot position, the data was normalized with the average angle for the natural posture (comfortably laying the right foot on the accelerator pedal).
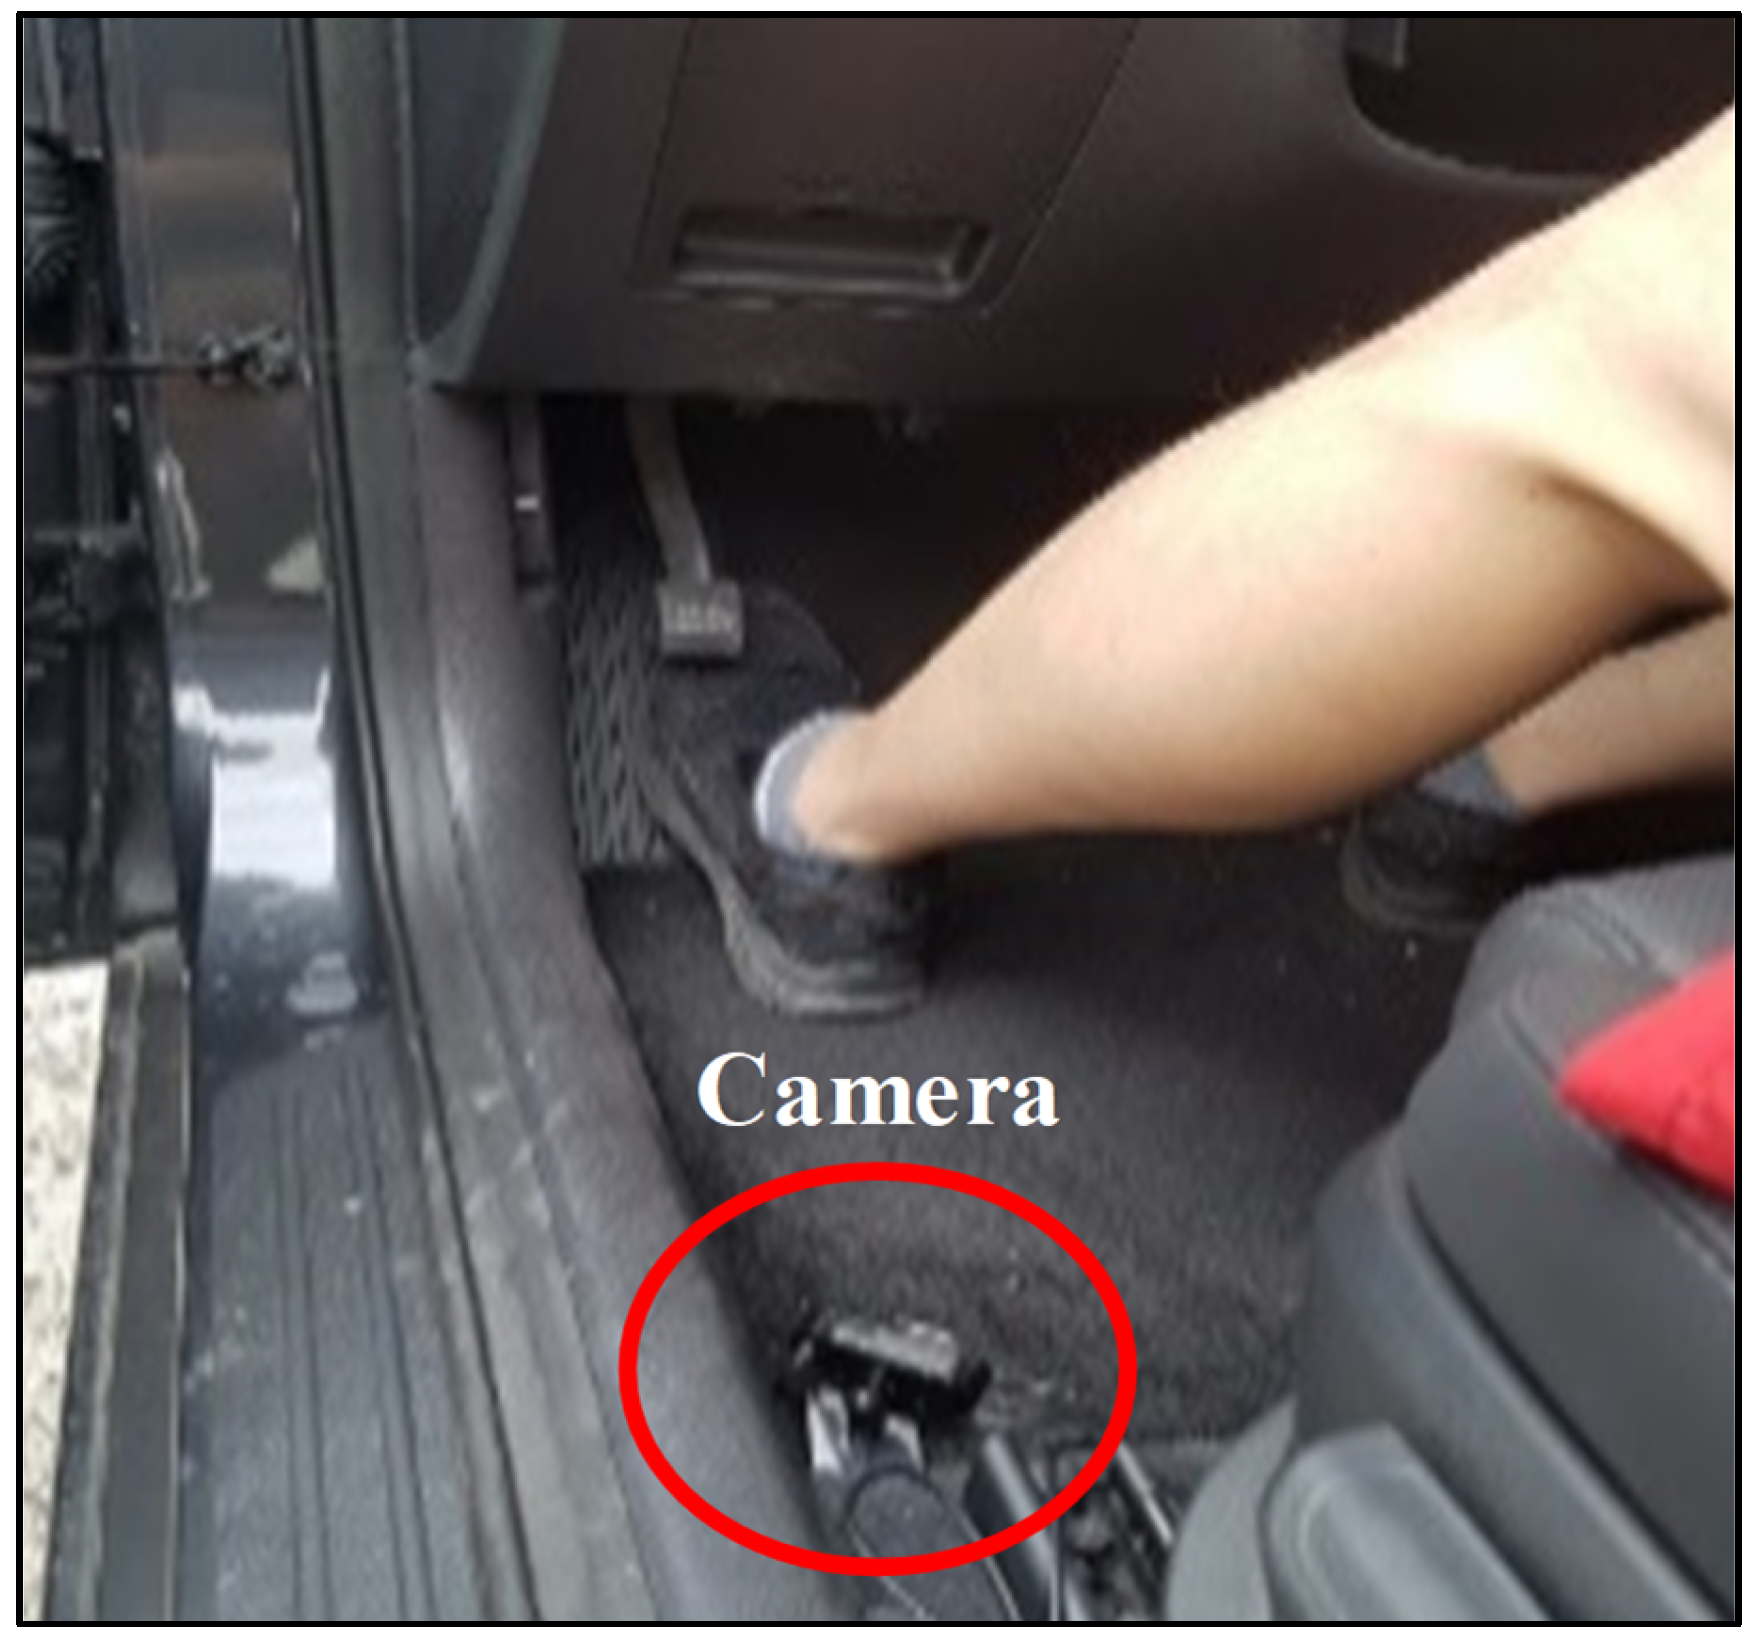
2.2.3. Accelerator Position Sensor and Video Camera
The accelerator position sensor (APS) originally installed in the car was employed in this study to acquire %stroke (% of accelerator pedal pressed). A notebook computer (Latitude E5580, Dell Inc., Round Rock, TX, USA) was connected to the electronic control unit (ECU) through the on-board diagnostics (OBD) port and a commercial software (Inca v.7, ETAS GmbH, Bochum, Germany) collected %stroke at 100 Hz sampling rate. In addition, this study employed a video camera (C170, Logitech International SA, Lausanne, Switzerland) to capture the foot motions while pressing the accelerator pedal during the experiment. The camera was positioned on the left on the floor next to the driver’s seat to capture the entire area of the accelerator pedal (see
Figure 4).
2.3. Experimental Design
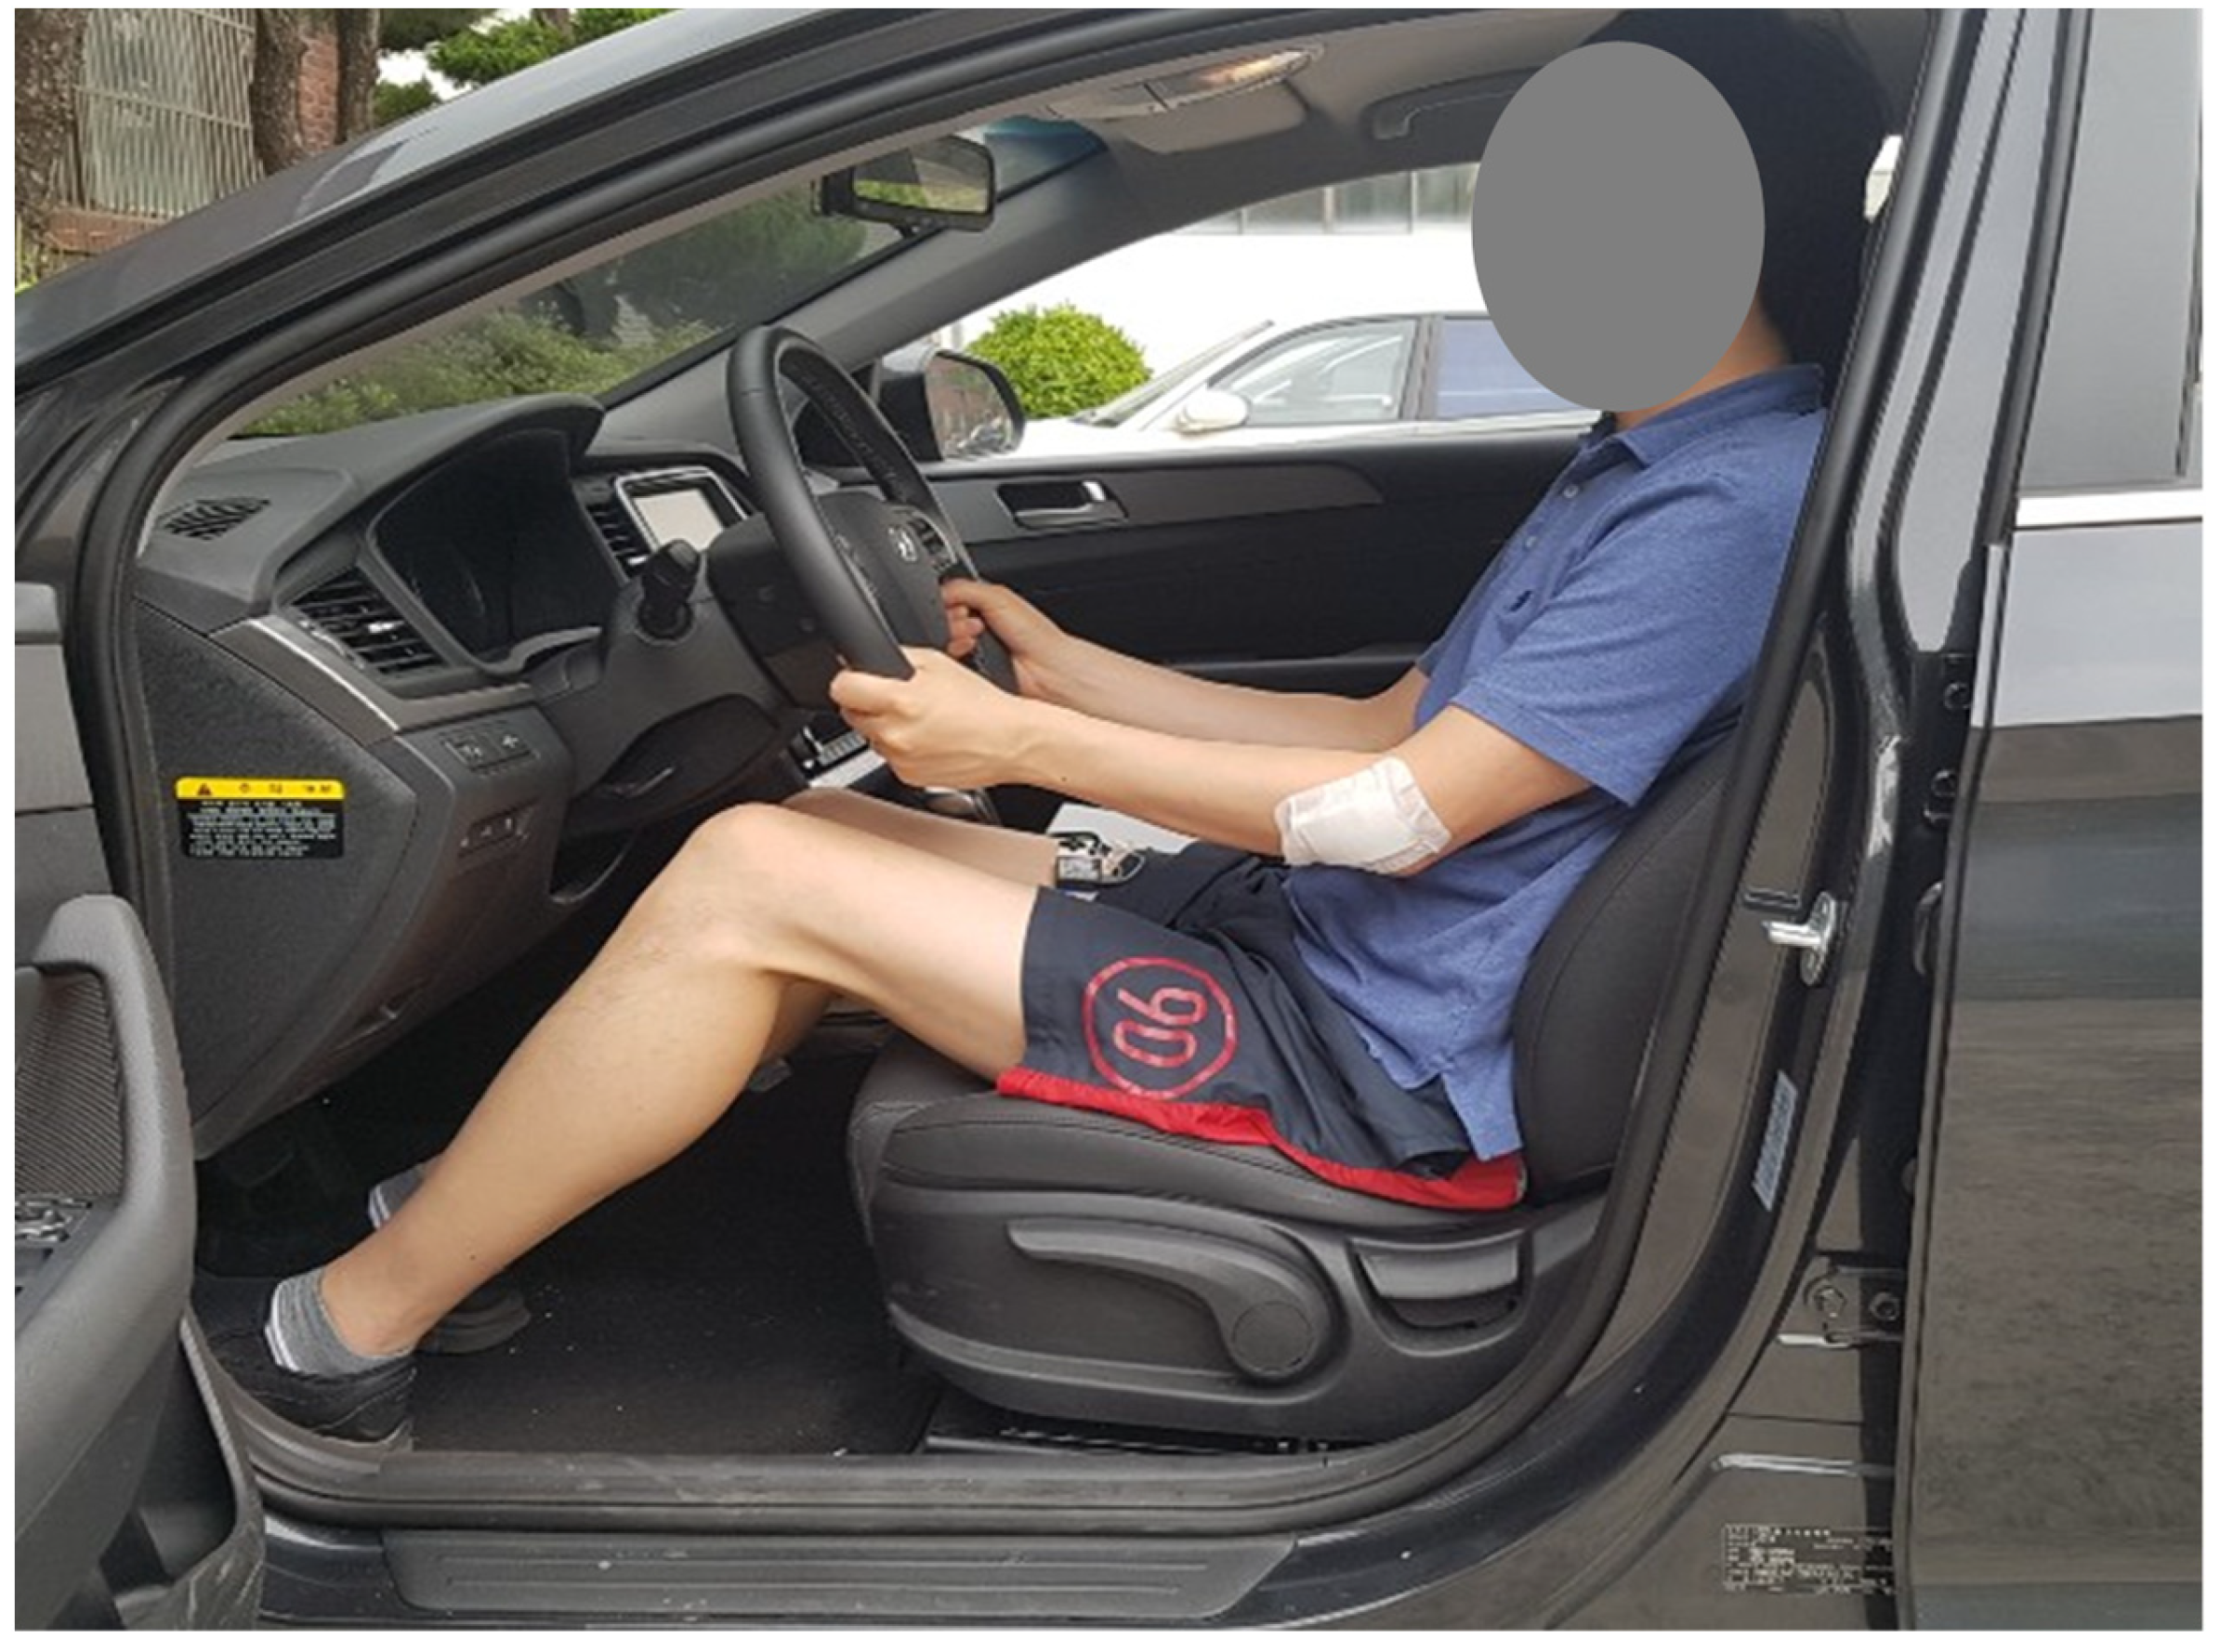
The experiment was performed in accordance with the five-step procedures: (1) introduction, (2) MVC measurement, (3) practice session, (4) main experiment, and (5) debriefing. In the first step, the objective and experimental procedures were explained in detail to the participants. They were also provided with informed consent details including ethical entitlements (e.g., withdrawal right during the experiment and data privacy), prior to taking part in the experiment in this study. In the second step, the participants were asked to exert their maximum force in order to measure the MVC on the five target muscles of the right leg. In the third step, practice driving was allowed for the participants, to adjust their driver seat (
Figure 5) and become accustomed to the accelerator pedal operation. Next, the main experiment was performed in a parking area while the car s ignition was on, in order to control the possible effects of driving speed, road condition, traffic, and car-body vibration. Initially, they were asked to position their right foot on the brake pedal. The participants were then asked to naturally press the accelerator pedal with their right foot until the maximum %stroke was achieved. The right-foot postures while pressing the accelerator pedal were previously shown in
Figure 1. Muscle activities, foot motions, %stroke of the accelerator pedal, and a video were recorded in the main experiment. Lastly, a short debriefing session was completed for each participant, regarding the experiment results.
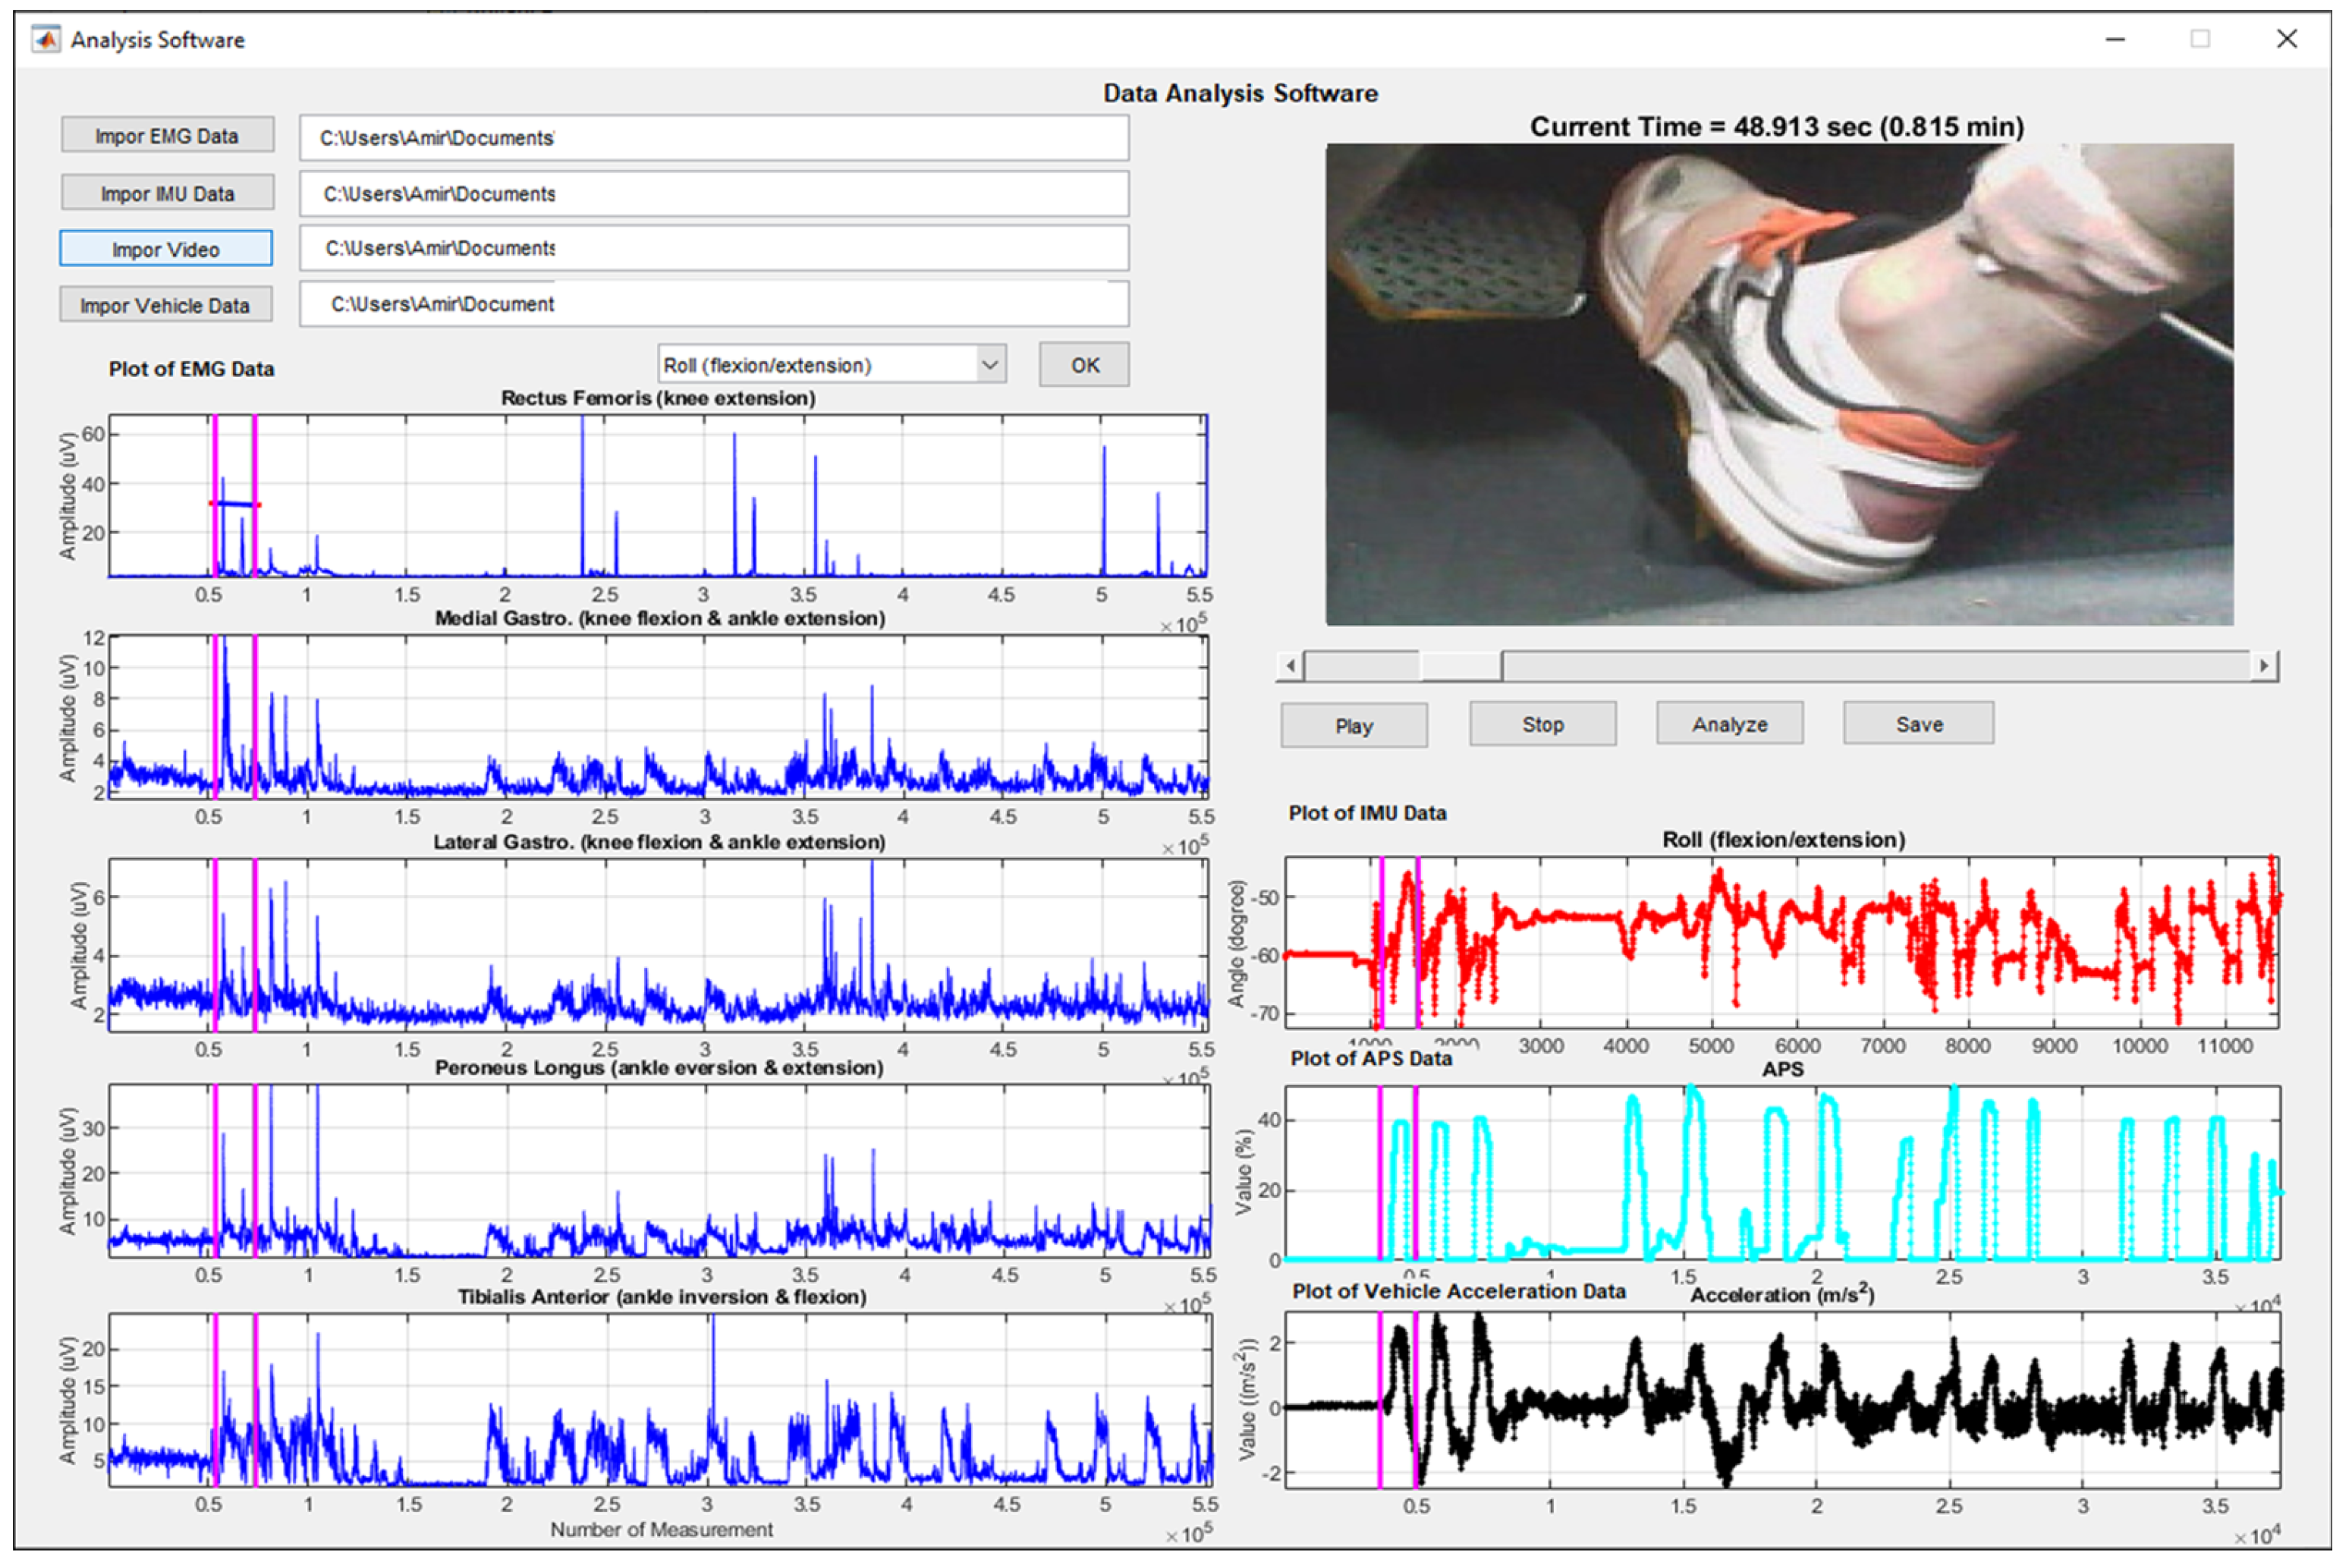
2.4. Statistical Analysis
This study coded an analysis platform as shown in
Figure 6 to analyze the data measured. First, the platform synchronized all data (video, EMG, IMU, and %stroke) with time. Next, the platform identified the data measured while pressing the accelerator pedal based on %stroke. For example, the starting point for pressing the pedal and the end point were identified using a criterion of 1% stroke. After that, the points were visually confirmed by watching the video on the right-foot motion.
A two-factor (foot posture and %stroke) between-subjects analysis of variance (ANOVA) was conducted using Minitab v17.0 (Minitab Inc., State College, PA, USA) at α = 0.05. The independent variables were foot postures with 2 levels (natural and rotated postures) and %stroke with 11 levels (0% to 100% with 10% step). Due to a technical problem, the data for one participant was eliminated. Seven participants employed the rotated foot posture in operating the accelerator pedal, but only two participants used the natural foot posture. There were nine dependent variables: averaged %MVC of the five muscles, %MVCs of five individual muscles, and three foot angles (flexion/extension, inversion/eversion, and internal/external rotation). The averaged %MVC was used to investigate the total muscle effort required to operate the accelerator pedal. Two gastrocnemius muscles (lateral and medial) were averaged into one %MVC since they showed a similar trend, regardless of foot posture and %stroke. For post-hoc analysis, Tukey tests were employed at the same significance level.
4. Discussion
The rotated posture required more muscle activations as the accelerator pedal was pressed, compared with the natural posture. This result can be interpreted in two ways. First, the rotated posture postulates that the right foot is rotated, and this unnatural posture may incur higher muscle-exertion as the foot presses the accelerator pedal more [
5,
17]. Second, the rotated posture causes inappropriate contact between the sole of the foot and the pedal surface. This may incur more muscle activations in order to correctly press on the pedal.
The mean %MVC of the RF was quite similar in both postures, across all the range of %stroke. This indicates that the anterior muscle of the upper leg (upper thigh area) is fairly maintained in its level of contraction, regardless of the operating posture and %stroke. This result agrees with existing studies [
4,
17]. Jung and Lee [
17] found that the RF muscle is not significantly activated while operating the accelerator pedal. In addition, Chen et al. [
4] stated that during the operating postures, the level of contraction gradually shifted from the upper thigh area to the calf.
The mean %MVC of gastrocnemius tended to increase as %stroke was elevated in both postures. This trend can be explained by the foot extension motion which is required to press the accelerator pedal. When pressing the pedal, the right foot should be extended, and this evokes more activation of the gastrocnemius. The result of this study is also consistent with the findings obtained by existing studies [
4,
6]. They stated that the gastrocnemius muscle gradually increased its effort as the accelerator pedal was gradually depressed.
The mean %MVC of the PL for the rotated posture was slightly decreased as the pedal was pressed. Since the foot is extended as the pedal presses, the %MVC of the PL should coherently increase if there is no eversion, but it slightly decreased in this study. This may be explained by the fact that the rotated posture partially incurred a slight eversion of the right foot at the beginning of the pedal press, since the right foot was rotated. While pressing the pedal, the eversion of the right foot gradually diminished. In the motion analysis of this study, the foot eversion/inversion showed a slight change from eversion to inversion. This may contribute to a slight decrement in PL.
The mean %MVC of the TA for the rotated posture increased greatly after 50% of stroke. Since pedal press requires foot extension rather than flexion, %MVC of the TA may be affected by inversion motion. In the motion analysis of the study, the right foot started to slightly invert after 50% of stroke. This indicates that the rotated posture requires the driver to slightly invert the foot to press the pedal hard, since the foot is slightly rotated. However, to conclude this, an in-depth experimental study is necessary.
The mean %MVC of the TA for the natural posture started high and rapidly dropped until 30% of stroke. After that, it remained a low level. This can be explained by the fact that the foot was initially slightly flexed, which incurred more activations of the TA. As the pedal was pressed, the foot gradually extended. Thus, the TA was relaxed, which reduced the activations of the TA.
Foot extension in both postures showed a positive linear relationship with %stroke. The ranges of foot extension while pressing the pedal for both postures were 15.74° and 14.49°, respectively. These findings revealed that the foot extends as the accelerator pedal is pressed, regardless of the postures. On the other hand, foot extension in both postures was greater than the pedal-stroke angle measured in this study (10°). The reason for this discrepancy is unclear. However, this might be explained by the fact that the contact location of the pedal surface in relation to the sole of the foot might be changed (by sliding down) as the pedal is pressed.
Although there was no difference for foot inversion/eversion between both postures while %stroke was less than 50%, foot inversion for the rotated posture tended to be elevated with a greater %stroke. This result can be explained by two reasons. First, the rotated posture requires the driver to rotate the foot, which naturally incurs unstable contact between the sole of the foot and the top surface of the accelerator pedal. As the pedal is pressed, this instability may lead to the foot being inverted. Second, with the rotated foot in the rotated posture it is hard to evert the foot rather than invert it, due to its range of motion. The range of motion for the inversion (23°) is greater than that for the eversion (12°) [
19,
20,
21]. Due to this mechanical characteristic of the foot, it is more natural to invert the foot than to evert. However, the foot inversion/eversion for the natural posture remained, regardless of %stroke. This may have occurred because the foot was properly contacted with the pedal and its contact condition was enough to press the pedal without the foot tilting.
The rotated posture required approximately 5° more external rotation of the right foot than that of the natural posture. This result may be natural, since the rotated posture requires the rotation of the right foot toward the accelerator pedal. Therefore, this foot angle of external rotation found in this study may be affected by the geometrical relationship between the brake pedal and accelerator pedal.
5. Conclusions
The present study investigated muscle activities of the right leg and angles of the right foot while operating the accelerator pedal. The accelerator pedal in a car is actuated by the right foot in either of two foot postures (rotated and natural), in accordance with the driver’s preference. This study examined the effects of foot postures in pressing the accelerator pedal on leg muscle activities and foot angle. The results showed that the rotated foot posture (%MVC = 6.39%) exerted 1.66 times more muscle activities than the natural foot (3.86%) posture in pressing the accelerator pedal. In addition, unnatural foot inversion was observed in the rotated foot posture, due to unstable contact between the sole of the foot and the top surface of the accelerator pedal. We expect that the findings of this study can be utilized in the design of a new accelerator pedal for better driver experience.
The experimental findings of this study can be used in designing new accelerator pedals. However, several limitations need to be highlighted for the generalization of the findings in this study. First, the study was limited in terms of sample size and diversity of participants. A future study is needed to comprehensively examine the effects of the two styles of pedal operation for the participants with large sample size and diverse demographic characteristics (e.g., age, gender, and population). Second, the joint angles were only measured on the right foot with an IMU sensor. To better capture the effects of lower-extremity motions, a further experiment is recommended to comprehensively monitor the motions of the knee, hip, and ankle joints with several sensors. Lastly, a follow-up study is also needed to investigate the effects of operating postures on muscle activities, joint angles, and subject comfort during car driving on the road, to generalize the findings of this study.


