Article

Visual Simulator for Mastering Fundamental Concepts of Machine Learning

School of Electrical Engineering, University of Belgrade, Bulevar kralja Aleksandra 73, 11000 Belgrade, Serbia
*
Author to whom correspondence should be addressed.
Appl. Sci. 2022, 12(24), 12974; https://doi.org/10.3390/app122412974
Submission received: 21 October 2022 / Revised: 7 December 2022 / Accepted: 14 December 2022 / Published: 17 December 2022

Abstract

:
Machine learning (ML) has become an increasingly popular choice of scientific research for many students due to its application in various fields. However, students often have difficulty starting with machine learning concepts due to too much focus on programming. Therefore, they are deprived of a more profound knowledge of machine learning concepts. The purpose of this research study was the analysis of introductory courses in machine learning at some of the best-ranked universities in the world and existing software tools used in those courses and designed to assist in learning machine learning concepts. Most university courses are based on the Python programming language and tools realized in this language. Other tools with less focus on programming are quite difficult to master. The research further led to the proposal of a new practical tool that users can use to learn without needing to know any programming language or programming skills. The simulator includes three methods: linear regression, decision trees, and k-nearest neighbors. In the research, several case studies are presented with applications of all realized ML methods based on real problems.

1. Introduction

Artificial intelligence is about building machines that do the right thing and that act in ways that can be expected to achieve their objectives [1]. In the last couple of years, new powerful computers have enabled the return of neural networks, through deep learning, and achieved fantastic results in many fields, such as computer vision, automatic translation, automatic vehicle control, playing strategy games, etc. These results are based on inductive reasoning-statistics and machine learning [2]. With that in mind, it is not surprising that the influence of artificial intelligence in various spheres of life, including education, is increasing every day [3]. When given a collection of initial data, the goal of the computer is to create a model of dependence among those data and based on a model generate an algorithm that can draw conclusions with new data as precisely as possible. Machine learning is the area of artificial intelligence that studies algorithms that enable solving such problems [4].
Machine learning has evolved significantly over the last couple of years and has become one of the most popular areas of computer science. Courses in machine learning are offered to engineering students at all levels of studies worldwide. They usually introduce the definitions of a wide variety of machine learning tasks, inductive and simple statistical-based learning, machine learning problems such as overfitting and calculating accuracy of the model, and visualizing results [5,6,7,8]. Most of these concepts are complex and may be hard to understand for someone who has encountered these topics for the first time. A large problem is the fact that most concepts require advanced knowledge of programming, which leads to the situation where the practical part of a course focuses on programming instead of analysis and comprehension of concepts and techniques which are actually applied. To assist students, teachers often use tools that help students acquire the concepts they learn in class through interactive and visual step-by-step simulations or provide students with skeleton code that they can use [9,10,11,12,13,14].
This research paper focuses on analyzing existing systems and developing a new software system created for students at the School of Electrical Engineering, University of Belgrade, which enables users to understand and learn the concepts of machine learning without the necessity to write a program code. Students have the opportunity to implement all phases of work of the most important algorithms in the field of machine learning, visually and interactively, without programming. In this way, students have effectively explained the abstract concepts that use the mentioned algorithms. At the Department of Computer Science and Information Technology, where this visual simulator was developed, the authors already had many years of experience in developing other simulators for the areas of computer architecture and organization, databases, as well as simulators for learning standard artificial intelligence techniques, such as search algorithms, planning, and reasoning strategies [15,16,17,18,19,20,21,22].
When analyzing the software system’s requirements for implementation, it is concluded that it would be necessary that the system guides the users through all the steps of data processing, data entry, model training, validation, testing, and result visualization. To that end, users have the possibility to learn based on an authentic collection of processed data but also the opportunity to enter user-generated datasets. On the one hand, some users aim to create new models and carry out the entire procedure of machine learning, while some other users find it more appealing to make predictions based on already trained models. Besides benefiting students, this software system is helpful for teachers when presenting and explaining selected machine learning algorithms.
The following section considers and analyses existing university courses in machine learning and the most popular machine learning algorithms. In that section, on the basis of the realized analysis, a proposal for a new software tool is given. The third section presents the design of the software system and shows the user interface through several examples. The discussion of the results for one use case when we use realized models on the same real estate data set is presented in the fourth section. The evaluation of the usage of the mentioned software solution in teaching at the School of Electrical Engineering, University of Belgrade is considered in the fifth section. A conclusion is given at the end of the paper.

2. Related Work and Requirements

The research starts with the analysis of introductory courses in the area of machine learning at some of the best-ranked universities in the world [23,24,25] and several larger universities from the region. The first part of the analysis includes topics discussed in these courses, while the second part of the analysis focuses on the structure of the courses and tools used for practical lessons. The paper then analyzes the most popular software tools used in course implementation and proposes software tools suitable for the Intelligent Systems course at the School of Electrical Engineering in Belgrade.

2.1. Machine Learning in Teaching at Universities

Machine learning courses from universities around the world were analyzed in detail in order to identify their advantages and disadvantages. The first part of the research compares course syllabi, while the second part of the analysis is concerned with course structure and tools used in courses.
Table 1 gives an overview of the main topics recommended by expert organizations IEEE (Institute of Electrical and Electronics) and ACM (Association for Computing Machinery) for a machine learning introductory course, as well as the presence of those topics in the analyzed course syllabi [3,26,27]. For every course, there is the name of the course, the name of the university, and the presence of recommended topics in the syllabi. Machine learning tasks include introductory topics, definitions of the machine learning concept, application of machine learning, and understanding of the three main styles of learning: supervised, unsupervised, and supported. Inductive learning includes the topics concerned with differences between deductive and inductive learning. Simple machine learning algorithms include linear and logistic regression, naïve Bayes classifier, decision trees, and k-nearest neighbors. The last two topics are concerned with more concrete machine learning problems, such as the problem of overfitting or the problem of model prediction accuracy, and ways to solve such problems.
The analysis shows that there are three groups of machine learning courses. The first one includes introductory machine learning courses whose description contains all the topics recommended by IEEE and ACM [26,27]. The second group includes advanced courses in machine learning which are not concerned with machine learning tasks and simpler machine learning algorithms, but with more advanced algorithms, optimizations, and performances. The third group is the smallest and includes courses whose focus is not on machine learning itself but in which machine learning is just one element. Such courses usually do not address all the proposed topics, which is understandable bearing in mind the fact that the number of teaching weeks is limited.
The further analysis focuses on the structure of the listed courses. Table 2 provides basic information on course structure. For each course, it is indicated at which level of studies it is offered and whether there are practical lessons in the form of lab exercises and project tasks. For the courses, which include lab exercises or project tasks, the table also provides the name of the technology or used tool and information on whether it has been developed at the same university.
Based on this analysis it can be concluded that the majority of courses offer some form of practical lessons that place emphasis on project tasks and homework. Laboratory exercises are rarely a part of practical evaluation but are more often organized as a demonstration of concrete tools necessary for implementation of project tasks. The technology most frequently used in practical lessons is the programming language Python, followed by the other most popular programming language, R, and the Weka tool [28]. Universities very rarely develop their own tools to support machine learning courses, which means that it is necessary to possess certain programming knowledge to keep up with the course. The analysis shows that highly ranked universities on the ARWU (Academic Ranking of World Universities) list do not use their own tools for teaching, while universities with somewhat lower rankings do develop their own tools for machine learning courses and use them in lessons.

2.2. Analysis of Existing Solutions

The presented analyses showed in which way machine learning courses are organized in prestigious universities in the world, as well as which tools and technologies are used for practical lessons. Programming languages Python and R are the most frequent technology choices for practical lessons due to their capacity to realize and visualize a large number of machine learning algorithms, but they are dependent on learners’ programming experience. Some of these courses make it easier for students to program algorithms using web tools such as Jypiter Notebook, while others require advanced knowledge of programming and specific programming languages. As already stated, the focus of the analysis was the choice of the appropriate tool rather than the programming language. Among the tools, the best candidates are Weka, AIspace, JMP and Keel [28,29,30,31,32].
Weka is an open code software system developed at the University of Waikato in New Zealand, which is used in the area of machine learning [28]. The software can be used for machine learning model training and prediction initiation without the need to write any line of code. The tool can be used with a rich user interface or terminal and involves several methods for common machine learning tasks and additionally enables access to known tool frameworks such as scikit-learn, programming language R, and Deeplearning4j. The advantages of Weka are therefore the analysis and application of the entire process of machine learning, from data pre-processing, creating a model by choosing one of many realized machine learning algorithms, and making predictions based on input data. Many researchers have used this tool because of its intuitive user interface and easy way to get results from a trained model [33,34,35,36,37,38].
The tool Keel is an open code software, developed at the University of Granada, Spain. It is written in the Java programming language, which encourages the user to understand the process of learning and techniques used in machine learning problems such as classification and regression [32]. The main characteristics of Keel are its very simple and intuitive graphic user interface, which makes the work easier for new users; its other advantages are the existence of numerous incorporated machine learning algorithms, the data pre-processing technique, and the comparison of performances and statistical elements of analysis. The versatile possibilities of Keel as a tool make it suitable for researchers in the field of machine learning and appropriate for educational purposes such as academic courses [39,40,41,42,43,44,45,46,47].
JMP is the data analysis tool from SAS Institute [48]. The software can be used to understand data, visualize it, perform the appropriate analytics and make statistical discoveries. It has a rich user interface with drag-and-drop facilities, dynamically linked graphs, libraries of advanced analytic functionality, scripting language and ways of sharing findings with other users. Also, users can interact immediately with data without having to submit code and wait for output or graphs. The following machine algorithms are implemented: Decision Trees, Clustering, Neural Networks, Self-Organizing Maps, Bootstrap Forest, Association Analysis, Regression, Singular Value Decomposition, K Nearest Neighbors, Naive Bayes [49,50,51].
Decision Tree comes as a part of a package of tools developed under the name “AISpace” at the University of British Columbia in Canada [30,31]. The package offers tools for learning and concept research in the area of artificial intelligence. The tool is developed in the Java programming language and is freely downloadable from the official web presentation [51]. Decision Tree demonstrates how to generate a decision tree starting from dataset input for training and testing to the visualization of the entire process of generation of the tree that would later classify new data. An additional advantage is that the tree can be built step by step so that the user can keep track of the procedure, or it can also be generated “at once” if the user wants to see the final result.
The listed tools have been analyzed across multiple criteria using the following specific scale that the authors defined: the simplicity and intuitiveness of the user interface on a scale of 1 to 5, with 5 being the most user-friendly interface and 1 being the most complex; the possibility to use certain machine learning algorithms; the openness of the software system code; the degree of good algorithm execution control on a scale of 1 to 5, with 5 being the best execution control with clear details in every step and 1 being the worst. The analysis of existing tools used in machine learning course lessons shows that each of the listed systems fulfills the expectations for which they are implemented, but none of these tools meet the requirements established for the Intelligent Systems course presented in Table 3.
The Intelligent Systems course is the introductory elective course in artificial intelligence and machine learning in the Computer Engineering and Information Theory Module and Software Engineering Module in the third and fourth years of the School of Electrical Engineering, University of Belgrade [52,53]. The algorithms suitable for beginners in this area which the future visual simulator should include are the following:
  • Linear regression
  • Decision trees
  • k-nearest neighbors method

2.3. Proposed Solution for Tool Development

The conclusions listed above were sufficient to motivate the realization of a new software system for machine learning algorithm lessons, which would be used in the Intelligent Systems course. The software system would allow users to create new models or use already trained models of real-life examples which would be interesting to users.
The user can choose one of the included models, load it, and make predictions based on it. In this way, the significance and applications of machine learning in various fields will become more familiar to learners, while at the same time the system offers the possibility to quickly analyze problems of interest.
On the other hand, it is necessary to enable users to create a new model of machine learning for one of the selected algorithms. Users can load data, examine them, and choose the data of interest, after which they can select the machine learning algorithm and train the model. During the training, users have a wide spectrum of parameter settings at their disposal so as to better understand how those affect the later-obtained results. In other words, users will learn which parameters are relevant for which problem and how they can be best adapted to the problem. Users can use the trained model for prediction with the option to save the model, which makes it possible to return to the problem if they wish.

3. System Design with Examples

To make it even easier for students to use the system, no previous installation is required. After downloading the necessary files, the system can be started by running the following command in the terminal: python3 main.py. The system is designed to have a low usage of system resources, so that it can be run on most modern computers. Figure 1 shows the start screen of the software system. The user can choose one of the three possibilities offered by the software system: creation of a new model, analysis of the existing model, and making predictions.

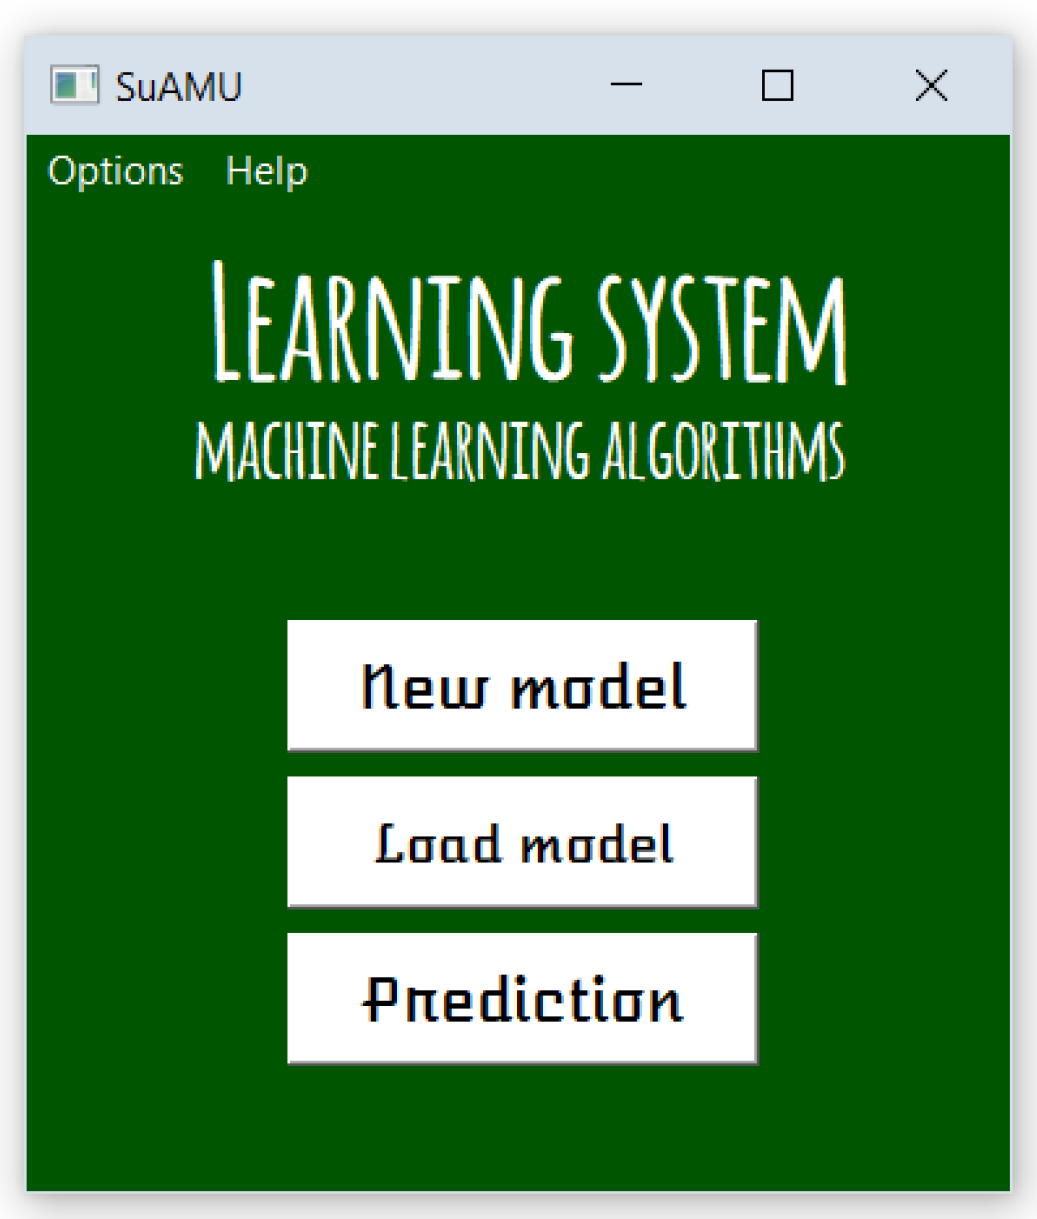
3.1. Creating New Models

The first option of the software system offered to the user is to create a new model. This option opens the window for loading and analysis of datasets presented in Figure 2. It presents the form for loading the input dataset and choosing relevant attributes. It is the window of the file system that gives the user the possibility to choose the file for loading. The data that load must be in the CSV (Comma-separated values) form. There can be only one output variable in the software system. The file must be such that the last column is the value that is predicted, while all the previous columns are input values.
After the input dataset is loaded, the field on the left-hand side will display all the attributes that exist in the dataset. The user can perform a simple selection of all the relevant attributes that they wish to involve in the learning process. All the remaining attributes will be ignored. The software system automatically pre-processes selected input data by filling in incomplete or undefined attribute values. For numerical values, the system fills the inadequate value with the middle value of all the remaining rows in the table. For the values of the categorical type, a new category labeled “other” is created, and all the inadequate data are filled in with it.
If the user wants additional information on some of the attributes, they can open a window with information by double-clicking on the desired attribute, after which they are shown a window with statistical information on the attribute values in a dataset. Figure 3 shows the window with additional information on the attribute “city”, whose values are categorical and represent the city in which the real estate is located. Statistical information contains the number of lines in the dataset, the number of unique categorical values, the most frequent attribute value, and the number of its occurrences.
Figure 4 shows the window with additional information on the “number of rooms” attribute whose values are numerical and represent the number of rooms of the real estate. Statistical information contains the total sum of values of all rows, the average value, standard deviation, minimal and maximal value, and the most frequent value in the lowest 23%, middle 50%, and top 75% of the rows from the dataset.
It is very important to analyze input data so as to decide which data should be taken into consideration when creating a model. To additionally encourage system users to analyze data before they start the process of creating a model, in addition to statistics the system also shows appropriate graphs obtained based on the value of the selected attribute. Figure 5 shows the frequency of the ten most common values of the attribute “city”.
Figure 6 shows the histogram of values of the attribute “the number of rooms” which appears after statistics. When the user is satisfied with the choice, they click the appropriate button to continue model configuration. The user can go back to the previous step at any moment by clicking on the button “back”.
After loading the data and selecting attributes, the user can choose one of the three offered algorithms in the software system: linear regression, decision tree, and k-nearest neighbor method. After selecting the algorithm, the user receives the form with hyperparameter settings of the selected algorithm.
Regardless of the chosen algorithm, the user always has the option to configure the percentage of the entire loaded dataset that will be tested, choose the option of mixing datasets before creating groups of data for training and testing, and include the process of data standardization as a part of data preprocessing. The option of mixing data before grouping can be useful if the input dataset is arranged according to a certain criterion, while standardization is applied often and represents a desirable feature of input datasets for the majority of machine learning algorithms.
Depending on the selected algorithm, the user has the possibility to set appropriate hyperparameters:
  • For the linear regression parameter it is possible to choose to use the method of gradient stochastic descent as optimization in searching for the minimum function error, adjusting the maximal number of iterations, and criteria for stopping when finding the minimum of the function, and applying L1 and L2 regularization in model training.
  • For the decision tree, there are two ways in which the next attribute for division can be chosen: the attribute with the highest gain or a randomly picked attribute. Additionally, it is possible to choose the function of the division. If the dataset is such that the output value is categorical, possible division functions are entropy and the Gini function. If the dataset is such that the output value is numerical, the possible functions of division are the mean absolute error and mean square error.
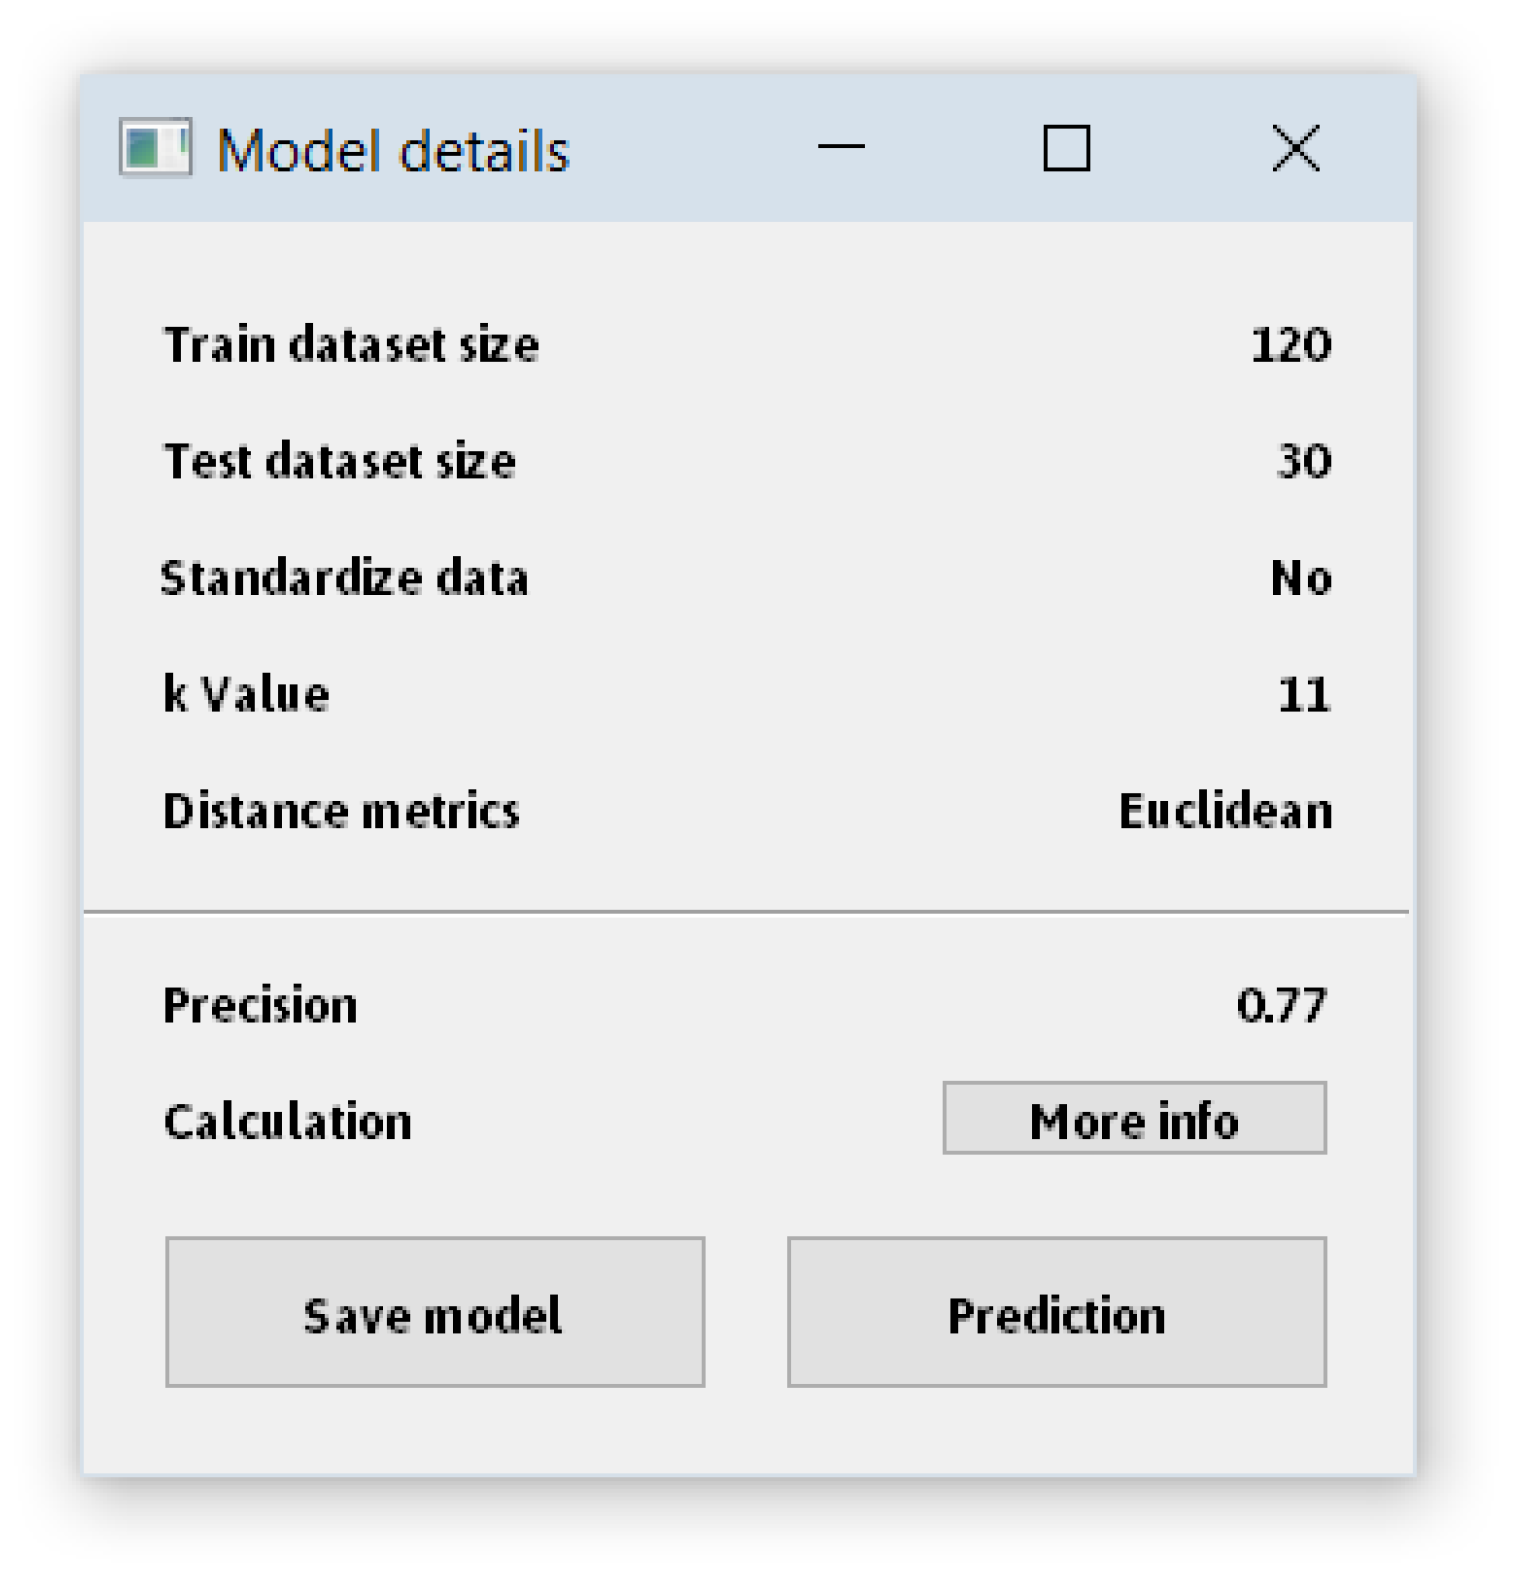
  • For the k-nearest neighbor it is possible to choose the value for the k parameter and metrics used to calculate distance. The supported metrics are Euclidan, Manhattan, Chebishev, and Mahalanobis distance.
Figure 7 shows the form for filling in hyperparameters of linear regression algorithms. By pressing “train the model” button, the user initiates the process of model training. As in the previous form, the user has the possibility to go back to the previous form and open the window with an explanation.
After successful model training, the user is shown a window with details of the trained model, and the option to save the model and perform predictions. Figure 8 shows the window with the details of the trained model, in this case with the k-nearest neighbor algorithm. The window shows the number of records (table rows) taken for testing, i.e., model training, the presence of standardization in data preprocessing, the value of all adjusted hyperparameters for the concrete algorithm, and the precision of the model on the 0 to 1 scale. The user can display the calculation step by step as well as a visual representation of the algorithm when possible.
When the user presses “Save model” button, the user can see the window of the system file for selecting the name and the location of the saved file. By pressing the “More info” button, the user is shown a detailed calculation of the algorithm step by step.
Figure 9 shows the decision tree obtained based on the set of data about the types of the Samoyed dogs. In the tree one can see a detailed criterion for moving to the next knot, the value of entropy, the number of samples that participate in the further development of the tree, and their output value distribution.

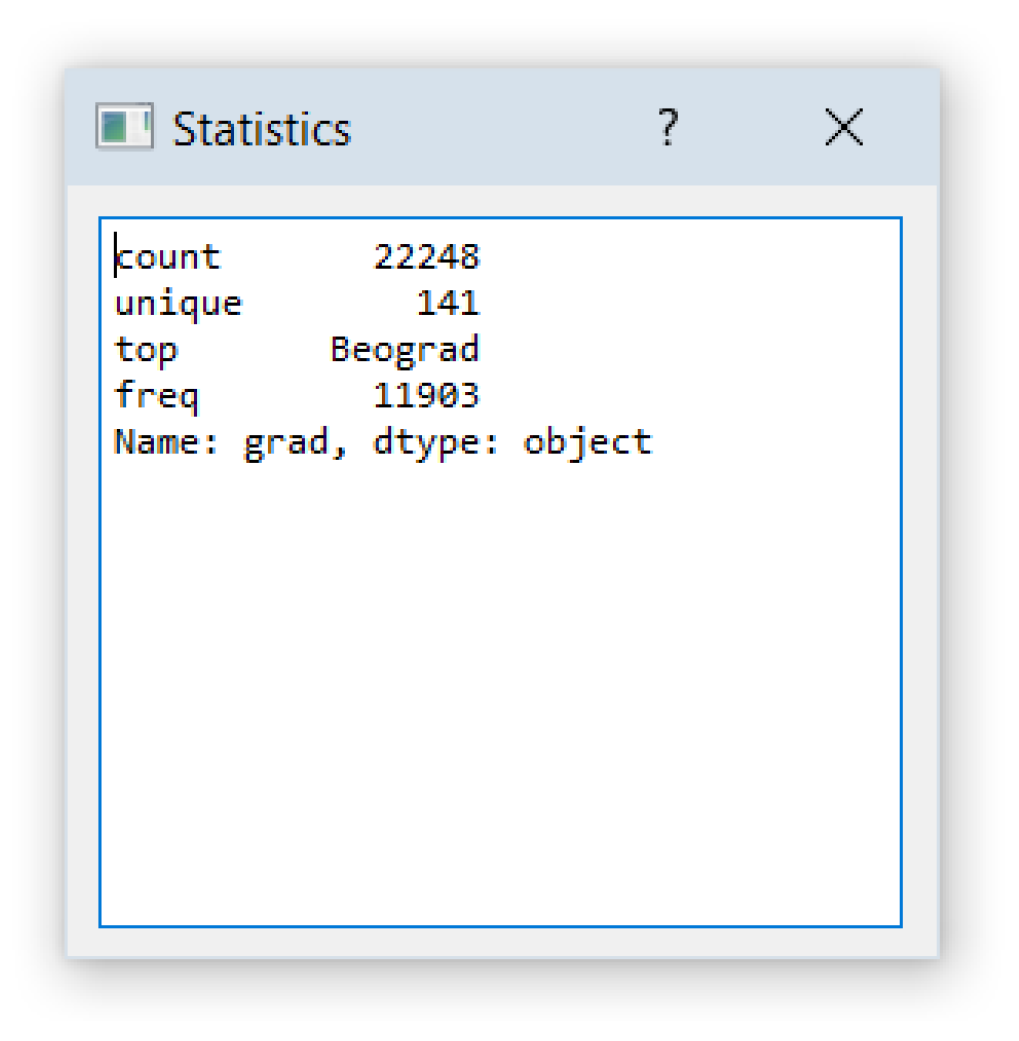
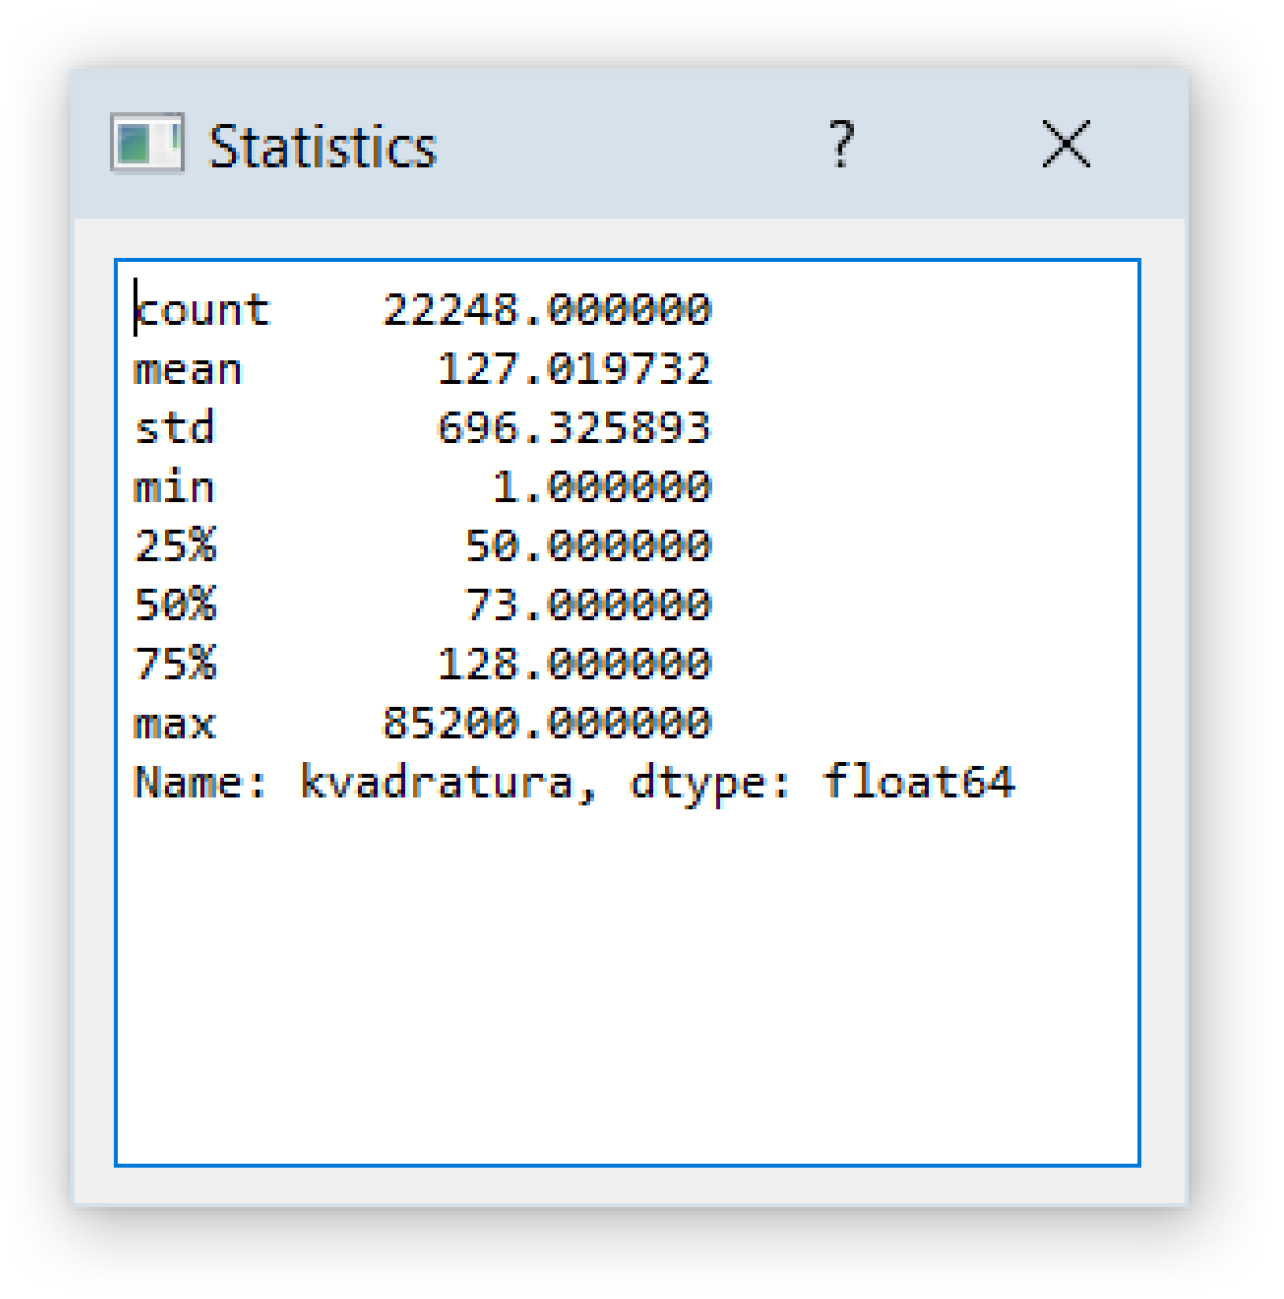
3.2. Analysis of Existing Models

Either from the start screen or after generating the model, the user can examine and analyze some of the existing models. This option can be relevant for users who are just getting familiar with machine learning and are still not sure about the effects of hyperparameter values on the model or simply want to use some of the existing models. When selecting the option by clicking on the button “Load model” on the start screen of the software system, a window opens and loads a file from the local file system.
The last option offered to the user is a prediction of results based on some of the existing models. Prediction windows can be accessed from the start screen by pressing the button “Prediction” or from the window with details of the model by pressing the same button.
After pressing the button, the user is required to punch in the values of all input attributes one by one, based on which prediction would be made. Figure 10 shows the form for filling in one of the attributes. After filling in one attribute, the user can move on to the next attribute by clicking the button “Continue” or go back to the previous attribute by clicking the button “Back”. If the value of some of the attributes is not known, the user can skip that attribute. When making a prediction, the same transformations will be performed for attributes that have not been filled in: the middle value for attributes with numerical values, i.e., category “other” for attributes with categorical values.
After the value of the last attribute has been filled in, the model makes a prediction and shows the result to the user in the new window, as shown in Figure 11. If the user wishes to make a new prediction on the same model, they can do so by clicking the “New prediction” button.

4. Results and Discussion

For teaching purposes, the authors created their own data set from public websites, but also used two publicly available datasets based on empirical real-life data. At the beginning of using the software system, users can choose to create new models or make predictions on existing models. The system needed from a few seconds to a few minutes to train each of these models.
Our dataset was formed by collecting data from several Serbian websites that contain real estate ads: “Halo oglasi”, “Nekretnine.rs” and “4zida”. The parameters based on which this machine learning model has been created and on which the prediction of real estate price has been made are:
  • type of real estate (apartment or house)
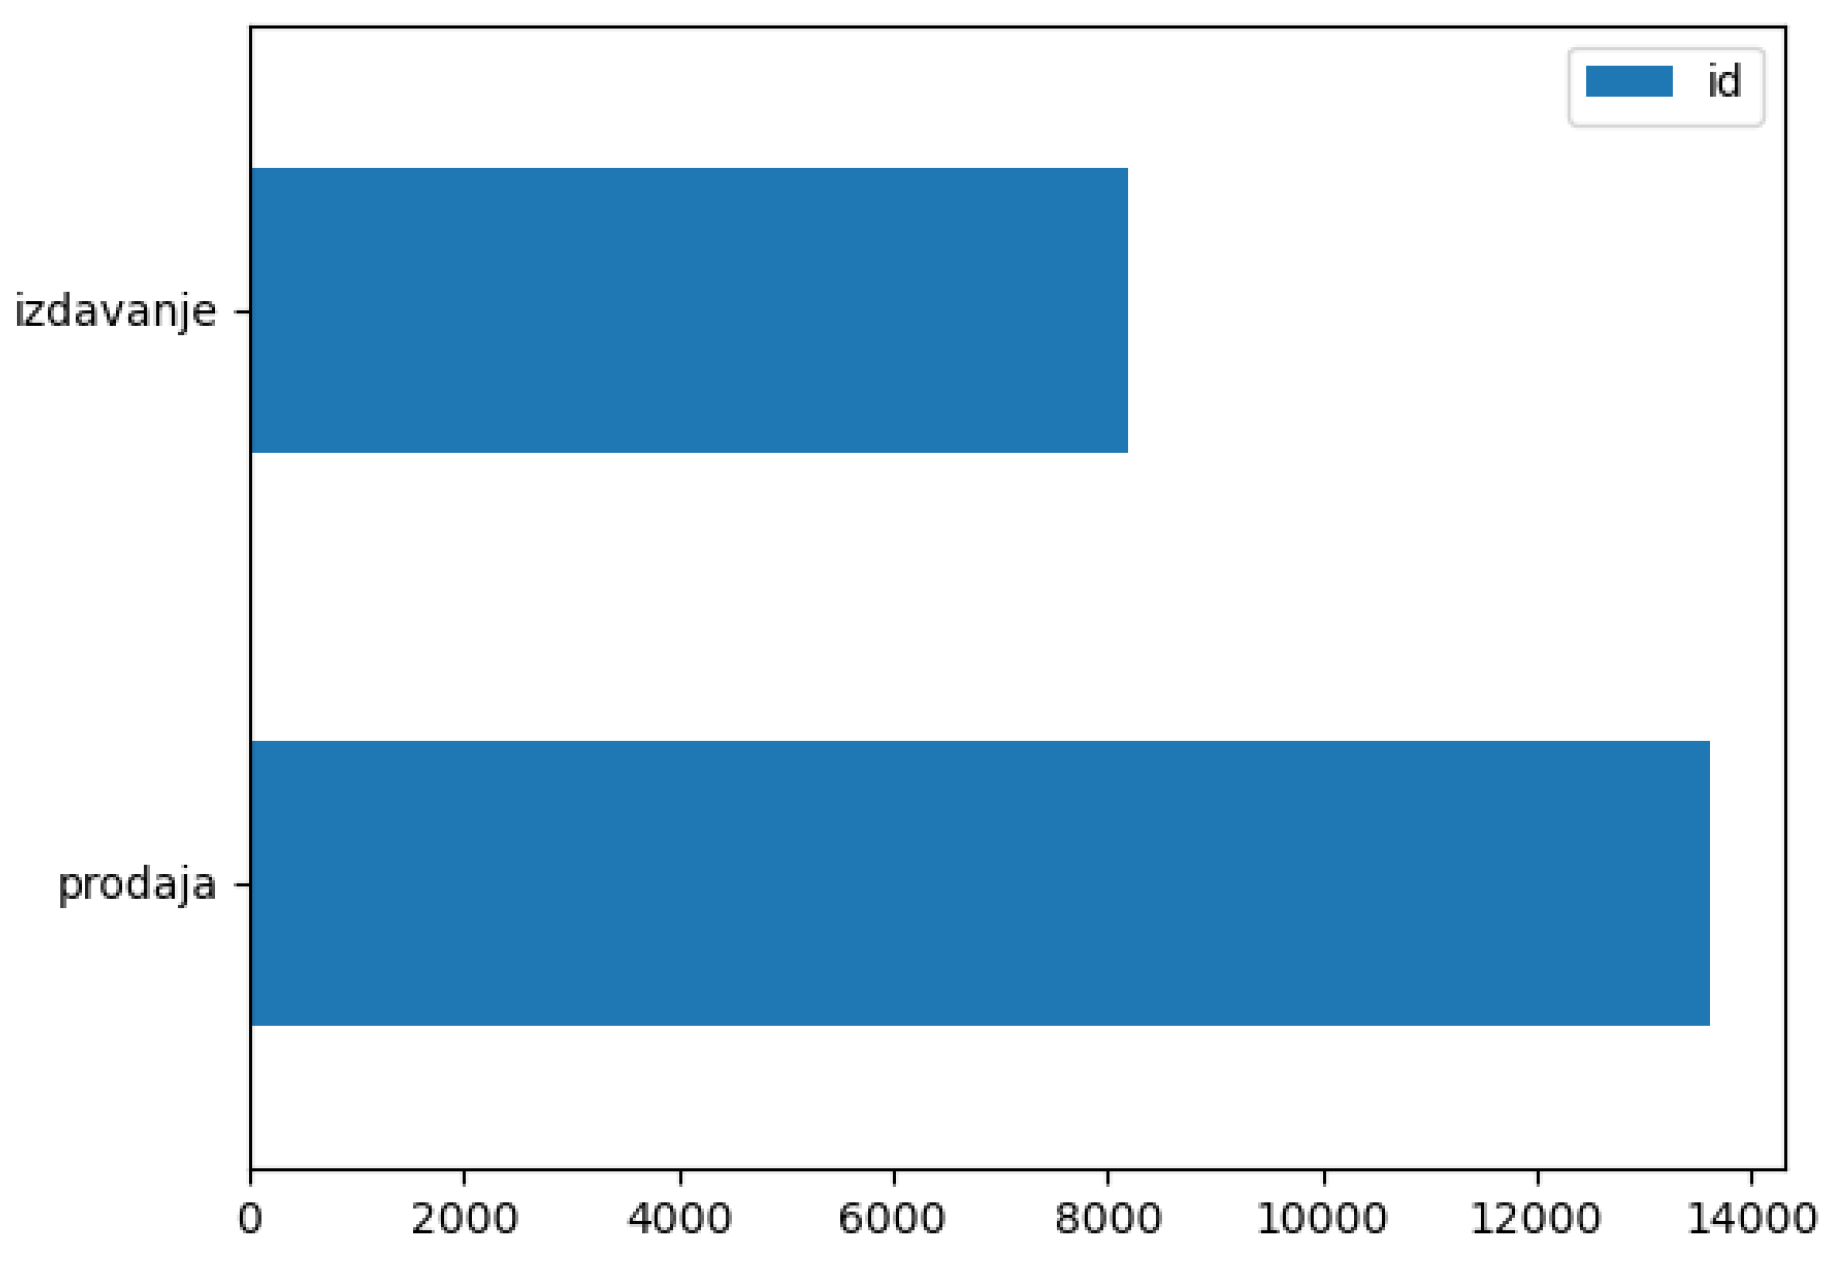
  • type of offer (rent or sale)
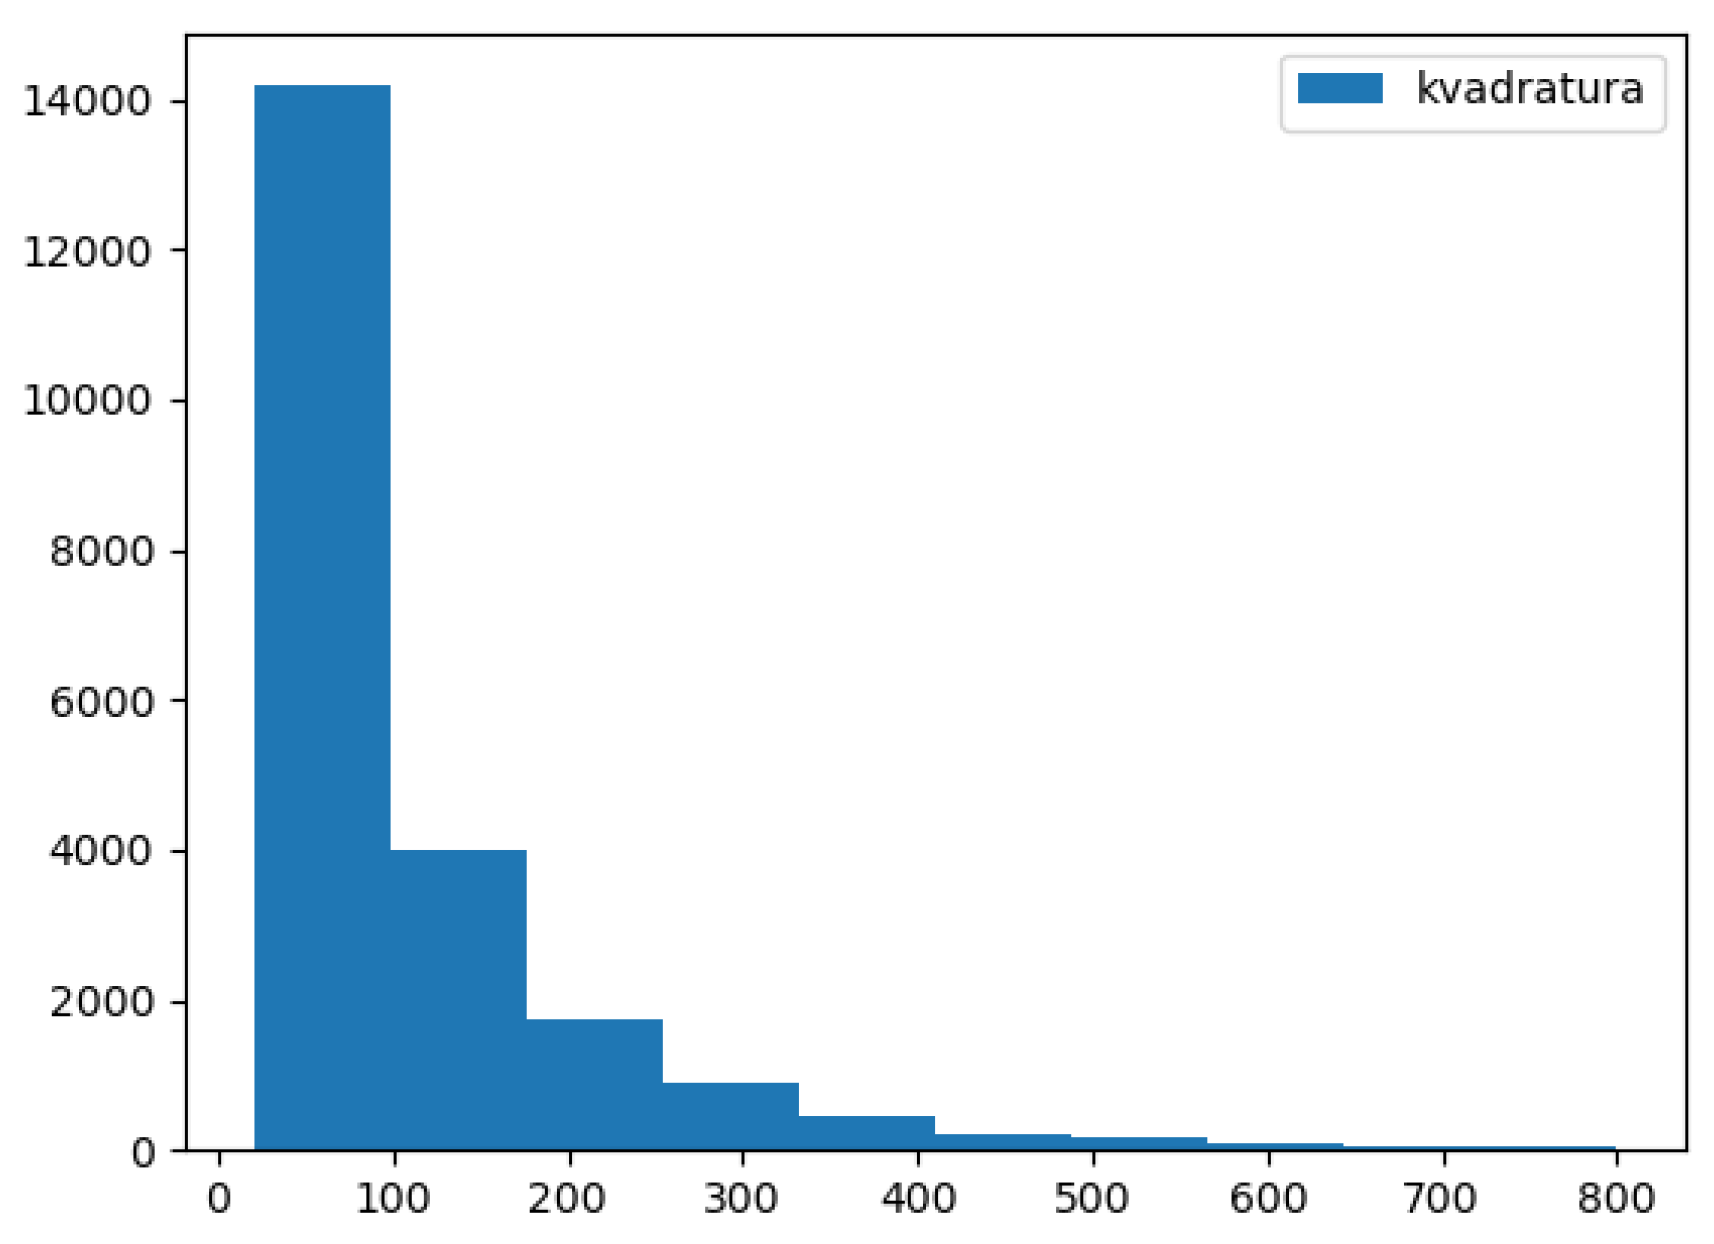
  • size
  • city
  • part of the city
  • floor (basement value is −1 and ground floor value is 0)
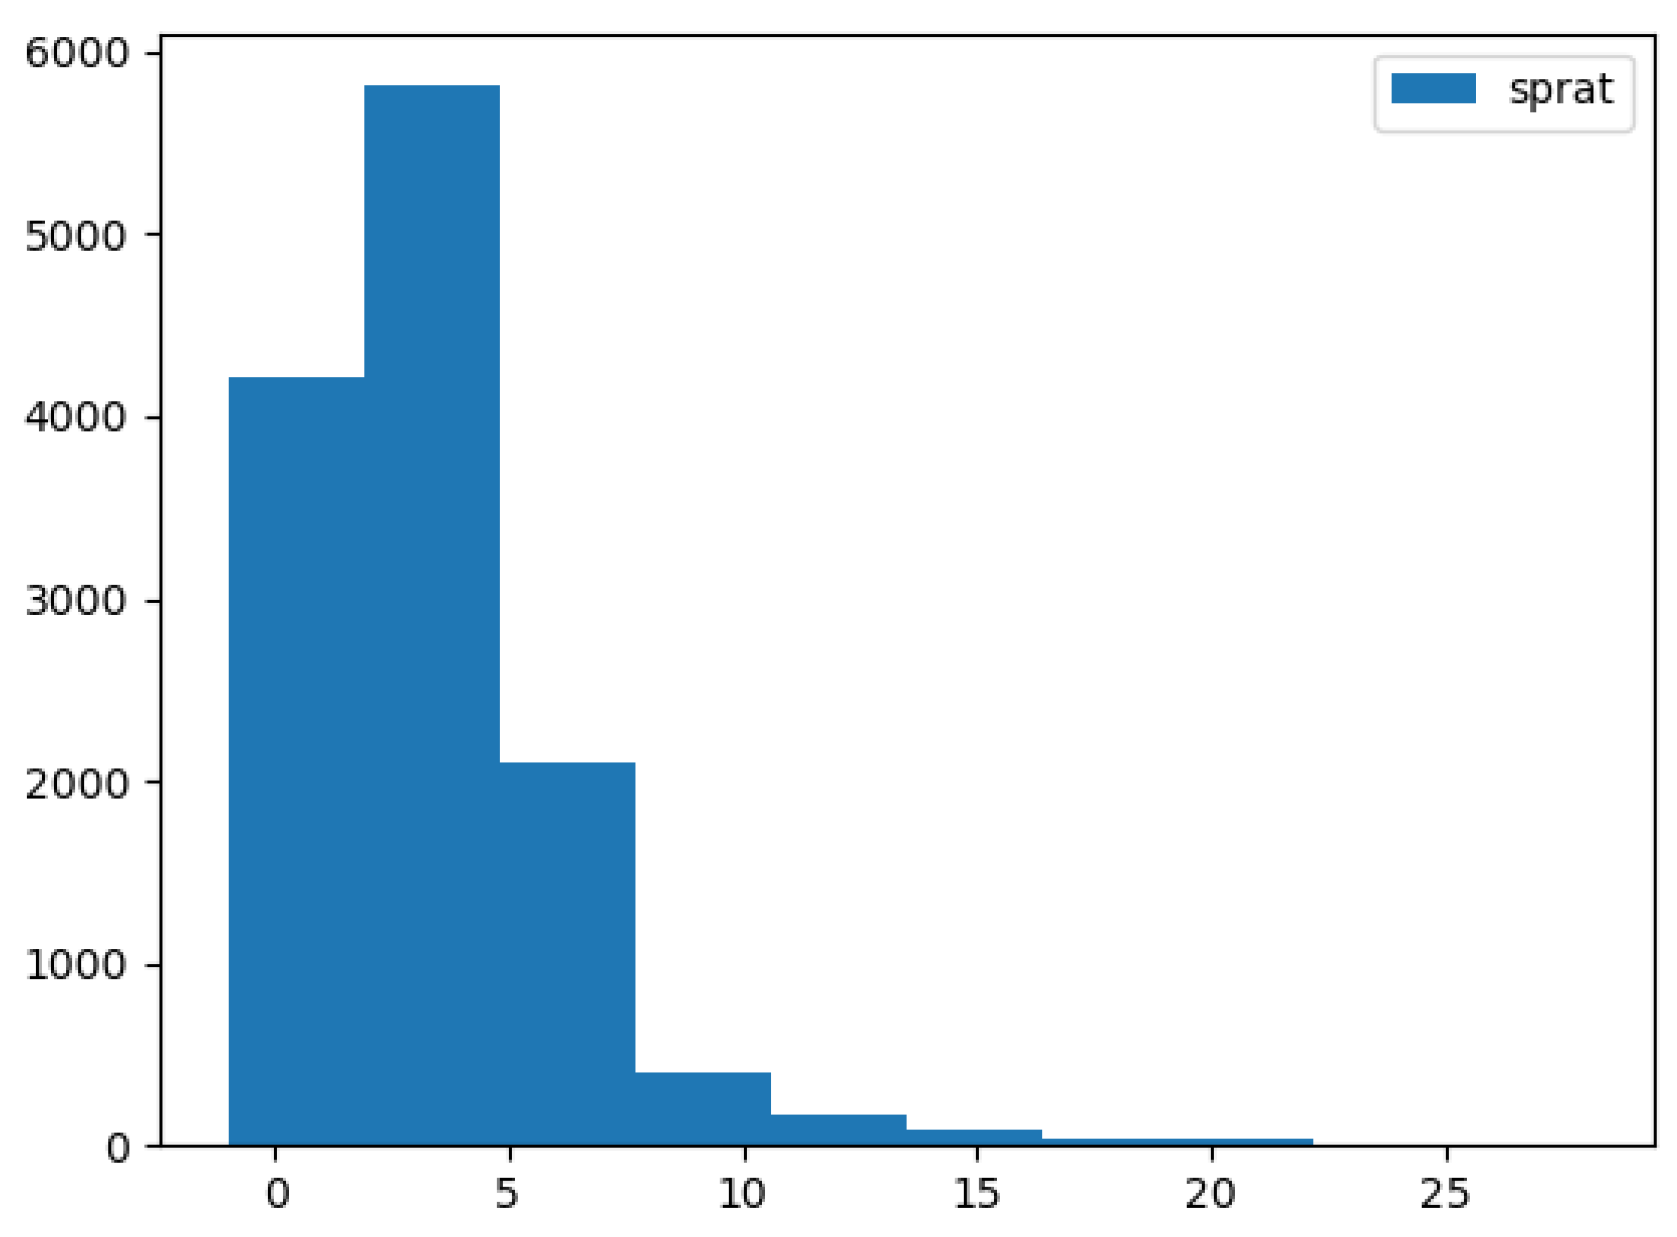
  • number of rooms
  • number of bathrooms
Figure 12 shows the bar graph which compares the number of real estate properties for sale and the number of properties for rent.
Figure 13 already shows the bar chart with the ten most common parts of the city in the dataset.
Figure 14 shows the histogram of the floor on which the property is situated.
Figure 15 shows the histogram of the size of a real estate property in square meters.
Models of learning are realized for each algorithm separately. Table 4 shows the selected values of hyperparameters for the linear regression model.
Table 5 shows selected hyperparameter values for the decision tree model.
Table 6 shows the hyperparameters of the k-nearest neighbor model.
Each of the models is tested on the same dataset. The performances which models have shown are expressed in percentages as algorithm precision. Algorithm precision is calculated as the quotient of the sum of the squared difference of exact and projected values of the output variable and the sum of squared exact and mean values of the output variable subtracted from 1, as shown in Equation (1).
accuracy = 1   ( y exact y projected ) 2   ( y exact y mean ) 2
Table 7 shows the precision accomplished for each of the two created models. What can be concluded is that the nature of the problem is such that the model of linear regression is not suitable, whereas decision tree models and k-nearest neighbor models have given good results.
Of course, the results are far from ideal, taking into account that the dataset represents real data on the offer of real estate properties, and data cleaning would surely take some time.
The authors wanted to encourage students to work with publicly available datasets within the implemented tool. In addition to using the visual simulator on our collected real estate dataset, we have shown that experiments can be performed on other empirical data sets in real life. Two datasets were taken, and all realized algorithms were executed on them. The first dataset [54] contains 200 records and is related to measuring the performance of different processors. The second dataset [55] contains 2000 records and serves to determine the mode of operation of an engine and the fan inside it. In Table 8, a high level of precision can be observed for the three implemented algorithms performed on the described datasets.
The parameters based on which the first machine learning model was created are:
  • vendor name,
  • model name,
  • machine cycle time in nanoseconds,
  • minimum main memory in kilobytes,
  • maximum main memory in kilobytes,
  • cache memory in kilobytes,
  • minimum channels in units,
  • maximum channels in units.
Figure 16 shows the number of occurrences of the ten most occurred vendors in the dataset.
Figure 17 shows the range of performance for a chosen set of vendors. The figure shows a specific graph called a Boxplot. Colored boxes represent ranges of values. Diamond-shaped points represent outliers.
In Figure 18, we can see the correlation matrix for each numerical property. As we can see, there is a high correlation between the output data (property “j”) and other input properties. Figure 19 shows the relationship between the maximum main memory in kilobytes and the output data as a scatter plot.
The dataset of the second model contains measurements of a condition-monitoring demonstrator consisting of an AC induction motor powered by a single-phase AC. The demonstrator allows the configuration of operating conditions. Figure 20 shows that the frequency of each operation mode in the dataset is uniformly distributed.
Figure 21 shows the histogram of one of the 250 acceleration directions and frequencies.
The proliferation of industrial applications of machine learning methods has led to the need to facilitate their implementation and for some form of code standardization. This has led to the development of many applications or libraries that facilitate working with machine learning methods, thanks to which users rarely implement the selected algorithms themselves. Instead, out-of-the-box implementations are used, and users focus on solving and modeling problems at a somewhat more abstract level. The application of the realized visual simulator is also possible in other areas, where there is a need to apply machine learning, such as economics and trading [56], medicine [57], sports and physical activity [58], etc. Also, the development of a modular simulator allowed the addition of new algorithms, without any change to the graphical interface. These are mostly the biggest limitations of this visual simulator, which needs to be expanded with new algorithms, and to introduce the possibility of a comparative analysis of the results of those algorithms, so that it can reach a useful application in the industry.

5. Evaluation

The described software system application was evaluated as part of classes at the School of Electrical Engineering in Belgrade, where the system has been used for the last two school years. In the 2020/21 school year, the teaching reform was carried out in the Intelligent Systems course. The field of machine learning in the number of classes has been increased four times, replacing the less attractive and out-of-date topics of artificial intelligence, and enriching the course with more popular topics. The reform allowed the teachers to explain the overall process of machine learning in more detail and freed up teaching space for incorporating several new algorithms into teaching materials, providing the students with the opportunity to learn linear regression, logistic regression and the method of k-nearest neighbors in addition to decision trees which was, up until then, the only covered algorithm.
In the same year, the form of the final exam was changed by replacing the only machine learning task from the topic decision trees with two tasks that covered the newly added algorithms and methods. In order to better prepare for the final exam, students had at their disposal the described visual simulator as an aid in understanding the concepts of the covered machine learning algorithms along with the Weka tool, which was the only tool used up until the 2019/20 school year.
The student’s success on the machine learning tasks in the final exam of both study programs, Electrical Engineering and Computing (ER) and Software Engineering (SI), before and after the teaching reform, is shown in Table 9. The student’s success is expressed as the average number of achieved points out of a maximum of 100. What can be concluded is that, on average, students achieved better grades in the final exam from the moment the visual simulator was introduced in the course.
In Table 10, which shows the number of students enrolled in the Intelligent Systems course for each school year, an increase in the number of students can be noticed in the years that follow the introduction of the new topics in the field of machine learning and the induction of a visual simulator as a teaching and learning tool.
The complexity and difficulty of using the Weka tool resulted in students spending more time learning the tool itself rather than studying the material for the exam. Consequently, students often gave up on the exam tasks in the field of machine learning or achieved a lower number of exam points than desired. Since the introduction of the visual simulator that was more beginner-friendly, students devoted more time to understanding the machine learning concepts, which resulted in better grades and greater number of participants in the course.

6. Conclusions

Learning new concepts and techniques of artificial intelligence and their application in engineering projects is an important aspect of both formal education through university courses and informal education, where people are recommended to further improve their knowledge through various interactive web content. Web-based teaching and learning in the field of AI are increasingly popular in both domains of education [59]. The majority of educational systems in the world introduce basic terms from the field of artificial intelligence into teaching already in IT education in primary schools [60].
The transition of education in recent years moves theoretical knowledge more towards practical applications of that knowledge and more examples presented by teachers. By introducing modern digital technologies into teaching and by developing intuitive specialized software tools, which simulate and often visualize very complex concepts and algorithms, we get interactive learning environments that make it easier for students to acquire knowledge [61].
The purpose of this paper was to analyze machine learning courses and tools used in teaching among some of the best universities in the world and propose and develop a new software system that would be used in machine learning introductory academic courses. Previous sections provided a brief introduction to the concept of machine learning and its significance. The research included detailed information on the syllabi and tools used in courses. This resulted in a detailed analysis of the tools most commonly used in lessons and their advantages and disadvantages. The final part of the work was the proposal on how to implement the software solution, which would incorporate the advantages of all previously analyzed tools and help students without programming knowledge to learn machine learning concepts. The design of the developed software tool is modular, so new algorithms can be added very easily. This allows other researchers to use this tool as well.

Author Contributions

Conceptualization, A.M. and D.D.; methodology, B.N.; software, A.M.; validation, A.M., D.D. and B.N.; related work, A.M. and B.N.; resources, D.D.; data preprocessing, A.M. and D.D.; writing—original draft preparation, A.M., D.D. and B.N.; visualization, A.M.; project administration, B.N. All authors have read and agreed to the published version of the manuscript.

Funding

This research was supported by the Science Fund of the Republic of Serbia, grant no. 6526093, AI-AVANTES (http://fondzanauku.gov.rs/).

Institutional Review Board Statement

Not applicable.

Informed Consent Statement

Not applicable.

Data Availability Statement

The collected dataset is available at: http://home.etf.rs/~draskovic/datasets/realestates21.sql.

Conflicts of Interest

The authors declare no conflict of interest.

References

  1. Russell, S.; Norvig, P. Artificial Intelligence: A Modern Approach, 4th ed.; Pearson: London, UK, 2020. [Google Scholar]
  2. Janičić, P.; Nikolić, M. Artificial Intelligence (Book in Serbian), 1st ed.; University of Belgrade: Belgrade, Serbia, 2021. [Google Scholar]
  3. Chen, L.; Chen, P.; Lin, Z. Artificial Intelligence in Education: A Review. IEEE Access 2020, 8, 75264–75278. [Google Scholar] [CrossRef]
  4. Smola, A.; Vishwanathan, S.V.N. Introduction to Machine Learning; Cambridge University: Cambridge, UK, 2008; Volume 32, No. 34. [Google Scholar]
  5. ACM Computing Curricula Task Force (Ed.) Computer Science Curricula 2013: Curriculum Guidelines for Undergraduate Degree Programs in Computer Science; ACM Inc.: New York, NY, USA, 2013. [Google Scholar] [CrossRef] [Green Version]
  6. Hawkins, D.M. The Problem of Overfitting. J. Chem. Inf. Comput. Sci. 2004, 44, 1–12. [Google Scholar] [CrossRef]
  7. Qi, S.; Liu, L.; Kumar, B.S.; Prathik, A. An English Teaching Quality Evaluation Model Based on Gaussian Process Machine Learning. Expert Syst. 2021, 39, e12861. [Google Scholar] [CrossRef]
  8. Fang, L.; Tuan, L.A.; Hui, S.C.; Wu, L. Personalized Question Recommendation for English Grammar Learning. Expert Syst. 2018, 35, e12244. [Google Scholar] [CrossRef]
  9. Yoon, D.-M.; Kim, K.-J. Challenges and Opportunities in Game Artificial Intelligence Education Using Angry Birds. IEEE Access 2015, 3, 793–804. [Google Scholar] [CrossRef]
  10. Nykan, M.; Bissonette, V.; Yilmaz, R.; Ledwos, N.; Winkler-Schwartz, A.; Del Maestro, R.F. The Virtual Operative Assistant: An Explainable Artificial Intelligence Tool for Simulation-Based Training in Surgery and Medicine. PLoS ONE 2020, 15, e0229596. [Google Scholar] [CrossRef]
  11. Chen, Y.; De Luca, G. Technologies Supporting Artificial Intelligence and Robotics Application Development. J. Artif. Intell. Technol. 2021, 1, 1–8. [Google Scholar] [CrossRef]
  12. Jiang, L. Virtual Reality Action Interactive Teaching Artificial Intelligence Education System. Complexity 2021, 2021, 5553211. [Google Scholar] [CrossRef]
  13. Çağlayan, C. Comparison of the Code-Based or Tool-Based Teaching of the Machine Learning Algorithm for the First-Time Learners. Int. Inform. Softw. Eng. Conf. 2019, 1, 1–3. [Google Scholar] [CrossRef]
  14. Langley, P. An Integrative Framework for Artificial Intelligence Education. Proc. AAAI Conf. Artif. Intell. 2019, 33, 9670–9677. [Google Scholar] [CrossRef] [Green Version]
  15. Djordjevic, J.; Nikolic, B.; Borozan, T.; Milenković, A. CAL2: Computer Aided Learning in Computer Architecture Laboratory. Comput. Appl. Eng. Educ. 2008, 16, 172–188. [Google Scholar] [CrossRef] [Green Version]
  16. Draskovic, D.; Batanovic, V.; Nikolic, B. Software system for expert systems learning. Telecommun. Forum TELFOR 2010, 11, 1129–1132. [Google Scholar]
  17. Draskovic, D.; Nikolic, B. Software System for Expert Systems Learning. In Proceedings of the Africon 2013, Pointe aux Piments, Mauritius, 9–12 September 2013; pp. 1–6. [Google Scholar] [CrossRef]
  18. Tubić, S.; Cvetanović, M.; Radivojević, Z.; Stojanović, S. Annotated Functional Decomposition. Comput. Appl. Eng. Educ. 2021, 29, 1390–1402. [Google Scholar] [CrossRef]
  19. Cvetanovic, M.; Radivojevic, Z.; Blagojevic, V.; Bojovic, M. ADVICE—Educational System for Teaching Database Courses. IEEE Trans. Educ. 2011, 54, 398–409. [Google Scholar] [CrossRef]
  20. Radivojević, Z.; Cvetanović, M.; Jovanović, Z. Reengineering the SLEEP Simulator in a Concurrent and Distributed Programming Course. Comput. Appl. Eng. Educ. 2014, 22, 39–51. [Google Scholar] [CrossRef]
  21. Draskovic, D.; Cvetanovic, M.; Nikolic, B. SAIL—Software System for Learning AI Algorithms. Comput. Appl. Eng. Educ. 2018, 26, 1195–1216. [Google Scholar] [CrossRef]
  22. Batanović, V.; Cvetanović, M.; Nikolić, B. A Versatile Framework for Resource-Limited Sentiment Articulation, Annotation, and Analysis of Short Texts. PLoS ONE 2020, 15, e0242050. [Google Scholar] [CrossRef]
  23. Shanghai Ranking’s Academic Ranking of World Universities. 2020. Available online: https://www.shanghairanking.com/rankings/arwu/2020 (accessed on 14 December 2021).
  24. Times Higher Education World University Rankings. 2020. Available online: https://www.timeshighereducation.com/world-university-rankings/2020/world-ranking (accessed on 17 December 2021).
  25. QS World University Rankings. 2020. Available online: https://www.topuniversities.com/university-rankings/world-university-rankings/2020 (accessed on 20 December 2021).
  26. Association for Computing Machinery (ACM); IEEE Computer Society (IEEE-CS). Computer Engineering Curricula 2016—Curriculum Guidelines for Undergraduate Degree Programs in Computer Engineering. December 2016. Available online: https://ieeecs-media.computer.org/assets/pdf/ce2016-final-report.pdf (accessed on 1 November 2021).
  27. Association for Computing Machinery (ACM); IEEE Computer Society (IEEE-CS). Information Technology Curricula 2017–Curriculum Guidelines for Baccalaureate Degree Programs in Information Technology. December 2017. Available online: https://www.acm.org/binaries/content/assets/education/curricula-recommendations/it2017.pdf (accessed on 5 November 2021).
  28. Holmes, G.; Donkin, A.; Witten, I.H. WEKA: A Machine Learning Workbench. In Proceedings of the ANZIIS ’94-Australian New Zealnd Intelligent Information Systems Conference, Brisbane, QLD, Australia, 29 November–2 December 1994; pp. 357–361. [Google Scholar] [CrossRef] [Green Version]
  29. Nguyen, A.T.; Lease, M.; Wallace, B.C. Mash: Software Tools for Developing Interactive and Transparent Machine Learning Systems. In Proceedings of the ACM IUI 2019 Workshops (IUI Workshops’ 19), Los Angeles, CA, USA, 16–20 March 2019. 7p. [Google Scholar]
  30. Knoll, B.; Kisynski, J.; Carenini, G.; Conati, C.; Mackworth, A.; Poole, D. AIspace: Interactive Tools for Learning Artificial Intelligence. In Proceedings of the AAAI 2008 AI Education Workshop, Chicago, IL, USA, 13–17 July 2008. [Google Scholar]
  31. Decision Trees. Available online: http://aispace.org/dTree/index.shtml (accessed on 4 May 2022).
  32. Derrac, J.; Luengo, J.; Alcalá-Fdez, J.; Fernández, A.; García, S.; Hilario, A.F. Using KEEL Software as a Educational Tool: A Case of Study Teaching Data Mining. In Proceedings of the 7th International Conference on Next Generation Web Services Practices, Salamanca, Spain, 19–21 October 2011; pp. 464–469. [Google Scholar] [CrossRef]
  33. Eibe, F.; Hall, M.; Trig, L.; Holmes, G.; Witten, I.H. Data Mining in Bioinformatics Using Weka. Bioinformatics 2004, 20, 2479–2481. [Google Scholar]
  34. Thornton, C.; Hutter, F.; Hoos, H.H.; Leyton-Brown, K. Auto-WEKA: Combined Selection and Hyperparameter Optimization of Classification Algorithms. In Proceedings of the 19th ACM SIGKDD International Conference on Knowledge Discovery and Data Mining, Chicago, IL, USA, 11–14 August 2013; pp. 847–855. [Google Scholar] [CrossRef]
  35. Kalmegh, S. Analysis of WEKA Data Mining Algorithm REPTree, Simple Cart and RandomTree for Classification of Indian News. Int. J. Innov. Sci. Eng. Technol. 2015, 2, 438–446. [Google Scholar]
  36. Mate, A.; De Gregorio, E.; Camara, J.; Trujillo, J.; Lujan-Mora, S. The Improvement of Analytics in Massive Open Online Courses by Applying Data Mining Techniques. Expert Syst. 2015, 33, 374–382. [Google Scholar] [CrossRef]
  37. Sneiders, E.; Sjöbergh, J.; Alfalahi, A. Automated Email Answering by Text-Pattern Matching: Performance and Error Analysis. Expert Syst. 2018, 35, e12251. [Google Scholar] [CrossRef]
  38. Chen, T.; Cheng, H.; Chen, Y. Developing a Personal Value Analysis Method of Social Media to Support Customer Segmentation and Business Model Innovation. Expert Syst. 2019, 36, e12374. [Google Scholar] [CrossRef]
  39. Alcalá-Fdez, J.; Sánchez, L.; García, S.; del Jesus, M.J.; Ventura, S.; Garrell, J.M.; Otero, J.; Romero, C.; Bacardit, J.; Rivas, V.M.; et al. KEEL: A Software Tool to Assess Evolutionary Algorithms for Data Mining Problems. Soft Comput. 2019, 13, 307–318. [Google Scholar] [CrossRef]
  40. Lasota, T.; Mazurkiewicz, J.; Trawinski, B.; Trawinski, K. Investigation of Fuzzy Models for the Valuation of Residential Premises Using the KEEL Tool. In Proceedings of the 2008 Eighth International Conference on Hybrid Intelligent Systems, Barcelona, Spain, 10–12 September 2008; pp. 258–263. [Google Scholar] [CrossRef]
  41. Lasota, T.; Mazurkiewicz, J.; Trawiński, B.; Trawiński, K. Comparison of Data Driven Models for the Valuation of Residential Premises Using KEEL. Int. J. Hybrid Intell. Syst. 2010, 7, 3–16. [Google Scholar] [CrossRef] [Green Version]
  42. Alcalá-Fdez, J. Keel data-mining software tool: Data set repository, integration of algorithms and experimental analysis framework. J. Mult. Valued Log. Soft Comput. 2011, 17, 255–287. [Google Scholar]
  43. Triguero, I.; González, S.; Moyano, J.M.; López, S.G.; Fernández, J.A.; Martín, J.L.; Fernández Hilario, A.L.; Jesús Díaz, M.J.; Sánchez, L.; Triguero, F.H. KEEL 3.0: An Open Source Software for Multi-Stage Analysis in Data Mining. Int. J. Comput. Intell. Syst. 2017, 10, 1238–1249. [Google Scholar] [CrossRef] [Green Version]
  44. Upadhyay, K.; Kaur, P.; Kumar Verma, D. Evaluating the Performance of Data Level Methods Using KEEL Tool to Address Class Imbalance Problem. Arab. J. Sci. Eng. 2022, 47, 9741–9754. [Google Scholar] [CrossRef]
  45. Singh, A.P.; Gupta, C.; Singh, R.; Singh, N. A Comparative Analysis of Evolutionary Algorithms for Data Classification Using KEEL Tool. Int. J. Swarm Intell. Res. (IJSIR) 2021, 12, 17–28. [Google Scholar] [CrossRef]
  46. Graczyk, M.; Lasota, T.; Trawiński, B. Comparative Analysis of Premises Valuation Models Using KEEL, RapidMiner, and WEKA. Computational Collective Intelligence. Semantic Web, Social Networks and Multiagent Systems. In Proceedings of the First International Conference, ICCCI 2009, Wroclaw, Poland, 5–7 October 2009; Springer: Berlin/Heidelberg, Germany, 2020; pp. 800–812. [Google Scholar] [CrossRef]
  47. Zhou, C.; Kuang, D.; Liu, J.; Yang, H.; Zhang, Z.; Mackworth, A.; Poole, D. AISpace2: An Interactive Visualization Tool for Learning and Teaching Artificial Intelligence. Proc. AAAI Conf. Artif. Intell. 2020, 34, 13436–13443. [Google Scholar] [CrossRef]
  48. Jones, B.; Sall, J. JMP statistical discovery software. WIREs Comput. Stat. 2021, 3, 188–194. [Google Scholar] [CrossRef]
  49. Chen, M.; Chen, C. Develop JMP 16 Based STEAMS and Six Sigma DMAIC Training Curriculum for Data Scientist. In Proceedings of the International Conference on Industrial Engineering and Operations Management, Rome, Italy, 2–5 August 2021. [Google Scholar]
  50. Abousalh-Neto, N.; Guan, M.; Hummel, R. Better together: Extending JMP with open-source software. ISI’s J. Rapid Dissem. Stat. Res. 2020, 10, e336. [Google Scholar] [CrossRef]
  51. Yu, C.H.; Lee, H.S.; Gan, S.; Brown, E. Nonlinear modeling with big data in SAS and JMP. In Proceedings of the Western Users of SAS Software Conference, Long Beach, CA, USA, 20–22 September 2017; pp. 1–12. [Google Scholar]
  52. Computer Engineering Undergraduate Program, School of Electrical Engineering, University of Belgrade. Available online: https://www.etf.bg.ac.rs/en/studies/bachelor-studies/electrical-and-computer-engineering/2013/computer-engineering-and-information-theory (accessed on 15 May 2022).
  53. Software Engineering Undergraduate Program, School of Electrical Engineering, University of Belgrade. Available online: https://www.etf.bg.ac.rs/en/studies/basic-academic-studies-bachelor-studies/software-engineering (accessed on 15 May 2022).
  54. Dataset for Measuring Processor Performance. Available online: https://data.world/uci/computer-hardware/workspace/file?filename=machine.names.txt (accessed on 30 November 2022).
  55. Dataset for Condition Monitoring. Available online: https://www.kaggle.com/datasets/stephanmatzka/condition-monitoring-dataset-ai4i-2021 (accessed on 1 December 2022).
  56. Radojičić, D.; Radojičić, N.; Kredatus, S. A multicriteria optimization approach for the stock market feature selection. Comput. Sci. Inf. Syst. 2021, 18, 749–769. [Google Scholar] [CrossRef]
  57. Battineni, G.; Chintalapudi, N.; Amenta, F. Machine learning in medicine: Performance calculation of dementia prediction by support vector machines (SVM). Inform. Med. Unlocked 2019, 16, 100200. [Google Scholar] [CrossRef]
  58. Guo, J.; Yang, L.; Bie, R.; Yu, J.; Gao, Y.; Shen, Y.; Kos, A. An XGBoost-based physical fitness evaluation model using advanced feature selection and Bayesian hyper-parameter optimization for wearable running monitoring. Comput. Netw. 2019, 151, 166–180. [Google Scholar] [CrossRef]
  59. Devedžić, V. Web Intelligence and Artificial Intelligence in Education. J. Educ. Technol. Soc. 2004, 7, 29–39. [Google Scholar]
  60. Wong, G.K.W.; Ma, X.; Dillenbourg, P.; Huan, J. Broadening Artificial Intelligence Education in K-12: Where to Start? ACM Inroads 2020, 11, 20–29. [Google Scholar] [CrossRef] [Green Version]
  61. Roll, I.; Wylie, R. Evolution and Revolution in Artificial Intelligence in Education. Int. J. Artif. Intell. Educ. 2016, 26, 582–599. [Google Scholar] [CrossRef]
Figure 1. The start screen of the software system.
Applsci 12 12974 g001
Figure 2. Form for loading datasets and choosing relevant attributes.
Applsci 12 12974 g002
Figure 3. Statistical information on categorical attribute values.
Applsci 12 12974 g003
Figure 4. Statistical information on numerical attribute values.
Applsci 12 12974 g004
Figure 5. Graph showing the frequency of the ten most common categorical attribute values.
Applsci 12 12974 g005
Figure 6. Histogram of numerical attribute values.
Applsci 12 12974 g006
Figure 7. Form for selection of hyperparameters of linear regression algorithms.
Applsci 12 12974 g007
Figure 8. Model details.
Applsci 12 12974 g008
Figure 9. Decision tree obtained after model training.
Applsci 12 12974 g009
Figure 10. Window for filling in attribute value for prediction and proceeding to the next value.
Applsci 12 12974 g010
Figure 11. Window with prediction result.
Applsci 12 12974 g011
Figure 12. Bar graph and type of offer.
Applsci 12 12974 g012
Figure 13. Bar graph with the ten most common parts of the city.
Applsci 12 12974 g013
Figure 14. Floor histogram.
Applsci 12 12974 g014
Figure 15. Size histogram.
Applsci 12 12974 g015
Figure 16. Vendor occurrences.
Applsci 12 12974 g016
Figure 17. Range of CPU performance for each vendor.
Applsci 12 12974 g017
Figure 18. CPU characteristics correlation matrix.
Applsci 12 12974 g018
Figure 19. Dependence of CPU performance on maximum main memory.
Applsci 12 12974 g019
Figure 20. Frequencies of operation modes.
Applsci 12 12974 g020
Figure 21. Histogram of xAcc010 Hz.
Applsci 12 12974 g021
Table 1. Analysis of covered topics in machine learning courses worldwide.
Course TitleUniversityMachine Learning TasksInductive LearningSimple Machine Learning AlgorithmsOver-Fitting ProblemMeasurement ErrorBelonging Group
Introduction to Machine LearningHarvard University+++++First group
Machine LearningHarvard University ++Second group
Machine LearningStanford University+++++First group
Applied Machine LearningStanford University ++++Second group
Introduction to Machine LearningMassachusetts Institute of Technology+++++First group
Introduction to Machine LearningUniversity of California, Berkeley+++++First group
Machine LearningPrinceton University+++++First group
Machine LearningColumbia University+++++First group
Machine Learning & Data MiningCalifornia Institute of Technology+++++First group
Machine LearningUniversity of Oxford+ +++First group
Machine Learning and Predictive AnalyticsUniversity of Chicago+++++First group
Advanced Machine Learning and Artificial IntelligenceUniversity of Chicago ++Second group
Statistical Data MiningCornell University ++Third group
Machine Learning for Intelligent SystemsCornell University ++++First group
Machine Learning for Data ScienceCornell University ++Second group
Machine Learning AlgorithmsUniversity of California, Los Angeles+++++First group
Introduction to Machine LearningJohns Hopkins University+++++First group
Foundations of Machine Learning and Data ScienceUniversity College London+++++First group
Introduction to Machine LearningUniversity of Washington+++++First group
Data analytics using PythonUniversity of California, San Diego + +Third group
Machine learning fundamentalsUniversity of California, San Diego+ + +First group
Introduction to Machine LearningUniversity of Pennsylvania+++++First group
Machine LearningUniversity of Pennsylvania ++++Second group
Introduction to Artificial IntelligenceUniversity of British Columbia++ Third group
Introduction to Data MiningUniversity of Texas at Austin+ + Third group
Sistemas Inteligentes para la Gestión de la EmpresaUniversity of Granada +Third group
Data Mining with WekaUniversity of Waikato ++++Third group
Introduction to Machine LearningEcole Polytechnique Federale de Lausanne+++++First group
Machine LearningEcole Polytechnique Federale de Lausanne+++++First group
Machine Learning: Methods and ToolsTechnical University of Munich+++++First group
Machine LearningWageningen University & Research+++++First group
Machine learning for data scienceUniversity of Ljubljana+++++First group
Machine Learning 1University of Zagreb+++++First group
Table 2. Analysis of the structure of machine learning courses at universities in the world.
Course TitleLevel of StudyUniversityLab.
Exercises
Tool or Technology for LabProjectTool or Technology for ProjectDeveloped Own Tool
Introduction to Machine LearningbachelorHarvard University+Python+Python
Machine LearningmasterHarvard University+Python+Python
Machine LearningbachelorStanford University +Python
Applied Machine LearningbachelorStanford University +Python
Introduction to Machine LearningbachelorMassachusetts Institute of Technology +Python
Introduction to Machine LearningbachelorUniversity of California, Berkeley +Python
Machine LearningbachelorPrinceton University +Python
Machine LearningbachelorColumbia University +MATLAB, Python
Machine Learning & Data MiningbachelorCalifornia Institute of Technology +Python
Machine LearningbachelorUniversity of Oxford +Lua, Python
Machine Learning and Predictive AnalyticsmasterUniversity of Chicago +R, Python
Advanced Machine Learning and Artificial IntelligencemasterUniversity of Chicago +Python
Statistical Data MiningbachelorCornell University+R+R
Machine Learning for Intelligent SystemsbachelorCornell University +Python
Machine Learning for Data SciencebachelorCornell University +R, Python, Java
Machine Learning AlgorithmsmasterUniversity of California, Los Angeles +Python
Introduction to Machine LearningmasterJohns Hopkins University+Python, FastDT+Python, Java, C#
Foundations of Machine Learning and Data SciencemasterUniversity College London+Python+Seminar paper in Latex text editor
Introduction to Machine LearningbachelorUniversity of Washington +Python
Machine LearningmasterUniversity of Washington +Python
Data Analytics using PythonbachelorUniversity of California, San Diego +Python
Machine Learning FundamentalsbachelorUniversity of California, San Diego +Python
Introduction to Machine LearningbachelorUniversity of Pennsylvania+Weka+Python
Machine LearningmasterUniversity of Pennsylvania +Python
Introduction to Artificial IntelligencebachelorUniversity of British Columbia+Decision Trees
[14]
+Seminar paper in Latex text editor+
Introduction to Data MiningbachelorUniversity of Texas at Austin+Python, Mash [12]+Darwin+
Sistemas Inteligentes para la Gestión de la EmpresamasterUniversity of Granada+Keel, Weka+R+
Data Mining with WekamasterUniversity of Waikato+Weka+Weka+
Introduction to Machine LearningbachelorEcole Polytechnique Federale de Lausanne +Python
Machine LearningmasterEcole Polytechnique Federale de Lausanne +Python
Machine Learning: Methods and ToolsmasterTechnical University of Munich+Python
Machine LearningmasterWageningen University & Research+Python+Python
Machine learning for data sciencemasterUniversity of Ljubljana +Python
Machine Learning 1masterUniversity of Zagreb+Python
Table 3. Analysis of the existing tools and their characteristics.
Tool NameSimplicity of User InterfaceInclusion of Selected AlgorithmsOpen Source SoftwareGood Control of Algorithm ExecutionCovered Topics
Weka2Linear regression, Decision trees, k-nearest neighborsyes3Data preprocessing,
Classification, Regression, Clustering
Keel3Linear regression,
Decision trees,
k-nearest neighbors
yes3Data preprocessing,
Classification, Regression, Clustering
JMP2Linear regression,
Decision trees,
k-nearest neighbors
no2Data preprocessing,
Classification, Regression, Clustering
Decision Trees5Decision treesyes4Classification-Decision trees
Table 4. Hyperparameters of the linear regression model.
Model NameLinear Regression Model
Size of the training set20,717
Size of the testing set1090
Data mixed before divisionno
Standardized datayes
Optimization SGDyes
Maximum number of iterations1000
Stopping criterion0.001
L1 regularizationno
L2 regularizationyes
Table 5. Hyperparameters of the decision tree model.
Model NameDecision Tree Model
Size of the training set20,717
Size of the testing set1090
Data mixed before divisionNo
Standardized dataYes
Selection of division attributesGreatest gain
Division functionMean square error
Table 6. Hyperparameters of the k-nearest neighbor model.
Model NameK-Nearest Neighbor Model
Size of the training set20,717
Size of the testing set1090
Data mixed before divisionNo
Standardized dataYes
K value81
MetricsEuclidean
Table 7. Model performance for our real estate dataset.
Model NamePrecision
Decision tree model0.81
k-nearest neighbor model0.79
Table 8. Model performance for two other experiments.
Model NamePrecision for
the First Dataset
Precision for
the Second Dataset
Linear regression0.940.88
Decision tree model0.980.91
k-nearest neighbor model0.960.95
Table 9. Students’ success in the final exam.
School Year2018/192019/202020/212021/22
ER-average points57.476.2592.591.6
SI-average points64.180.080.888.33
Table 10. Number of students enrolled in the Intelligent Systems course.
School Year2018/192019/202020/212021/222022/23
Number of enrolled students129122143148175
Publisher’s Note: MDPI stays neutral with regard to jurisdictional claims in published maps and institutional affiliations.

