Article

Development of Electrochemical Biosensor Platforms for Determination of Environmental Viral Structures

by
Rümeysa Ekici
1,*,
Betül Bozdoğan
2 and
Emir Baki Denkbaş
1
1
Faculty of Engineering, Biomedical Engineering Department, Baskent University, Ankara 06790, Turkey
2
Faculty of Science, Chemistry Department, Aksaray University, Aksaray 68100, Turkey
*
Author to whom correspondence should be addressed.
Appl. Sci. 2022, 12(24), 12971; https://doi.org/10.3390/app122412971
Submission received: 3 August 2022 / Revised: 28 November 2022 / Accepted: 15 December 2022 / Published: 17 December 2022
(This article belongs to the Special Issue Nanomaterials to Monitor and Improve Environmental Quality)

Abstract

:
Infectious diseases caused by viruses (such as influenza, Zika, human immunodeficiency, Ebola, dengue, hepatitis, and COVID-19 virus) are diseases that have been on the agenda of the whole world for the last quarter of a century and have become one of the most important problems for people. Urgent identification of the people infected with a disease will allow these people who have contracted the disease to be treated effectively. In this context, the polymerase-chain-reaction (PCR)-based methods have been the most common and widely used method that responds with sensitivity. However, due to some disadvantages encountered in PCR applications (in particular, the test protocol is comprehensive, not fast in terms of time, not economical, requires user expertise, is not suitable for field/on-site measurements, etc.), a new generation (which can give fast results, are economical, sensitive, suitable for on-site application, etc.) of systems that can provide solutions are needed. On the subject of different test-diagnostic applications used in a large number of test-based analysis methods and techniques, electroanalytical systems have some advantages. Within the scope of this presentation, low-cost, miniaturized electrochemical platforms for surface-printed electrodes by using appropriate biochemical and viral structures of the electrode surfaces decorated with suitable agents are explained. These platforms can be used in the determination of some particular viral proteins for the understanding of viral pathogenic diseases. In this study, a copper-modified graphite electrode was developed and characterized with SEM. Afterwards, an antibody of the N protein of COVID-19 was decorated surrounding this electrode to measure the amount of that protein in the samples. The square wave voltammetry (SWV) technique was used for the electrochemical detection of SARS-CoV-2. When the results of the analyses were examined, the best analytical sensitivity and linearity were obtained by incubating the antibody-modified electrode and virus antigen for 10 min. The measurements showed linearity with a high correlation coefficient (R2 = 0.9917). The detection limit (LOD) was calculated as 508 pg/mL. The measurement limit (LOQ) was calculated as 1.54 ng/mL. With the pencil tip, which is an easily accessible material for the modified electrode system we designed, a very precise measurement was provided for the rapid detection of the N protein of the SARS-CoV-2 virus at very low concentrations.

Graphical Abstract

1. Introduction

Coronaviruses are a group of viruses that can cause respiratory infections in humans, ranging from mild to severe. The Severe Acute Respiratory Syndrome Coronavirus (SARS-CoV) first appeared in China in 2002 and has since spread to 29 countries around the world. SARS-CoV caused pneumonia, a fatal lower respiratory disease, in humans. Middle East Respiratory Syndrome Coronavirus (MERS-CoV) was identified in Saudi Arabia in 2012 and has, since then, spread to 27 nations in the region. The World Health Organization (WHO) reported 774 deaths from the SARS-CoV outbreak and 806 deaths from the MERS-CoV outbreak across the world. SARS-CoV-2, a novel Coronavirus, first appeared in the Chinese city of Wuhan in December 2019 and quickly spread all over the world. The WHO declared the SAR-CoV-2 outbreak a pandemic in March 2020. COVID-19 (Coronavirus Disease 2019) was the name given to the sickness induced by SARS-CoV-2. The COVID-19 pandemic has continued. According to WHO reports on 11 May 2022, 514,948,748 total cases and 6,253,507 total deaths were recorded during the COVID-19 pandemic [1].
Severe Acute Respiratory Syndrome Coronavirus-2 (SARS-CoV-2) is the most important respiratory virus. The SARS-CoV-2 Riboviria realm contains the Nidovirales class, the Coronaviridae family, and the Orthocoronavirinae subfamily. Coronavirinae is divided into four different subtypes. SARS-CoV, SARS-CoV-2, and MERS-CoV are found in β-coronavirus [2,3]. Coronaviruses are enveloped viruses consisting of large, single-stranded, and single-stranded positive RNA. It is understood that CoV-induced viruses make people sick and cause respiratory diseases [2]. COVID-19 is spreading rapidly. The biggest reason for this spread is that the incubation period is long. As the virus spreads rapidly, it causes serious diseases and deaths [4,5]. The SARS-CoV-2 virus can be transmitted by direct physical contact, indirect contact with surfaces, droplets, and aerosols [6]. Inhaling virus particles in airborne droplets produced by coughing, sneezing, or speaking by sick people infects uninfected people with SARS-CoV-2 in an unprotected situation [7]. The incubation time of the SARS-CoV-2 virus is known to be between 3 and 7 days. The maximum incubation period is 14 days [8]. Flu-like findings such as fever and dry cough are the main symptoms [9]. SARS-CoV-2 patients can be sampled from respiratory secretions (mucosal tract), such as saliva, sweat, stool, and urine [10].
SARS-CoV-2 virions are double-layered particles consisting of lipid structures in the range of 50–200 nm in diameter. There are five structural proteins on the virus surface. The spike protein (S) that provides virus entry to the cell includes the nucleocapsid protein (NP) that protects and retains viral RNA, the membrane protein (M) that allows viruses to come together, the envelope protein (E) that participates in the virus component, and the hemagglutinin-esterase protein (HE) [11]. Virus glycoprotein on the virus surface plays an important role in the connection of the viral towards the host genome, the recognition of the angiotensin-converting enzyme receptor (ACE-2), and the introduction of the coronavirus [12,13]. Thirteen mutations were observed in S protein [14]. Success in recognizing the host cell receptor has made the S protein an important target for drug and vaccine design [15]. SARS-CoV-2 is the most common N protein at the time of infection. It is the only protein that binds to the ribonucleic acid (RNA) genome of the virus. It protects the viral RNA genome [16]. N protein is seen in serum or urine samples within the first 15 days of the disease [5]. The highest expression of infection occurs in the first 12 h. The main functions of the N protein are to safeguard the genome by creating ribonucleoproteins (RNPs), to control viral RNA reproduction during replication, and to stimulate the production of virion via acting with the RNA molecule [17]. According to research, the antibody reaction in people is specific to the nucleocapsid. It has also been reported to show high sensitivity and long-term permanence. The S protein is known as the most frequently targeted protein after N protein [18]. Studies in plasma samples or serum antibodies from COVID-19 patients have shown that N-protein-specific antibodies identify SARS-CoV-2 infection earlier than S-protein-specific antibodies. [19]. N proteins are effective antigens for the detection of COVID-19 illness. [20]. It can cause cross-reactivity due to the presence of S proteins on the surface and the common virus in many coronavirus families such as influenza, Ebola, and Zika viruses [21]. The N protein is in the virus. It mutates much less, and the risk of cross-reactivity is eliminated. Therefore, it is more advantageous to work with the N protein.
It is critical to discover SARS-CoV-2 as soon as possible. It is critical in preventing the spread of viruses. To identify the virus quickly and accurately, diagnostic procedures are necessary. The SARS-CoV-2 detection techniques are as follows: molecular tests, serological tests, protein tests, special nucleic acid tests, and care point tests [22,23]. Molecular testing is intended to discover the virus’s genetics. Serological studies may identify antibodies in human blood and tissues but may not always indicate infection status [24]. The polymerase chain reaction (PCR) is an essential tool for detecting the existence of coronavirus [25]. The reverse transcriptase polymerase chain reaction (RT-PCR) is a technique for detecting the existence of nucleic-acid-based genome information from viruses and different organisms [26]. The disadvantages of these methods are the use of high-cost reagents, the use of expensive laboratory tools, the time spent in evaluating samples and producing results, and the risk of contamination.
Biosensors have been developed to eliminate the negative points of diagnostic methods. Electrochemical biosensors are detection devices that use an electrochemical converter to turn chemical data into a signal, with advantages such as easy construction, tremendous responsiveness, inexpensive price, and high downsizing potential [27]. In addition, there are also systems that translate biological processes like antigen–antibody complexes into electrical impulses [28,29]. The electrodes used in the sensors are important for the fixation of biomolecules [30]. Electrochemical biosensors include reduction–oxidation steps that occur depending on the desired target analyte concentration [31]. In addition, electrochemical sensors are of great importance, with high sensitivity and selectivity, low risk of error in virus measurement, reusability, and portability [24].
Our aim is to develop a sensor system by using a pencil graphite electrode due to their superior sensitivity, modifiable electroactive surface area, reproducibility, cost-effectiveness, and disposability [32]. The surfaces of these electrodes are decorated with the following biochemical agents, and the targeted COVID-19 N antigen can be recognized. The potentiometric electrochemical sensor principle was used in our experiment. The pencil graphite electrodes (PGEs), which we determined as sensors, were modified with hydroxyapatite (HAP) and copper oxide (CuO), and electrochemical measurements were taken using the cyclic voltammetry (CV) method with the help of a potentiostat device. It scans the CV oxidation and reduction steps and is used for pathogen detection [33]. Using the antibody–antigen interaction, PGEs modified with HAP + CuO were functionalized with N protein antibody by the following necessary procedures. Binding was provided between functionalized antibodies on the surface of PGEs and SARS-CoV-2 N proteins. Square wave voltammetry (SWV) was used to investigate the existence and electroactivity of the species in the electrochemical cell [33]. Square wave voltammetry (SWV) is a very sensitive electrochemical technique for detecting reversible redox species [34].

2. Materials and Methods

In this section, the modification of pencil graphite electrodes and the physical and chemical characterization of the outputs taken at each step in the process (SEM-EDX) and antiviral steps will be discussed. It is the modification of pencil graphite electrodes (PGEs) with hydroxyapatite (HAP) and copper oxide, and after their modification, they are equipped with COVID-19 nucleocapsid protein antibody and the detection of virus antigen.
Chemicals used in the modification of PGEs were HAP, copper oxide, copper (II) sulfate pentahydrate ( CuSO 4 *5 H 2 O), calcium chloride ( CaCl 2 ), diammonium-phosphate ( ( NH 4 ) 2 HPO 4 ) chemicals, supplied by Merck. Sodium hydroxide (NaOH) was supplied by Sigma Aldrich (St. Louis, MO, USA). The chemicals used in N antibody functionalization of PGEs modified with HAP and copper oxide were provided from Carlo Erba Reagenti Company. Monosodium phosphate (Na H 2 PO 4 ), NaOH from Merck, and sodium phosphate ( ( Na 2 HPO 4 ) from Fisher Scientific were used to prepare the sodium phosphate buffer solution pH 7.4. N-(3-dimethylaminopropyl)-N-ethylcarbodiimide hydrochloride (EDC, 98% purity) and N-hydroxysuccinimide (NHS, 98% purity) were supplied by Sigma-Aldrich. Albumin (BSA) was supplied by Amresco. SARS-CoV-2 N protein (E. coli, AG-0104) and rabbit-derived Polyclonol N antibody were procured from Synbiotic company.
In this research, Tombow (0.5 mm, 2B) branded pencil tips were used as a pencil graphite electrode (PGE). The three-electrode electrochemical cell system consists of a PGE as a working electrode, the 0.5 mm diameter platinum wire as a counter electrode, and the Ag/AgCI in aqueous KCl as a reference electrode. A Palm Sense 4 branded potentiastat/galvonastat device was used to take signal measurements and obtain voltammetric measurements. SEM analyses were carried out with Quattro S ColorSEM (Thermo Fisher Scientific, Waltham, MA, USA) in Boğaziçi University Kandilli Campus.

2.1. Modification of Electrodes

Modification of PGEs with HAP was performed by coating calcium phosphate on the surface. One of the most important properties of calcium phosphate (CaP) is its ability to exchange ions. It also increases the surface area. Ion exchange is provided by the high surface area of calcium phosphate crystals and by loose bonds on the crystal surface. In many studies, by using these properties of HAP, metal ions that are divalent such as Cu + 2 , Cd + 2 , Zn + 2 , Al + 2 , and Ni + 2 were studied, and successful results were obtained [35]. It has recently been reported to have an affinity for metal ions, such as Cu + 2 and calcium phosphate salts, which are very often needed in heavy metal removal. With CaP compounds, adsorption of heavy metals deteriorates the surface of the CaP, and the metal ions that bind pass into the CaP from a very dense environment to a less dense environment. The Ca + 2 ions in CaP are replaced by other metal ions and reintegrated into CaP [35]. Based on the literature we obtained, it was thought that using HAP would increase the surface area of our PGEs. The 1 cm area of the pencil tip ends was immersed into the 0.12 M CaCl2 solution for 5 min. Then, surface coating process was advanced by immersion in 0.06 M ( NH 4 ) 2 HPO 4 solution for 5 min. By this dip method, the surface area of PGEs was increased by coating with hydroxyapatite.
Modification of PGEs with copper oxide was performed by attaching copper to the surface. Copper is widely used in different areas due to its powerful physical and chemical properties. Copper is more economical and has excellent stability compared to other metals [36]. Because of its better electrochemical activity and ability to promote electron transport at low potential, nanostructured CuO is a promising choice for biosensing surface modification [37,38]. Das et al. reported in their study that when they examined the perphonation of CuO-modified biosensors, a rise in concentration resulted in an increase in sensitivity. The increase in sensitivity was due to a good electron transfer and load transfer [39]. CuO was used because of its easy accumulation on the PGE surface. Based on the literature, using copper oxide solution will achieve the desired degree of accumulation on the surface of PGEs. CuSO 4 and NaOH solutions were prepared at different concentrations and ratio (Table 1). Each PGE was immersed in a CuSO 4 *5 H 2 O solution prepared at different concentrations for 5 min and in a NaOH solution for 5 min. Our electrodes were removed from the solution and left to dry overnight indoors. CuO held onto the hydroxyapatite, and Cu + 2 ions were deposited on the surface. For signal measurements, a 5 mM Fe ( CN ) 6 3 / 4 solution containing 0.1 M KCl was prepared from K 3 Fe ( CN 6 ) and K 4 Fe ( CN 6 ) . Measurement parameters were 1 V/s scanning speed from −0.5 V and +0.8 V, based on the literature. The electrochemical behavior of PGEs was investigated using the cyclic voltammetry (CV) method. Each measurement was repeated 3 times with different tips.
After the electrode surfaces were modified with HAP and copper oxide, they were functionalized with the COVID-19 nucleocapsid antibody. Figure 1 shows the processes necessary for the binding of COVID-19 nucleocapsid antibody to the surface of HAP and copper-oxide-modified electrodes. In order to bind antibodies to the surface of the PGEs, amine groups must be formed on the surface. Cu particles held on HAP interact with ammonia ( NH 3 ) to form amine groups. As a result of the repulsive electrostatic mechanism between amine groups, it offers higher stability than CuNPs and is employed to bind the N antibody [40,41]. Modified PGEs were immersed in ammonia for 15 min and then dried in an oven at 60–70 °C for 15 min [41,42]. Then, they were washed in 0.1 M PBS (7.4 pH buffer solution), and 0.05 M N-(3-dimethylaminopropyl)-N-ethylcarbodiimide hydrochloride (EDC) and 0.025 M N-hydroxysuccinimide (NHS) were prepared in PBS. The modified electrodes were incubated for 15 min in EDC-NHS crosslinker solutions to activate the amines [34,43]. Polyclonol N antibody obtained from rabbit up to 10 µL was then added to the crosslinker solution. After mixing, the electrodes were incubated for 30 min in order to bind the antibody to the electrodes. After crosslinking, the last step was to block the non-specific areas on the electrode surface by incubation in BSA solutions (10% w/v) to close the amine groups. Then, it was washed 3 times in PBS. The electrodes were dried for 10 min in a closed environment.
Two different parameters were evaluated in the antigen detection of the pencil graphite electrode functionalized with antibody. Parameter 1 is the incubation time of the antigen with the antibody-functionalized electrode. The times were set as 1 min, 5 min, and 10 min. Parameter 2 is the determination of different concentrations of antigens. It was performed with increasing concentrations between 6.4 × 10⁻¹⁴ ile 1 × 10⁻⁹ g/mL. Pencil graphite electrodes were kept in different antigen concentrations for 1, 5, and 10 min. It was left to dry for 5 min indoors. For the voltammetric measurements, signal measurement and analysis of the electrodes were performed in the redox probe solution. Measurement was taken using the SWV technique for electrochemical response. A decrease in current was observed in SWV measurement analyses. Current suppression caused by the binding of the SARS-CoV-2 NP to the electrode occurred. The connecting of the NP to the electrode surface partially blocked the electroactive regions on the electrode surface. This led to suppression of the current. Thus, SARS-CoV-2 nucleocapsid protein (NP) was detected. The measurement values of the prepared electrodes in 8 mL hexacyanoferrate (HCF) solution were set as frequency 80 Hz, amplitude 75 mV, step potential 80 mV, and starting and ending values were between −0.2 and 1 mV, respectively.

2.2. Electrochemical Studies with Prepared Electrodes, Analysis, and Electrochemical Cell

After being modified with HAP and copper oxide, they were modified with COVID-19 NP antibody. It was immersed in solutions at different concentrations prepared for antigen detection and kept for specified periods. The modified and functionalized pencil tips were used as working electrodes. Alternate voltammetry and square wave voltammetry studies were performed as electrochemical signal analysis. The three-electrode electrochemical cell system consists of a PGE as a working electrode, the 0.5 mm diameter platinum wire as a counter electrode, and the Ag/AgCI in aqueous KCl as a reference electrode.

2.3. Examination of the Behavior of Electrodes

In order to evaluate the electrochemical behavior of the unmodified PGE, copper oxide modified PGE, and HAP- and copper-oxide-modified PGE, cyclic voltammograms were taken in the HCF solution. In the antigen detection part, square wave voltammograms were taken in the HCF solution.

3. Results and Discussion

3.1. Characterization of the Prepared Electrodes

Morphological characterization of the unmodified and modified electrodes was conducted using SEM. SEM and EDX images show that there was no material on the PGE surface except silicon and carbon. The surface of the pencil graphite electrode prepared with copper oxide was examined with a scanning electron microscope. Using CV graphs, it was observed that the modification in the ratio of 0.5 M CuSO 4 and 0.5 M NaOH 1:5 was the best result, and the electrode was modified at these rates. In SEM images, the PGE surface is in the second row in Figure 2. It is seen that the interaction and modification with copper structures have been successful. It was learned by using EDX that the accumulation on the surface of the pencil graphite electrode belonged to copper ions.
It was observed that the surface area of the electrode increased as a result of first functionalizing it with HAP, that is, precipitating CaP salts on the surface. In SEM images, it was observed that there was more rough structure on the electrode surface modified with HAP and copper oxide, and therefore, the surface area was increased. The electrode precipitated with HAP compounds known to have affinity for copper ion was modified with 0.5 M CuSO 4 and 0.5 M NaOH 1:5 solution. It is understood in the SEM image that hydroxyapatite compounds keep the copper ion mostly on the surface. EDX images of CaP salts and copper-modified electrodes show that copper accumulates excessively.

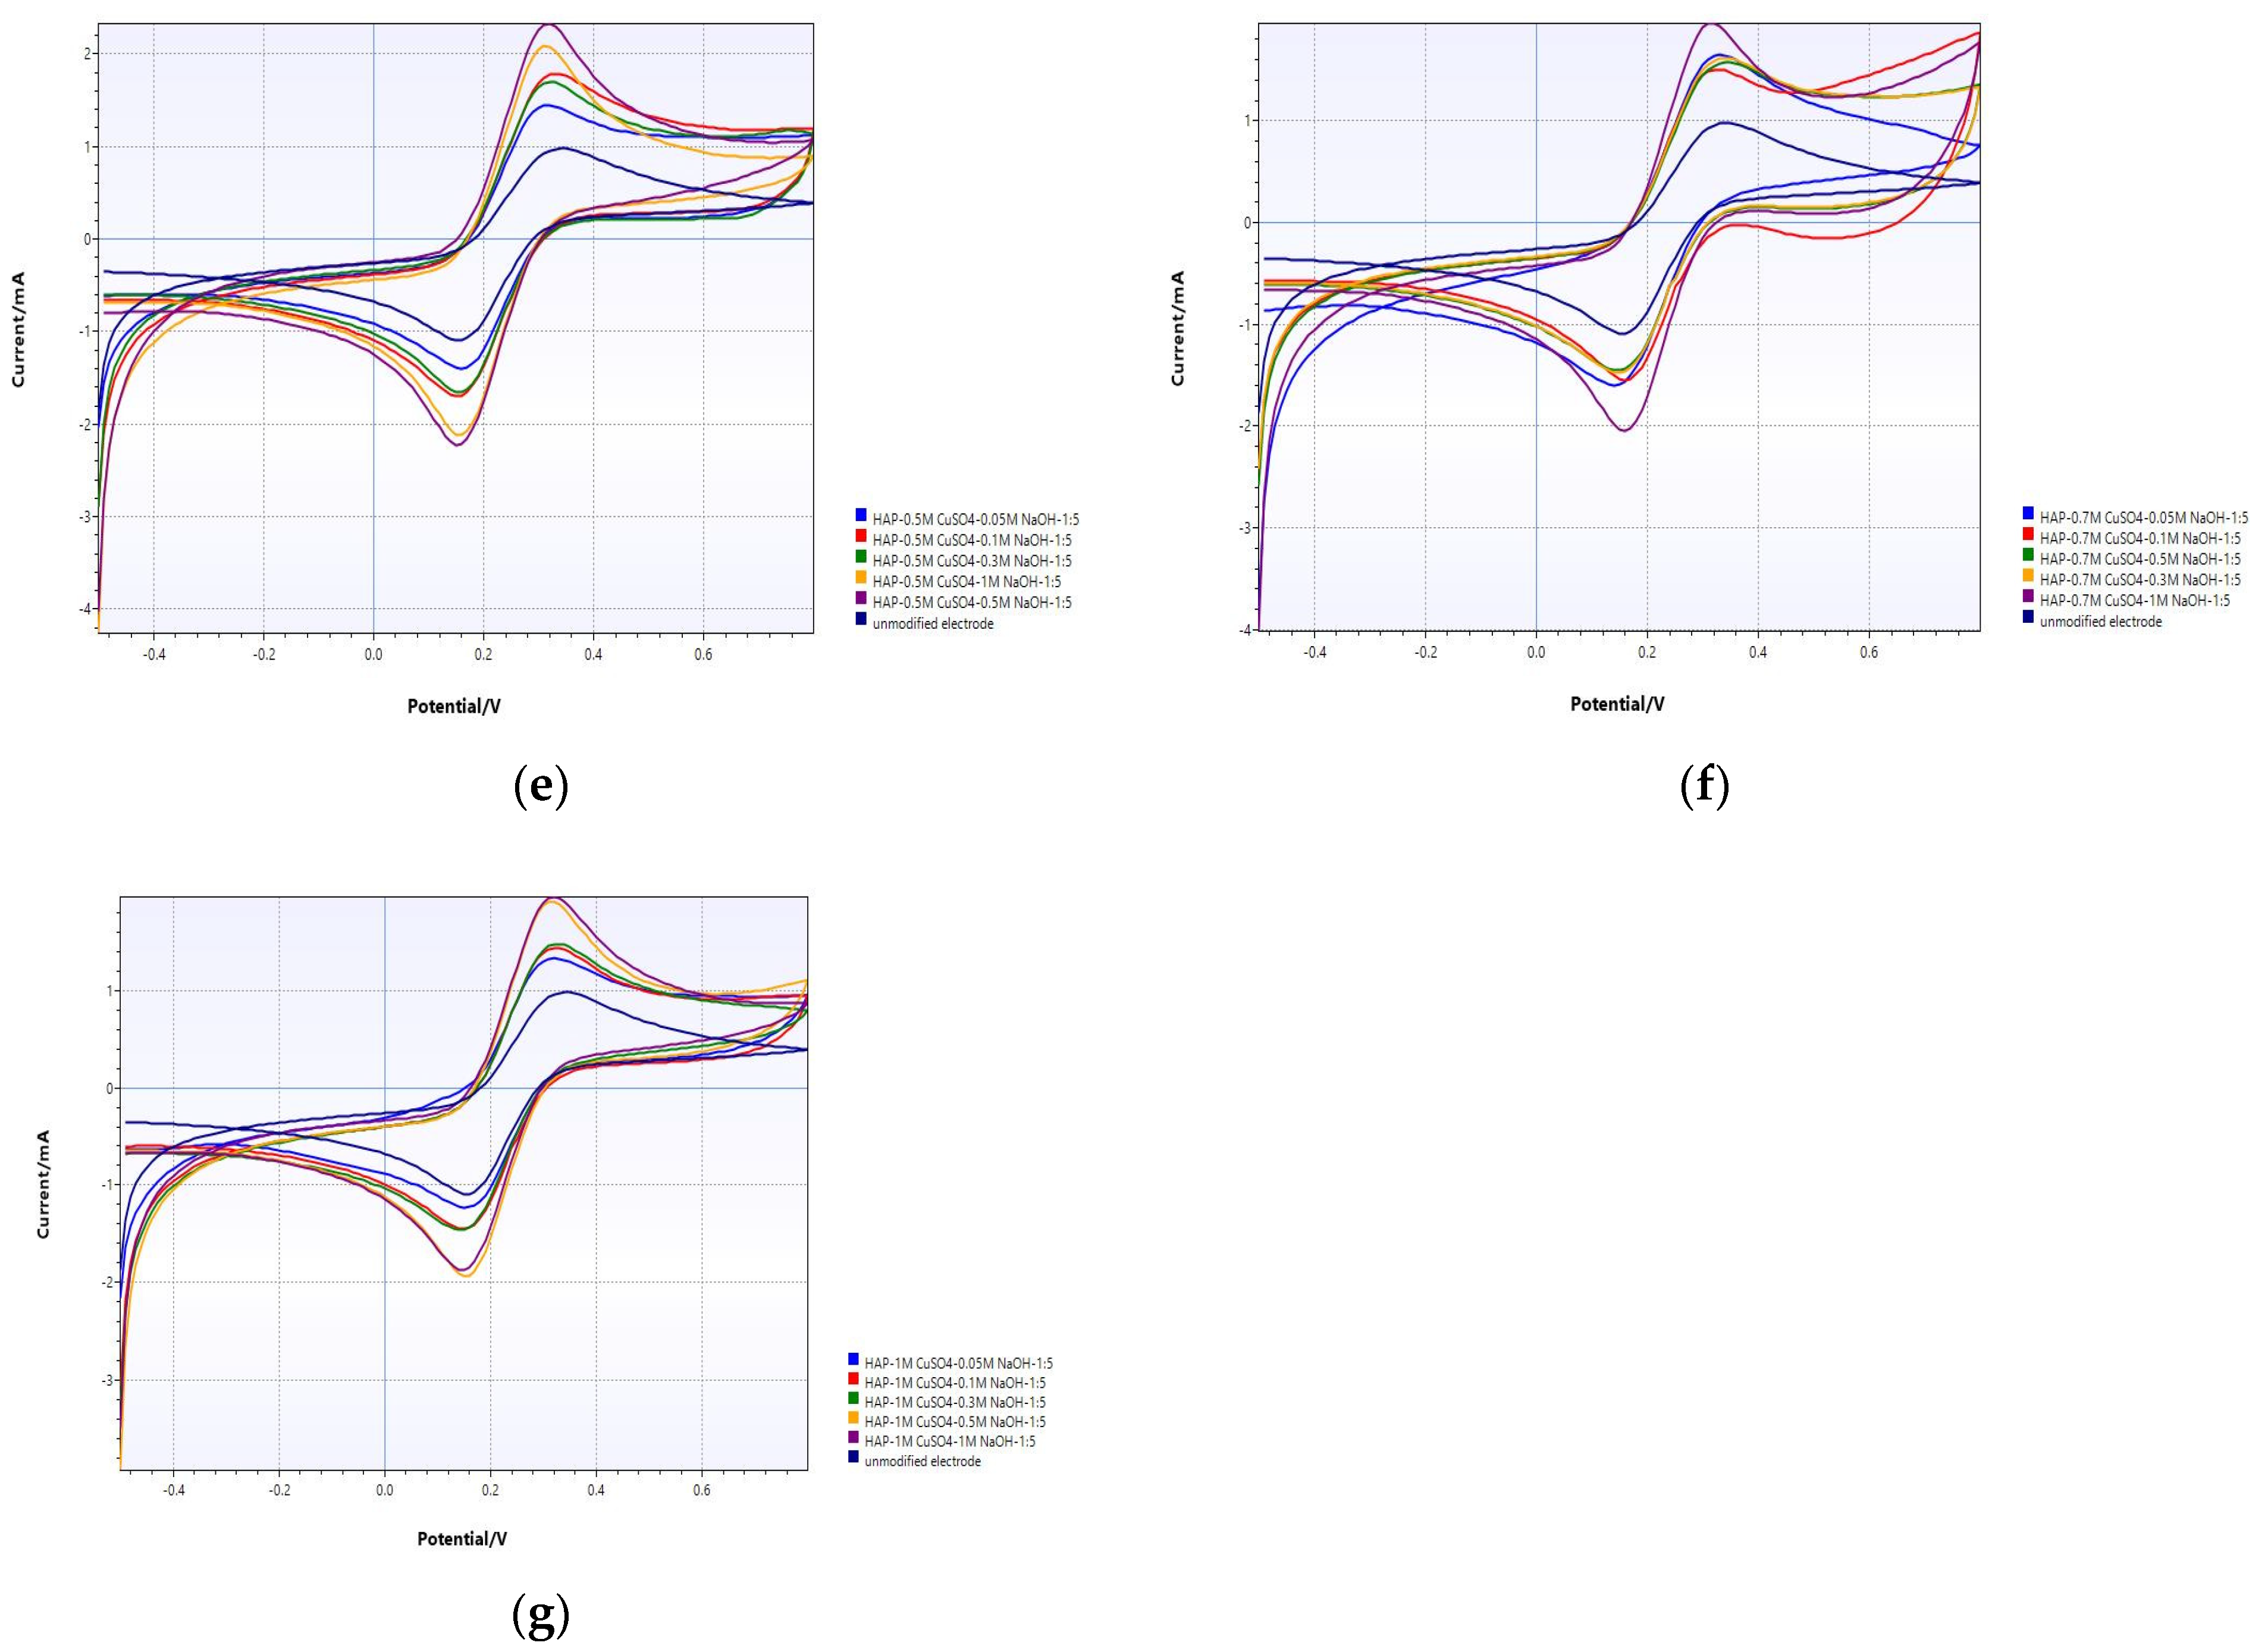
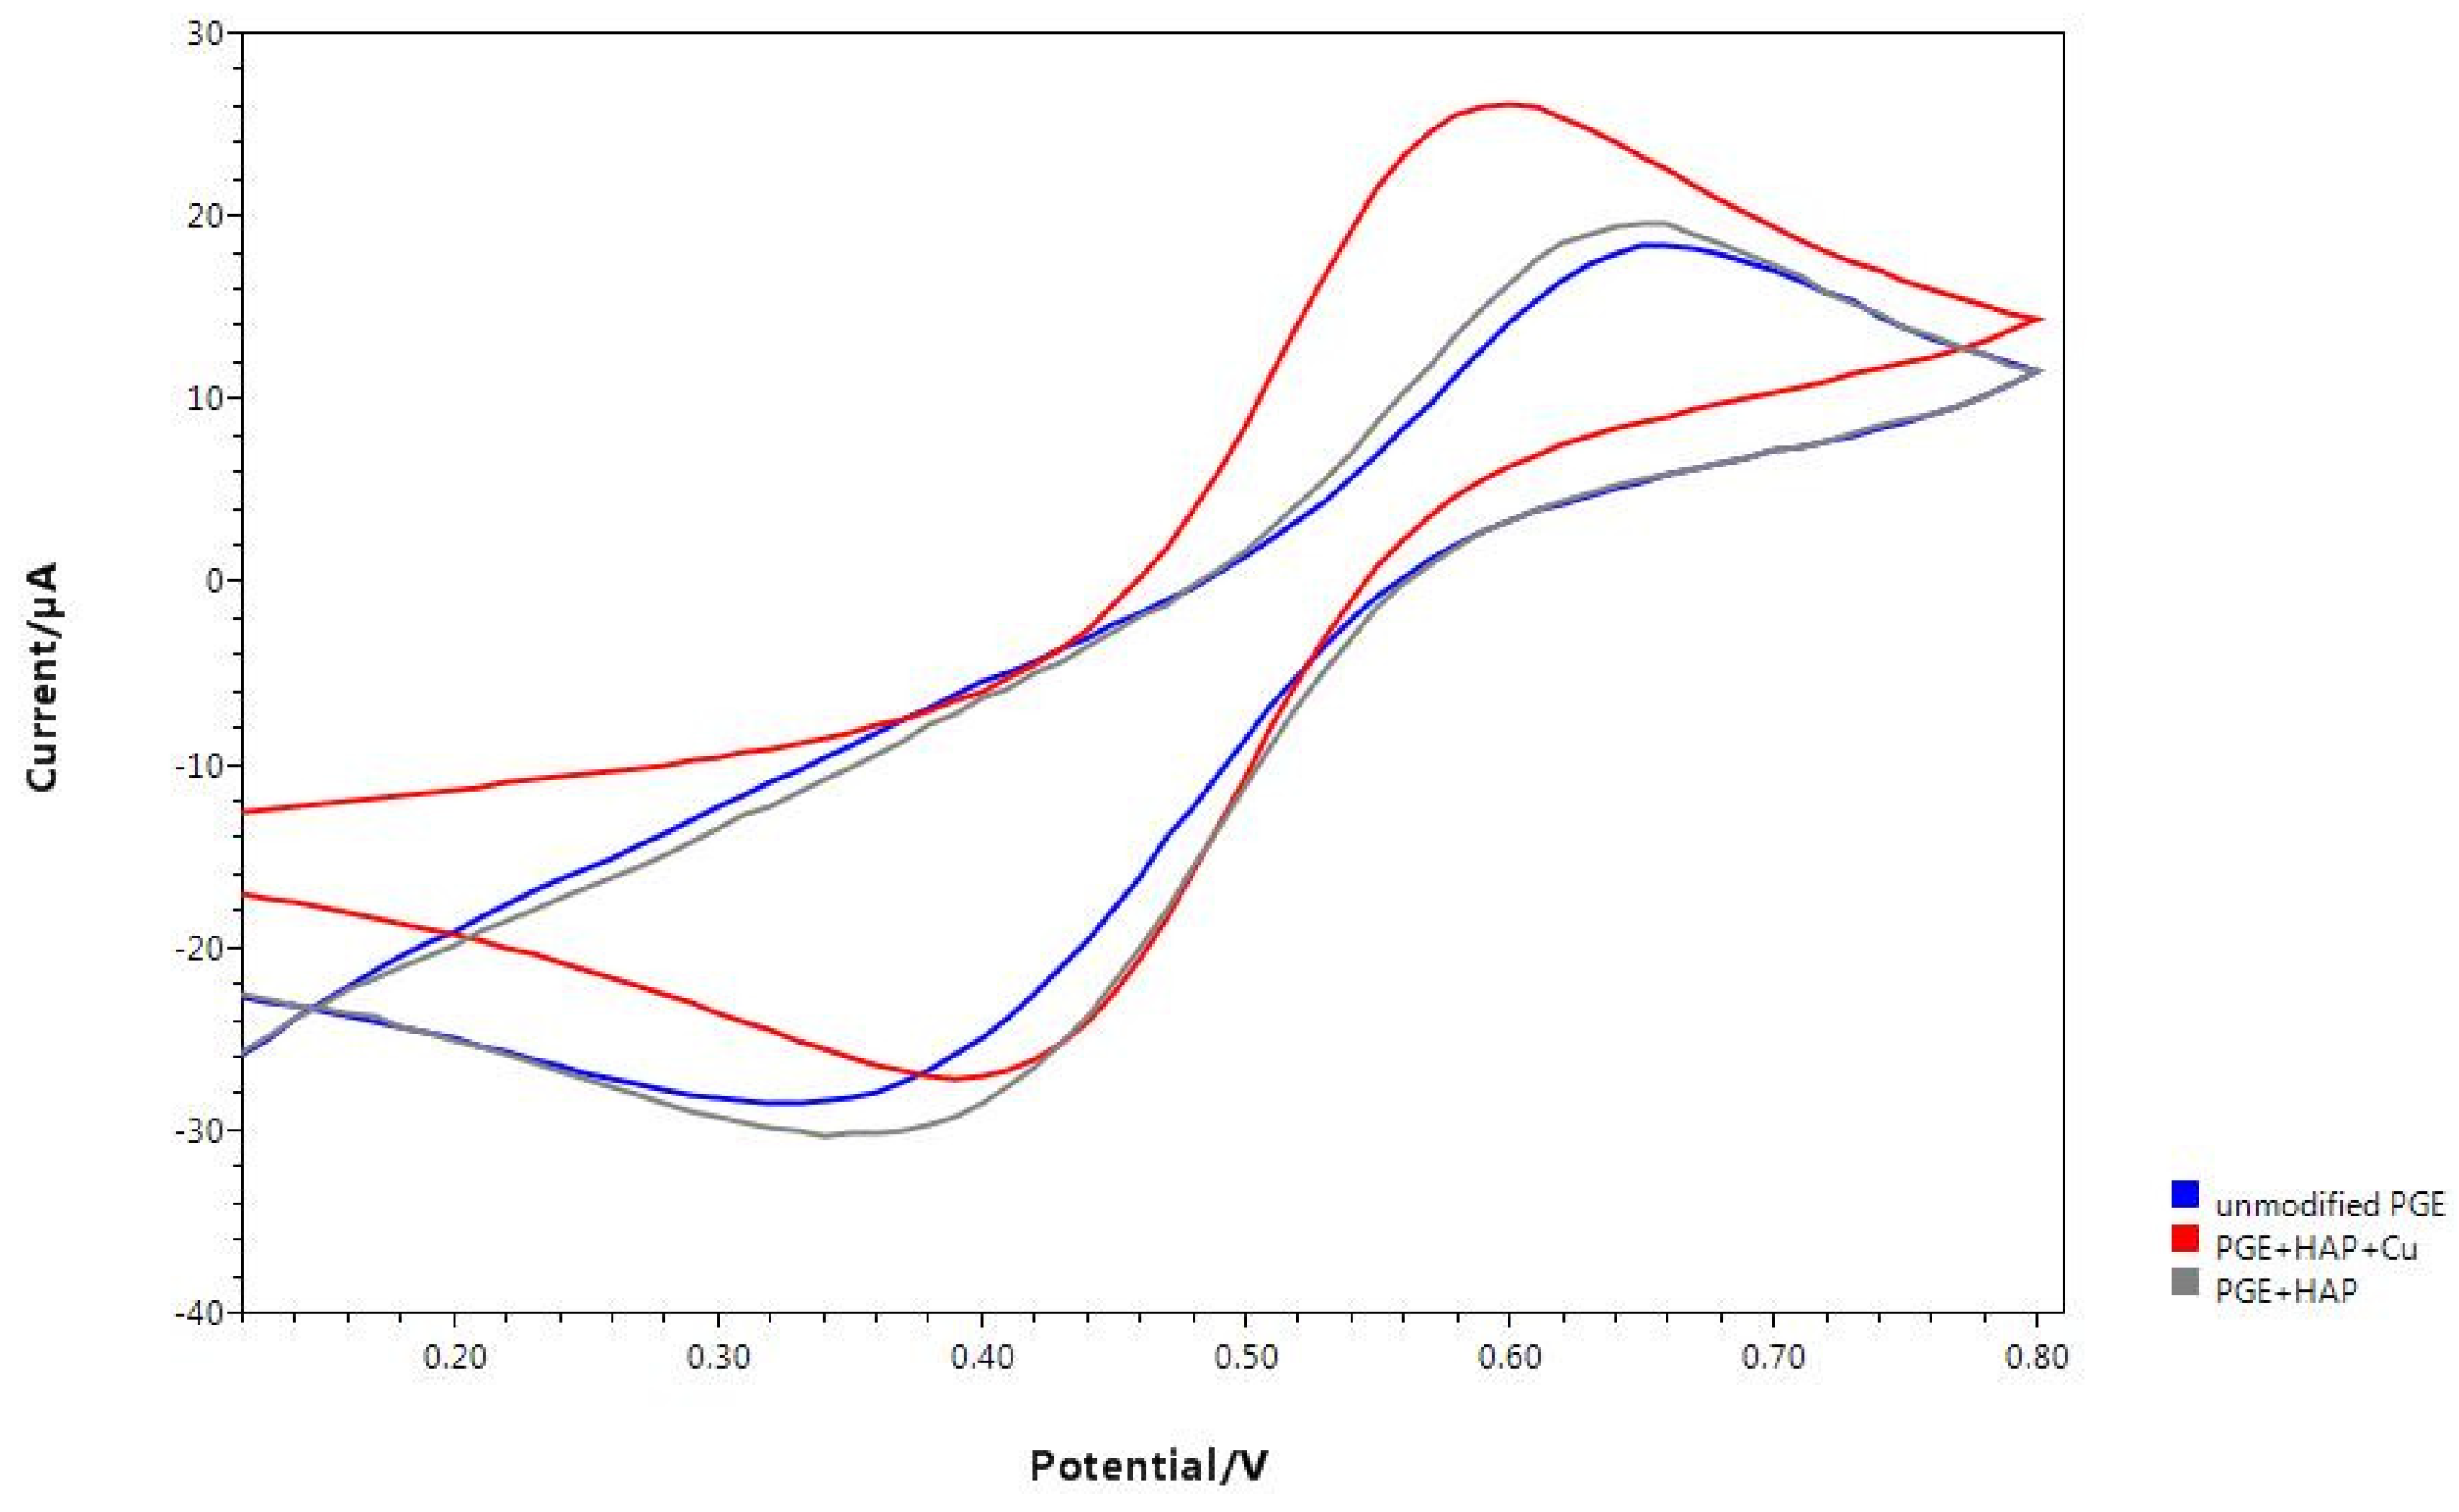
3.2. Electrochemical Analysis

The modification of PGE with HAP and copper oxide was examined by the cyclic voltammetry (CV) method. CuSO 4 precursor precipitates as a single phase of polycrystalline CuO in alkaline medium. Pure copper nanostructured particles can be prepared by this coprecipitation method [44]. Figure 3 show voltammetric responses of the unmodified and modified electrode with HAP and copper oxide at different concentrations and ratios. It is then known that HAP retains copper ions when modified with copper [34].
The electrochemical response of unmodified and modified electrodes was characterized using the electron transfer redox probe [Fe(CN)6]3−/4− with cyclic voltammetry. The important parameters in CV graphs to evaluate the efficiency of the modified electrode are the separation of the anodic and cathodic peak potentials (peak-to-peak separation, ΔEp = Epa − Epc), and peak currents. Electrolytic solutions have an intrinsic resistance in the electrochemical cell. While potentiostats can compensate for most of this solution resistance (Rc), some of the uncompensated resistance (Ru) remains. During electrochemical measurement, potential recorded by the potentiostat does not belong to the analyte alone. This uncompensated potential is also recorded. This phenomenon is called ohmic drop. A sign of ohmic drop in cyclic voltammogram is increased peak-to-peak separation. In reversible redox couple [Fe(CN)6]3−/4−, ΔEp was calculated to be 58 mV, theoretically. Therefore, the ΔEp of the modified electrode is expected to be close to this theoretical value [45]. The final aim of electrode modification is the enhancement of the peak current in order to improve analytical sensitivity. These increased redox peak current and decreased peak-to-peak separation indicate the facilitated electron transfer process and larger electrode surface area [27].
Upon modification of PGE surfaces with CuO in different conditions, the voltammetric profiles are considerably altered. In Figure 3, the effect of concentration of alkali on the coprecipitation of CuO was evaluated electrochemically. The peak current of the unmodified PGE was 1.903 ± 0.11 mA. When 0.05 M CuSO4 was precipitated in NaOH at different concentrations, the best electrode response was obtained at 1.817 ± 0.22 mA when it was precipitated in 1.0 M NaOH (Figure 3a). For the different concentrations of CuSO4 at 0.1, 0.2, 0.3, 0.5, 0.7, and 1.0 M, the best electrode responses were obtained in 1.0 M (Figure 3b, 1.502 ± 0.36 mA), 1.0 M (Figure 3c, 2.119 ± 0.18 mA), 1.0 M (Figure 3d, 2.397 ± 0.44 mA), 0.5 M (Figure 3e, 2.465 ± 0.39 mA), 0.5 M (Figure 3f, 2.11 ± 0.16 mA), and 0.5 M NaOH (Figure 3g, 2.18 ± 0.22 mA), respectively. When the copper concentration is further increased, no increase in current is observed as the surface reaches saturation (Figure 3f,g). By evaluating all results, it was understood that the most appropriate modification parameters for the best electrode response were HAP+0.5 M CuSO 4 and 0.5 M NaOH 1:5.
Electroactive surface area of unmodified and modified PGE was calculated in the inner-sphere redox probe Fe3+/Fe2+ in 1.0 M HCl by cyclic voltammetry. The voltammogram in Figure 4 was recorded in 2.0 mM FeCl3 in 1.0 M HCl with a scan rate of 10 mV s−1. The increase in the electroactive surface area after modification with HAP and CuO was determined according to the Randles–Sevcik Equation (1).
I pa = 2.69 × 10 5 AD 1 / 2 n 3 / 2 v 1 / 2 C
Ipa is anodic peak current. A refers to electroactive surface area of the electrode. D, n, v, and C show the diffusion coefficient, the number of transferred electrons, scan rate, and concentration of the redox probe, respectively [46,47]. While the electroactive surface area of the unmodified PGE is 6.33 × 10⁻⁸ cm2, after modifications with HAP and CuO, it was 8.13 × 10⁻⁸ cm2 and 2.28 × 10⁻⁷ cm2, respectively. Modification of PGE with HAP and CuO increased electroactive surface area by about 28% and 260%, respectively.

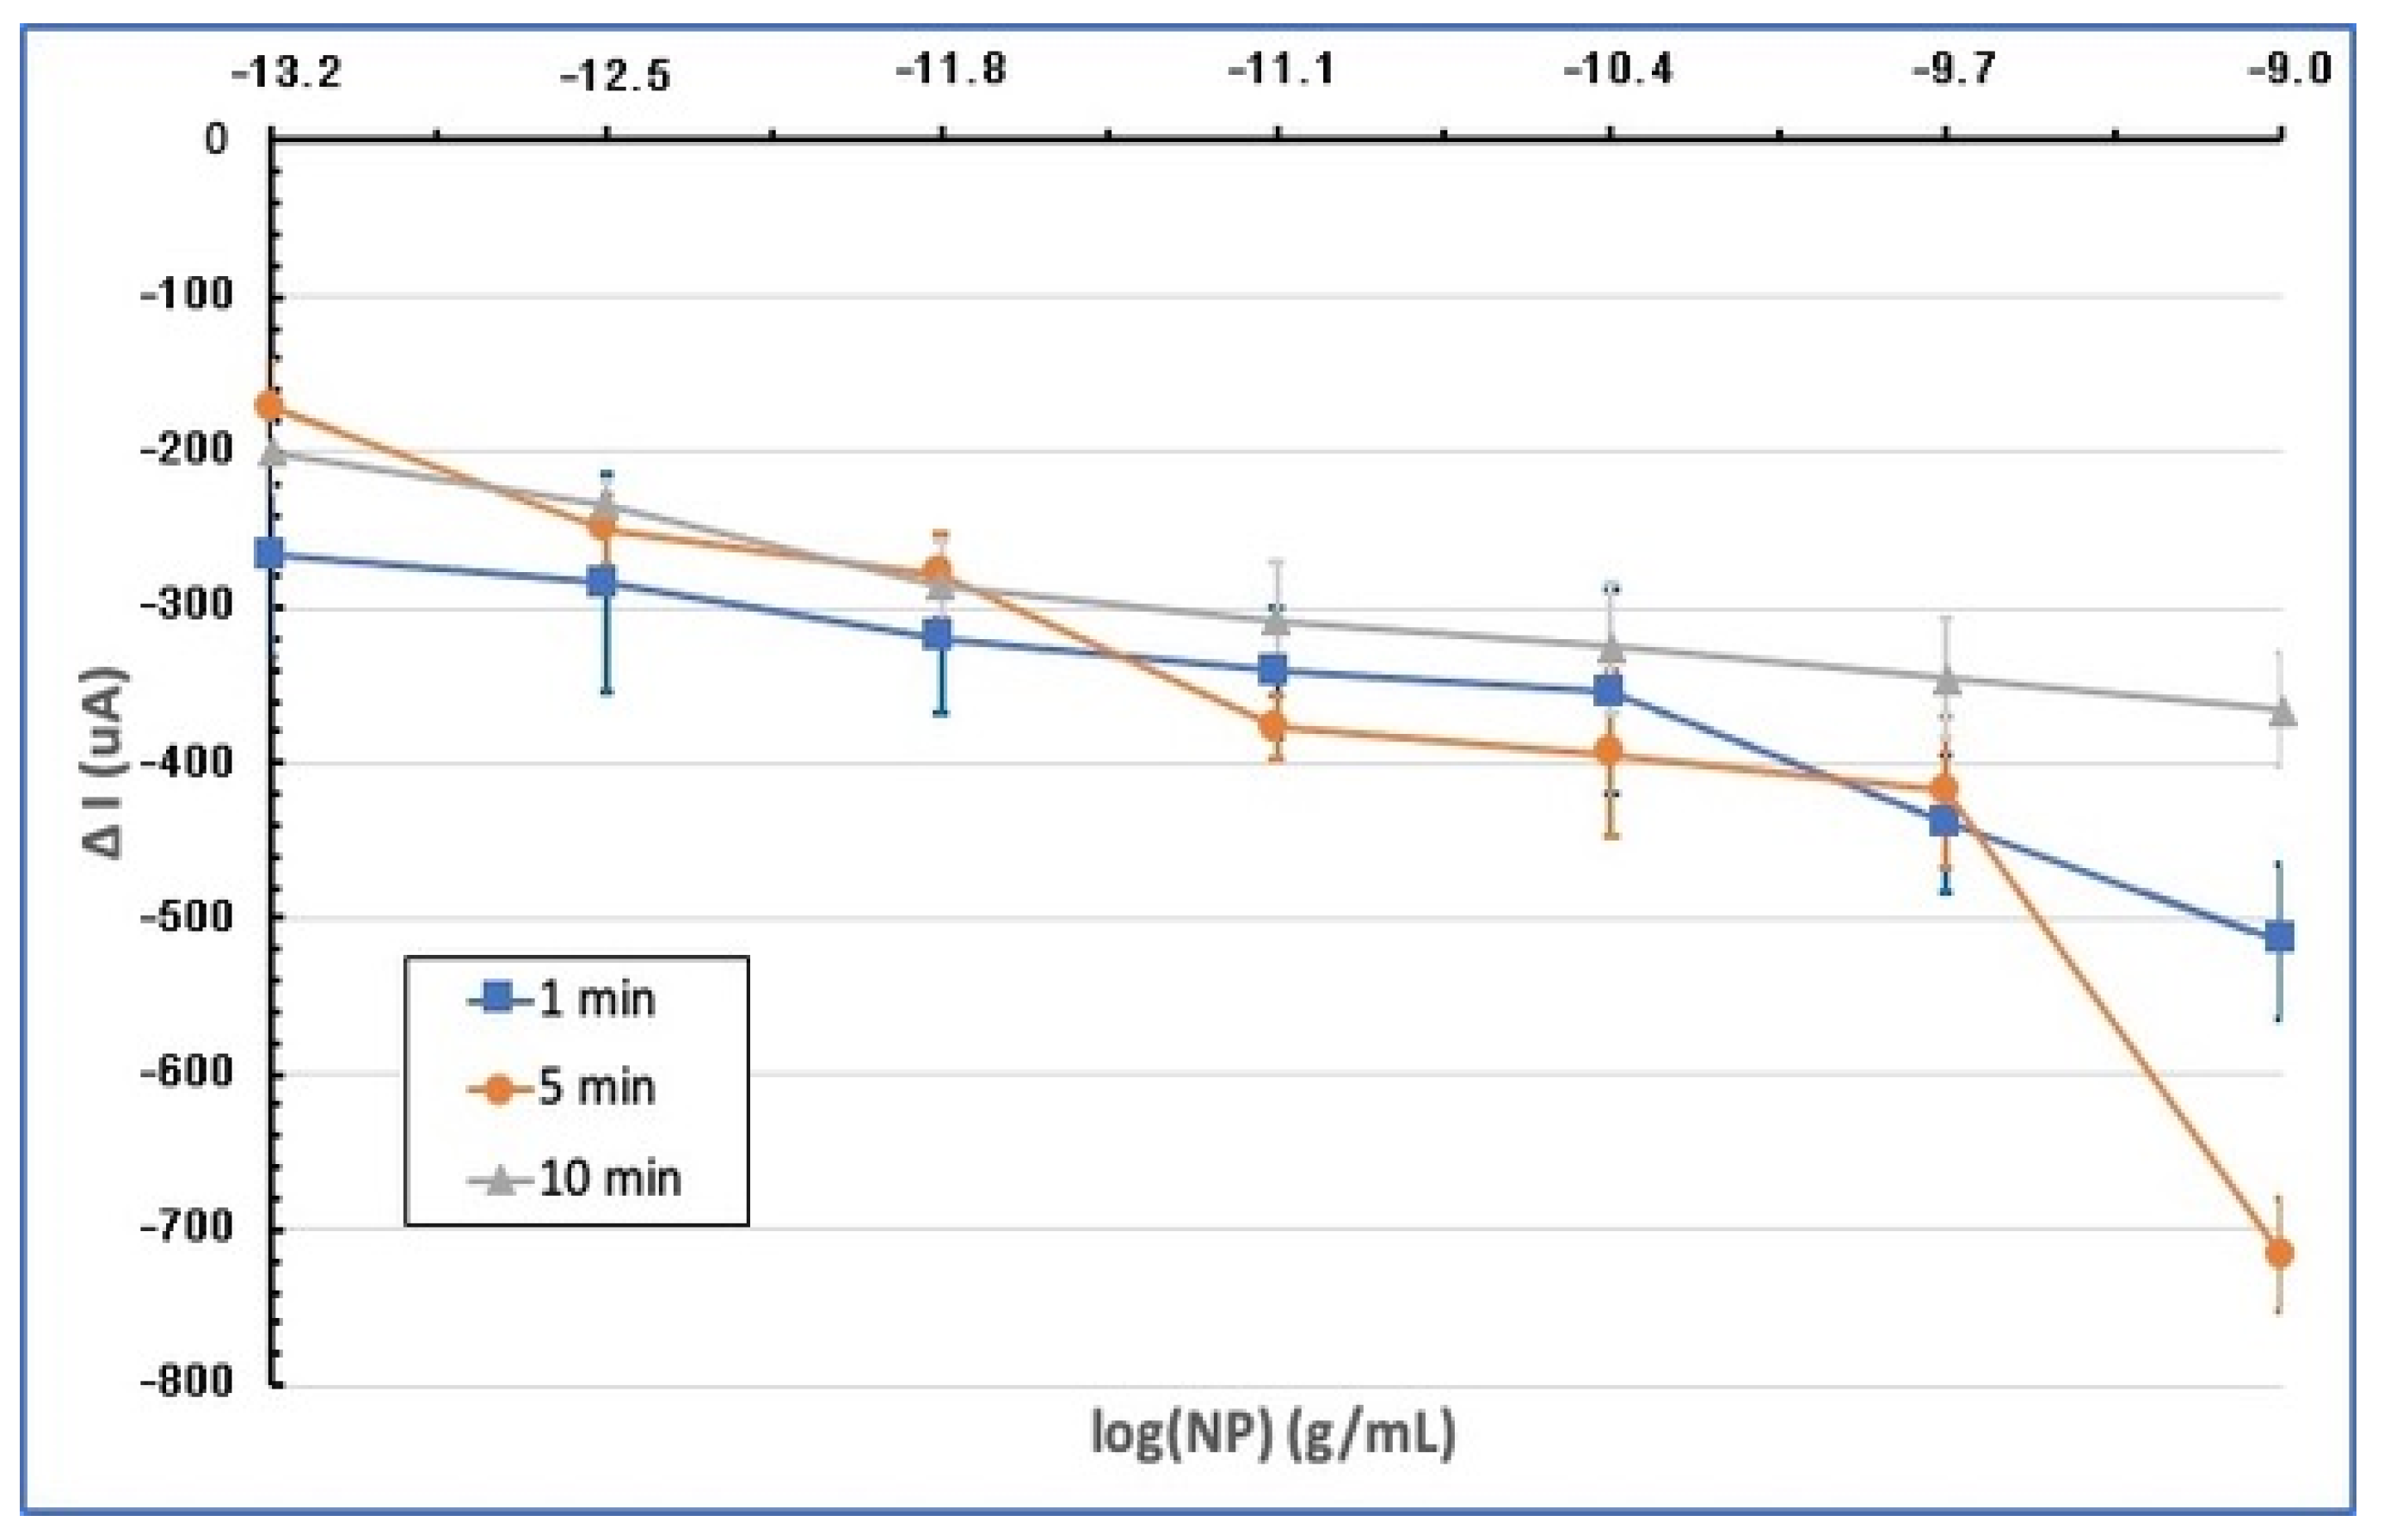
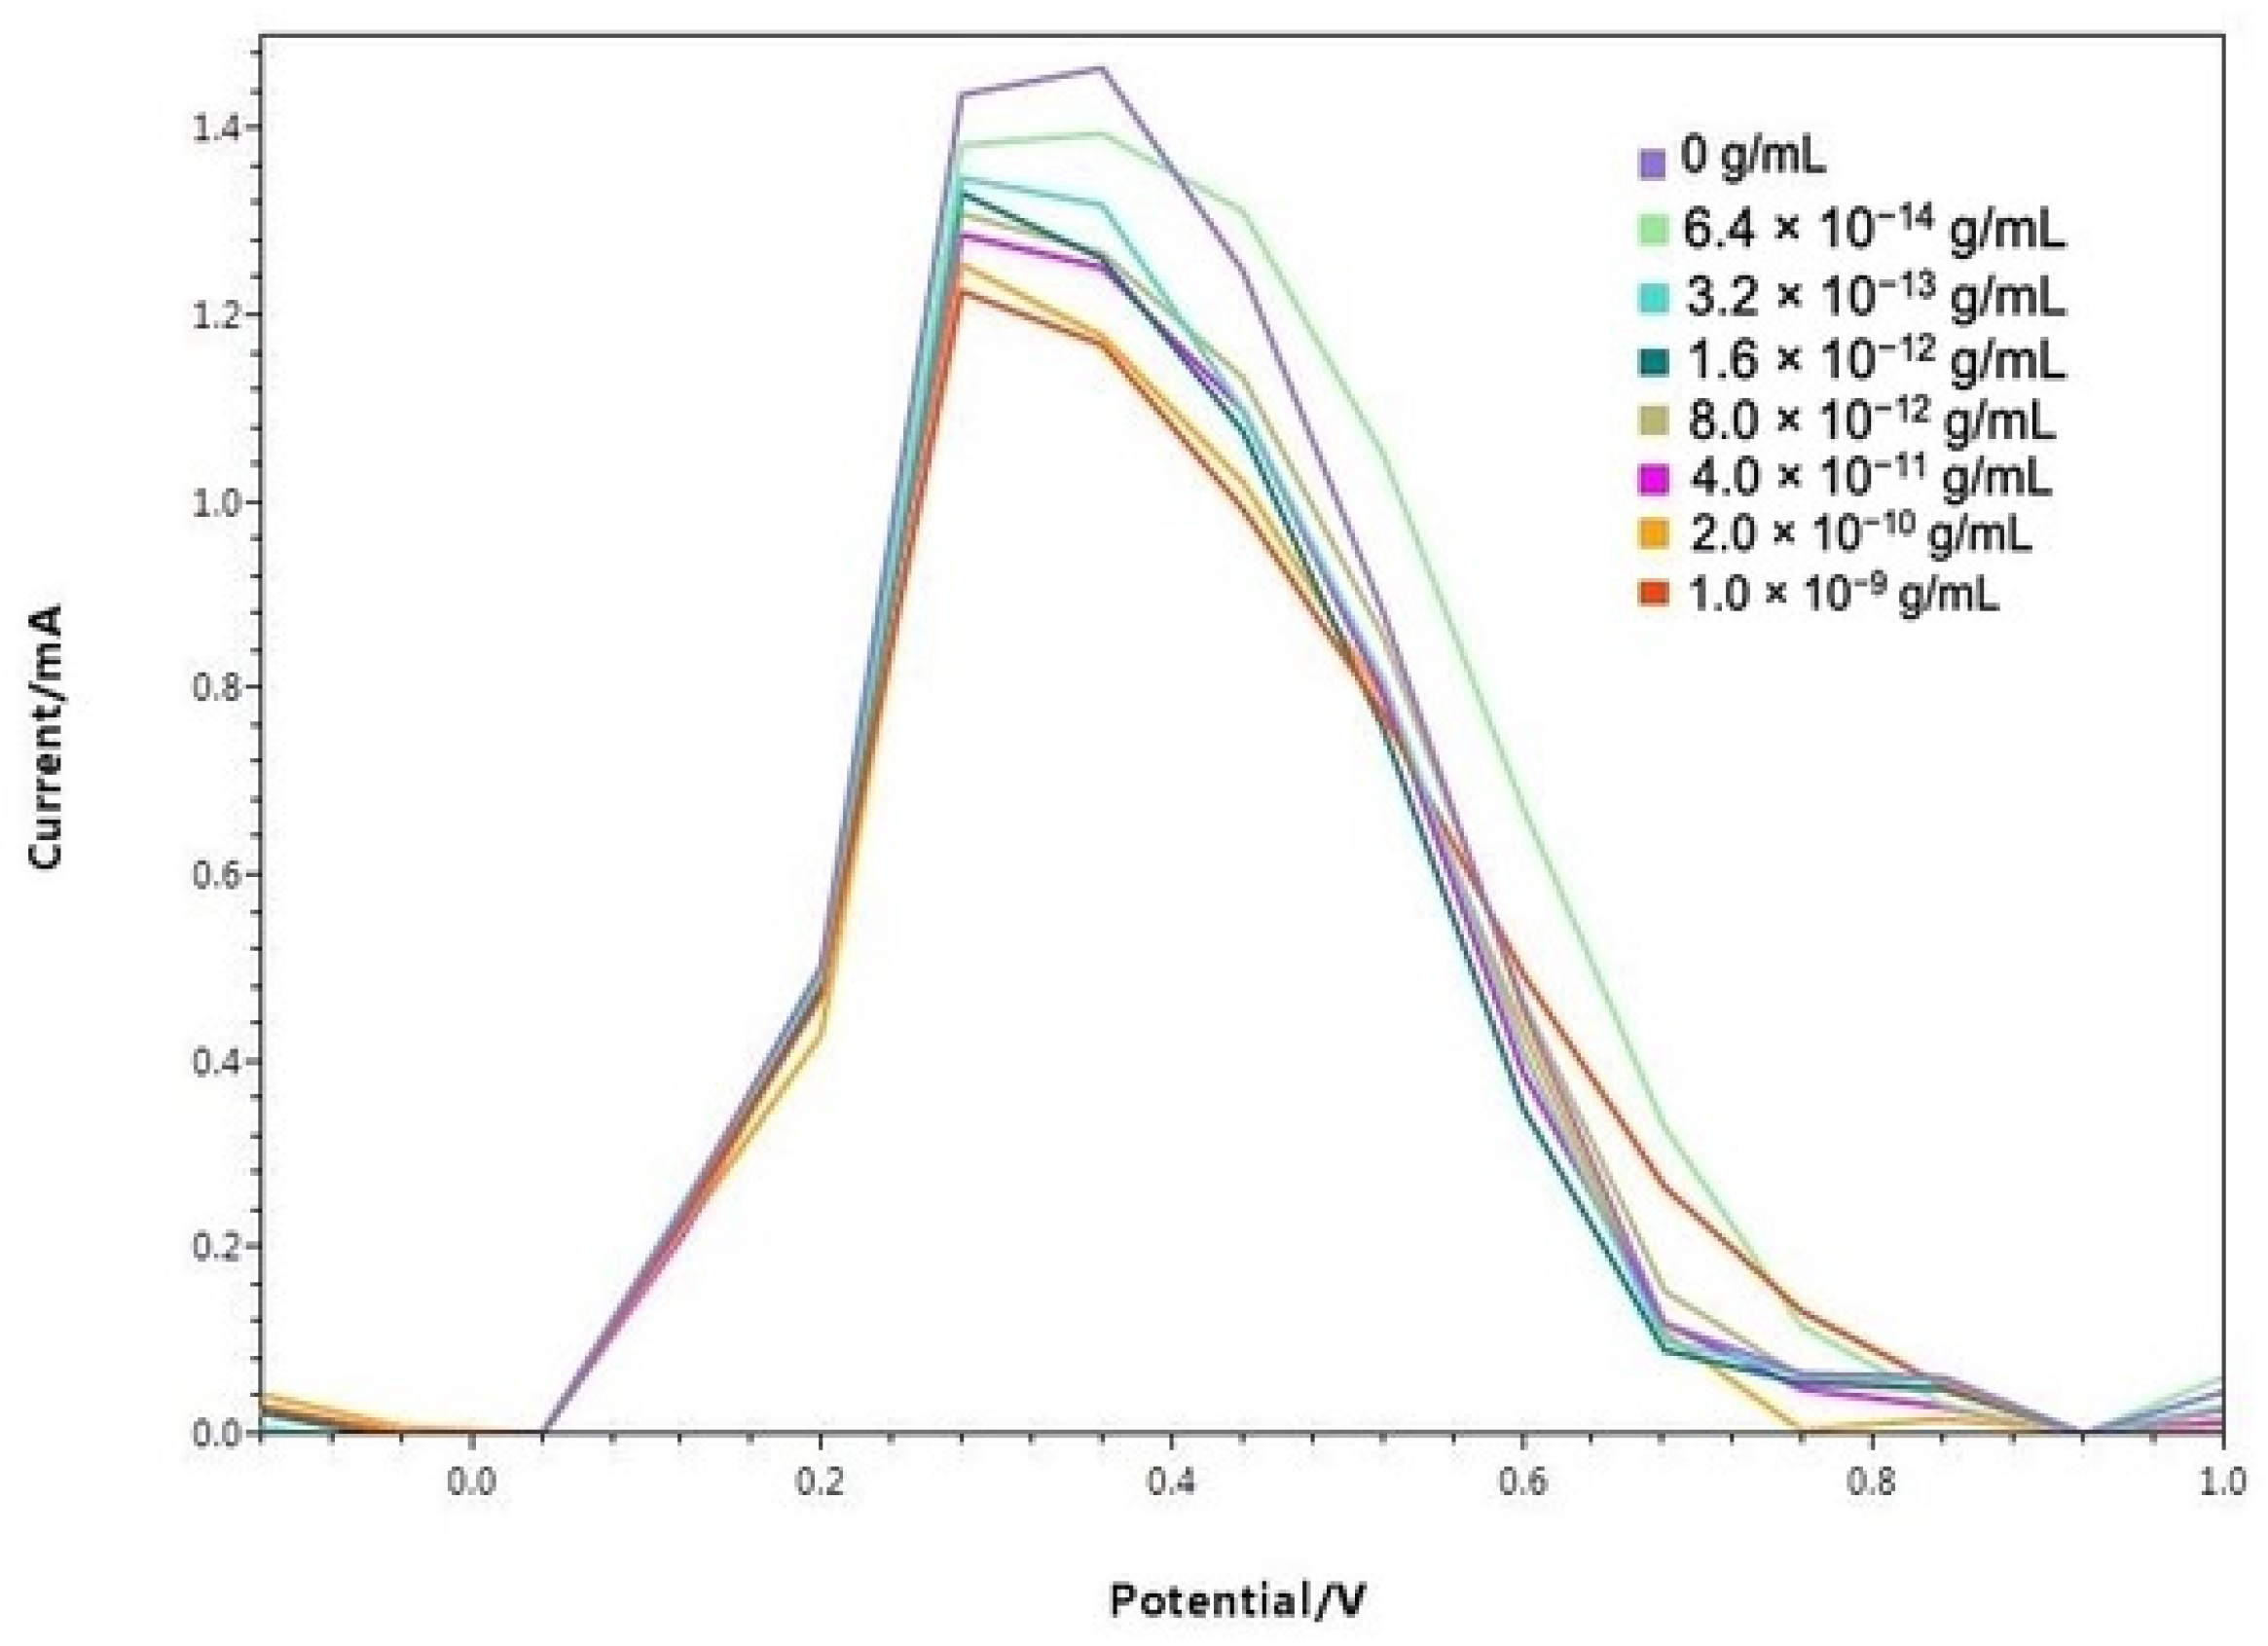
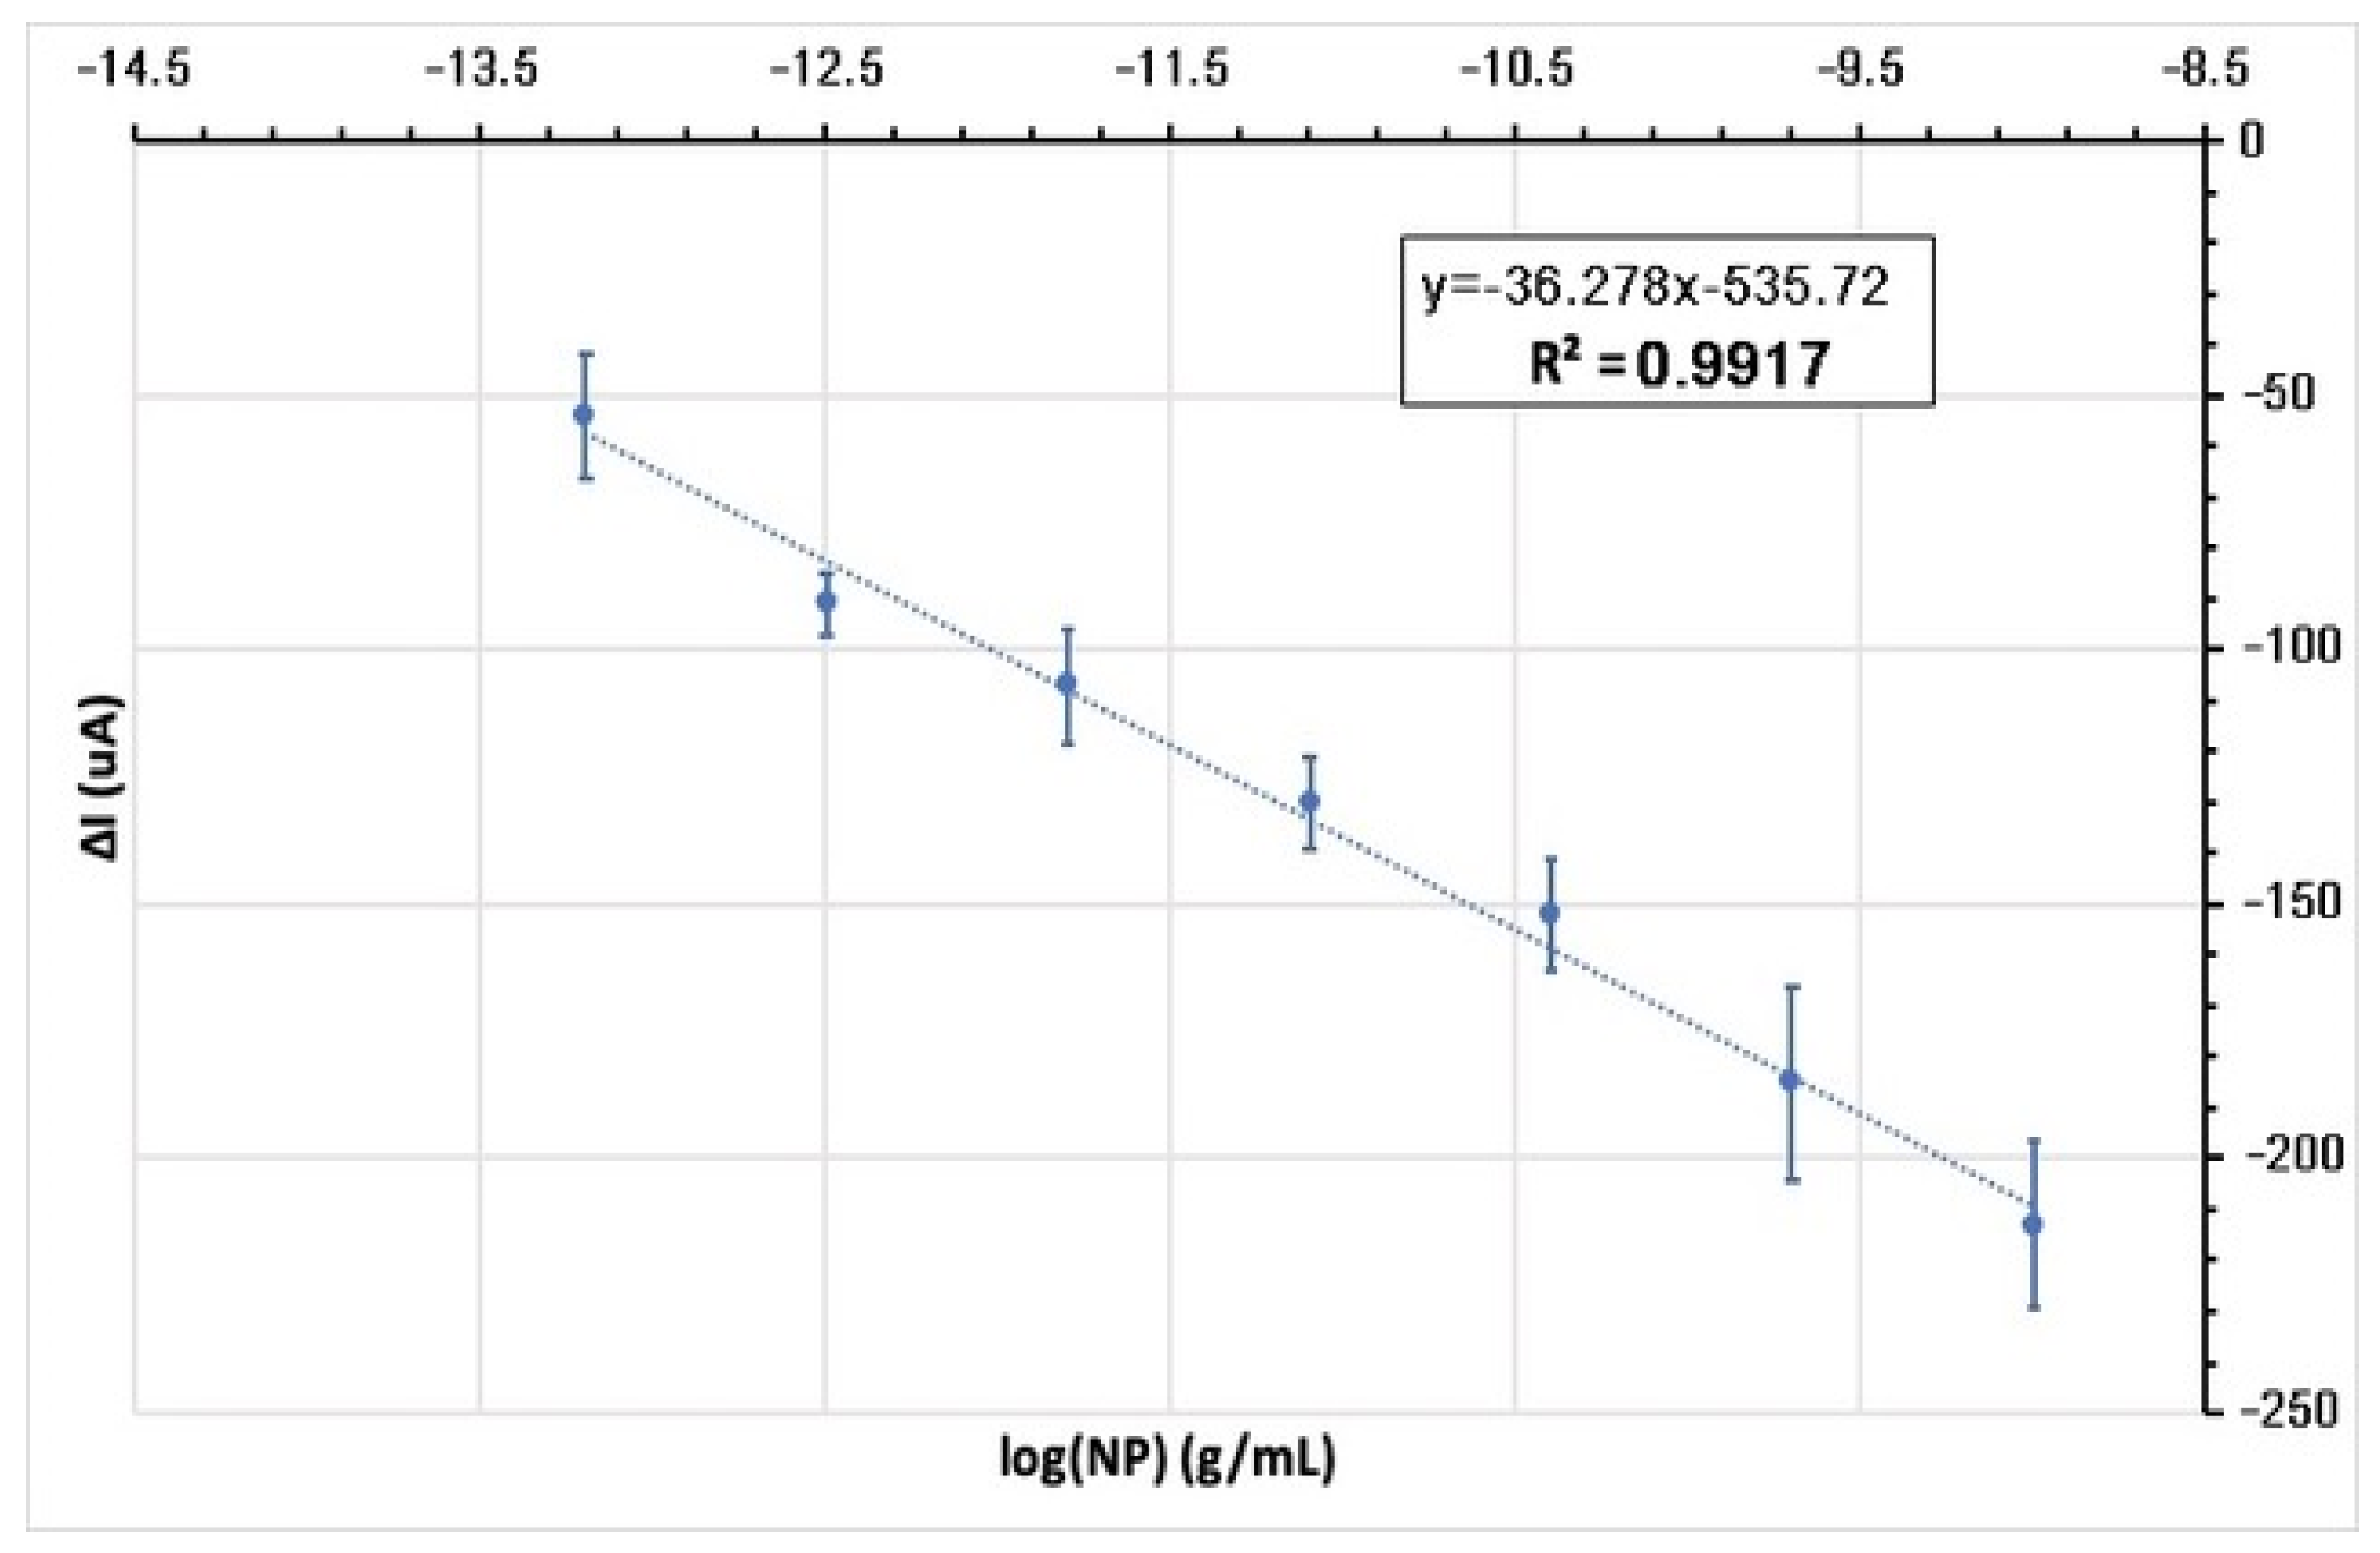
3.3. Antigen Detection by Electrochemical Method

The SWV method was utilized to identify SARS-CoV-2 electrochemically. This technique detects alternate electrochemical analysis stages, such as potassium ferrocyanide and potassium ferricyanide, with excellent sensitivity. This electroanalytic diagnostic approach relies on measuring signal dampening produced by SARS-CoV-2 viral antigen–antibody interaction. As a result, an increase in the analyte’s nucleocapsid protein (NP) generates an inversely corresponding drop in the signal of an Fe ( CN ) 6 3 / 4 redox probe. That is, the antigen–antibody interaction prevents the oxidation-reduction probe from accessing the working electrode surface. In all measurements, device parameters were determined as follows, in accordance with the literature: operating frequency 80.0 Hz, potential amplitude 75.0 mV, and potential step 8.0 mV [41]. First, the effect of the incubation time of the modified electrode on the electrode response at very low NP concentrations of SARS-CoV-2 was evaluated (Figure 5). All experiments were repeated three times with increasing concentrations of NP between 6.4 × 10⁻¹⁴ g/mL and 1 × 10⁻⁹ g/mL. New electrodes were used for each measurement. The findings are given as ΔI = I −   I 0 . Here, I represents the current measured for the working electrode after NP incubation on the electrode surface [Fe(CN)6]3−/4−, and I 0 is the current measured for the working electrode before activating the modified electrode with NP. When the results of SWV analyses were examined, the best analytical sensitivity and linearity were obtained by incubating the antibody-modified electrode and virus antigen for 10 min. The optimum incubation time was determined as 10 min in further experiments.
In Figure 6, square wave voltammetry results of modified electrodes incubated for 10 min at various concentrations of NP in 0.1 M PBS are given. Accordingly, as the NP concentration increases, the SWV response for the redox probe decreases. The reduction in the analytical signal by the particular interaction between antibody modification on the electrode surface and NP is assumed to be the cause of this outcome [34,48]. The binding of the nucleocapsid protein to antibodies on the biosensor surface causes the closure of the electroactive parts on the modified electrode surface and blocking of the SWV signal. As a result, reduction in measured current is considered as a great result, showing SARS-CoV-2’s presence.
The calibration graph of SWV signal suppression obtained at each NP concentration versus the logarithmic function of the NP concentrations is given in Figure 7 (n = 3). According to this graph, the measurements show linearity with a high correlation coefficient (R2 = 0.9917) between 6.4 × 10⁻¹⁴ g/mL and 1 × 10⁻⁹ g/mL NP concentration range.
The limit of detection (LOD) and the limit of quantification (LOQ) of the designed electrode system were calculated by linear regression analysis of the calibration graph. Accordingly, the LOD was calculated as 5.08 × 10⁻¹⁰ g/mL, i.e., 508 pg/mL. The LOQ was calculated as 1.54 × 10⁻⁹ g/mL, i.e., 1.54 ng/mL. As a result, the modified electrode system we designed provides a very precise measurement for the rapid detection of the N protein of the SARS-CoV-2 virus at very low concentrations (even less than nanograms at 1 mL) with a pencil tip, which is a very easily accessible material.
The test time takes 11 min in total, including the incubation time of the modified electrodes with the sample (10 min) and the time taken to take two SWV measurements before and after incubation (1 min). Consequently, the designed diagnostic method offers a fast and inexpensive method for detecting SARS-CoV-2 virus.
According to the results shown in Table 2, the performance of HAP-Cu PGE/SARS-CoV-2 antibody and additional electrochemical perception approaches for SARS-CoV-2 diagnosis has been described. Furthermore, HAP-Cu PGE/SARS-CoV-2 antibody enables high detectability (LOD = 5.08 × 10⁻¹⁰ g/mL), quick testing (11.0 min), and cheap production costs ($1.50 per test). Effectively, our electrochemical detection method made it possible to speed up response time, advance the detection limits, and widen the linear range. Of all of them, we were the lowest cost. In addition, N proteins were used to provide high sensitivity for virus detection.
Our aim was to modify a PGE, which is one of the parts of an electrochemical system based on electrochemical spectroscopy measurement, to be used in the detection of viral structures and to measure its continuous usability. For virus detection, it was ensured that the surface area was increased, and pores were formed by precipitating HAP crystals on the PGEs. The surfaces of the HAP-coated PGEs were processed in the form of copper oxide coating modification in different concentrations. Thus, the pencil graphite electrodes were modified with different concentrations of copper sulphate, different concentrations and proportions of sodium hydroxide, and the micro/nanocrystalline structures were accumulated on the surface of the electrodes in the form of copper oxide. Modified electrodes were examined morphologically with SEM; it was observed that copper oxidizes by depositing HAP crystals on the electrode surface, increasing the targeted surface area, and depositing copper oxides on the electrode surface by attaching to HAP crystals. In the electrochemical characterization part, unmodified PGEs and modified PGEs carried out at different solution concentrations and at different rates were characterized by cyclic voltammetry signals. In these studies, solutions of NaOH 1/1, 1/3, and 1/5 in different concentrations and ratios were used with hydroxyapatite in different concentrations of   CuSO 4 *5 H 2 O, and the best performance was obtained from the electrode CV graphics. COVID-19 virus detection was performed using copper-oxide-modified pencil graphite electrodes after HAP. SARS-CoV-2 nucleocapsid protein was discussed and the calibration graph was drawn with the help of pencil graphite electrodes developed by preparing antigen solutions at different concentrations with the help of phosphate buffer solution.

4. Conclusions

According to the results obtained from the studies, the detection limit (LOD) of the electrode system designed in the antigen detection studies performed with HAP and subsequent copper-oxide-modified pencil graphite electrodes was determined as 5.08 × 10⁻¹⁰ g/mL, and the measurement limit (LOQ) was determined as 1.54 × 10⁻⁹ g/mL. As a result, the modified electrode system we designed provides a very precise measurement for the rapid detection of the NP of the SARS-CoV-2 virus at very low concentrations (even less than nanograms at 1 mL) with a pencil tip, which is a very easily accessible material. Including the incubation time of the modified electrodes with the sample (10 min) and the time taken to take two SWV measurements before and after incubation (1 min), the test takes 11 min in total. That is, the designed diagnostic method offers a fast and inexpensive method for detecting SARS-CoV-2 virus.
Furthermore HAP-Cu PGE/SARS-CoV-2 antibody enables high detectability (LOD = 5.08 × 10⁻¹⁰ g/mL), quick testing (11.0 min), and cheap production costs ($1.50 per test). Effectively, our electrochemical detection method made it possible to speed up response time, advance the detection limits, and widen the linear range. Of all of them, we were the lowest cost. In addition, N proteins were used to provide high sensitivity for virus detection.
With the further development and testing of the system we have created,, there will be a system that works for humanity. As such, people will be able to find out if they have SARS-CoV-2 at home alone without going anywhere. Since the system does not require professional help to use it, anyone can do it, and it is easy to use the system. It saves both time and prevents the spread of infection.

Author Contributions

Conceptualization, E.B.D.; methodology, R.E. and B.B.; validation, R.E., B.B. and E.B.D.; formal analysis, R.E.; investigation, R.E.; resources, R.E.; data curation, R.E.; writ-ing—original draft preparation, R.E.; writing—review and editing, B.B and E.B.D.; visualization, R.E.; su-pervision, E.B.D.; project administration, R.E., B.B., and E.B.D. All authors have read and agreed to the published version of the manuscript.

Funding

This research received no external funding.

Institutional Review Board Statement

Not applicable.

Informed Consent Statement

Not applicable.

Data Availability Statement

Data are contained within the article. The data presented in this study can be requested from the authors.

Conflicts of Interest

The authors declare no conflict of interest.

References

  1. WHO. COVID-19 Weekly Epidemiological Update. Available online: https://www.who.int/publications/m/item/weekly-epidemiological-update-on-covid-19 (accessed on 11 May 2022).
  2. Fung, T.S.; Liu, D.X. Human Coronavirus: Host-Pathogen Interaction. Annu. Rev. Microbiol. 2019, 73, 529–560. [Google Scholar] [CrossRef] [PubMed] [Green Version]
  3. Docea, A.O.; Tsatsakis, A.; Albulescu, D.; Cristea, O. A new threat from an old enemy: Re-emergence of coronavirus. Int. J. Mol. Med. 2020, 45, 1631–1643. [Google Scholar] [CrossRef] [PubMed] [Green Version]
  4. Florindo, H.F.; Kleiner, R.; Vaskovich-Koubi, D.; Acurcio, R.C.; Carreira, B.; Yeini, E.; Tiram, G.; Liubomirski, Y.; Satchi-Fainaro, R. Immune-mediated approaches against COVID-19. Nat. Nanotechnol. 2020, 15, 630–645. [Google Scholar] [CrossRef] [PubMed]
  5. Paules, C.I.; Marston, H.D.; Fauci, A. Coronavirus Infections—More Than Just the Common Cold. JAMA 2020, 323, 707–708. [Google Scholar] [CrossRef] [PubMed] [Green Version]
  6. Leung, N. Transmissibility and transmission of respiratory viruses. Nat. Rev. Microbiol. 2021, 19, 528–545. [Google Scholar] [CrossRef]
  7. Prather, K.A.; Wang, C.C.; Schooley, R.T. Reducing transmission of SARS-CoV-2. Science 2020, 368, 1422–1424. [Google Scholar] [CrossRef]
  8. Huang, C.; Wang, Y.; Li, X.; Ren, L.; Zhao, J.; Hu, Y.; Zhang, L.; Fan, G.; Xu, J.; Gu, X.; et al. Clinical features of patients infected with 2019 novel coronavirus in Wuhan, China. Lancet 2020, 395, 497–506. [Google Scholar] [CrossRef] [Green Version]
  9. Lu, H.; Stratton, C.W.; Tang, Y.-W. Outbreak of pneumonia of unknown etiology in Wuhan, China: The mystery and the miracle. J. Med. Virol. 2020, 92, 401. [Google Scholar] [CrossRef] [Green Version]
  10. To, K.K.-W.; Tsang, O.T.-Y.; Yip, C.C.-Y.; Chan, K.-H.; Wu, T.-C.; Chan, J.M.-C.; Leung, W.-S.; Chik, T.S.-H.; Choi, C.Y.-C.; Kandamby, D.H.; et al. Consistent Detection of 2019 Novel Coronavirus in Saliva. Clin. Infect. Dis. 2020, 71, 841–843. [Google Scholar] [CrossRef] [Green Version]
  11. Vashist, S.K. In Vitro Diagnostic Assays for COVID-19: Recent Advances and Emerging Trends. Diagnostics 2020, 10, 202. [Google Scholar] [CrossRef]
  12. Lan, J.; Ge, J.; Yu, J.; Shan, S.; Zhou, H.; Fan, S.; Zhang, Q.; Shi, X.; Wang, Q.; Zhang, L.; et al. Structure of the SARS-CoV-2 spike receptor-binding domain bound to the ACE2 receptor. Nature 2020, 581, 215–220. [Google Scholar] [CrossRef] [PubMed] [Green Version]
  13. Wang, Q.; Zhang, Y.; Wu, L.; Niu, S.; Song, C.; Zhang, Z.; Lu, G.; Qiao, C.; Hu, Y.; Yuen, K.-Y.; et al. Structural and Functional Basis of SARS-CoV-2 Entry by Using Human ACE2. Cell 2020, 181, 894–904.e9. [Google Scholar] [CrossRef] [PubMed]
  14. Wang, M.-Y.; Zhao, R.; Gao, L.-J.; Gao, X.-F.; Wang, D.-P.; Gallagher, T.-M. SARS-CoV-2: Structure, Biology, and Structure-Based Therapeutics Development. Front. Cell. Infect. Microbiol. 2020, 10, 587269. [Google Scholar] [CrossRef] [PubMed]
  15. Mariano, G.; Farthing, R.J.; Lale-Farjat, S.L.M.; Bergeron, J.R.C. Structural Characterization of SARS-CoV-2: Where We Are, and Where We Need to Be. Front. Mol. Biosci. 2020, 7, 605236. [Google Scholar] [CrossRef]
  16. Chen, Y.; Liu, Q.; Guo, D. Emerging coronaviruses: Genome structure, replication, and pathogenesis. J. Med. Virol. 2020, 92, 418–423. [Google Scholar] [CrossRef] [Green Version]
  17. McBride, R.; van Zyl, M.; Fielding, B.C. The coronavirus nucleocapsid is a multifunctional protein. Viruses 2014, 6, 2991–3018. [Google Scholar] [CrossRef] [Green Version]
  18. Garcia, J.; Mendoza-Ramirez, J.; Fernandez-Benavides, D.; Roa-Velazquez, D.; Filisola-Villasenor, J.; Martinez-Frias, S.P.; Sanchez-Salguero, E.S.; Miguel-Rodriguez, C.E.; Maravillas Montero, J.L.; Torres-Ruiz, J.J.; et al. Recombinant Protein Expression and Purification of N, S1, and RBD of SARS-CoV-2 from Mammalian Cells and Their Potential Applications. Diagnostics 2021, 11, 1808. [Google Scholar] [CrossRef]
  19. Burbelo, P.D.; Riedo, F.X.; Morishima, C.; Rawlings, S.; Smith, D.; Das, S.; Strich, J.R.; Chertow, D.S.; Davey, R.T., Jr.; Cohen, J.I. Sensitivity in Detection of Antibodies to Nucleocapsid and Spike Proteins of Severe Acute Respiratory Syndrome Coronavirus 2 in Patients with Coronavirus Disease 2019. J. Infect. Dis. 2020, 222, 206–213. [Google Scholar] [CrossRef]
  20. Wu, J.; Liang, B.; Chen, C.; Wang, H.; Fang, Y.; Shen, S.; Yang, X.; Wang, B.; Chen, L.; Chen, Q.; et al. SARS-CoV-2 infection induces sustained humoral immune responses in convalescent patients following symptomatic COVID-19. Nat. Commun. 2021, 12, 1813. [Google Scholar] [CrossRef]
  21. Huang, Y.; Yang, C.; Xu, X.-F.; Xu, W.; Liu, S.-W. Structural and functional properties of SARS-CoV-2 spike protein: Potential antivirus drug development for COVID-19. Acta Pharmacol. Sin. 2020, 41, 1141–1149. [Google Scholar] [CrossRef]
  22. Udugama, B.; Kadhiresan, P.; Kozlowski, H.N.; Malekjahani, A.; Osborne, M.; Li, V.Y.C.; Chen, H.; Mubareka, S.; Gubbay, J.B.; Chan, W.C.W. Diagnosing COVID-19: The Disease and Tools for Detection. ACS Nano 2020, 14, 3822–3835. [Google Scholar] [CrossRef] [PubMed] [Green Version]
  23. Weiss, C.; Carriere, H.; Fusco, I. Toward Nanotechnology-Enabled Approaches against the COVID-19 Pandemic. ACS Nano 2020, 14, 6383–6406. [Google Scholar] [CrossRef] [PubMed]
  24. Bukkitgar, S.D.; Shetti, N.P.; Aminabhavi, T.M. Electrochemical investigations for COVID-19 detection—A comparison with other viral detection methods. Chem. Eng. J. 2021, 420 Pt 2, 127575. [Google Scholar] [CrossRef] [PubMed]
  25. Rai, M.; Bonde, S.; Yadav, A.; Plekhanova, Y.; Reshetilov, A.; Gupta, I.; Golinska, P.; Pandit, R.; Ingle, A.P. Nanotechnology-based promising strategies for the management of COVID-19: Current development and constraints. Expert Rev. Anti Infect. Ther. 2022, 20, 1299–1308. [Google Scholar] [CrossRef]
  26. Wu, J.; Liu, J.; Li, S.; Peng, Z.; Xiao, Z.; Wang, X.; Yan, R.; Luo, J. Detection and analysis of nucleic acid in various biological samples of COVID-19 patients. Travel Med. Infect. Dis. 2020, 37, 101673. [Google Scholar] [CrossRef]
  27. Khan, M.Z.H.; Hasan, M.R.; Hossain, S.I.; Ahommed, M.S.; Daizy, M. Biosensors and Bioelectronics Ultrasensitive detection of pathogenic viruses with electrochemical biosensor: State of the art. Biosens. Bioelectron. 2020, 166, 112431. [Google Scholar] [CrossRef]
  28. Li, H.; Liu, X.; Li, L.; Mu, X.; Genov, R.; Mason, A.J. CMOS Electrochemical Instrumentation for Biosensor Microsystems: A Review. Sensors 2016, 17, 74. [Google Scholar] [CrossRef]
  29. Zheng, H.; Ma, X.; Chen, L.; Lin, Z.; Guo, L.; Qiu, B.; Chen, G. Analytical Methods sequence-specific recognition of double-stranded DNA. Anal. Methods 2013, 5, 5005–5009. [Google Scholar] [CrossRef]
  30. Cho, I.; Kim, D.H.; Park, S. Electrochemical biosensors: Perspective on functional nanomaterials for on-site analysis. Biomater. Res. 2020, 24, 1–12. [Google Scholar] [CrossRef] [Green Version]
  31. Cihangiroğlu, B.S. Malzemelerin, Uyuşturucuların/Bağımlılık Yapan (Pge’ler), Test Edilmesi/Analizi İçin Mikro/Nano Platformlar Olarak Yüzey Modifiye Kalem Grafit Elektrotlar. Master’s Thesis, Baskent University, Ankara, Turkey, 2021. [Google Scholar]
  32. Pandey, A.; Sharma, S.; Jain, R.; Raja, A. Review—Pencil Graphite Electrode: An Emerging Sensing Material. J. Electrochem. Soc. 2020, 167, 037501. [Google Scholar] [CrossRef]
  33. Cesewski, E.; Johnson, B.N. Biosensors and Bioelectronics Electrochemical biosensors for pathogen detection. Biosens. Bioelectron. 2020, 159, 112214. [Google Scholar] [CrossRef] [PubMed]
  34. De Lima, L.F.; Ferreira, A.L.; Torres, M.D.T.; De Araujo, W.R. Minute-scale detection of SARS-CoV-2 using a low-cost biosensor composed of pencil graphite electrodes. Proc. Natl. Acad. Sci. USA 2021, 118, e2106724118. [Google Scholar] [CrossRef] [PubMed]
  35. Yalçın, E. Sulardan Ağır Metal Giderimi İçin Nanofibriler Filtrelerin Hazırlanması ve Karakterizasyonu (The Preparatıon and Characterızatıon of Nanofıber Fılters for Removal Heavy Metal from Waste Water). Master’s Thesis, Hacettepe University, Ankara, Turkey, 2012. [Google Scholar]
  36. Yayehrad, A.T.; Siraj, E.A.; Wondie, G.B.; Alemie, A.A.; Derseh, M.T.; Ambaye, A.S. Could Nanotechnology Help to End the Fight Against COVID-19? Review of Current Findings, Challenges and Future Perspectives. Int. J. Nanomed. 2021, 16, 5713. [Google Scholar] [CrossRef] [PubMed]
  37. Voon, C.H.; Sam, S.T. Physical Surface Modification on the Biosensing Surface; Elsevier: Amsterdam, The Netherlands, 2018. [Google Scholar]
  38. García, A.; Rodriguez, B.; Giraldo, H.; Quintero, Y.; Quezada, R.; Hassan, N.; Estay, H. Copper-Modified Polymeric Membranes for Water Treatment: A Comprehensive Review. Membranes 2021, 11, 93. [Google Scholar] [CrossRef]
  39. Das, G.; Yoon, H.H. Spherulitic copper—Copper oxide nanostructure—Based highly sensitive nonenzymatic glucose sensor. Int. J. Nanomed. 2015, 10, 165–178. [Google Scholar] [CrossRef] [Green Version]
  40. Hakiki, A.; Kerbadou, R.M.; Boukoussa, B.; Zahmani, H.H.; Launay, F.; Pailleret, A.; Pillier, F.; Hacini, S.; Bengueddach, A.; Hamacha, R. Catalytic behavior of copper—Amine complex supported on mesoporous silica SBA-15 toward mono-Aza-Michael addition: Role of amine groups. J. Inorg. Organomet. Polym. Mater. 2019, 29, 1773–1784. [Google Scholar] [CrossRef]
  41. Gawande, M.B.; Goswami, A.; Felpin, F.X.; Asefa, T.; Huang, X.; Silva, R.; Zou, X.; Zboril, R.; Varma, R.S. Cu and Cu-Based Nanoparticles: Synthesis and Applications in Catalysis. Chem. Rev. 2016, 116, 3722–3811. [Google Scholar] [CrossRef] [Green Version]
  42. Dessie, Y.; Tadesse, S.; Eswaramoorthy, R. Surface Roughness and Electrochemical Performance Properties of Biosynthesized α-MnO2/NiO-Based Polyaniline Ternary Composites as Efficient Catalysts in Microbial Fuel Cells. J. Nanomater. 2021, 2021, 7475902. [Google Scholar] [CrossRef]
  43. Vermisoglou, E. Human virus detection with graphene-based materials. Biosens. Bioelectron. 2020, 166, 112436. [Google Scholar] [CrossRef]
  44. Rangel, W.M.; Santa, R.A.; Riella, H.G. A facile method for synthesis of nanostructured copper (II) oxide by coprecipitation. J. Mater. Res. Technol. 2020, 9, 994–1004. [Google Scholar] [CrossRef]
  45. Elgrishi, N.; Rountree, K.J.; McCarthy, B.D.; Rountree, E.S.; Eisenhart, T.T.; Dempsey, J.L. A practical beginner’s guide to cyclic voltammetry. J. Chem. Educ. 2018, 95, 197–206. [Google Scholar] [CrossRef]
  46. Tanimoto, S.; Ichimura, A. Discrimination of inner- and outer-sphere electrode reactions by cyclic voltammetry experiments. J. Chem. Educ. 2013, 90, 778–781. [Google Scholar] [CrossRef]
  47. Vural, T.; Yaman, Y.T.; Ozturk, S.; Abaci, S.; Denkbas, E.B. Electrochemical immunoassay for detection of prostate specific antigen based on peptide nanotube-gold nanoparticle-polyaniline immobilized pencil graphite electrode. J. Colloid Interface Sci. 2018, 510, 318–326. [Google Scholar] [CrossRef]
  48. Yang, J.; Petitjean, S.J.L.; Koehler, M.; Zhang, Q.; Dumitru, A.C.; Chen, W.; Derclaye, S.; Vincent, S.P.; Soumillion, P.; Alsteens, D. Molecular interaction and inhibition of SARS-CoV-2 binding to the ACE2 receptor. Nat. Commun. 2020, 12, 2996. [Google Scholar] [CrossRef] [PubMed]
  49. Chaibun, T.; Puenpa, J.; Ngamdee, T.; Boonapatcharoen, N.; Athamanolap, P.; O’Mullane, A.P.; Vongpunsawad, S.; Poovorawan, Y.; Lee, S.Y.; Lertanantawong, B. Rapid electrochemical detection of coronavirus SARS-CoV-2. Nat. Commun. 2021, 12, 802. [Google Scholar] [CrossRef] [PubMed]
  50. Yakoh, A.; Pimpitak, U.; Rengpipat, S.; Hirankarn, N.; Chailapakul, O.; Chaiyo, S. Paper-based electrochemical biosensor for diagnosing COVID-19: Detection of SARS-CoV-2 antibodies and antigen. Biosens. Bioelectron. 2021, 176, 112912. [Google Scholar] [CrossRef] [PubMed]
  51. Fabiani, L.; Saroglia, M.; Galata, G.; de Santis, R.; Fillo, S.; Luca, V.; Faggioni, G.; D’Amore, N.; Regalbuto, E.; Salvatori, P.; et al. Magnetic beads combined with carbon black-based screen-printed electrodes for COVID-19: A reliable and miniaturized electrochemical immunosensor for SARS-CoV-2 detection in saliva. Biosens. Bioelectron. 2021, 171, 112686. [Google Scholar] [CrossRef]
  52. Zhao, H.; Liu, F.; Xie, W.; Zhou, T.-C.; OuYang, J.; Jin, L.; Li, H.; Zhao, C.-Y.; Zhang, L.; Wei, J.; et al. Ultrasensitive supersandwich-type electrochemical sensor for SARS-CoV-2 from the infected COVID-19 patients using a smartphone. Sens. Actuators B Chem. 2021, 327, 128899. [Google Scholar] [CrossRef]
  53. Eissa, S.; Zourob, M. Development of a low-cost cotton-tipped electrochemical immunosensor for the detection of SARS-CoV-2. Anal. Chem. 2021, 93, 1826–1833. [Google Scholar] [CrossRef]
Figure 1. Steps of functionalization of pencil graphite electrodes modified with hydroxyapatite and copper oxide with COVID-19 nucleocapsid antibody.
Applsci 12 12971 g001
Figure 2. SEM images of (a) unmodified PGE at 300× and (b) 80,000×, EDX image of (c) PGE at 1300×. SEM images of (d) HAP-modified PGE at 300× and (e) at 20,000×. EDX image of (f) HAP-modified PGE at 12,000×. SEM images of (g) HAP- and copper-oxide-modified PGE at 300× and (h) at 400×. EDX image of (i) HAP- and copper-oxide-modified-PGE at 3000×.
Applsci 12 12971 g002
Figure 3. CV analysis of unmodified PGE and (a) HAP-PGE modified in 0.05 M CuSO 4 and different concentrations of NaOH; (b) HAP-PGE modified in 0.1 M CuSO 4 and different concentrations of NaOH; (c) HAP-PGE modified in 0.2 M CuSO 4 and different concentrations of NaOH; (d) HAP-PGE modified in 0.3 M CuSO 4 and different concentrations of NaOH; (e) HAP-PGE modified in 0.5 M CuSO 4 and different concentrations of NaOH; (f) HAP-PGE modified in 0.7 M CuSO 4 and different concentrations of NaOH; and (g) HAP-PGE modified in 1 M CuSO 4 and different concentrations of NaOH.
Applsci 12 12971 g003aApplsci 12 12971 g003b
Figure 4. Cyclic voltammograms of unmodified and modified PGE with HAP and CuO in 2.0 mM FeCl3 in 1.0 M HCl with a scan rate of 10 mV s−1.
Applsci 12 12971 g004
Figure 5. Graph of SWV current suppression (∆I) of the modified electrodes incubated in the range of 6.4 × 10⁻¹⁴ g/mL to 1 × 10⁻⁹ g/mL at different NP concentrations and at different times (1, 5, and 10 min).
Applsci 12 12971 g005
Figure 6. Baseline corrected square wave voltammetries of modified electrodes incubated for 10 min at different NP concentrations.
Applsci 12 12971 g006
Figure 7. Calibration graph: linear technique of analysis of the recorded current signal suppression (ΔI) analytical curve of modified electrodes incubated in different NP concentration for 10 min plotted against the logarithmic function of NP concentrations.
Applsci 12 12971 g007
Table 1. Concentrations and ratios of CuSO 4 *5 H 2 O and NaOH for electrode modification.
C u S O 4 * 5 H 2 O
Concentrations
NaOH ConcentrationsRatio
0.05 M0.05 M
0.1 M
0.3 M
0.5 M
1 M
1:11:31:5
0.1 M0.05 M
0.1 M
0.3 M
0.5 M
1 M
1:11:31:5
0.2 M0.05 M
0.1 M
0.3 M
0.5 M
1 M
1:11:31:5
0.3 M0.05 M
0.1 M
0.3 M
0.5 M
1 M
1:11:31:5
0.5 M0.05 M
0.1 M
0.3 M
0.5 M
1 M
1:11:31:5
0.7 M0.05 M
0.1 M
0.3 M
0.5 M
1 M
1:11:31:5
1 M0.05 M
0.1 M
0.3 M
0.5 M
1 M
1:11:31:5
Table 2. Comparison with previously developed electrochemical SARS-CoV-2 sensors in the literature.
SensorLODGoalElectro-ChemicalLinear RangeTime (min)Reference
HAP-Cu PGE/SARS-CoV-2 antibody5.08 × 10−10 g/mLN-ProteinSWV6.4 ×10−14 ile 1 × 10⁻⁹ g/mL11.0This study
LEAD1.96 × 10−13 g/mLSPSWV1 × 10−14–1 × 10⁻⁹ g/mL6.5[34]
Multiplex RCA1 copy/μLN ve S geneDPV1–1 × 10⁹ copy/μL31.0[49]
Paper/GO/SARS-CoV-2 antibody9.6 × 10−10 g/mLSARS-CoV-2 IgG ve IgMSWV1 × 10−9–1 × 10⁻⁶ g/mL46.0[50]
SPE/CB/SARS-CoV-2 antibody19 × 10−9 g/mLN ve S proteinDPV0.5 × 10−4–20 × 10−6 g/mL31.0[51]
Au@SCX8-TB-RGO-LP- Target/Au@Fe3O4200 copies/mLSARS-CoV-2 RNADPV1 × 10−17–10−12 mol/L180.0[52]
Cotton-tipped electrode/SARS-CoV-2 antibody8.0 × 10−13 g/mLN proteinSWV1 × 10−12–1 × 10⁻⁶ g/mL21.0[53]
Publisher’s Note: MDPI stays neutral with regard to jurisdictional claims in published maps and institutional affiliations.

