Article

Lower Bound Limit Analysis of Non-Persistent Jointed Rock Masses Using Mixed Numerical Discretization

1
Kunming Prospecting Design Institute, China Nonferrous Metals Industry Co., Ltd., Kunming 650051, China
2
Yunnan Key Laboratory of Geotechnical Engineering and Geohazards, Kunming 650051, China
3
Faculty of Civil Engineering and Mechanics, Kunming University of Science and Technology, Kunming 650500, China
*
Author to whom correspondence should be addressed.
Appl. Sci. 2022, 12(24), 12945; https://doi.org/10.3390/app122412945
Submission received: 9 November 2022 / Revised: 13 December 2022 / Accepted: 13 December 2022 / Published: 16 December 2022
(This article belongs to the Special Issue Urban Underground Engineering: Excavation, Monitoring, and Control)

Abstract

:
The bearing capacity of a non-persistent jointed rock mass containing a rock bridge is investigated by combining the lower bound limit analysis theory, a mixed numerical discrete method, and linear mathematical programming. A mixed numerical discrete method is proposed to divide non-persistent jointed rock masses in which rigid block elements are used to simulate the rock blocks, whereas the finite element method is used to simulate the intact rock bridges. A linear mathematical programming model for the ultimate bearing capacity is constructed and solved using the interior point algorithm. The proposed formulation is validated by application to three rock slopes.

1. Introduction

The presence of joints in rocks is a common feature of rock masses. Such joints usually have a significant effect on the rock mass strength and deformation [1,2]. The joint persistency is non-continuous and is one of the most important geometrical parameters in a rock mass. There are different structural characteristics of rock masses due to differences in joint persistency. The mechanical behavior of a rock mass with non-persistent joints is controlled by complex interactions of joints and intact rock bridges. The rock mass is cut into rock blocks by fully persistent joints, which have discontinuous medium characteristics. In contrast, shear and tensile failure always occur in rock bridges formed by non-persistent joints, which is a typical continuous medium characteristic. The bearing capacity of the non-persistent jointed rock masses mainly depends on the geological characteristics of the joints, such as their strength and the mechanical properties of rock bridges. Thus, estimating the bearing capacity of non-persistent jointed rock masses is one of the most challenging tasks in rock engineering.
Many studies have been conducted to analyze the bearing capacity of jointed rock masses using various approaches. Limit equilibrium methods, which have a simple principle and reliable solutions [3,4,5,6], have been widely applied to rock slope stability analysis of persistent joints. However, because of their unreasonable assumptions, these methods are only suitable for analyzing simple failure modes or homogeneous rock masses in which discontinuities play a minor role.
With the development of computational mechanics and computational resources, many numerical methods have been proposed to investigate rock masses. Among these methods, the finite element method (FEM) [7,8,9] and finite difference method (FDM) [10] have been widely applied to jointed rock-bearing capacity analysis. However, these methods are not suitable for modeling the faults and joints in a rock mass. The distinct element method (DEM) or discontinuous deformation analysis (DDA) can capture the failure modes of jointed rock slopes with different arrangements of joints using discontinued formulations [11,12,13]. However, there are still difficulties in modeling a complex network of joints and the complex constitutive relations of rock materials and discontinuity surfaces. Block theory, which is a block identification method based on combinatorial topology concepts [14], was recently used as a new numerical method for considering a jointed rock mass. Block theory can efficiently solve the removability and stability problems of simple non-persistent jointed rock blocks under various engineering conditions [15,16]. As such, block theory has been developed and widely applied in rock slope engineering [17].
Plastic limit analysis theory is a powerful tool for efficiently analyzing the bearing capacity in soil and rock mechanics with high accuracy. This method focuses on seeking analytical solutions, and as such, it can only treat classical geotechnical problems with simple structures [18,19], as it is difficult to apply this method to build statically admissible stress fields and kinematically admissible velocity fields for large-scale and complex structures. Thus, a numerical approach to plastic limit analysis was developed. Plastic limit numerical analysis combines the lower bound theorem, the finite element discretization technique, and linear programming [20] and has been widely applied in soil mechanics [21,22,23], stability analysis of soil slopes [19,24,25,26], the bearing capacity of jointed rocks [27,28,29], and stability analysis of rock slopes [15,16,30]. These studies demonstrate that plastic limit numerical analysis is a valid approach to investigating the bearing capacity of geotechnical structures. However, almost all studies have only considered the soil slope, soil foundation, and simple rock slope. Little attention has been paid to non-persistent jointed rocks, because there are still technical difficulties in establishing statically admissible stress fields or kinematically admissible velocity fields of non-persistent jointed rock masses.
As mentioned, non-persistent jointed rock mass has the dual mechanics characteristics of continuity and discontinuity because of the co-existence of the joints and the rock bridge. Current methods cannot accurately simulate the dual mechanics characteristics of non-persistent jointed rock. This is the motivation of this study, in which the authors propose to develop and apply ultimate bearing capacity evaluation methods that can simulate not only the failure of rock blocks but also the destruction of rock bridges.
The aim of this study was to present a numerical method for establishing statically admissible stress fields and calculating the ultimate bearing capacity of a non-persistent jointed rock mass. The numerical formulation of the lower bound limit theorem is developed for this purpose. Mixed numerical discrete methods, including the rigid block method for rock blocks and the linear triangular finite element method for rock bridges, are used first to separate the non-persistent jointed rock mass. Taking the load multiplier as the objective function, a linear mathematical programming model is then established based on the lower bound theorem, which satisfies the equilibrium equations, to yield conditions and static boundary conditions. Finally, solution strategies of the optimization models are developed to solve for the load multiplier and the strength reserve coefficient of the rock mass. One major advantage of this study is that it can simultaneously simulate the dual mechanics characteristics of the continuity and discontinuity for the non-persistent jointed rock.

2. Fundamental Theory and General Assumptions

The limit state is the condition in which there is a failure mechanism in the structure interior, and it is the critical state of the structure at the boundary with and without destruction. According to the lower bound theorem, a load related to a statically admissible stress field will not exceed the true collapse load of the structure. A statically admissible stress field should meet the following three conditions: (a) equilibrium condition; (b) yield condition; and (c) boundary condition. The ultimate aim of the lower bound limit analysis is to determine the maximum of the collapse load.
To apply the lower bound theorem and simplify the calculation, the following assumptions must be made in this study: (a) The rock block cut by fully persistent joints is a rigid body, and it does not produce any deformation or destruction. Failure only occurs in the joint surfaces between the adjacent rock blocks. Furthermore, the rock bridges are isotropic and only subject to shear failure. (b) The material of the joints and rock bridges optimizes the plasticity and obeys the Mohr–Coulomb yield condition based on plane strain theory. (c) All deformations or changes in the geometry of the rock mass at the limit load are small and negligible; and (d) only the sliding failure of the rock mass is considered, whereas rotational failure is not considered.

3. Mixed Numerical Discretization

For lower bound solutions, a statically admissible stress field of the jointed rock mass is assumed. Over the past few decades, numerical methods, such as the FEM [21,23,24], the rigid finite element method [26,30], and the rigid block method [28,31,32], together with mathematical programming techniques, have been developed and applied to solve limit analysis problems. In general, the strategies of these methods differ in terms of the numerical discretization and the assumptions made about the equilibrium equations and yield conditions. For the dual mechanical characteristics of the continuity and discontinuity of the non-persistent jointed rock mass, discrete methods are not suitable for establishing the statically admissible stress fields. A mixed numerical discretization of the lower bound limit analysis is then required and developed, in which the rigid block elements are used to simulate the rock blocks, and the finite element method is used to simulate the rock bridges (see Figure 1).
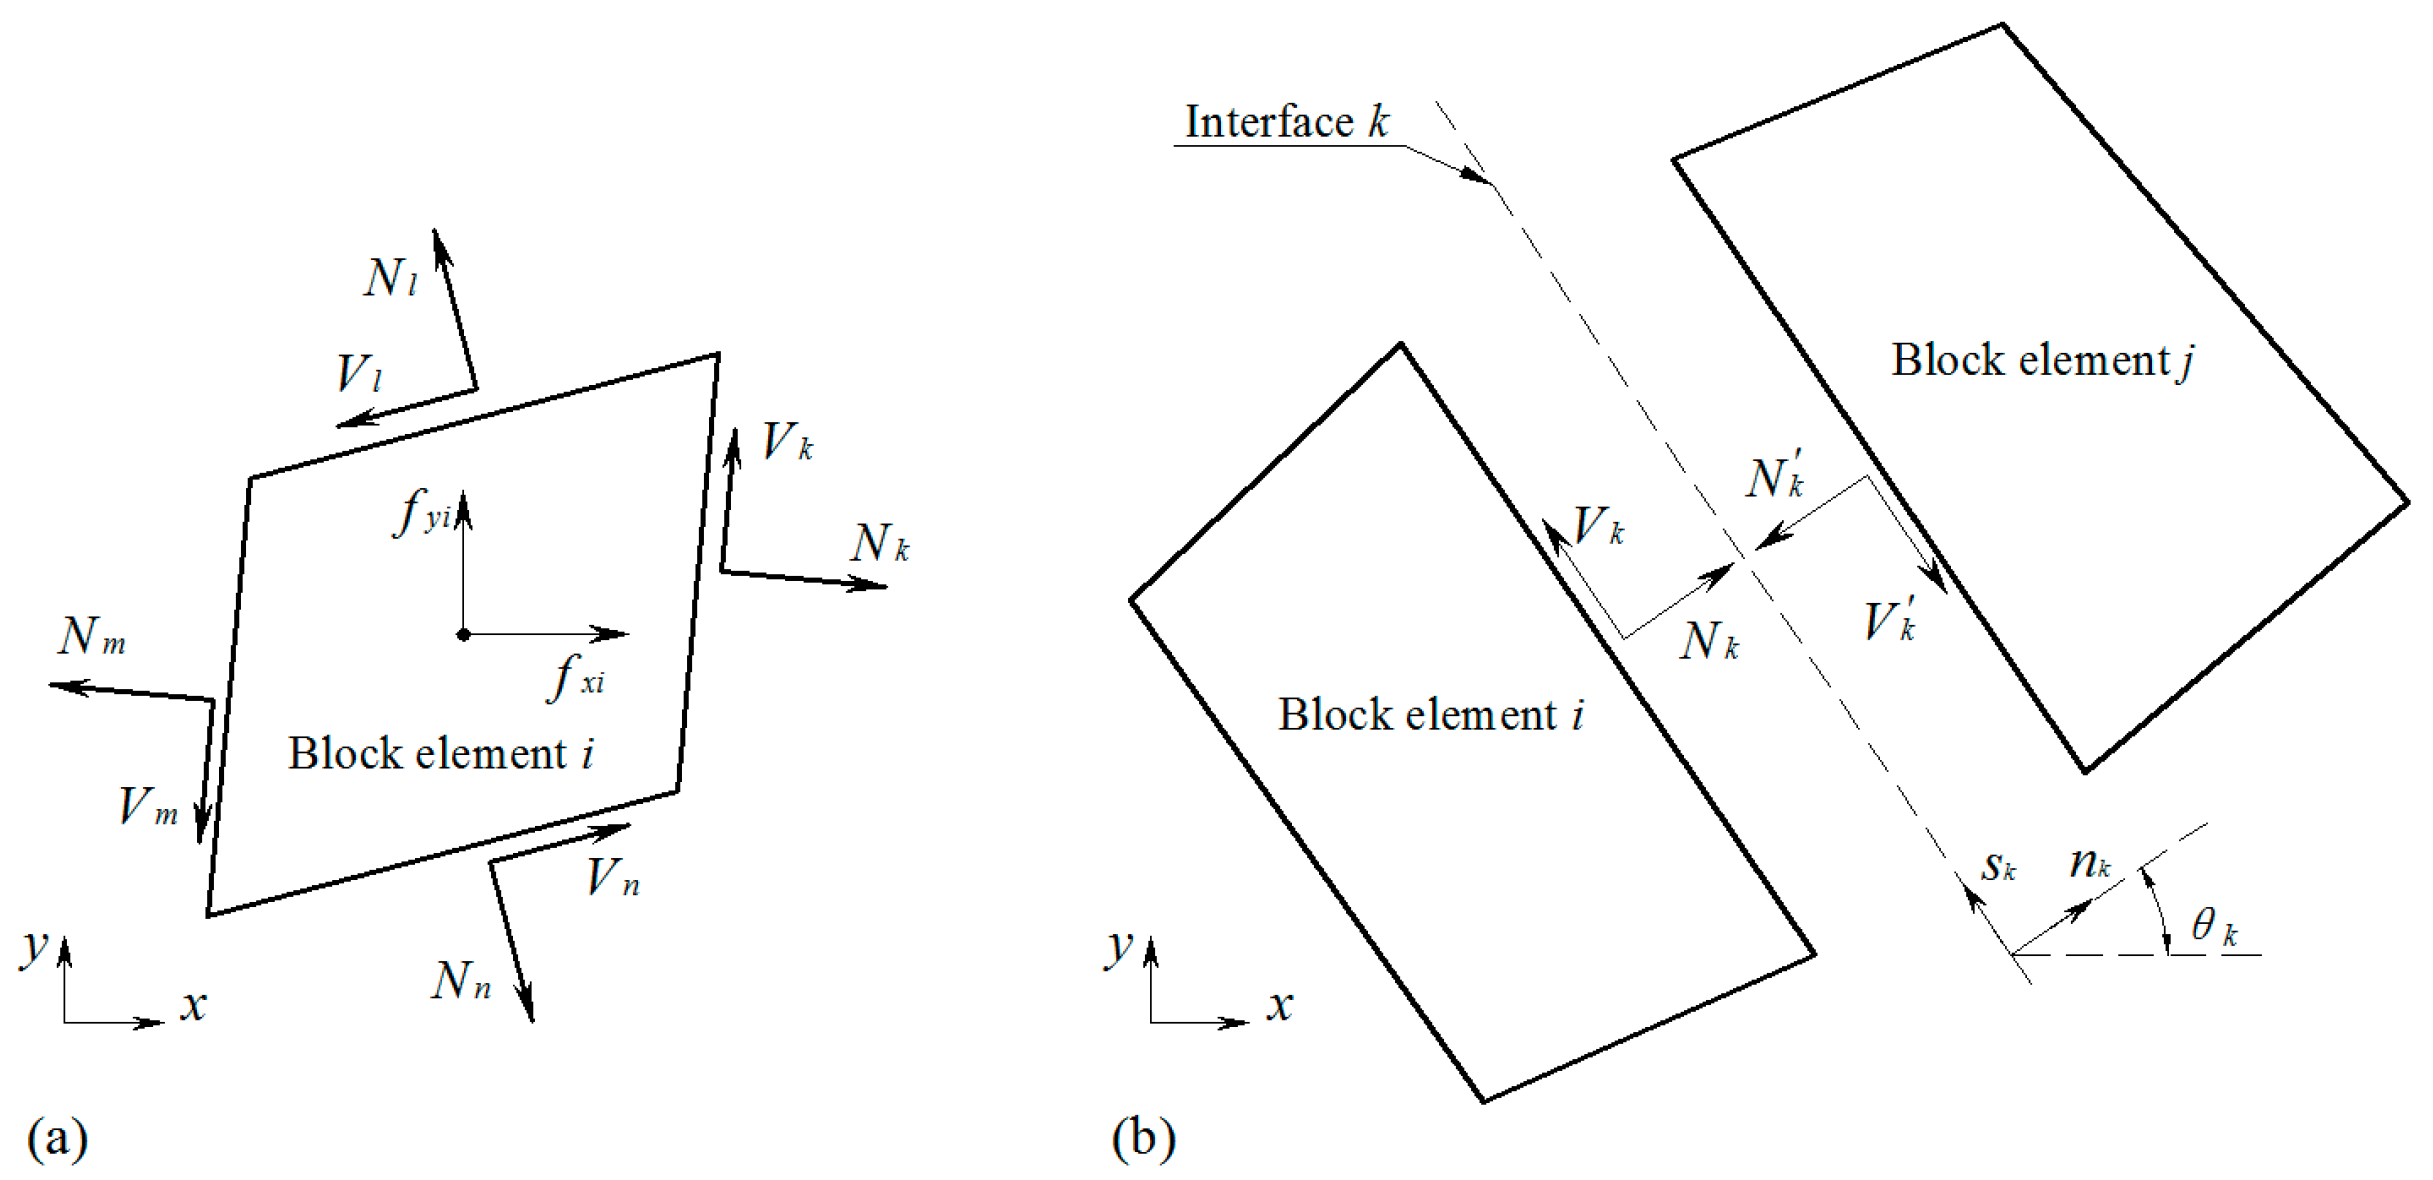
A rigid block element is shown in Figure 2. To establish the statically admissible stress field for the rock blocks, it is convenient to define the following coordinate systems: ( x , y ) = the global coordinate system, and ( n k , s k ) = the local coordinate system for the interface k between the two adjacent block elements i and j . Assume that (1) the forces at the interface k between the two adjacent block elements involve a normal force N k and a shear force V k , both applied at the center of the interface, and (2) the forces at the center of block element i involve an external force f x i in the x direction and an external force f y i in the y direction. The forces can be denoted in vector form as
Q k = N k V k T
F i = f x i f y i T
where   k = ( 1 , , n k ) , n k is the number of all interfaces in all rock block elements;   i = ( 1 , , n B ) , n B is the number of all block elements.
To apply the lower bound limit theorem, the statically admissible stress field for the rock bridges needs to be established. To this end, the linear triangular finite element method proposed by Sloan is used to model the stress field of the rock bridges [21], as shown in Figure 3. The variation in the stress throughout each element is linear, and each node is associated with three unknown stress variables σ x , σ y and τ x y , where the tensile stresses are assumed as positive. Each node only belongs to a particular element, and more than one node may share the same coordinates (as shown in Figure 3a), which differs from the usual form of the finite element method. Statically admissible stress discontinuities are present on the element interface between adjacent triangular finite elements. The element stress can be denoted in vector form as:
σ i = σ x 1 i σ y 1 i τ x y 1 i σ x 2 i σ y 2 i τ x y 2 i σ x 3 i σ y 3 i τ x y 3 i T
where i = ( 1 , , n e ) , and n e is the number of triangular finite elements.

4. Mixed Formulation of Lower Bound Limit Analysis

A mixed formulation of lower bound limit analysis is presented, in which the equilibrium equation, yield condition, and boundary condition are assumed to be satisfied simultaneously and then solved using linear programming by an interior point algorithm for seeking the ultimate load.

4.1. Constraints of Lower Bound Method for Rock Block Elements

4.1.1. Equilibrium Equations of Rigid Block Element

For the rigid rock block element shown in Figure 2a, which maintains a balance under the action of normal and tangential forces on discontinuity interfaces and the body force of the rock block, the equilibrium equation can be expressed as:
k = 1 m i ( T k Q k ) + λ F i = 0
where
T k = cos α k sin α k sin α k cos α k
where mi is the number of interfaces in block element i, λ is the load multiplier of the rock mass, and α k is the inclination angle of the n k -axis with respect to x-axis measured anticlockwise.
In general, cases, there are 2 × n B equilibrium equations for the entire set of blocks. The global equilibrium equation for all block elements can be written as:
C T Q + λ F = 0
where Q T = [ Q 1 T Q 2 T Q n k T ] is the global internal force vector; F i T = [ F 1 T F 2 T F n B T ] is the global external force vector; C T is the equilibrium matrix of all block elements.

4.1.2. Yield Criteria of the Interfaces between Two Rigid Block Elements

When the load reaches or exceeds the limit load, the rock slope structure will lose its bearing capacity. Assuming that the rock block element is not deformed and destroyed as a rigid body, failure only occurs at the interfaces between adjacent block elements. The rigid block elements allow for two failure mechanisms, namely, sliding and separation at the interfaces. The failure by sliding must satisfy the Mohr–Coulomb criterion, whereas the failure by separation is limited by the tensile strength of the interfaces [28]. Furthermore, if we assume that fully persistent joints suffer no tension stress, then the modified Mohr–Coulomb criteria for the interface in a rigid block element can be expressed as:
V k + tan φ k N k c k l k 0   N k 0  
where k = ( 1 , , n k ) ; φ k is the friction angle of the kth interface; c k is the cohesion of the kth interface, and l k is the length of the interface k . The normal force component N k is positive in tension (it only takes non-positive values at interfaces).
In matrix form, the modified Mohr–Coulomb criteria for all interfaces can be expressed as:
Φ T Q + a 0
with
Φ T = Φ 1 T 0 0 0 Φ 2 T 0 0 0 Φ n k T ;   Φ k T = tan φ k 1 tan φ k 1 1 0
a T = a 1 T a 2 T a n k T ;   a k T = c k l k c k l k 0
where k = ( 1 , , n k ) .

4.1.3. Boundary Condition of Rigid Block Elements

Based on the lower bound theorem, the statically admissible stress field of the rock blocks should satisfy the force boundary conditions, which can be expressed as:
Q b = Q ¯ b
where b = ( 1 , , n b ) , and nb is the surfaces number on a known boundary; Q b is the force vector at the boundary surfaces; Q ¯ b is the known force vector applied to the boundary surfaces.

4.2. Constraints of Lower Bound Method for Finite Elements

4.2.1. Equilibrium Equations of the Finite Element Method

For the plane strain problem of a rock bridge, the equilibrium condition for each triangular finite element generates two equality constraints on the nodal stresses in finite element theory. Thus, the element equilibrium of the rock bridge can be written in matrix form as follows:
A e q u i l i σ i = B e q u i l i
with
A e q u i l i = 1 2 A e b i 0 c i b j 0 c j b k 0 c k 0 c i b i 0 c j b j 0 c k b k ;   B e q u i l i = 0 γ e T
where i = ( 1 , , n e ) , and n e is the number of triangular finite elements in the rock bridges; b i , c i , and ( i = i , j , k ) are the coefficients of the shape functions of the finite elements; A e is the area of the finite elements; γ e is the unit weight of the rock mass.
Thus, the global equilibrium equation for all finite elements can be written as:
A e q u i l σ = B e q u i l
where A e q u i l is the equilibrium matrix of all finite elements, B e q u i l is the load vector of element equilibrium, and σ is the stress vector of all nodes.

4.2.2. Discontinuity Equilibrium of Finite Elements of Rock Bridge

Figure 3c describes the stress discontinuity along an edge shared by two adjacent finite elements i and j , where σ n d is the normal stress perpendicular to the discontinuity, and τ s d is the shear stress along the discontinuity. Two adjacent elements share an edge (discontinuity d) defined by the nodal pairs (1, 2) and (3, 4). According to the lower bound theorem, the discontinuity equilibrium can be written as:
σ n 1 d = σ n 2 d ;   σ n 3 d = σ n 4 d ;   τ s 1 d = τ s 2 d ;   τ s 3 d = τ s 4 d
These equations are summarized by the matrix equation:
A discont d σ discont d = 0
where
A discont d = T d T d 0 0 0 0 T d T d ;   T d = sin 2 θ d cos 2 θ d sin 2 θ d 1 2 sin 2 θ d 1 2 sin 2 θ d cos 2 θ d ;
σ discont d = σ x 1 d σ y 1 d σ x y 1 d σ x 2 d σ y 2 d σ x y 2 d σ x 3 d σ y 3 d σ x y 3 d σ x 4 d σ y 4 d σ x y 4 d T
where d = ( 1 , , n d ) , and n d is the number of finite element stress discontinuities in the rock bridges, and θ d is the inclination angle of discontinuity d measured anticlockwise with respect to the x -axis.
The global equilibrium condition for all statically admissible discontinuities can be written as:
A discont σ = 0
where A discont is the discontinuity equilibrium matrix of all discontinuities.

4.2.3. Yield Criteria of Finite Element

Rock bridges can be considered as the continuum that has uniform physical and mechanical properties. The Mohr–Coulomb yield criteria of plane strain conditions may be expressed as the nodal stress
F ( σ , τ ) = σ x σ y 2 + 2 τ x y 2 2 c e cos φ e σ x + σ y sin φ e 2 0
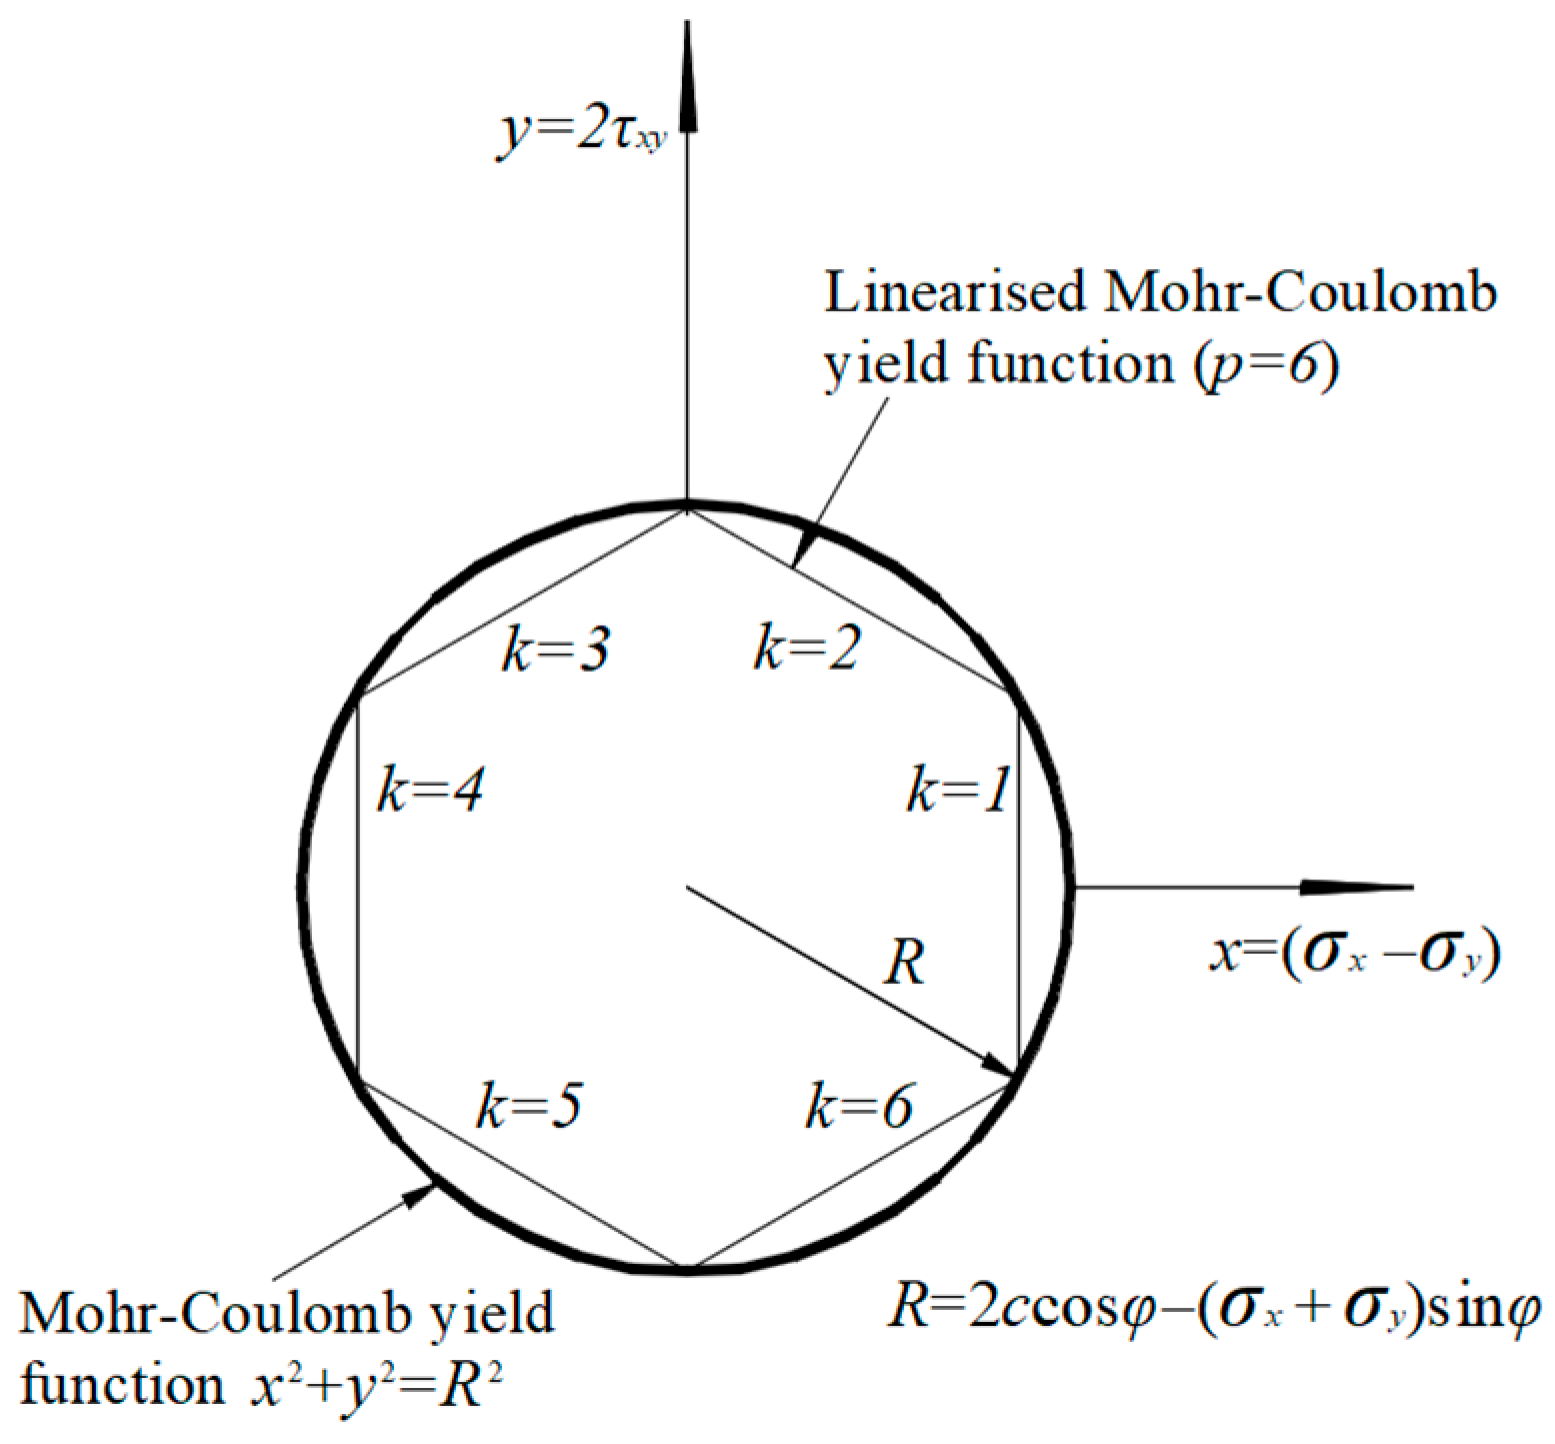
To fulfil the requirements of a statically admissible stress field, the condition F ( σ , τ ) 0 is held at each node i in each triangular finite element in the rock bridges. The inequality in Equation (14) is a nonlinear constraint expression that can be approximated by an interior polygon with p sides and p vertices to simplify the solution [21]. The yield surface obtained from the linearized Mohr–Coulomb yield condition is shown in Figure 4.
The inequality in Equation (14) is satisfied at each node i throughout the grid of the rock bridge, and the linearized yield functions can be abbreviated by the matrix equation as follows:
A y i e l d i σ N o d e i B y i e l d i
with
A y i e l d i = A 1 B 1 C 1 A 2 B 2 C 2 A k B k C k A p B p C p ;
B y i e l d i = D i D i D i T ;
σ N o d e i = σ x i σ y i τ x y i T ;
A k = cos ( 2 k π / p ) + sin φ e cos ( π / p ) ;
B k = cos ( 2 k π / p ) + sin φ e cos ( π / p ) ;
C k = 2 sin ( 2 k π / p ) ;   D i = 2 c e cos φ e cos ( π / p ) ;
where i = ( 1 , , n n ) , and n n is the number of nodes of all finite elements; k = ( 1 , , p ) ; p is the number of sides of the interior polygon for linearizing the Mohr–Coulomb yield function; φ e is the friction angle of the rock bridge at the nodes of the e th element; c e is the cohesion of the rock bridge at the nodes of the e th element.
The yield conditions for all nodes can be written as:
A y i e l d σ B y i e l d
where A y i e l d is the yield matrix for all nodes, and B y i e l d is the coefficient vector of yield conditions.

4.2.4. Stress Boundary Conditions of Finite Element

The stress boundary conditions must be satisfied on the finite element boundaries with boundary traction. For all boundary elements, the node stress boundary conditions can be written in matrix form as [21]:
A b o u n d b σ = B b o u n d b
where A b o u n d is the boundary condition matrix for all boundary edges; B b o u n d is the coefficient vector of all boundary edges; the stress boundary conditions are satisfied by setting B b o u n d = 0 when element edges belong to the surface boundary with no traction.

4.3. Equilibrium Constraint on the Interface between Block Elements and Finite Elements

In this study, a mixed numerical discrete method is employed to simulate the mechanical behavior of a jointed rock slope while a fracture of the rock bridges is considered. The rigid block element and the triangular finite element are respectively used to discretize the rock blocks and rock bridges. According to the lower bound theorem, a statically admissible discontinuity permits the tangential stress to be discontinuous at the interfaces between the rigid block elements and finite elements, but this requires that the continuity of the corresponding normal and shear components be preserved. Figure 5 describes the force of interaction on an interface Lj between a rigid block element and several triangular finite elements. The interface should meet the following equilibrium constraint:
N j = L j σ n j d L ,   V j = L j τ s j d L
where N j is the normal force applied on interface L j for the rigid block element B j ; V j is the shear force applied on the interface L j for the rigid block element B j ; σ n j is the normal stress in the n j direction on the interface for finite elements; τ s j is the shear stress in the s j direction on the interface for finite elements; L j is the length of the interface between the rigid block element B j and finite elements.
Figure 5 illustrates one block element and a few finite elements sharing an edge L j . The edge is divided into n j e triangular finite elements on the side of the rock bridge, and there are 2 n j e nodes in contact with the block element B j . Because the node stresses vary linearly in each finite element, Equation (18) can be written as:
N j = i = 1 n j e σ n 1 j / i + σ n 2 j / i 2 l i ,   V j = i = 1 n j e τ s 1 j / i + τ s 2 j / i 2 l i
where j = ( 1 , , n j ) , and n j is the interface number between the rock blocks and finite elements on the entire rock slope; n j e is the number of triangular finite elements on interface L j ; l i equals the length of the interface between finite element E i and the rigid block element B j ; ( σ n 1 j / i , σ n 2 j / i ) is the normal stress in the n j direction of node 1 and node 2 of the finite element E i on the interface, respectively; ( τ n 1 j / i , τ n 2 j / i ) is the shear stress in the s j direction of node 1 and node 2 of the finite element E i on the interface, respectively.
The equilibrium constraints of the interface can be expressed in matrix form:
A j σ j = B j
with
A j = A 1 j A i j A n j e j ;
A i j = 1 2 l i T j T j ;
σ j = σ 1 j T σ i j T σ n j e j T T ;  
σ i j = σ x 1 j / i σ y 1 j / i τ x y 1 j / i σ x 2 j / i σ y 2 j / i τ x y 2 j / i T ;
B j = N j V j T ;   T j = sin 2 θ j cos 2 θ j sin 2 θ j 1 2 sin 2 θ j 1 2 sin 2 θ j cos 2 θ j ;   ( j = 1 , , n j ) ;   ( i = 1 , , n j e ) ;
where j = ( 1 , , n j ) , i = ( 1 , , n j e ) , θ j is the inclination angle of interface L j measured anticlockwise with respect to the x -axis; ( σ x 1 j / i , σ x 2 j / i ) is the x component of normal stress of node 1 and node 2 of finite element E i on the interface, respectively; ( σ y 1 j / i , σ y 2 j / i ) is the y component of normal stress of node 1 and node 2 of finite element E i on the interface, respectively; ( τ x y 1 j / i , τ x y 2 j / i ) is the shear stress of node 1 and node 2 of the finite element E i on the interface L j .

4.4. The Objective Function

In general, there are two ways for the rock slope to reach the limit state. The first way is by increasing the load gradually, and the second way is by reducing the shear strength parameter of the rock mass step-by-step. In lower bound limit theory, any load multiplier λ corresponding to a statically admissible stress field constrained by the equilibrium equation and the failure criteria cannot be greater than the plastic collapse multiplier. It is essential to find a statically admissible stress field that will maximize a load multiplier. To this end, the load multiplier is set to be an objective function:
Maximize : λ
However, in many situations, it is necessary to solve for the strength reserve coefficient, which is defined as:
λ m = tan φ tan φ ʹ = c c ʹ
where λ m is the strength reserve coefficient; φ and φ ʹ are friction angles of the rock mass before and after strength reduction, respectively; c and c ʹ are the cohesion of the rock mass before and after strength reduction, respectively. The strength reserve coefficient λ m is solved for by an iterative algorithm [33] rather than a direct solution, which would generate nonlinear programming issues.

4.5. Linear Programming and Solution Strategy for Lower Bound Analysis

To find a statically admissible stress field that maximizes the collapse load, the lower bound approach is combined with constriction conditions including Equations (5), (7), (8), (10), (13), (16), (17) and (20), as well as the objective function Equation (21), and formulated for the following linear problem:
Maximize : λ Subject   to : C T Q + λ F = 0 ; Φ T Q + a 0 ; Q b = Q ¯ b A e q u i l σ = B e q u i l ; A discont σ = 0 ; A y i e l d σ B y i e l d A b o u n d σ = B b o u n d ; A j σ j = B j
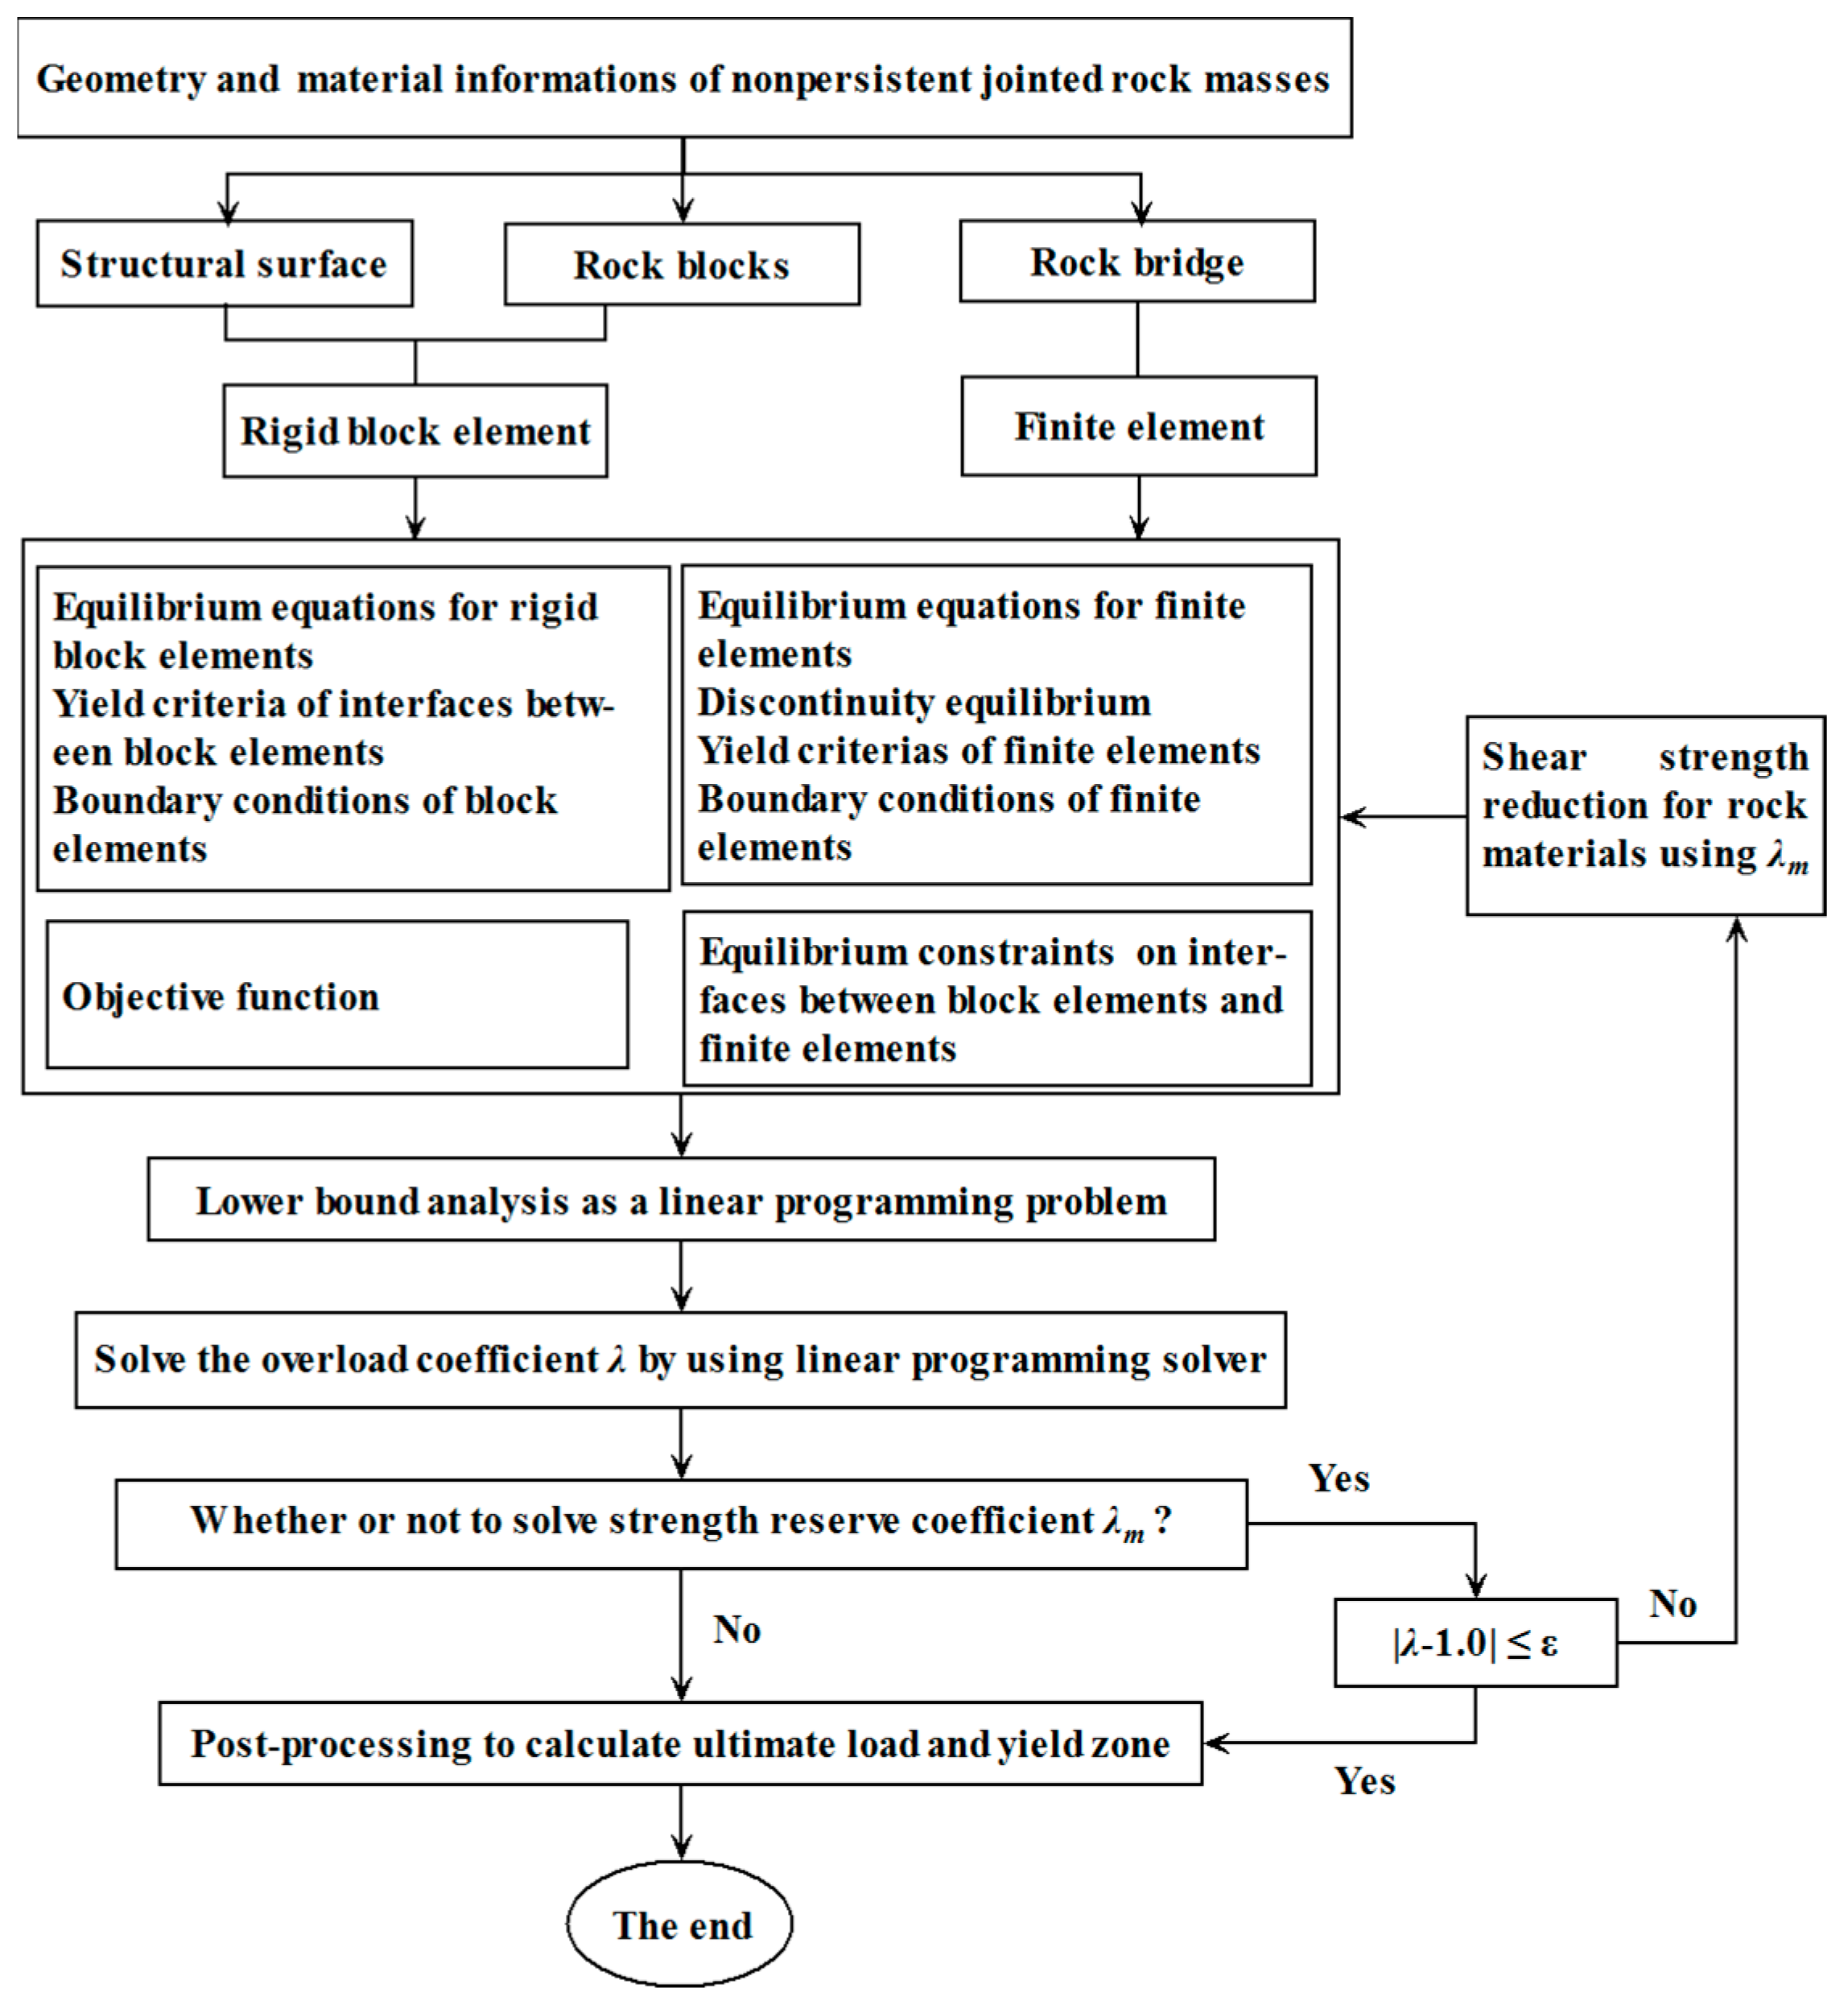
The model based on Equation (23) is a linear mathematical problem. The computational accuracy for solving the model equations mainly depends on the accuracy of the programming solver. Currently, there are three widely used algorithms for limit analysis, namely, the simplex algorithm, the interior point algorithm, and the active set algorithm [19]. Among these three methods, the interior point algorithm has the advantages of stable, easy programming, accuracy, and affordable computational cost [34]. Therefore, the interior point algorithm is employed in this study. The programming numerical code is compiled in Fortran, and the numerical procedure is shown in Figure 6.

5. Calibration and Application

Three numerical examples have been performed to calibrate the numerical model proposed in this study.

5.1. Ultimate Shear Load of Direct Shear Specimen with Coplanar Intermittent Joints

The first numerical example is a direct shear test specimen of the rock mass reported in Jiang et al. [35], as shown in Figure 7. The calculation parameters are listed in Table 1 and Table 2. The rock specimen contains the two coplanar intermittent joints. The rock bridge between adjacent joints plays an important role in the bearing capacity of the rock specimen. The ultimate shear load of the specimen with different combinations of joint persistence and normal stress is calculated using the proposed method. The calculated results are compared with analytical solutions.
The mixed numerical discrete method is used to discretize the rock specimen, as schematically shown in Figure 8. As shown in Figure 8, to evaluate the sensitivity of the computational accuracy to the finite element grid density, the specimen is divided into grids with four rigid block elements (b1, b2, b3, and b4) and 8, 16, 26, 50, and 116 finite elements, respectively.
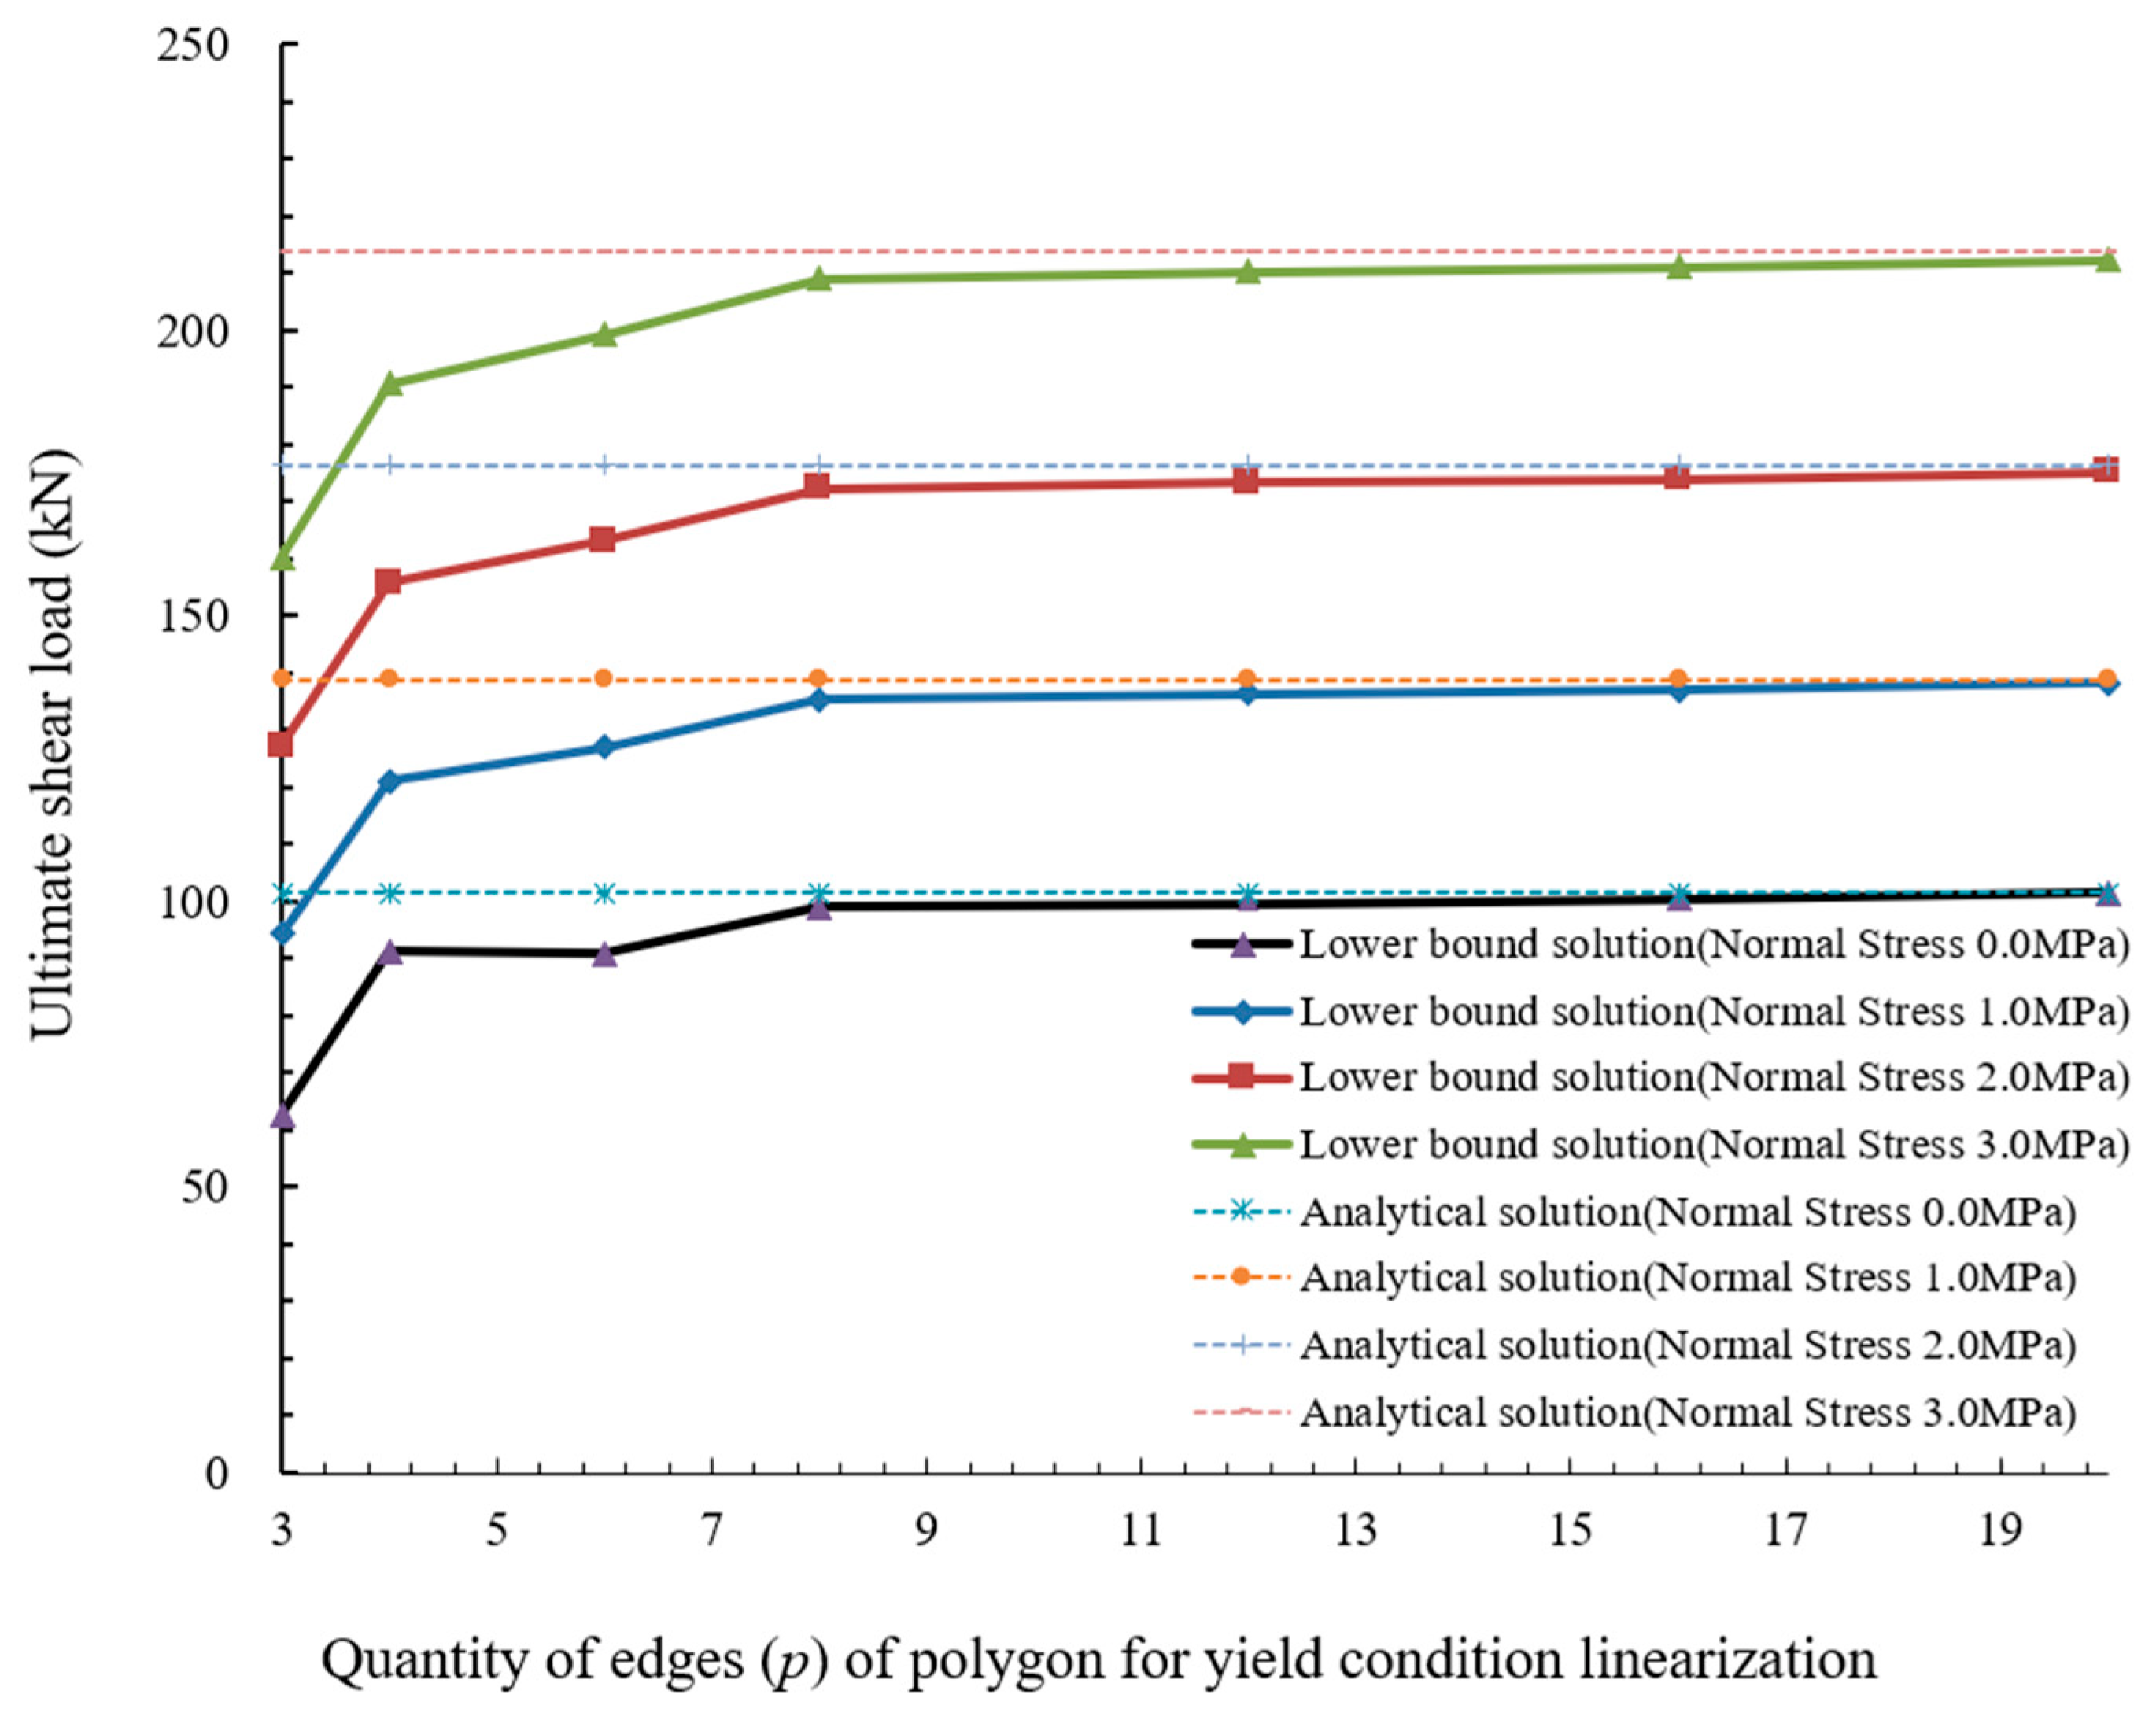
The ultimate shear loads for various conditions are calculated. The results are listed in Figure 9 and Figure 10. The analytical solutions, which are obtained based on the assumption of pure shear failure in the jointed plane direction, are listed for comparison. In general, the numerical simulation error decreases with the increase in p and grid density. Obviously, the computational accuracy will also significantly increase with the increase in p and grid density. In this study, for efficient computation with sufficient accuracy, the value of p is taken as 8 to 16, and the grid density is taken as medium density. The proposed method is an approximate method for solving the limit state of the non-persistent jointed rock. Numerical error has three sources: (1) linearization of the Mohr–Coulomb yield criteria; (2) the grid density of triangular finite elements; (3) the linear programming solver.
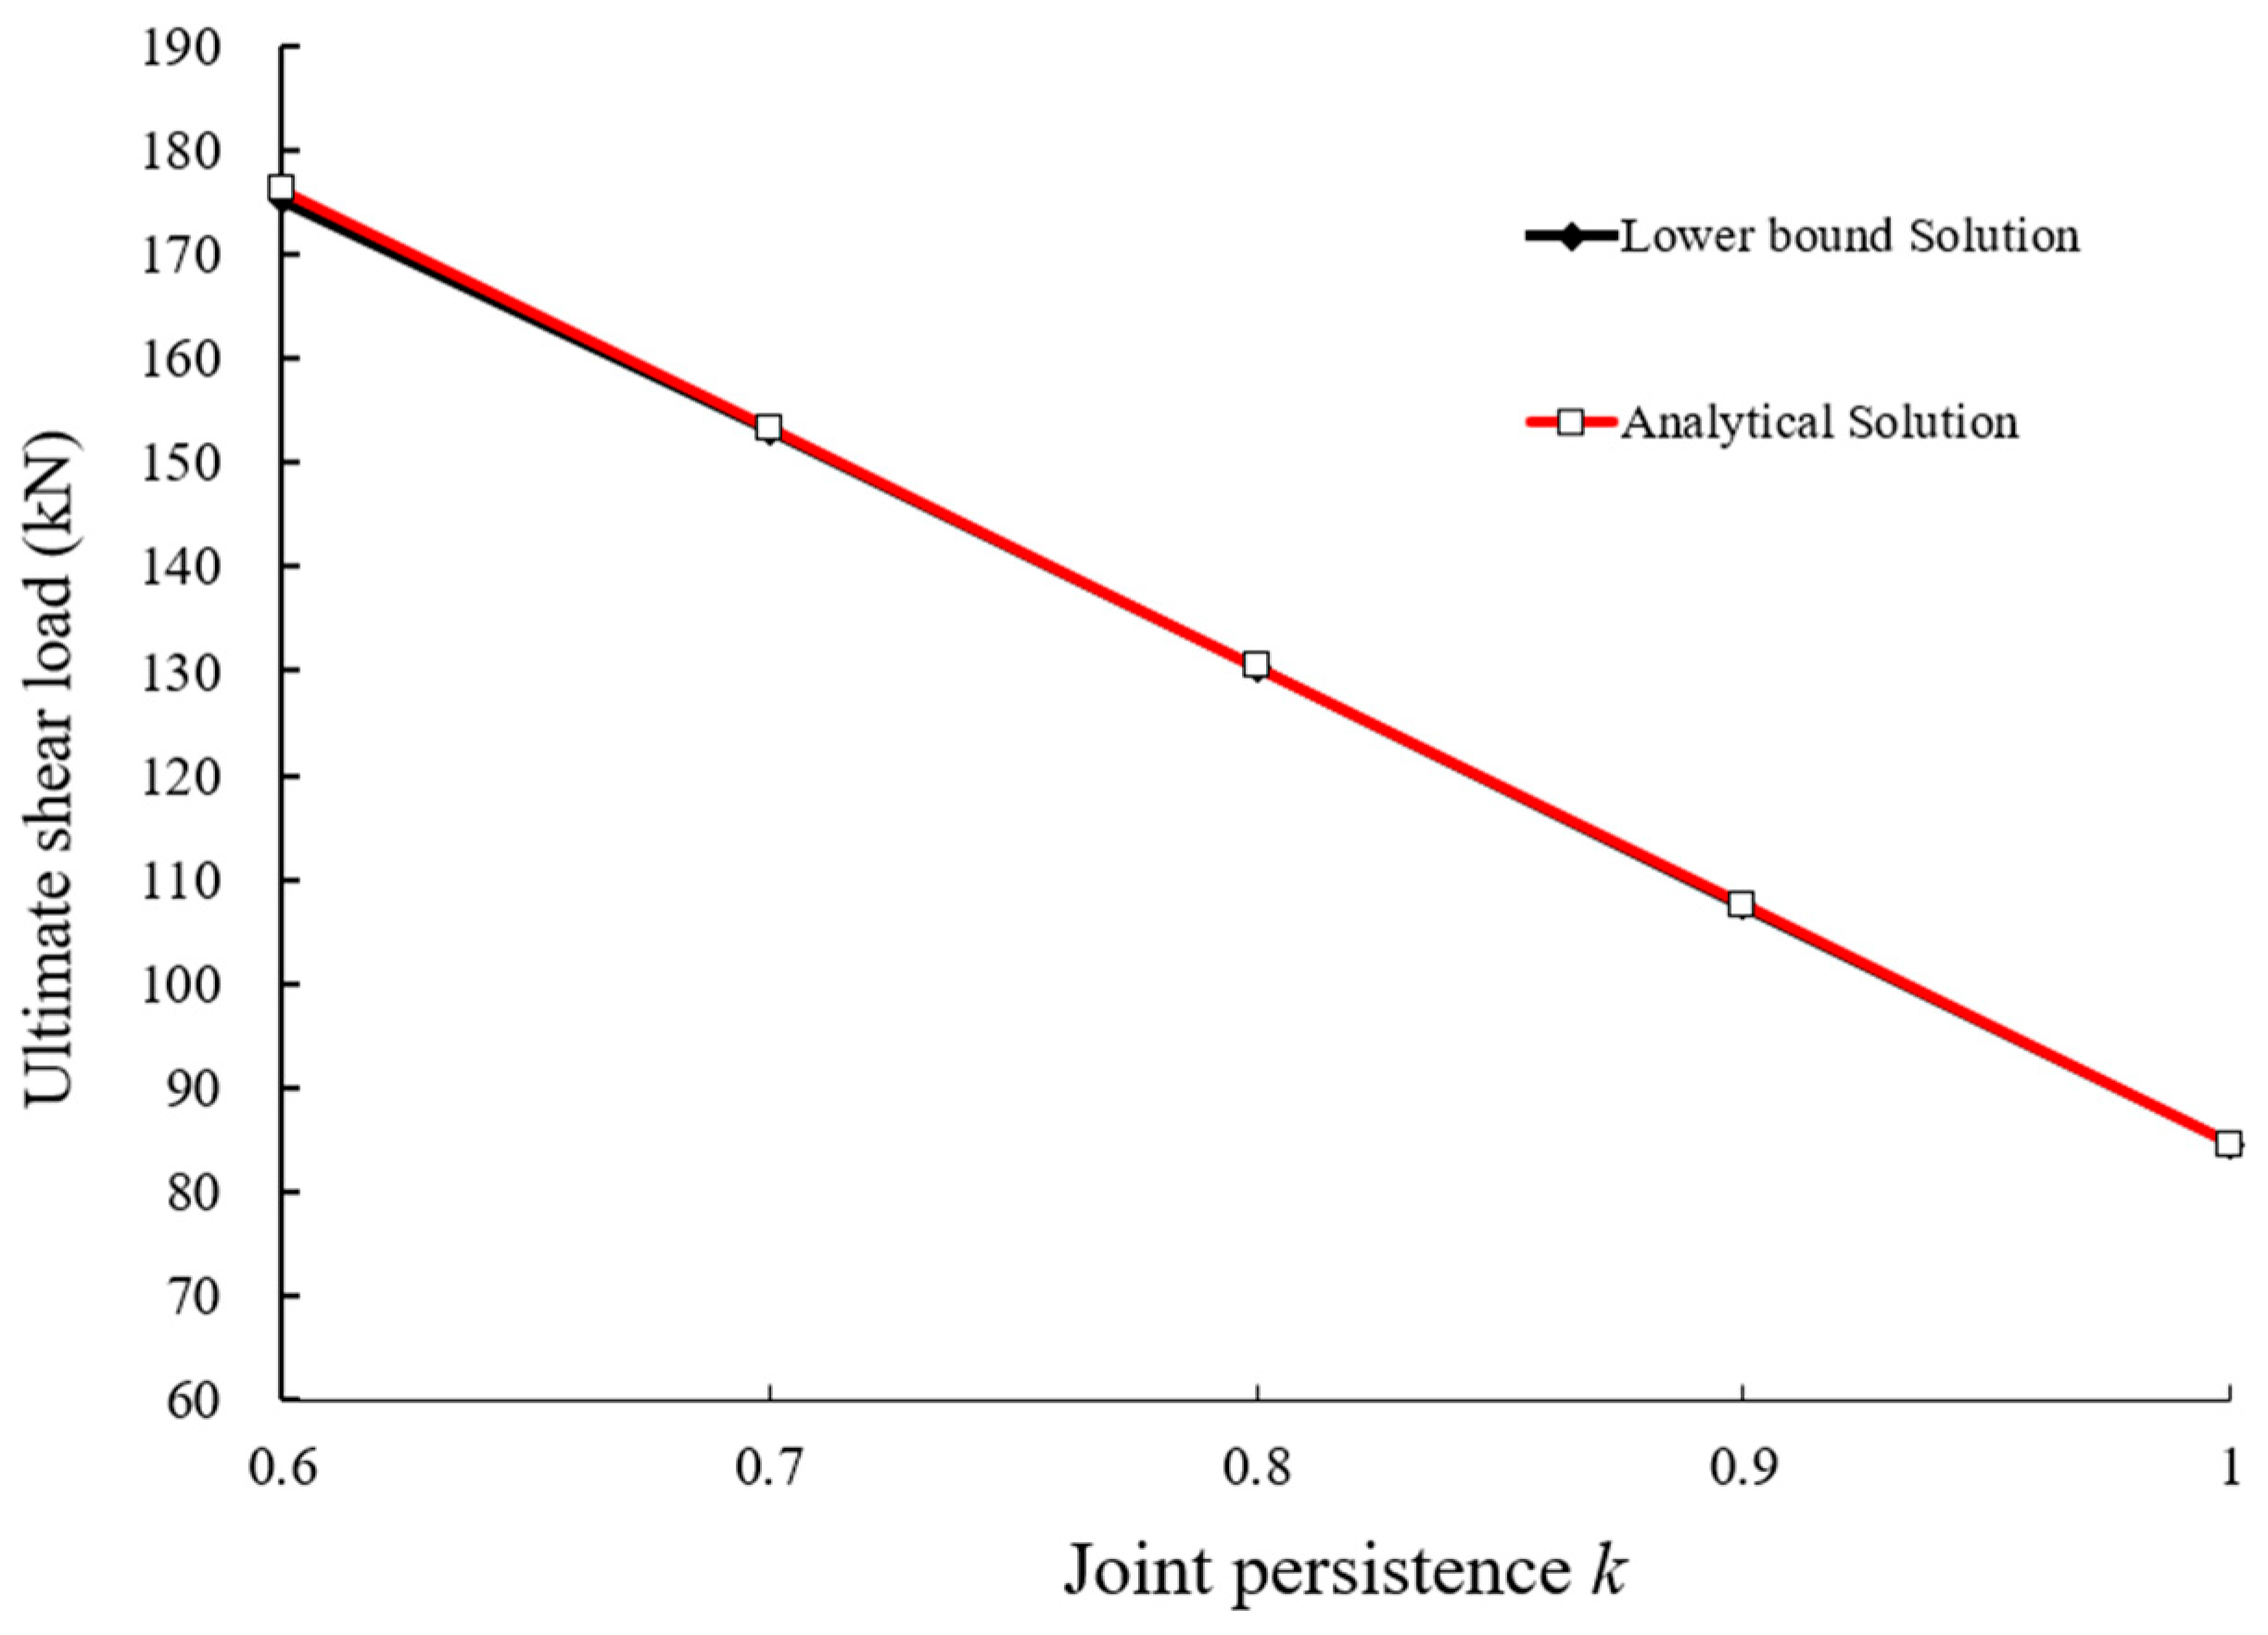
Figure 11 shows the variation in the ultimate shear load with joint persistence k for a normal stress σ n = 2.0 MPa. It is seen that the ultimate shear load decreases with the increase in k, indicating that the mechanical effect of the rock bridge is reduced when k increases. The numerical results agree well with the analytical solutions.

5.2. Stability of a Rock Slope with Three Joints and a Rock Bridge

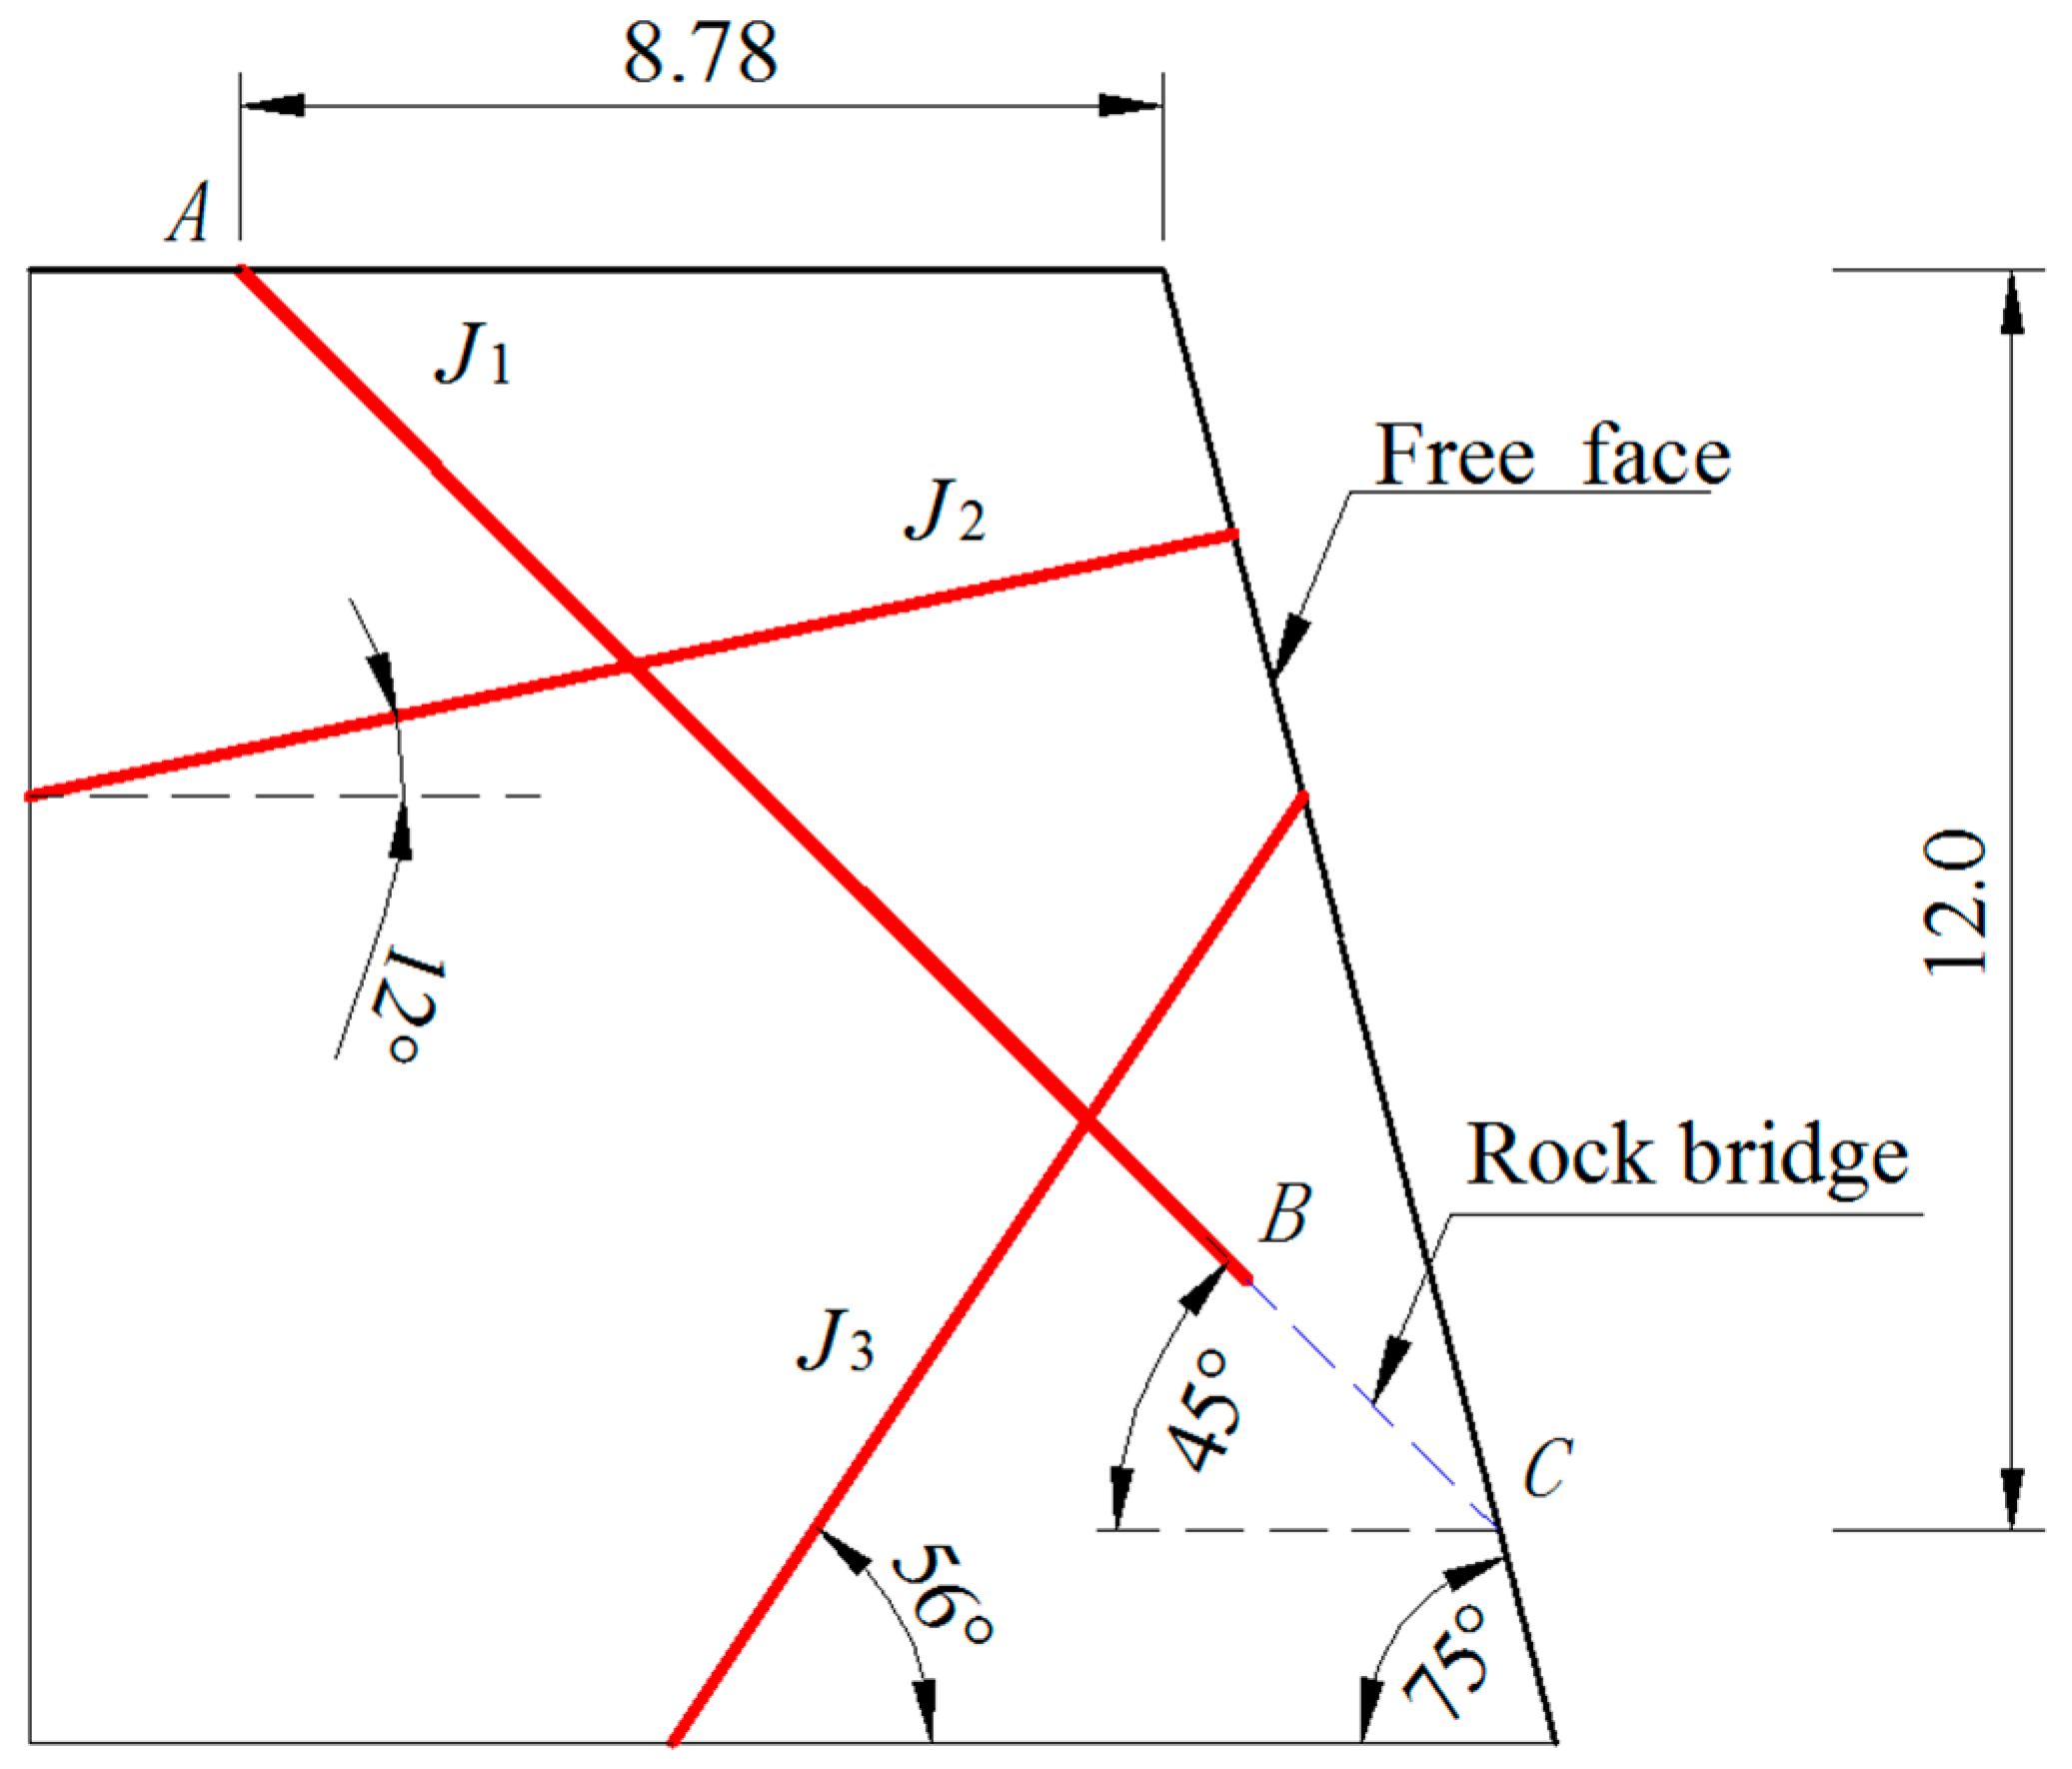
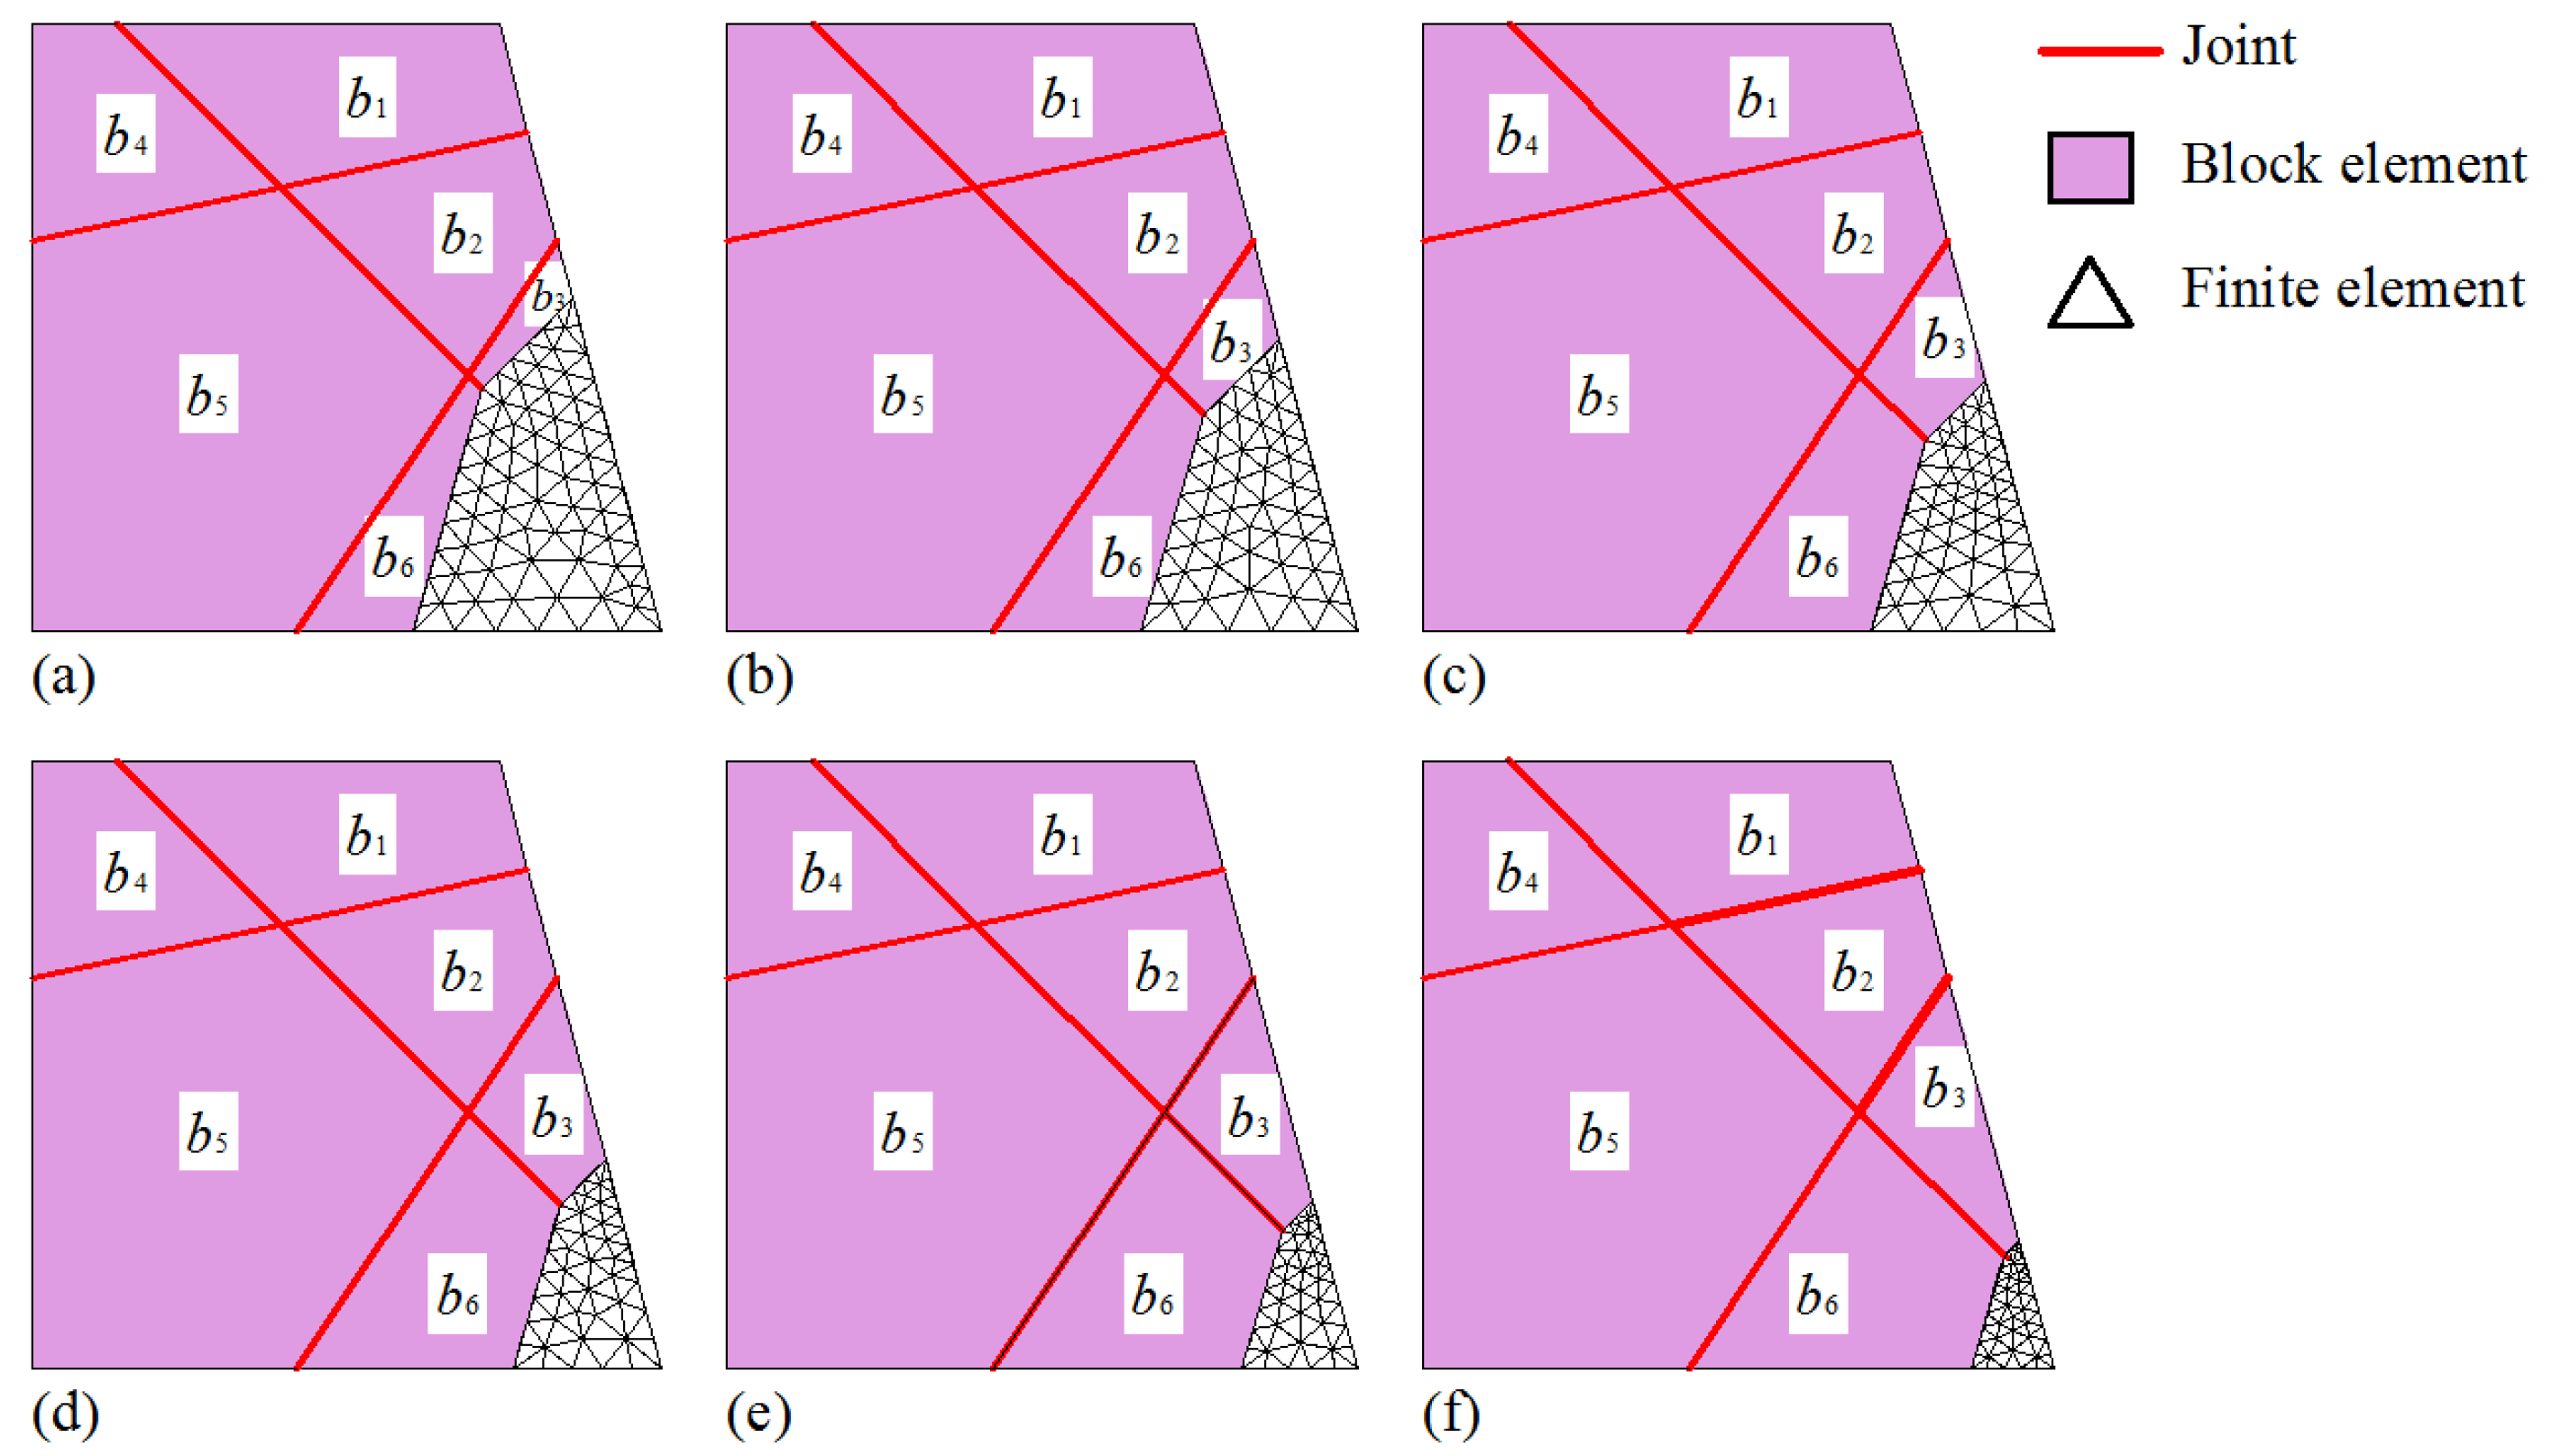
Example 2 is an artificial jointed rock slope with three joints, as shown Figure 12, in which J2 and J3 are fully persistent joints, and J1 is a non-persistent joint. A rock bridge is in the intersection region between joint J1 and the slope-free surface. This example is used to examine the influence of the joint persistence k of joint J1 and the shear strength parameters of the rock bridge on the strength reserve coefficient of the slope. The physical and mechanical parameters of the slope material are listed in Table 3. This slope is discretized using mixed numerical discrete methods, a rigid block element is employed to simulate the existing rock blocks, and a triangular finite element grid is used in the rock bridge with medium grid density. Figure 13 shows the divisions of the mixed discretization with different values of k of J1.
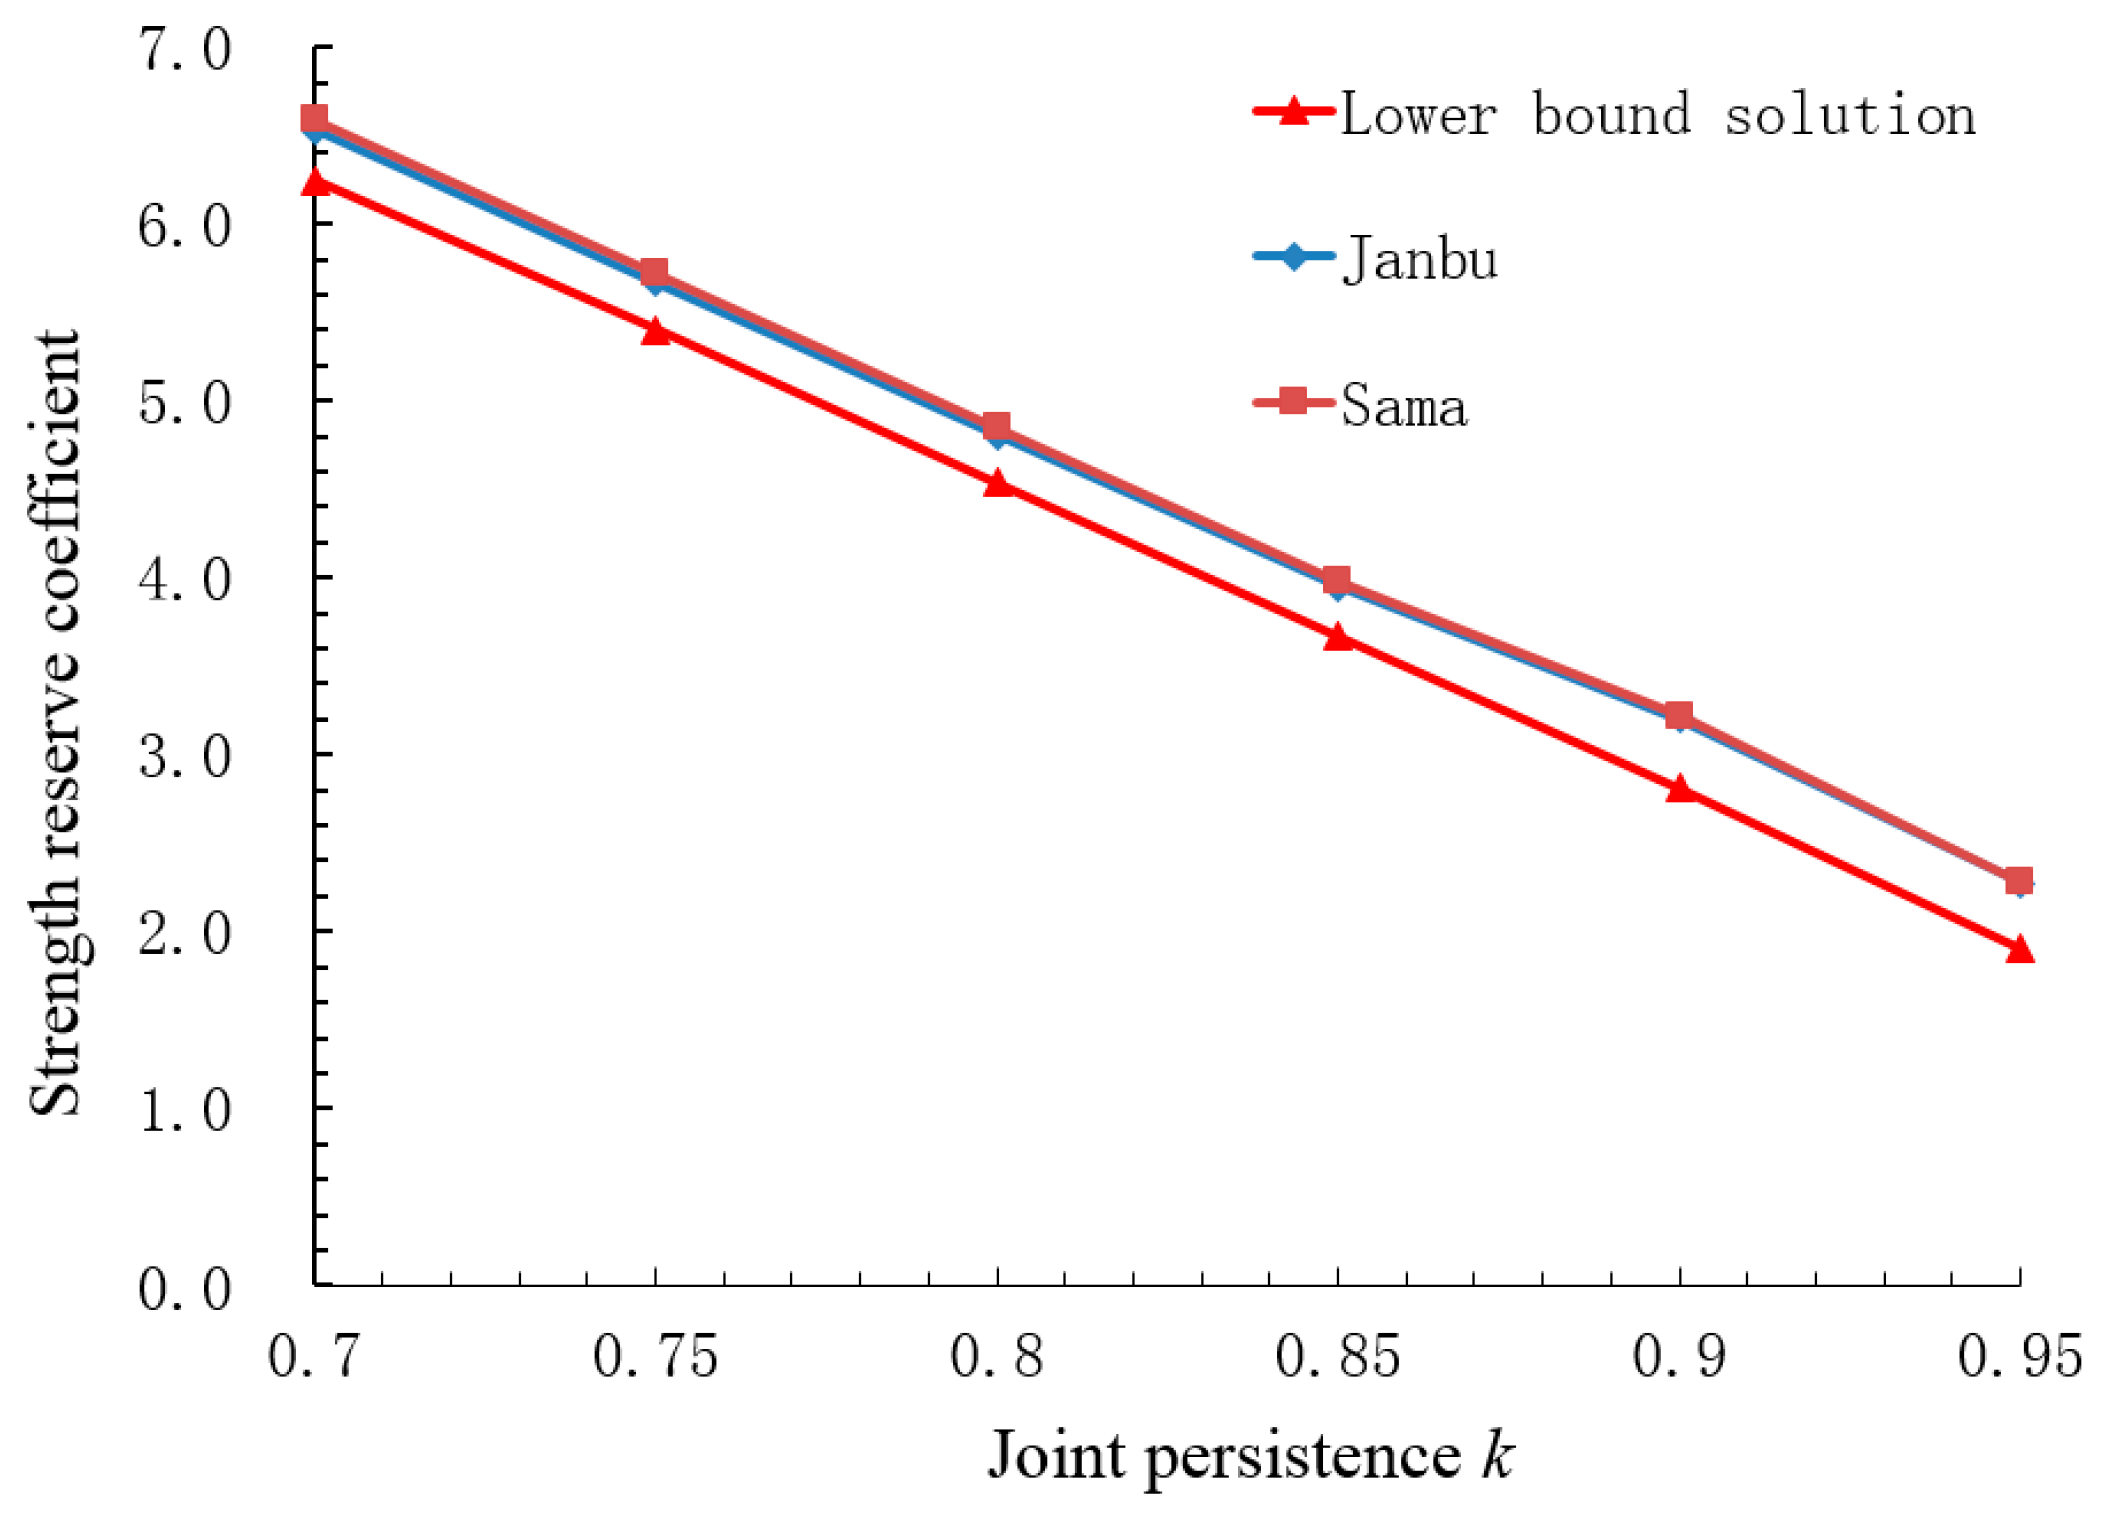
The statically admissible stress fields are established using the proposed method. The strength reserve coefficients of the slope are calculated by an iterative algorithm for various values of k and different cohesions of rock bridge. The results are plotted in Figure 14 and Figure 15, in which the results using the Sama and Janbu methods are plotted for comparison. The Sama method and the Janbu method assume that the shear failure will occur along the slip surface ABC in the slope, in which AB is the non-persistent joint J1, and BC is a fictitious fracture.
Figure 14 shows that the strength reserve coefficients computed by the proposed method are slightly smaller than those computed by the Sama method and Janbu method for c = 1000 kPa. It is seen that the strength reserve coefficient decreases roughly linearly with the increase in k. The lower bound method in this study provides a rigorous lower bound solution in contrast to the Sama method. This means that the lower bound solution is a safer method for practical design.
Figure 15 shows the variation in the strength reserve coefficient with connectivity rate k for various cohesions of the rock bridge c (c = 1000 kPa, 800 kPa, 600 kPa, 400 kPa). The results computed by the Sama method are plotted for comparison. It is seen that the strength reserve coefficient varies roughly linearly with k for various cohesions of the rock bridge. Figure 15 also shows that the strength reserve coefficient decreases with c. The strength reserve coefficient calculated using the lower bound method proposed in this study is smaller than that obtained from the Sama method.
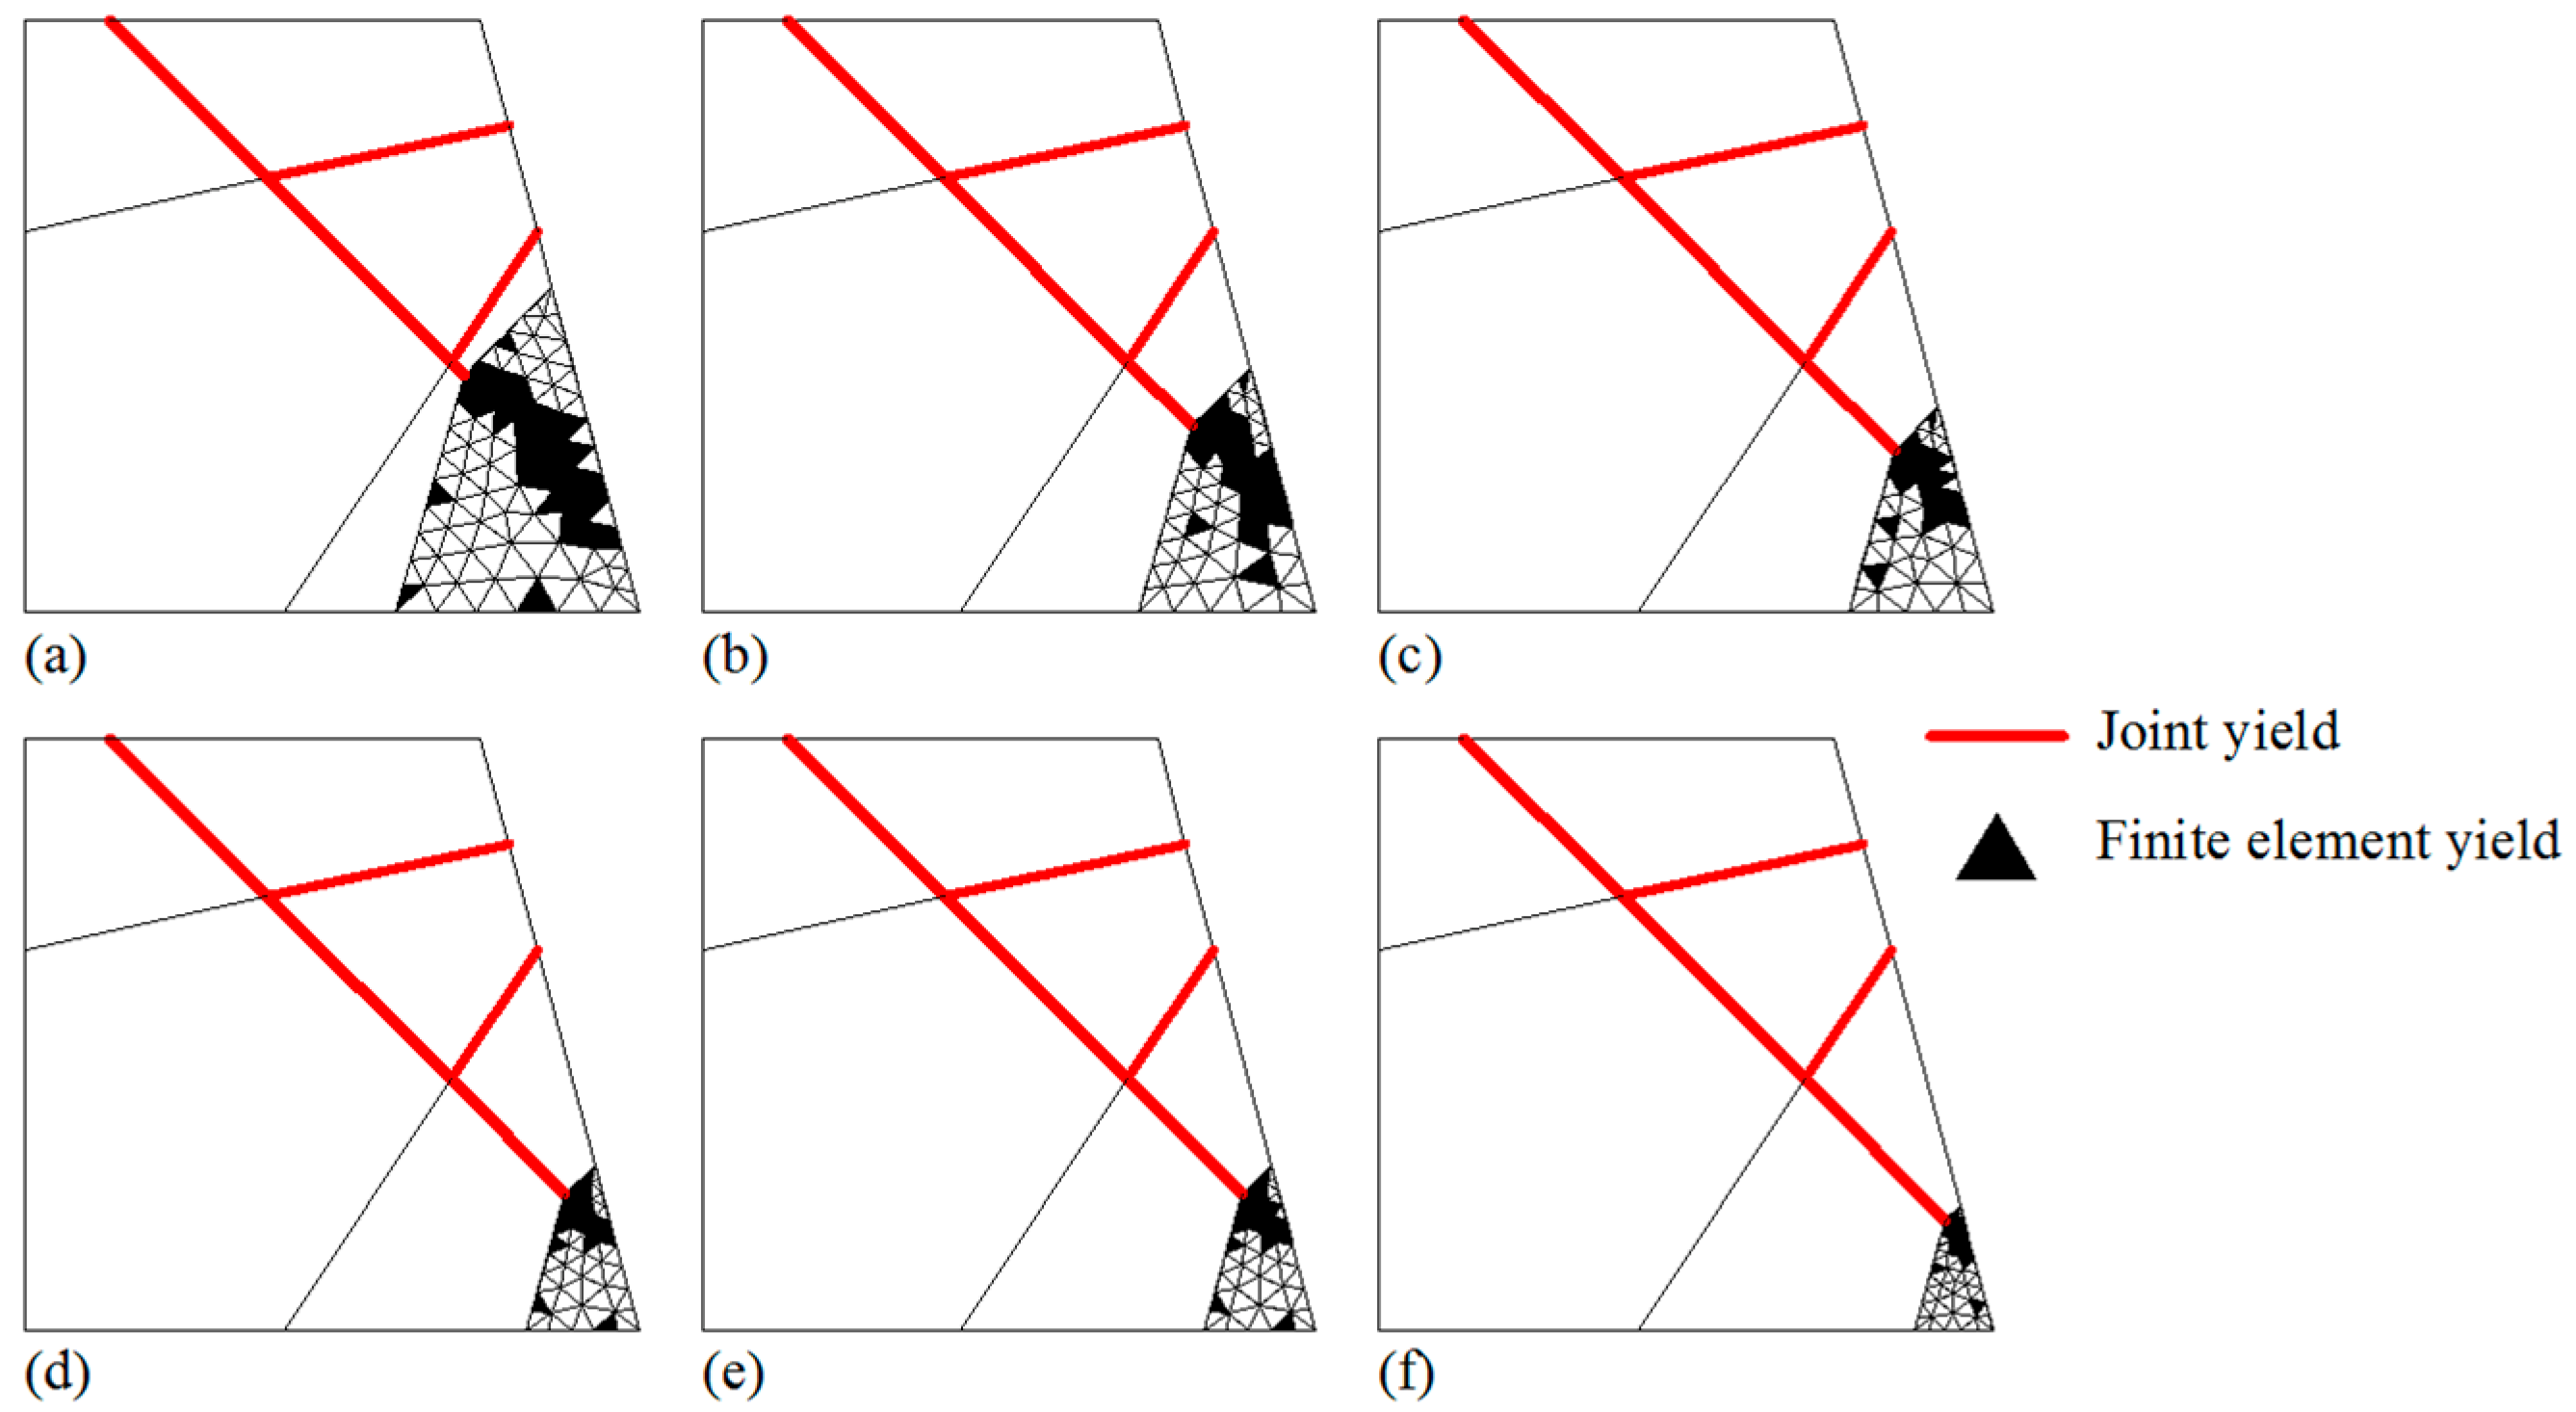
Figure 16 is a sketch of the yield zone of the slope for different values of joint persistence k and c = 1000 kPa, which is obtained from the lower bound method. The results show that: (1) The slope failure mode is the occurrence of shear failure in three joints and the rock bridge. Joint J1 completely yields, whereas joints J2 and J3 partially yield. (2) The failure zone of the rock bridge formed by the non-persistent joint J1 is not always in the direction of line BC, being mainly manifested as a random and irregular region according to the results of the lower bound method. (3) Traditional methods such as the Sama and Janbu methods are used to calculate this type of non-persistent jointed rock slope, meaning that a slip surface must be assumed in advance, but the proposed method does not need to assume the failure surface of the slope, and the safety factor and the corresponding true failure mechanism mode can be obtained directly by calculation.

5.3. Stability of Rock Slope with Two Joint Sets and a Rock Bridge

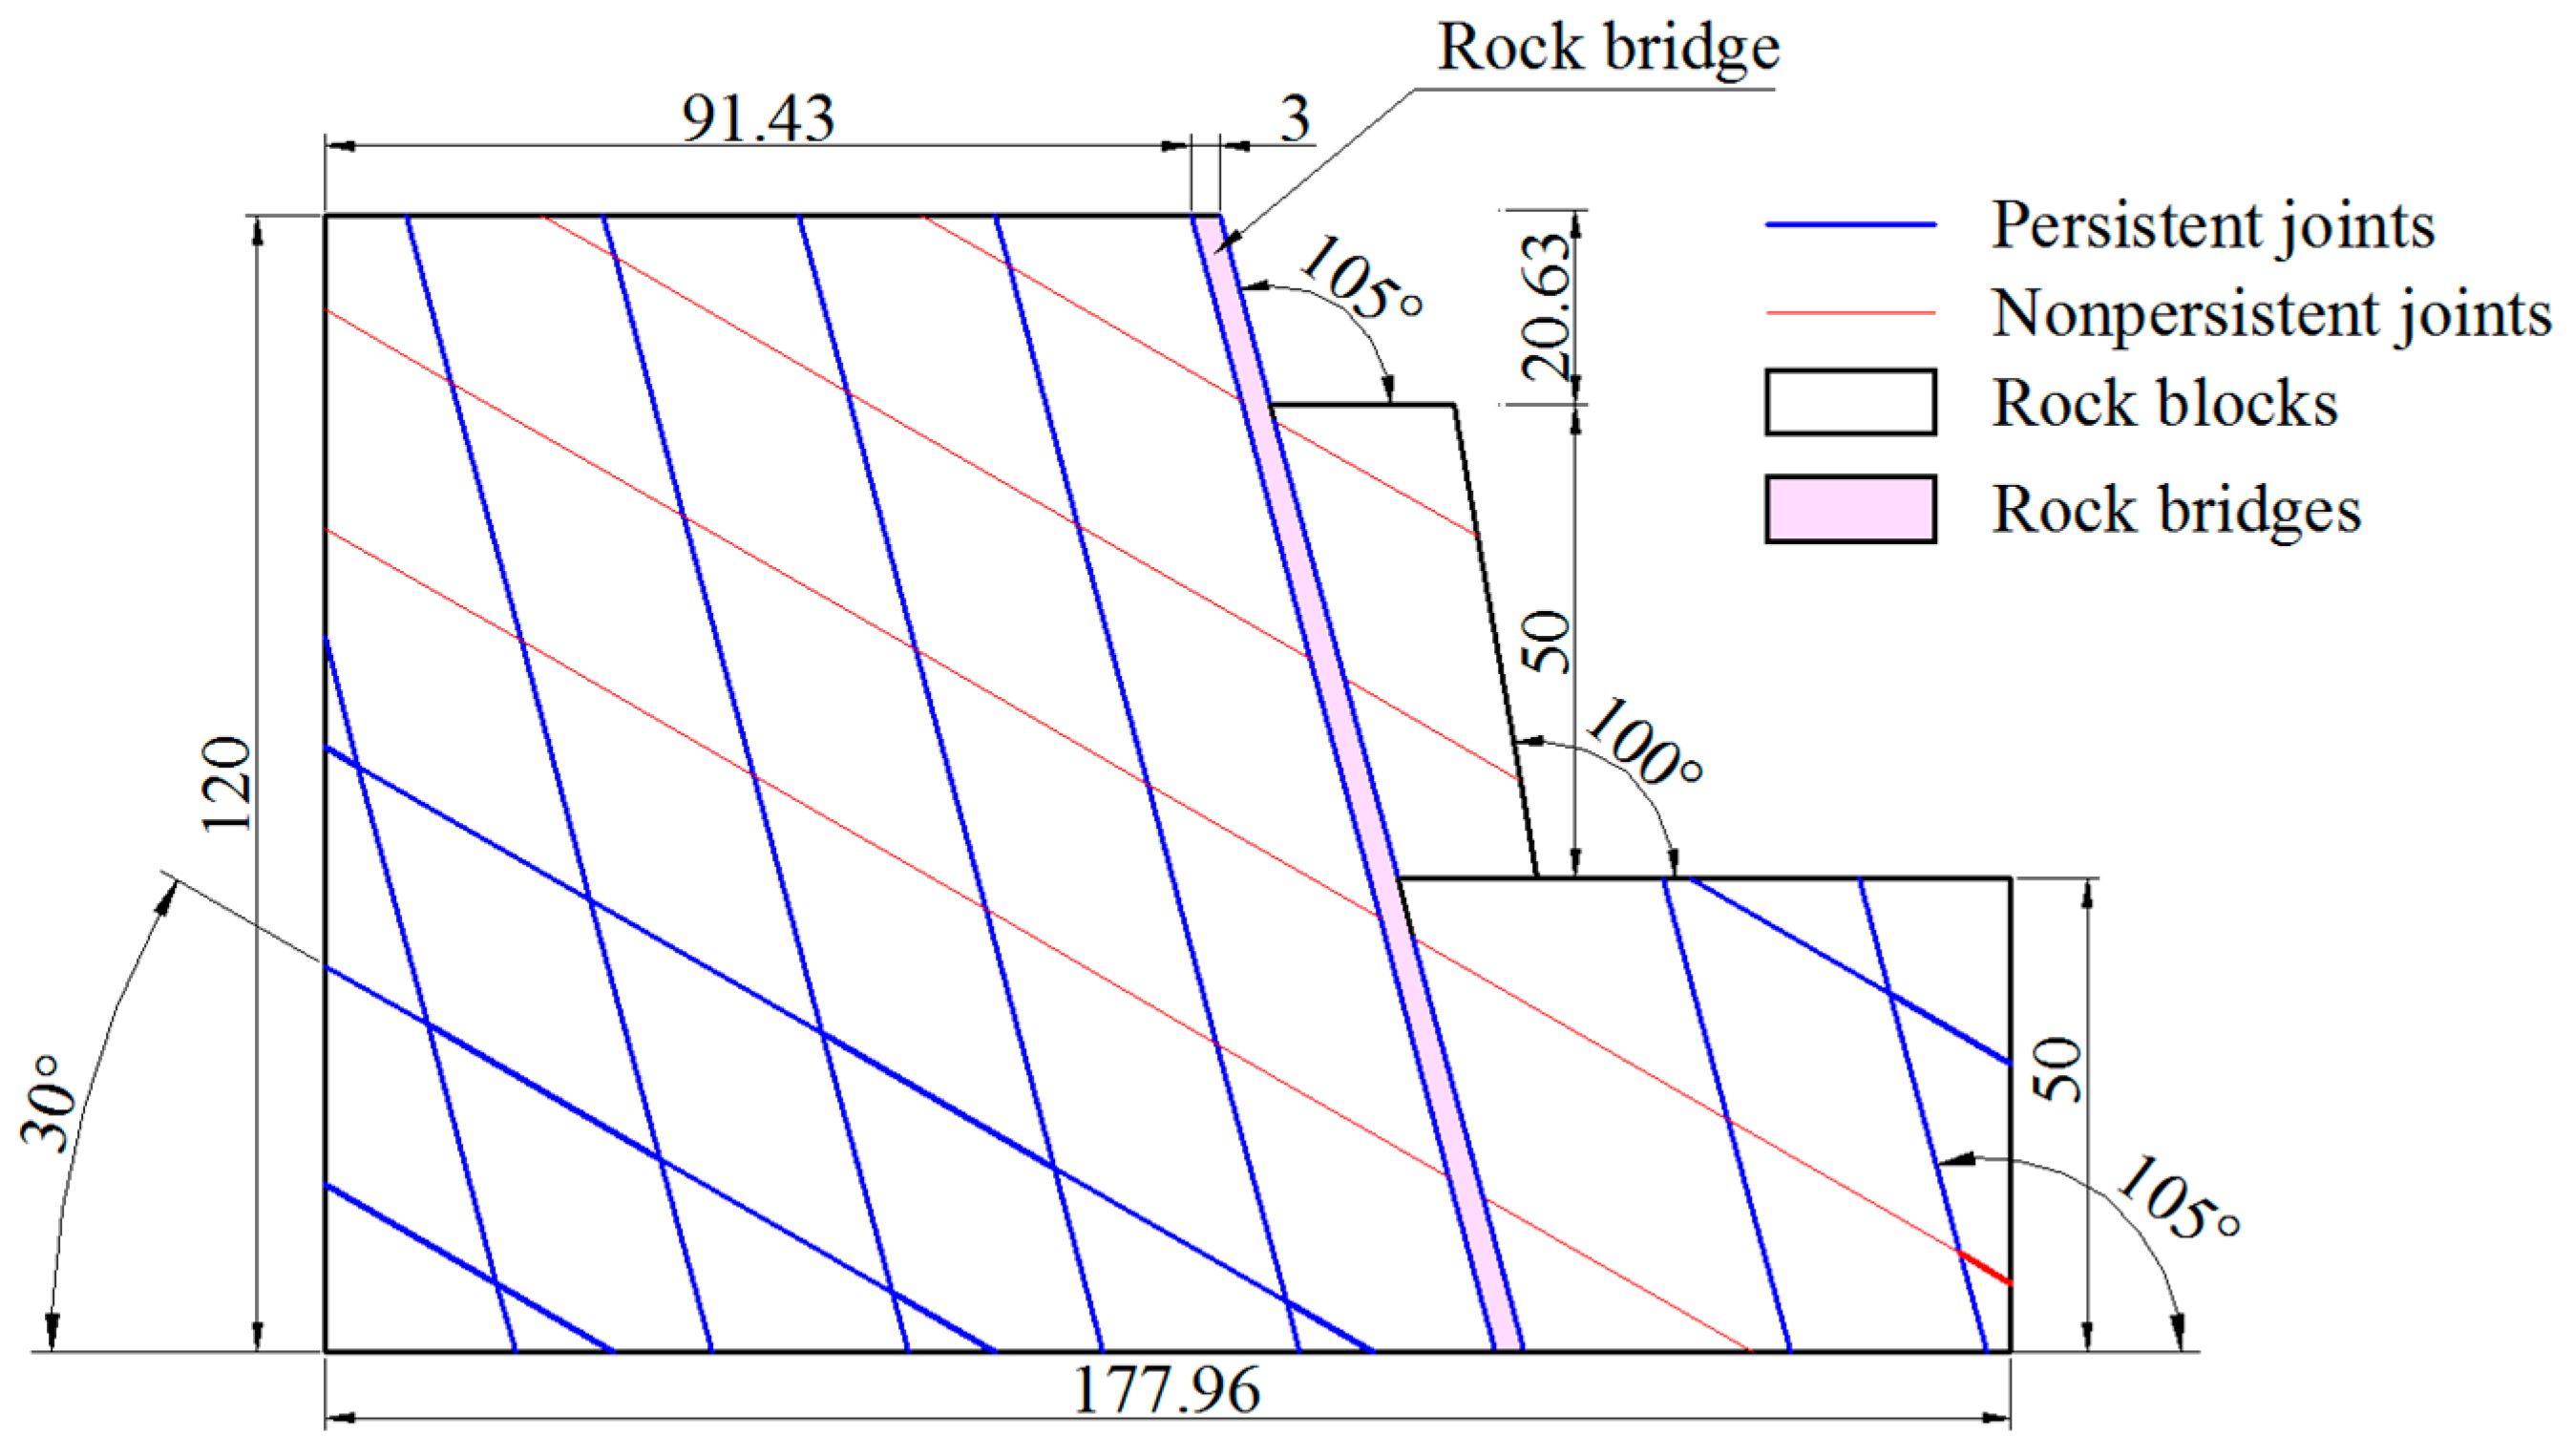
Example 3 is an artificial rock slope containing two joint sets and a rock bridge, as shown in Figure 17, in which J1 is a set of non-persistent joints, and J2 is a set of fully persistent joints. The quadrangle ABCD is a rock bridge with a width of 3.0 m that is not incised by joint set J1. The height of the rock slope is 70 m, the dip angle of joints J1 is 150°, the dip angle of joints J2 is 105°, and the two spaces of the parallel joint plane in two joint sets are 20.0 m. The physical and mechanical parameters of the rock slope are listed in Table 4.
The mixed numerical discrete method is used to divide the rock slope. The rock bridge is divided into 207 triangular finite elements, and the rock blocks are divided into 45 rigid block elements. The strength reserve coefficient calculated using the lower bound method is 1.342, which is close to that (1.289) of the Janbu method. The distribution of the yield zone under the condition of the shear parameters is shown in Figure 18. It can be seen that the true failure mode of this rock slope is the shear failure occurring along the polygonal line ABCDE (as shown in Figure 18).

6. Conclusions

For non-persistent jointed rock masses, a mixed numerical discretization is introduced into the plastic limit analysis field, and a lower bound bearing capacity model is proposed in this article. The proposed method has the following advantages: (1) This method integrates advantages of the block element method of the discontinuous mechanical problem and the finite element method of the continuum mechanics problem. In other words, the present lower bound method can be used to simulate the discontinuous medium characteristics and the continuous medium characteristics for jointed rock mass. (2) In contrast to the classic rigid limit equilibrium method, this method does not need to assume a sliding surface, which can be directly obtained by calculation. Compared with the traditional block element method or finite element method, the constitutive relation of rock materials is ignored, which means that the calculation is greatly simplified. (3) The safety factor and the true failure modes of the rock blocks and rock bridge are obtained simultaneously by calculation. The solution is a rigorous lower bound solution. The method is convenient for programming and has high calculation accuracy using a linear programming solver.

Author Contributions

Conceptualization, W.L., H.X., Z.L., X.Z., S.S. and P.P.; methodology, W.L.; software, H.X.; validation, Z.L.; formal analysis, Z.L.; investigation, Z.L.; resources, X.Z.; data curation, S.S.; writing—original draft preparation, Z.L.; writing—review and editing, W.L.; visualization, P.P.; supervision, Z.L. and X.Z.; project administration, Z.L. and X.Z.; funding acquisition, Z.L. and X.Z. All authors have read and agreed to the published version of the manuscript.

Funding

This research was funded by the National Natural Science Foundation of China, grant number 12162018 and 12262016.

Institutional Review Board Statement

Not applicable.

Informed Consent Statement

Not applicable.

Data Availability Statement

Not applicable.

Acknowledgments

This work is supported by the National Natural Science Foundation of China (grant No. 12162018 and 12262016).

Conflicts of Interest

The authors declare no conflict of interest.

Nomenclature

A e area of triangular finite element e (m2);
A b o u n d boundary condition matrix for all boundary edges of finite elements;
A e q u i l equilibrium matrix of all finite elements;
A d i s c o n t discontinuity equilibrium matrix of all discontinuities for all finite elements;
A y e i l d yield matrix for all nodes of finite elements;
B b o u n d coefficient vector of all boundary edges of finite elements;
B e q u i l load vector of all finite element equilibriums;
B y e i l d coefficient vector of yield conditions for all finite elements;
C T equilibrium matrix for all block elements;
F T global external force vector for all block elements;
L j length of interface L j between rigid block element B j and finite elements (m);
N k normal force of the interface k between two adjacent block elements in the n k direction;
N j normal force in the n j direction of rigid block element B j applied on the interface L j between rigid block element and finite elements;
Q b force vector at the boundary surfaces of block elements;
Q ¯ b known force vector applied to the boundary surfaces of block elements;
Q global internal force vector for all block elements;
V k shear force in the s k direction of the interface k between the two adjacent block elements;
V j shear force in the s j direction of rigid block element B j applied on the interface L j between rigid block element and finite elements;
b i shape function coefficients of the linear triangular finite element ( i = i , j , k ) ;
c , c ʹ cohesion of initial and final strength reduction, respectively (Pa);
c e cohesion of the rock bridge at nodes of eth finite element;
c i shape function coefficients of the linear triangular finite element ( i = i , j , k ) ;
c k cohesion of the kth interface (Pa);
f x i x component of force acting on the center of block element i;
f y i y component of force acting on the center of block element i;
l i length of the interface between finite element E i and the rigid block element B j (m);
l k length of the interface k (m);
m i number of interfaces in block element i;
n B number of all block elements;
n b surfaces number on known boundary;
n d number of finite element stress discontinuities in the rock bridges;
n e number of all triangular finite elements in rock bridges;
n j interface number between the rock blocks and finite elements in the entire rock slope;
n j e number of triangular finite elements on interface L j ;
n k number of all interfaces in all rock block elements;
n n number of nodes of all finite elements;
p number of sides of interior polygon for linearizing Mohr–Coulomb yield function;
α k inclination angle of n k -axis with respect to x-axis measured anticlockwise (°);
φ , φ ʹ friction angles of initial and final strength reduction, respectively (°);
φ e friction angle of the rock bridge at ith node of finite element (°);
φ k friction angle of the kth interface (°);
γ e unit weight of finite element (N/m3);
λ load multiplier of rock mass;
λ m strength reserve coefficient;
θ d inclination angle of the discontinuity d measured anticlockwise with respect to x-axis (°);
θ j inclination angle of the interface L j measured anticlockwise with respect to x-axis (°);
σ stress vector of all nodes for all finite elements;
σ j stress vector of nodes of finite elements on the interface L j ;
σ n i d normal stress acting on the node i of the discontinuity d between two adjacent finite elements, ( i = 1 , 2 , 3 , 4 ) ;
σ n j normal stress of the finite element j on the interface L j between rigid block element and finite elements;
( σ n 1 j / i , σ n 2 j / i ) normal stress of node 1 and node 2 of finite element E i on the interface L j in the n j direction;
σ x i x component of normal stress acting on node i of finite element;
( σ x 1 j / i , σ x 2 j / i ) x component of normal stress of node 1 and node 2 of finite element E i on the interface L j ;
σ y i y component of normal stress acting on node i of finite element;
( σ y 1 j / i , σ y 2 j / i ) y component of normal stress of node 1 and node 2 of finite element E i on the interface L j ;
( τ n 1 j / i , τ n 2 j / i ) shear stress of node 1 and node 2 of finite element E i on the interface L j in the s j direction;
τ s i d tangential shear stress acting on node i of the discontinuity d between two adjacent finite elements, ( i = 1 , 2 , 3 , 4 ) ;
τ s j normal stress of the finite element j on the interface L j between rigid block element and finite elements in the s j direction;
τ x y i shear stress acting on node i of finite element;
( τ x y 1 j / i , τ x y 2 j / i ) shear stress of node 1 and node 2 of finite element E i on the interface L j .

References

  1. Lei, Q.; Wang, X.; Min, K.B.; Rutqvist, J. Interactive roles of geometrical distribution and geomechanical deformation of fracture networks in fluid flow through fractured geological media. J. Rock Mech. Geotech. Eng. 2020, 12, 780–792. [Google Scholar] [CrossRef]
  2. Gao, K.; Lei, Q.; Bozorgzadeh, N.; Chau, V.T. Can we estimate far-field stress using the mean of local stresses? an examination based on numerical simulations. Comput. Geotech. 2019, 116, 103188. [Google Scholar] [CrossRef]
  3. Bishop, A. The use of the slip in the stability analysis of earth slopes. Geotechnique 1955, 5, 7–17. [Google Scholar] [CrossRef]
  4. Janbu, N. Application of composite slip surfaces for stability analysis. In Proceedings of the European Conference on Stability of Earth Slopes, Stockholm, Sweden, 20–25 September 1954; Volume 3, pp. 43–49. [Google Scholar]
  5. Morgenstern, N.; Price, V.E. The analysis of the stability of general slip surfaces. Geotechnique 1965, 15, 79–93. [Google Scholar] [CrossRef]
  6. Sarma, S. Stability analysis of embankments and slopes. Geotechnique 1973, 23, 423–433. [Google Scholar] [CrossRef]
  7. Griffiths, D.; Lane, P. Slope stability analysis by finite elements. Geotechnique 1999, 49, 387–403. [Google Scholar] [CrossRef]
  8. Cai, M.; Horii, H. A constitutive model and fem analysis of jointed rock masses. Int. J. Rock Mech. Min. Sci. Geomech. Abstr. 1993, 30, 351–359. [Google Scholar] [CrossRef]
  9. Kim, D.; Jeong, S. Estimation of the excavation damage zone in TBM tunnel using large deformation FE analysis. Geomech. Eng. 2021, 24, 323–335. [Google Scholar] [CrossRef]
  10. Sitharam, T.; Maji, V.; Verma, A. Practical equivalent continuum model for simulation of jointed rock mass using flac3d. Int. J. Geomech. 2007, 7, 389–395. [Google Scholar] [CrossRef]
  11. Shi, G.-H. Discontinuous deformation analysis: A new numerical model for the statics and dynamics of deformable block structures. Eng. Comput. 1992, 9, 157–168. [Google Scholar] [CrossRef]
  12. Jing, L. Formulation of discontinuous deformation analysis (DDA)—An implicit discrete element model for block systems. Eng. Geol. 1998, 49, 371–381. [Google Scholar] [CrossRef]
  13. Zhao, T.; Liu, Y. A novel random discrete element analysis of rock fragmentation. Int. J. Numer. Anal. Methods Geomech. 2020, 44, 1386–1395. [Google Scholar] [CrossRef]
  14. Goodman, R.E.; Shi, G.-H. Block Theory and Its Application to Rock Engineering; Prentice Hall: Englewood Cliffs, NJ, USA, 1985. [Google Scholar]
  15. Li, Z.; Hu, Z.; Zhang, X.Y.; Du, S.G.; Guo, Y.K.; Wang, J. Reliability analysis of a rock slope based on plastic limit analysis theory with multiple failure modes. Comput. Geotech. 2019, 110, 132–147. [Google Scholar] [CrossRef]
  16. Chen, G.H.; Zou, J.F.; Zhan, R. Stability analysis of rock slopes using strength reduction adaptive finite element limit analysis. Struct. Eng. Mech. 2021, 79, 487–498. [Google Scholar] [CrossRef]
  17. Chen, S. A general formulation of elastic viscoplastic block theory of rock masses. J. Hydraul. Eng. 1996, 1, 78–84. [Google Scholar]
  18. Drucker, D.; Prager, W.; Greenberg, H. Extended limit design theorems for continuous media. Q. Appl. Math. 1952, 9, 381–389. [Google Scholar] [CrossRef] [Green Version]
  19. Chen, J.; Yin, J.-H.; Lee, C. Upper bound limit analysis of slope stability using rigid finite elements and nonlinear programming. Can. Geotech. J. 2003, 40, 742–752. [Google Scholar] [CrossRef] [Green Version]
  20. Lysmer, J. Limit analysis of plane problems in soil mechanics. J. Soil Mech. Found. Div. 1970, 96, 1311–1334. [Google Scholar] [CrossRef]
  21. Sloan, S. Lower bound limit analysis using finite elements and linear programming. Int. J. Numer. Anal. Methods Geomech. 1988, 12, 61–77. [Google Scholar] [CrossRef]
  22. Ukritchon, B.; Whittle, A.J.; Sloan, S.W. Undrained limit analyses for combined loading of strip footings on clay. J. Geotech. Geoenviron. Eng. 1998, 124, 265–276. [Google Scholar] [CrossRef]
  23. Lyamin, A.; Sloan, S. Lower bound limit analysis using non-linear programming. Int. J. Numer. Methods Eng. 2002, 55, 573–611. [Google Scholar] [CrossRef]
  24. Yu, H.; Salgado, R.; Sloan, S.; Kim, J. Limit analysis versus limit equilibrium for slope stability. J. Geotech. Geoenviron. Eng. 1998, 124, 1–11. [Google Scholar] [CrossRef]
  25. Kim, J.; Salgado, R.; Yu, H. Limit analysis of soil slopes subjected to pore-water pressures. J. Geotech. Geoenviron. Eng. 1999, 125, 49–58. [Google Scholar] [CrossRef]
  26. Liu, F.; Zhao, J. Limit analysis of slope stability by rigid finite-element method and linear programming considering rotational failure. Int. J. Geomech. 2012, 13, 827–839. [Google Scholar] [CrossRef] [Green Version]
  27. Sutcliffe, D.; Yu, H.; Sloan, S. Lower bound solutions for bearing capacity of jointed rock. Comput. Geotech. 2004, 31, 23–36. [Google Scholar] [CrossRef]
  28. Durand, A.F.; Vargas, E.A., Jr.; Vaz, L.E. Applications of numerical limit analysis (NLA) to stability problems of rock and soil masses. Int. J. Rock Mech. Min. Sci. 2006, 43, 408–425. [Google Scholar] [CrossRef]
  29. Chakraborty, M.; Kumar, J. Bearing capacity of circular footings over rock mass by using axisymmetric quasi lower bound finite element limit analysis. Comput. Geotech. 2015, 70, 138–149. [Google Scholar] [CrossRef]
  30. Wang, X.G.; Lin, X.C. Limit analysis method for slope stability based on discretization of rigid blocks. Chin. J. Geotech. Eng. 2022, 44, 1587–1597. [Google Scholar] [CrossRef]
  31. Zhou, J.; Chen, Q.; Wang, J. Rigid block based lower bound limit analysis method for stability analysis of fractured rock mass considering rock bridge effects. Comput. Geotech. 2017, 86, 173–180. [Google Scholar] [CrossRef]
  32. Zhou, J.; Wang, J. Lower bound limit analysis of wedge stability using block element method. Comput. Geotech. 2017, 86, 120–128. [Google Scholar] [CrossRef]
  33. Li, G.; Shen, Z. Application of lower bound method of finite element method to geotechnical problems. Chin. J. Geotech. Eng. 1997, 19, 84–89. [Google Scholar]
  34. Mehrotra, S. On the implementation of a primal-dual interior point method. SIAM J. Optim. 1992, 2, 575–601. [Google Scholar] [CrossRef]
  35. Jiang, M.; Jiang, T.; Crosta, G.B.; Shi, Z.; Chen, H.; Zhang, N. Modeling failure of jointed rock slope with two main joint sets using a novel DEM bond contact model. Eng. Geol. 2015, 193, 79–96. [Google Scholar] [CrossRef]
Figure 1. Mixed numerical discretization of non-persistent jointed rock mass: (a) a non-persistent jointed rock slope contains three rock bridges; (b) mixed numerical discretization for jointed rock slope.
Applsci 12 12945 g001
Figure 2. Rigid block element: (a) forces acting on a rigid block element; (b) forces acting on an interface between two rigid block elements.
Applsci 12 12945 g002
Figure 3. Linear triangular finite element: (a) the grid for the rock bridge, (b) 3-noded linear finite element, (c) stress discontinuity between adjacent finite elements.
Applsci 12 12945 g003
Figure 4. Linearized Mohr–Coulomb yield function (p = 6).
Applsci 12 12945 g004
Figure 5. The force of interaction is on the interface between a rigid block element and triangular finite elements.
Applsci 12 12945 g005
Figure 6. Flow chart of numerical solution for the lower bound method.
Applsci 12 12945 g006
Figure 7. Sketch of direct shear test specimen with two coplanar intermittent joints.
Applsci 12 12945 g007
Figure 8. Mixed numerical discretization with different finite element grid densities (k = 60%, nb = 4): (a) ne = 8, (b) ne = 16, (c) ne = 26, (d) ne = 50, (e) ne = 116.
Applsci 12 12945 g008
Figure 9. Plot of ultimate shear load vs. edge quantity p of polygon for k = 0.6.
Applsci 12 12945 g009
Figure 10. Plot of the ultimate shear load vs. grid density of finite elements for p = 8 and k = 60%.
Applsci 12 12945 g010
Figure 11. Plot of ultimate shear load vs. joint persistence k.
Applsci 12 12945 g011
Figure 12. Sketch of jointed rock slope of example 2 (unit: m).
Applsci 12 12945 g012
Figure 13. Division of mixed elements in different joint connectivities k of example 2: (a) k = 70%, nb = 6, ne = 124; (b) k = 75%, nb = 6, ne = 95; (c) k = 80%, nb = 6, ne = 91; (d) k = 85%, nb = 6, ne = 66; (e) k = 90%, nb = 6, ne = 64; (f) k = 95%, nb = 6, ne = 61.
Applsci 12 12945 g013
Figure 14. Strength reserve coefficient λ m vs. for joint persistence k for different calculation methods.
Applsci 12 12945 g014
Figure 15. Strength reserve coefficient λ m vs. joint persistence k for different cohesions of rock bridge.
Applsci 12 12945 g015
Figure 16. Yield zone of slope with different joint connectivities k (c = 1000 kPa): (a) k = 70%, (b) k = 75%, (c) k = 80%, (d) k = 85%, (e) k = 90%, (f) k = 95%.
Applsci 12 12945 g016
Figure 17. Sketch of rock slope containing two joint sets of example 3 (unit: m).
Applsci 12 12945 g017
Figure 18. Yield zone of the slope for ck = 120 kPa; φ k = 24°.
Applsci 12 12945 g018
Table 1. Physical and mechanical parameters of example 1.
Material NameUnit Weight (kN/m3)Cohesion (kPa)Internal Friction Angle (°)
Rock mass15.004230.0026.55
Jointed plane/0.0035.20
Table 2. Calculation parameters of the direct shear test specimen.
Joint Persistence k (%) Normal   Stress   σ n   ( MPa )
902.0
802.0
702.0
600.0
601.0
602.0
603.0
Table 3. Physical and mechanical parameters of example 2.
Material NameUnit Weight (kN/m3)Cohesion (kPa)Internal Friction Angle (°)
Intact rock mass25.501000.0036.00
Rock bridge25.501000.0036.00
Jointed plane/0.0530.00
Table 4. Physical and mechanical parameters of example 3.
Material NameUnit Weight (kN/m3)Cohesion (kPa)Internal Friction Angle (°)
Intact rock mass25.00500.0030.00
Rock bridge25.00500.0030.00
Jointed plane/120.0024.00
Publisher’s Note: MDPI stays neutral with regard to jurisdictional claims in published maps and institutional affiliations.