1. Introduction
With the rapid development of information technology, the progress of network technology has made our lives more convenient. However, malware can penetrate information technology devices through loopholes in program security, which can cause system damage, limited network bandwidth, and the theft of crucial files. The frequency of malware attacks has been increasing. For example, antivirus company Kaspersky Lab detected 69,277,289 unique malicious objects in 2016 [
1]. McAfee Labs reported that 670 million malware samples were detected in 2017 [
2]. According to Malwarebytes’ annual malware report, more than 50 million cyber threats were detected separately in 2018 and 2019 [
3,
4]. The 2020 Trend Micro Cybersecurity Report stated that 119,000 cyberattacks occur every minute [
5]. Because of the wide variety of malware and the increasing number of malware attacks, various malware classification methods have been proposed by researchers.
Malware analysis can be broadly categorized into static analysis and dynamic analysis. Static analysis involves parsing and extracting the features of malicious programs without executing code. Common static analysis is a signature-based method that involves searching a signature database for matching signatures to determine whether the program is malware. A local signature database is required to store signatures extracted from malware by experts. The signature database must be regularly manually updated to effectively prevent new malware attacks. However, this approach has major limitations. Researchers and malware authors have demonstrated that malware can evade signature-based detection through new program encryption or obfuscation techniques [
6,
7,
8,
9]. Chen et al. [
10] proposed the use of four easily extractable small-scale features to classify malware families and used machine learning methods to search for the best model and hyperparameters for each feature and parameter combination. Kazuki et al. [
11] developed a malware analysis system that conducts control traffic analysis, antisink editing, feature extraction, and similarity calculation. Peyman [
12] proposed the use of heuristic-based malware detection and simultaneous byte analysis based on static features.
In dynamic analysis, malicious programs (such as virtual machines or sandboxes) are executed in a controlled environment. Malware detection results are obtained from the collection and analysis of the system operating behavior, network packets, file storage, and download items [
13]. Mohaisen et al. [
14] proposed a malware classification technology called the automated malware and labeling scheme (AMAL), which is based on automated behavior analysis. AMAL primarily uses AutoMal and MaLabel to monitor the file system and network behavior. MaLabel classifies similar malware through extracted behavioral monitoring. Support vector machine (SVM), decision tree, and K-nearest neighbor (KNN) algorithms are used to classify specific malware families. Galal et al. [
15] proposed a dynamic analysis method based on malware behavior. In this method, application programming interface (API) hooking technology is used to determine the parameters of the malware and collect relevant information; from the extracted API features, parameters, and sequences, the unique malware behavior is inferred. The decision tree, random forest, and SVM algorithms are then used to classify malware. Kolosnjaji et al. [
16] used a recurrent neural network and convolutional neural network (CNN) for feature extraction and an n-gram for malware detection. Fahade and Wei [
17] proposed the use of the longest common substring and longest common subsequence for character matching to detect malware. Damodaran et al. [
18] used numerous malware samples for the comparison of static and dynamic malware analysis.
The aforementioned static and dynamic analyses have many limitations. Although static analysis is fast and safe, it cannot be used to classify unknown malware. Dynamic analysis can be used for accurately identifying the code and determining the functionality of a malicious program; however, this method might affect the application of the computer. Therefore, some researchers have advocated the conversion of malware from binary files to grayscale images and then utilizing various algorithmic techniques to classify these malware images [
19]. In contrast to static and dynamic analysis, malware image classification does not require strong malware domain knowledge, and it bypasses the need for malware fine-tuning to overcome obfuscation techniques. Malware image classification thus allows for fast classification applicable to various malware types [
20].
Machine learning technology has been widely used to address the malware detection problem. Narayanan et al. [
21] used principal component analysis to extract features, and artificial neural networks (ANN), KNN, and SVM were then used to complete the classification of malware images. Garcia and Muga II [
22] used random forest to classify malware images, and they reported satisfactory classification results. Gao et al. [
23] proposed a malware classification framework based on malware visualization and semisupervised learning. This framework mainly includes three parts: the parts for malware visualization, feature extraction, and classification. Feature fusion methods are used to fuse local and global features to save time and improve feature correlation. Nataraj et al. [
24] proposed a classification method based on standard image features. This method is simple and efficient and requires neither disassembly nor code execution. The above-mentioned methods require the user to define the features in advance.
In recent years, many scholars have conducted in-depth research with deep learning approaches on malware detection. Lin et al. [
25] used LeNet for malware family classification. They used convolution operations to automatically extract malware features. Kalash et al. [
26] proposed a deep learning architecture to classify malware samples. Qi et al. [
27] used an adversarial learning framework for unsupervised domain adaptation to enable gradient boosting decision trees to learn domain-invariant features and to mitigate performance degradation in the target domain. Because CNNs have too many parameters and require high-performance hardware, Lin and Jhang [
28] employed convolution operations with fuzzy neural network to reduce the number of network parameters in breast cancer classification and obtained good performance. Because CNNs require numerous parameters and these parameters are difficult to determine, the trial-and-error method is widely used for parameter selection. To reduce the time and cost of experiments, the Taguchi method [
29] can be used to statistically optimize parameter selection by using an orthogonal array of influencing factors and their levels.
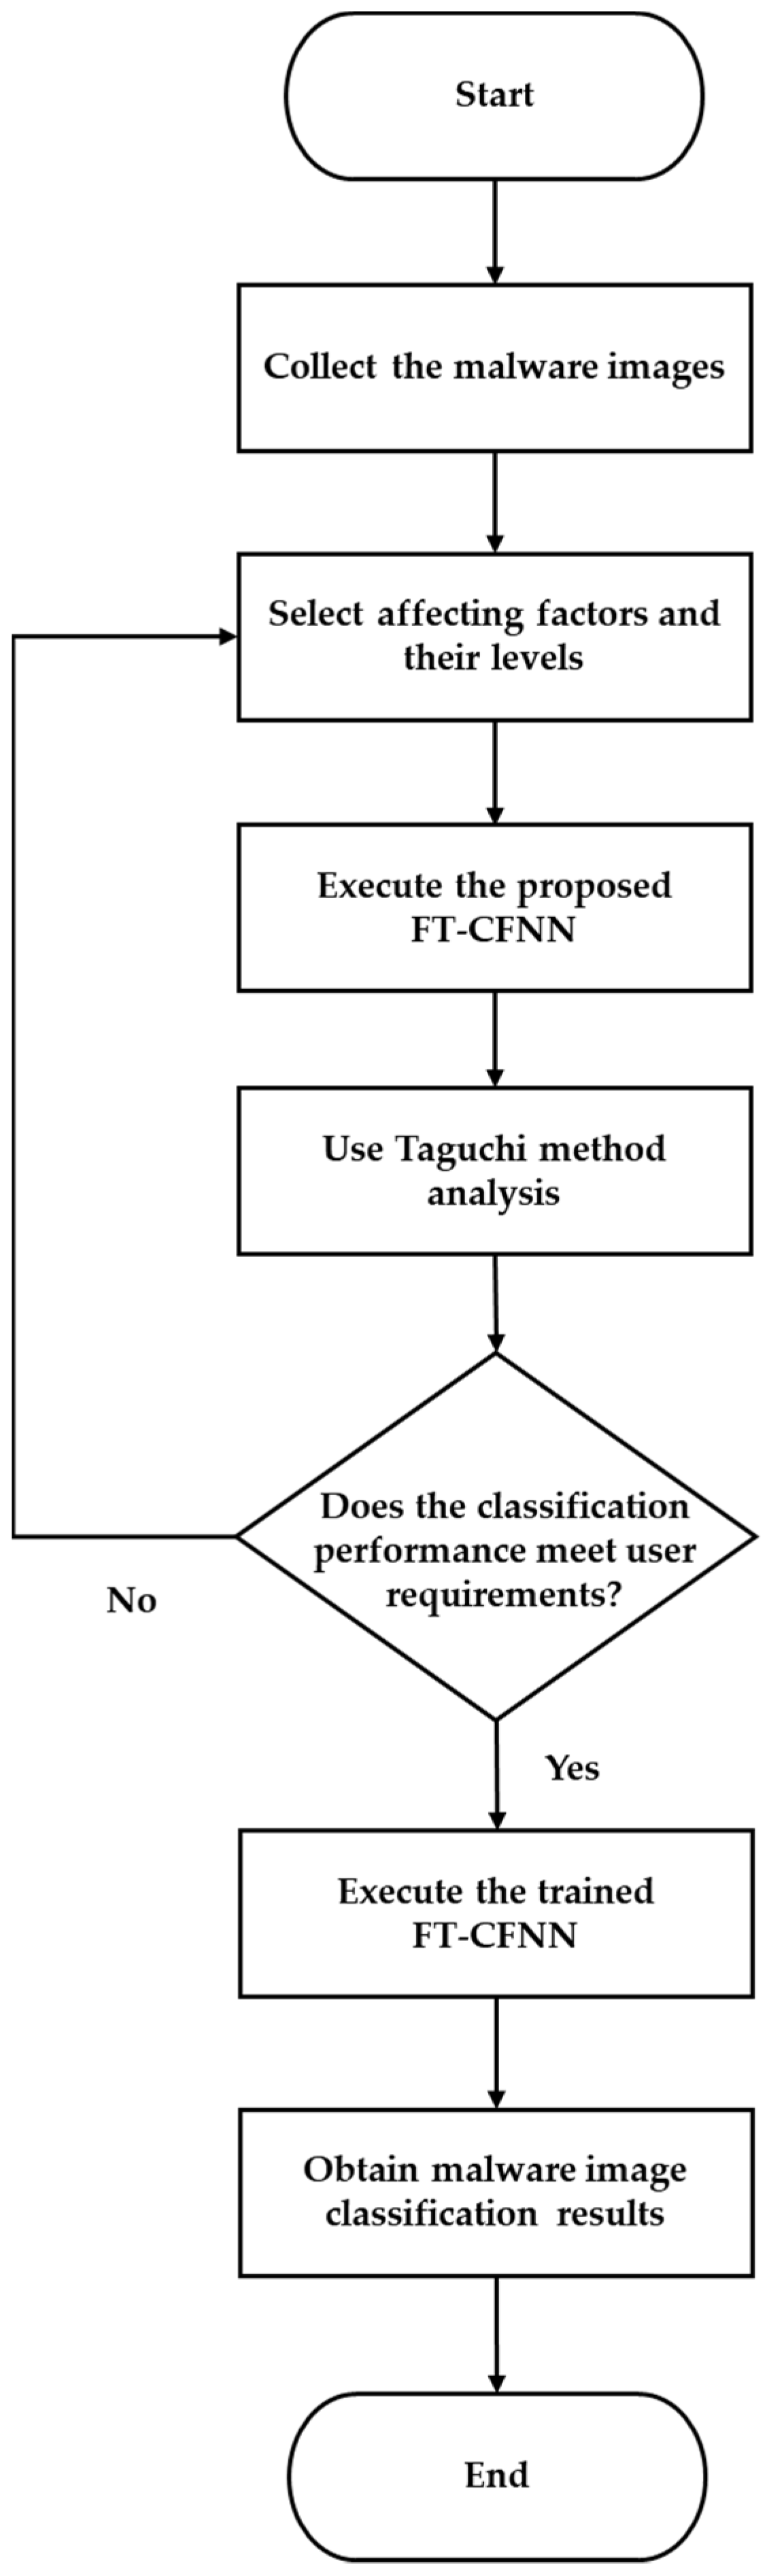
In this paper, a convolutional fuzzy neural network (CFNN) based on feature fusion and the Taguchi method (FT-CFNN) is proposed for malware image classification. The FT-CFNN comprises two parts: a CFNN and Taguchi-method-based optimal parameter combinations. The CFNN comprises convolutional, pooling, feature fusion, and fuzzy neural network (FNN) layers. Four feature fusion methods, namely global max pooling (GMP) fusion, global average pooling (GAP) fusion, channel global max pooling (CGMP) fusion, and channel global average pooling (CGAP) fusion, are proposed to reduce the feature size and integrate the network information. An FNN is used for classification. In addition, the Taguchi method is used to determine the affecting factors and the best parameter combination for achieving optimal accuracy. In this study, we focus on improving deep learning methods that require a large number of learning parameters and improving classification accuracy by optimizing parameter combinations. The major contributions of this study are as follows:
An efficient FT-CFNN is proposed for malware image classification.
Four feature fusion methods, namely GMP fusion, GAP fusion, CGMP fusion, and CGMP fusion, are proposed to reduce the feature size and integrate network information.
The size of the adjustable parameters can be reduced by replacing a fully connected network with an FNN.
To reduce the number of experiments required for the various parameter combinations, the Taguchi method is used to determine the affecting factors and levels.
The rest of this paper is organized as follows.
Section 2 describes the structure of the proposed FT-CFNN and the Taguchi method.
Section 3 presents the experimental results obtained when using the proposed FT-CFNN. Finally,
Section 4 details the conclusions of this study and recommendations for future research.
4. Conclusions
In this paper, an FT-CFNN is proposed for malware image classification. This network comprises two parts: a CFNN and Taguchi-method-based optimal parameter combinations. Four feature fusion methods (GMP, GAP, CGMP, and CGMP) are proposed for the CFNN to reduce the feature size and integrate network information. An FNN is used to replace a fully connected network to reduce the size of adjustable parameters. The proposed CFNN achieved accuracy values of 96.68%, 97.86%, 98.13%, and 97.64% with the GMP, GAP, CGMP, and CGMP fusion methods, respectively, for the Malimg dataset. The experimental results indicated that the CFNN achieved the highest accuracy with the CGAP fusion method. To reduce the number of experiments for parameter combinations, the Taguchi method was used to determine the affecting factors and levels. The experimental results indicated that the accuracy of the FT-CFNN, proposed CFNN, and original LeNet model in malware family classification was 98.61%, 98.13%, and 96.68%, respectively.
Because the Malimg dataset only contains 9339 images, generative adversarial networks can be used in the future to increase the number of images and thus improve stability. Indicators such as accuracy, sensitivity, and specificity have been widely used by scholars for comparing the classification and identification performance of deep learning networks. However, these parameters have different values in each network learning training step; therefore, the use of a single value or index average to assess a network’s image classification performance might lead to inaccurate assessments. Therefore, future research should address this problem by using statistical methods to define a performance recognition index. Furthermore, in this study, we only use the existing malware database for analysis and classification, and do not apply the proposed method to actual cyberattack problems. Therefore, we will also apply the proposed method to practically any malicious programs that steal crucial data in future research.


