Abstract
Surge is a phenomenon that limits the operating range of the compressor at low engine speeds and high boost pressure in turbocharged powertrains. This article assesses two prototype turbochargers of variable geometry orifice (VGO) which compensate for the limitation of the boost pressure at low engine speeds. The VGO prototypes modify the inlet compressor section, extending the compressor characteristic map into lower mass flows (surge limit region). The VGO turbochargers analyzed are also both equipped with variable geometry turbine (VGT) technology. The experiments focus on low-end torque operation ranges in steady and transient engine running conditions. The experimental results are used to validate a 1D physical model. From the modelling perspective, a comprehensive study of the VGO-VGT prototypes is assessed. Results reveal the benefits of VGO technology in terms of attaining higher boost pressure, improved compressor efficiency, and overall engine performance at low engine speeds.
1. Introduction
Developing the compressor for a wide flow range is essential for improving the internal combustion engine (ICE) operation at low engine speeds. Surge is a phenomenon that limits the operating range of the compressor at low air mass flow rates/low engine speeds. Surge and rotational stall in axial flow compressors were studied by Greitzer et al., theoretically in [1] and experimentally in [2], to provide a non-dimensional parameter on which surge, or stall response depends. Surge mitigation is possible by changing piping geometry or using air filters, flow straighteners, or inlet air throttling upstream of the compressor. Researchers from [3] presented an extended version of the Greitzer surge model, and results show that surge is a system-dependent phenomenon influenced by compressor aerodynamics and boundary conditions. Extensive research in the transonic state has also been carried out, experimentally and using calculation, to explain the lower compressor performance. For example, using particle image velocimetry (PIV) studies, Brandstetter et al. [4] revealed blade vibration correlated with an axial velocity around the blade leading edge. Under the same flow condition, computational fluid dynamics (CFD) analyses presented by Szymanski et al. in [5] showed high flow separation and losses in the hub region, resulting in an 18% decrease in compressor discharge pressure.
The development of map-based compressor range extenders has been a prime focus for research, either to bypass the flow at stall/higher mass flow rates or streamline the flow at surge/low mass flow rates. One such concept of variable inlet guide vanes (VIGV) has been analyzed extensively, using experimental and CFD simulation analysis [6]. Several researchers have taken the knowledge available from the design and development of aeronautical applications to study different compressor configurations. These configurations include variable stator vanes (VSV) and VIGV, which can be used efficiently near surge and stall. With the available resources from VIGV and VSV, Bringhenti et al. [7] analyzed the different compressor configurations, including variable nozzle guide vane (VNGV) and variable geometry compressor (VGC). Simulation analysis performed by Bringhenti et al. [7] shows that VGC and VIGV can be used for automotive applications to perform near surge and stall. Other studies carried out by Canova et al. [8] in 0D and Herbst et al. [9] in 1D analyzed automotive diesel engines with VGC and VIGV, respectively, and highlighted the benefits of such systems near surge. The available knowledge was then used to develop a compressor with variable geometry for gasoline engines. 1D and 3D simulations were used to calculate and identify potential losses and constraints over a fixed geometry compressor, and results are depicted in [10]. Researchers such as Stuart et al. [11] eliminated the use of inlet pre-whirls guide vane and implemented an electrically driven axial flow fan upstream of the compressor. By doing such an operation, the inlet pre-whirls generation is entirely regulated by the fan and aided in efficiently generating large pre-whirls at low mass flow rates.
Other studies dealing with laser droplet anemometry (LDA) were performed on VIGV to study the pre-rotational flow generated by VIVG, and its effect on compressor performance is analyzed and detailed in [12]. The objective in [13] was to extend compressor performance using VIVG in the transient engine running conditions at low-end torque. For this purpose, a curved wall cavity technique was studied in [13] and shows a 30% extension beyond the surge limit compared to conventional VIVG. CFD studies on VIGVs conclude that under high mass flow rates, flow separation occurs on the splitter’s surface, while at low flow rates, flow separation occurs on the suction surface along the main blades [14]. Other studies of inlet pre-whirl using RANS (Reynolds Average Navier Stoke) were studied by Zheng et al. [15]; results show that variable inlet pre-whirl increases the stable operation of the compressor near surge, and an improvement in torque of 42% is estimated. Experimental and model-based assessments were conducted by Galindo et al. [16]; changing the pipe dimension upstream of the compressor, both showed differences in amplitude and frequency of pressure pulses when the compressor is operating near the deep surge limit. The same concept of bent pipes was assessed using CFD by Hellstrom et al. [17] to investigate an unsteady flow field and its effects on inflow pulsations. The idea of a lumped parameter model used for the prediction of the impact of piping systems on surge characteristics in centrifugal compressors was presented by Tamaki et al. [18]. PIV and Large Eddy Simulation (LES) were performed on ported shroud compressor to assess flow separation in the inlet and outlet of the compressor housing, as described in [19]. Using an artificial neural network (ANN) and regression analysis, researchers in [20] predicted and analyzed the non-uniform distorted flow occurring at transonic compressor operating conditions using CFD. The CFD assessment results provided a robust modeling tool for predicting pressure distortion at the tip and hub branch in such operating conditions.
Dual entry compressor concepts were also assessed, looking for an improvement in compressor performance and surge mitigation; such systems have shown compressor stability at different altitudes by increasing the strength at the inlet boundary, as mentioned in [21]. Variable geometry orifices (VGO) were assessed for improvements in compressor performance at low-end torque. Results show about 3% improved compressor efficiency at low mass flow rates. Furthermore, the VGO had to be deactivated at higher mass flow rates as VGO induced flow losses and degraded the compressor performance, as shown by Zhao et al. [22]. New generation turbocharged powertrains need to meet the future emission standards described by Serrano et al. [23] and lay a path for upcoming engines and range extenders, such as the two-stroke Direct Injection (DI) engine presented in [24]. Extensive research is also available on the performance of turbines proposed by Serrano et al. [25] and in extreme off-design conditions [26].
The existing literature is particularly limited to the analysis of compressor technologies using a modeling approach, such as CFD simulations. However, very little experimental information is included. In addition, the impact of the technology on a realistic application has not been evaluated. In this study, the innovation lies firstly in testing and evidencing the influence of the VGO technology on compressor maps from an experimental perspective. Following this line of investigation, the differences are evaluated in the context of a state-of-the-art automotive engine, using an experimental approach. Finally, part of the innovation and contribution to this field of this study is evidenced in the development of a 1D engine and turbocharger modelling, based on which further analysis can be performed regarding steady state and transient operation. In summary, this study contributes to understanding in which scenarios it would be interesting to use this technology and quantifies its impact. Two compressor prototypes in steady state and at heavy transient operation are assessed. Not only are the compressor improvements evaluated but also the side effects on engine operation. An analysis of engine behavior is first attempted from an experimental point of view. A modeling methodology is proposed to overcome the experimental uncertainties and variability.
For this, a description of the method followed is included in Section 2. In Section 2.1, detailed information on the experimental setup in both steady state and transient engine operation is provided. In Section 2.2, the results of model development and validation results are presented. Results regarding steady states and transients modeling are shown in Section 3.1 and Section 3.2. Finally, the conclusions about the primary outcomes of this study are outlined.
2. Method
The VGO mechanisms in the turbochargers analyzed consist of adjusting a set of vanes upstream of the compressor’s wheel. This mechanism is a binary one, either fully open or fully closed. The available “open” configuration is the default one, which would correspond to the standard version of the compressor (without the VGO technology). In other words, the VGO geometry provides the flexibility to configure the “closed” setup, in which the operating range is widened towards lower mass flows; in other words, the surge is delayed. Identifying the benefits of this technology is the main purpose of this work.
To evaluate both VGO prototypes, first, an experimental engine campaign was performed with TC−1 (TurboCharger−1). This paper presents a detailed description of the experimental test setup, turbocharger limits, and the data collected in Section 2.1. Results deal with transients and low-end torque operation.
A 1D engine model was built and validated based on the experimental data; this is shown in Section 2.2. These activities dealt exclusively with the TC−1 unit and employed the GT-Power software.
Section 3, “Results and Discussion”, proposes a modeling campaign dedicated explicitly to analyzing and quantifying the VGO technology’s potential improvements in the context of new-generation diesel engines. To enhance the robustness of the study, a second turbocharger (TC−2) was used. TC−2 was also equipped with VGT and VGO technologies. The engine model is common to both turbocharger units, and the only difference in the modeling activities lies in the turbocharger element. For this prospective modeling, two separate studies were conducted: the so-called “steady state extended boost” and the “transient operation for extended boost”. In the results, variables such as compressor efficiency, boost pressure, BMEP (Brake Mean Effective Pressure), and turbine efficiency were used and easily established, due to the capabilities of the model.
Finally, the conclusions about the primary outcomes of this study are outlined. Figure 1 provides the schematic overview of the work performed for this study.
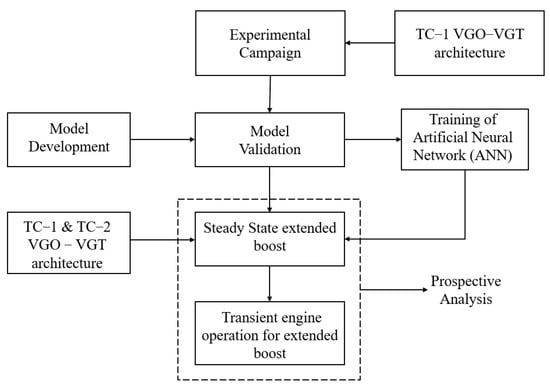
Figure 1.
Scheme of the work developed in this study.
2.1. Experimental Setup
The engine used for this application is a new generation 4-cylinder, 2-L displacement, direct injection, and turbocharged compression ignition automotive application engine. This engine is already homologated and commercialized, and hence is already part of pollutant emissions legislation. However, in line with the idea of minimizing greenhouse gas emissions, the engine is being upgraded from several perspectives, as evidenced in this study, from the turbocharger point of view. Some of the main specifications of the engine are included in Table 1. INCA software from ETAS company controls the engine actuators, such as injectors and VGT. Figure 2 shows the schematic layout of the engine test setup. It comprises a water-charge air cooler (WCAC) in the inlet manifold. Although an exhaust gas recirculation (EGR) control is not included in this work, the engine contains a low-pressure exhaust gas recirculation loop. The information related to the sensors employed in this study is provided in Table 2.

Table 1.
Engine specification.
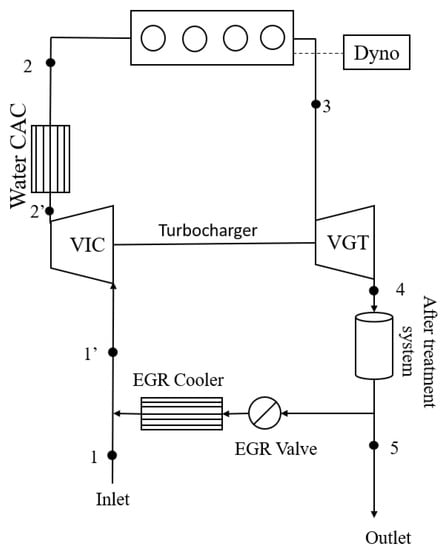
Figure 2.
Schematic layout of the engine test bench.
Table 2.
Engine test bench instruments.
Several boost pressure operations in full load conditions have been conducted with Turbocharger 1 (TC−1) at constant engine speeds (1000 and 1500 RPM). In these tests, the VGT position was closed, until at least one thermomechanical limitation was reached. The results of the experiments are shown in Figure 3, dealing with BMEP, compressor outlet temperature, turbine inlet pressure, break specific fuel consumption (BSFC), and compressor inlet temperature as a function of the achieved boost pressure. The limitations taken into account are detailed in Table 3. These limitations had to be considered during the experiments and in the last modeling activities. Surge represents another limitation in addition to the ones in Table 3.
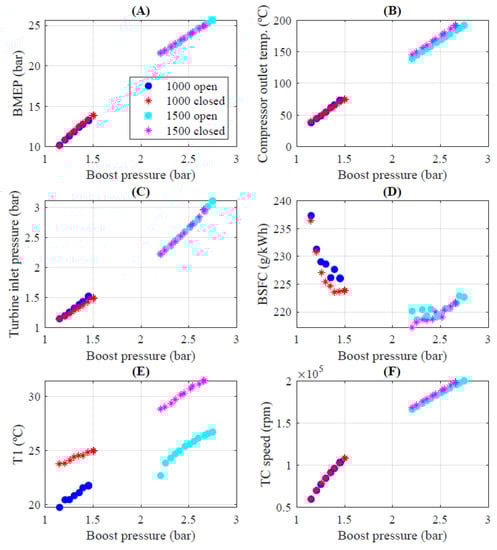
Figure 3.
Results of Experiments for TC−1: BMEP (A), Compressor outlet temperature (B), Turbine inlet pressure (C), BSFC (D), Compressor inlet temperature (E), and Turbocharger Speed (F).
Table 3.
Engine limitations.
As depicted in Figure 3, higher boost pressure was achieved at 1000 RPM with the closed VGO configuration, due to the extended margin in the surge line. In other words, for the same engine speed, surge occurred at lower boost pressure at the open configuration, limiting the achieved boost and BMEP. Furthermore, in the closed series, turbine inlet pressure was systematically lowered along the complete 1000 RPM series. All these differences are presumably attributed to the VGO impact on the TC performance. First, the efficiency improvement in the compressor at the low-end operative range diminishes the required p3 (with respect to the open configuration). Secondly, the retarding surge line therefore allows for an even slightly higher boost in combination with lower engine backpressure. All this directly impacted BMEP, which was slightly higher (about 0.6 bar higher). As a result, BSFC values also showed subtle benefits towards the closed configuration; in the best cases, 2 g/kWh improvement was achieved. No significant turbocharger speed differences were observed. The atmospheric conditions all support the previous discussion: despite higher T1 values in the closed series (which imply higher compressor inlet temperature), a lower compressor outlet temperature takes place, compared to the open series, which is in line with the improved efficiency of the compressor (at closed configuration) in such operative conditions.
However, for 1500 RPM, a lower boost (hence, lower BMEP) was achieved in the closed configuration. The reason is that the compressor outlet temperature limit of 200 °C, shown in Figure 3B, was reached at a lower boost pressure level. This could be attributed to the unequal ambient temperature. The results of the temperature differences or compressor efficiency (or a combination of both) can be seen in Figure 3E. However, the turbine inlet pressure differences were negligible, as well as BSFC figures. Also, TC speed differences did not show any discrepancy. This shows that no change in the turbine-compressor matching emerged because of the VGO operation (at least for the mass flow range analyzed). In any case, the conclusions may be biased by dispersions arising during the experiments and reducing testing productivity. This is the primary motivation for developing an engine model to overcome this problem.
TC−1 operates with the compressor orifices as fully open or fully closed. The switching between the positions is carried out manually, and a dedicated actuator is used for locking the part. A schematic layout of the VGO technology is depicted in Figure 4. Figure 4A shows the VGO architecture in an open configuration, while Figure 4B shows VGO technology in the closed position. As Figure 4 shows, the minimum diameter at the compressor inlet () was restricted in the closed configuration ( > ). Following the procedure explained in [27], the compressor maps in the respective configuration were obtained. The resulting maps for TC−1 under open and closed configurations are included in Figure 5, as well as the speed and efficiency maps. Furthermore, Figure 5 includes, in black dotted format, the experimental information constituting the compressor map for the closed configuration. The closed VGO map has also been translated into the open map plots to show the impact of this mechanism on the open configuration (the default one). The information outside of the dotted area in the closed configuration corresponds to extrapolated information.
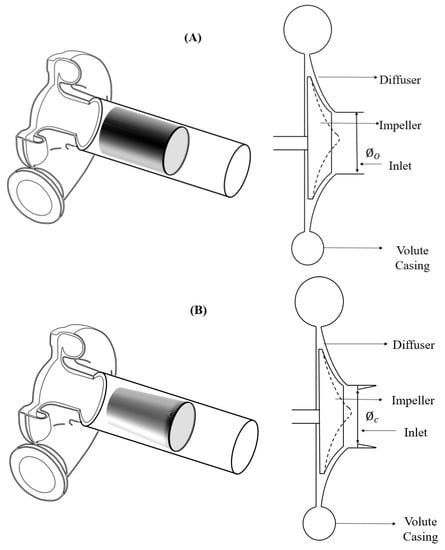
Figure 4.
Isometric view and schematic view of (A) VGO in open configuration and (B) VGO in closed configuration.
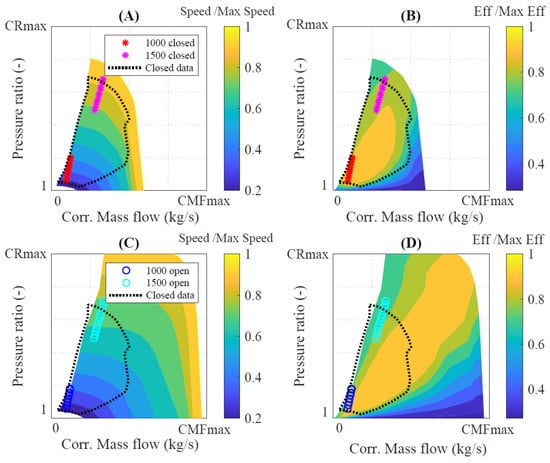
Figure 5.
TC−1 compressor maps: (A,B) for closed configuration and (C,D) for open configuration.
The experimental points regarding the engine test bench have also been included in the compressor maps. The surge limit was reached in the 1000 RPM series (red asterisks for closed and blue circles for open). However, for the closed configuration, the surge limit was slightly less restrictive and allowed for a further boost in the low-end engine speed, as previously described in Figure 3.
The open configuration of the compressor showed a wider operative area, specially extended at high, corrected mass flows. The open configuration also showed that the maximum efficiency operative area is wider. In all, Figure 5 shows that the closed configuration is mainly developed for the left side area of the compressor operative map, aiming to retard the surge line, and improving the efficiency at the low-end. This is the reason why this study mainly focuses on the low-end working conditions at both transient and steady-state operations.
The second prototype of VGO TC was also evaluated in this study. This TC is labeled TC−2 and also employs VGT technology. TC−2 maps come from the supplier. As for the TC−1, the maps were adiabatized considering testing standards for diesel engines as per SAE J1826. The resulting maps for closed and open configurations are depicted in Figure 6. The black dotted series, which corresponds to the experimental data for the closed configuration, is also included in the open maps, for purposes of comparison.
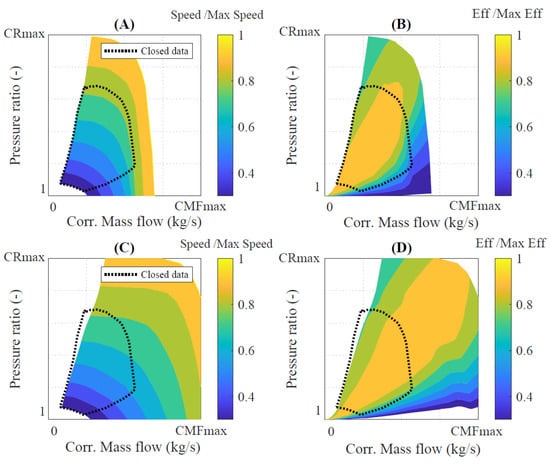
Figure 6.
TC−2 compressor maps: (A,B) for closed configuration and (C,D) for open configuration.
Here, the trends and conclusions observed at TC−1 were confirmed: the closed position of the mechanism extended the operative map towards lower mass flows and the efficiency in such area. However, the closed position restricted the inlet section, limiting the maximum compressor mass flow. As in TC−1, TC−2 shows the efficiency drop in the closed configuration and high mass flows.
Regarding the transient tests, a harsh transient was forced by performing a pedal shift from 2 bar BMEP to full load. Figure 7 shows the case of the lower speed transient, where some improvement can be observed for the closed series regarding turbine inlet pressure: substantially lower p3 was required for similar engine output. Also, the compressor outlet temperature was lower in the case of the closed configuration, which could be attributed to either the compressor efficiency, ambient boundaries or a combination of both effects.
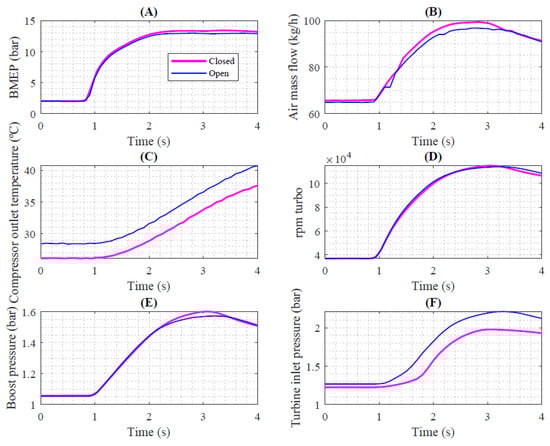
Figure 7.
1000 RPM experimental results at transient operation for open and closed VGO configurations in TC−1: BMEP (A), Air mass flow (B), Compressor outlet temperature (C), Turbocharger speed (D), Boost pressure (E), and Turbine inlet pressure (F).
Two main parameters were considered for evaluating the transient response: the time to achieve 90% of BMEP, and the integrated area regarding torque evolution as a function of time. For the second, BMEP can be directly converted into torque according to (1), where corresponds to the engine speed, corresponds to cylinder displacement, and to the number of power strokes per engine revolution, which is 0.5 in the case of a 4-stroke engine. The result from Equation (1) was applied at each time step and was then integrated and multiplied by engine speed, as Equation (2) shows, resulting in the developed work through the considered time.
The integrated area was considered between the tip-in start until 4 s later, to ease the comparison between closed and open series.
Regarding BMEP evolution, a slight advantage of 0.1 s was identified towards the closed configuration at 1000 RPM, but no benefit was identified at 1500 RPM. Finally, integrating the trapped area below BMEP evolution showed an absolute improvement of 1.17 kJ, representing a 1.5% improvement of the closed VGO configuration over the open one and in terms of work developed through the maneuver. A summary is included in Table 4 for both transient evolutions.
Table 4.
Summary of experimental transient operation performance.
The differences identified may be attributed not only to the compressor technology but also to other uncontrolled variables, such as environmental boundaries or VGT control, which is purposely developed for the VGO open configuration while not explicitly adapted to the VGO closed design. All the previously established attributes may impact on the differences to some extent, motivating the complete engine model development.
2.2. Model Development and Validation
This section consists of three subsections providing information related to the developed model in the GT-Power software and its corresponding validation using experimental results from steady states and transients.
2.2.1. Model Description
The engine model developed for this application uses the GT-Power software stack. The modeling of the turbocharger in this tool is implemented using compressor and turbine templates. These templates are called map-based 0D elements, with the flexibility for choosing between open/closed compressor maps. Hence, from the modeling perspective, it would be easy to identify the differences, guaranteeing complete control regarding the rest of the simulation.
For the combustion profile, a simple, non-predictive approach was considered by imposing the burnt rate as a function of the crank angle or time [s]. The Wiebe function defines this heat release [28]. The function uses the parameters such as the Wiebe exponent, start of combustion, and combustion duration to replicate the experimental in-cylinder pressure profile. Furthermore, the combustion processes obtained are used to train an artificial neural network (ANN) to overcome the limitation of predicting the combustion profile during the later prospective analysis. The ANN uses parameters such as engine speed, trapped mass, in-cylinder pressure, and temperature at inlet valve closer crank angle position as inputs to predict the 50% burnt rate, burning duration from 10% to 90%, and the Wiebe exponent. This information is provided to attain the heat release rate (HRR) for the extended boost study. Detailed information on the model procedure development and robustness can be read in [29]. The information on the air-to-fuel ratio is directly available from the data acquired from the test bench, which is used in the modelled injector settings to provide fuel mass in order to attain desired peak in-cylinder pressures.
To obtain the experiment’s intake temperature, a dedicated WCAC was implemented, using the experimental inlet and outlet temperature of the cooler and guaranteeing a good prediction of the intake manifold by adjusting a heat transfer multiplier. In addition, heat transfer effects through the exhaust manifold were fitted, in order to obtain accurate temperature predictions. For this purpose, a set of heat transfer multipliers had to be used, again, following the proposed methodology in [29]. Once these multipliers were identified, they were held constant throughout the simulation assessment. Further explanation of the procedure is detailed in [30] to understand the number of variables considered during the fitting process.
2.2.2. Model Validation under Steady State Operation
The 1D model used for this investigation was validated using the previously explained experimental data. For the validation, information related to exhaust manifold pressure, BMEP, BSFC, and compressor outlet temperature are shown in Figure 8. The X-axis refers experimental data, while the Y-axis shows the modeling predictions. Figure 8 includes a ±5% error in the dotted line (a continuous black line corresponds to the perfect agreement). This model validation was carried out for TC−1, taking advantage of the working points in Figure 3.
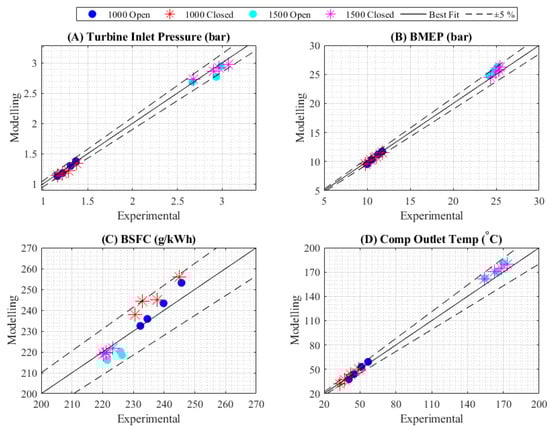
Figure 8.
Simulation data compared to testing data at 1000 and 1500 RPM: turbine inlet pressure (A), BMEP (B), BSFC (C), and compressor outlet temperature (D).
First, Figure 8A, dealing with turbine inlet pressure (p3), shows a high accuracy in prediction, which is an indication of good practice in predicting the turbine and compressor efficiencies and their corresponding temperature boundaries. Any overpredicted turbocharger efficiency would lead to systematic underpredictions in the required p3 for a given boost pressure. Another indicator of accurate compressor efficiency is the compressor outlet temperature (T2), which, in any case, is close to the perfect agreement, as seen in Figure 8B.
BMEP and BSFC were selected as the primary variables for the assessment of modeling practices. BMEP and BSFC are good combustion modeling indicators and allow for the validation of the developed ANN. Overall, observing the results depicted in Figure 8, it can be concluded that the model developed is thermofluid-dynamically stable and representative of the engine performance; hence, it is acceptable for use in further prospective studies, such as in this study.
2.2.3. Transient Model Validation
The experimental data were also used in transient engine running conditions to validate the developed 1D tool. Figure 9 gives information on the transient profile comparison between the experimental and the simulation results. As mentioned earlier, the tip-in simulates an abrupt load demand, from 2 bar BMEP to full load, until an almost steady-state operation is achieved.
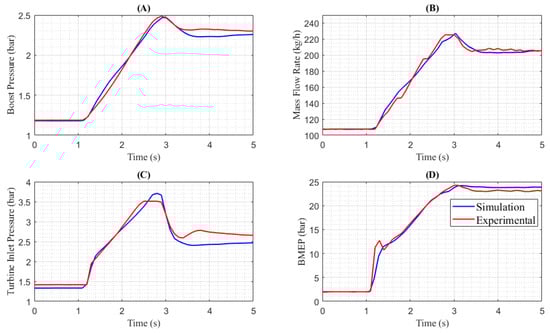
Figure 9.
Simulation data compared to testing during sudden transient demand at 1500 RPM: Boost pressure (A), Air mass flow rate (B), Turbine inlet pressure (C), and BMEP (D).
The strategy consisted of imposing a constant engine speed operation (as for the experiments). The experimental boost was the simulation target through the calculation managing the VGT position, imposed according to the procedure followed in [25]. The simulation in Figure 9 shows a 1500 RPM engine speed in open VGO mode. During the initial low load (corresponding to approximately 30 Nm), the desired boost pressure attained in the experiment and simulation is about 1.18 bar. Due to achieving similar boost pressure in both experimental results and simulation prediction, the relative error in mass flow rate at low load was almost negligible. The model p3 prediction was highly accurate. No errors were identified during the low steady state before the full-load demand.
Once the load demand started (approximately at 1.1 s), until second 2, the model perfectly targeted the desired boost, air mass flow, and BMEP. After 2.1 s, there was some mismatch regarding boost pressure. The model evolution was not as fast as the experiments, which is attributed to a possible mismatch in VGT management, which is also reflected in p3 growth. In summary, the relative error in the exhaust manifold pressure was lower than 5%.
Finally, as the engine reaches stability at full-load conditions, model prediction provided accurate results regarding boost (which converges with the experimental value), with the subsequent proper air mass flow and BMEP prediction.
3. Results and Discussion
3.1. Steady State (Low-End Torque)
This study focuses on the VGO impact on the low-end torque, using the developed and validated engine-TC model. Simulations are performed at 1000 and 1500 RPM in this section. The methodology followed consists of performing iso-boundary and iso-AFR (Air to Fuel Ratio) calculations; hence, the differences arising would be solely attributed to compressor performance differences. The VGT is imposed to follow a sequence of steps, with sufficient time between each step, to guarantee stabilization. Each stage corresponds to another 1% VGT closure. Consequently, it would be possible to identify within a 1% VGT resolution the variables that imply the boost limitation and the corresponding performance. Figure 10A represents the procedure explained for the VGT management, and the resulting boost pressure sequence is plotted in Figure 10B.
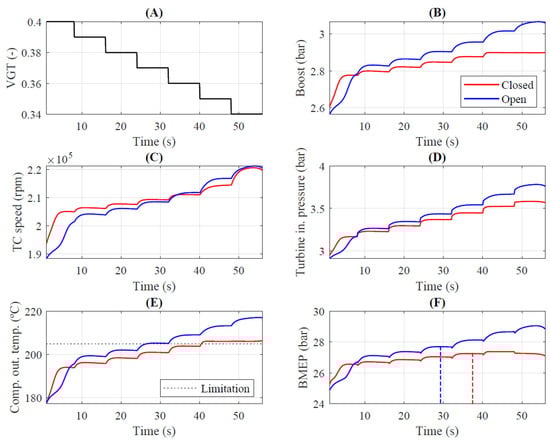
Figure 10.
VGT management for extended boost study and resulting boost pressure. Cases dealing with TC−1, 1500 RPM, closed and open configuration: VGT actuator (A), Boost pressure (B), Turbocharger Speed (C), Turbine inlet pressure (D), Compressor outlet temperature (E), and BMEP (F).
Following this line of investigation, thermomechanical limitations are identified for each compressor configuration and engine speed. In the example of 1500 RPM and TC−1 (in both configurations), it is shown that TC speed limitation (see Figure 10C) and turbine inlet pressure (see Figure 10D) were under safe operation. Furthermore, at 1500 RPM, the surge margin was far from being reached. The compressor outlet temperature was the unique limitation for both configurations, as observed in Figure 10E, where both series approach the thermo-mechanical constraint (dashed string). Having reached the value of 205 °C, the boost achieved by the open configuration is about 2.9, while the closed is about 2.87. BMEP figures are 27.75 and 27.32 bar, respectively.
In this case, the limitation for TC−1 is the same as in the experiments: the compressor outlet temperature. However, at this point, the differences are only motivated by the compressor configuration and not by the boundary conditions, which are assumed to be the same for both simulations. These differences originated from the compressor efficiency maps. At the selected “maximum performance points”, the open configuration provides 0.35% higher efficiency, which is the reason why a slight boost is achieved for the same T2 limitation.
The same analysis is repeated for 1000 RPM; however, in this case, the limitation is the surge phenomena, which appears sooner for the open configuration, imposing a more restrictive boost (1.44 bar) compared to the closed setup maximum boost (1.53 bar). In BMEP terms, the expected improvement is about 0.94 bar (from 13.05 bar to 13.99 bar). A summary of the best performance and the limitation for each configuration is included in Table 5. Compared to the experimental differences in Figure 3, differences are slightly more significant here than in the experiments, due to the iso-boundary conditions, which do not favor the open configuration, unlike in the experiments (where a cooler environment occurred).
Table 5.
Extended boost analysis for TC−1 in steady state operation.
Similar conclusions are identified for the TC−2 but with slightly different absolute results, which gives an idea of the robustness of the findings achieved for TC−1. A summary of the results for TC−2 is included in Table 6. To sum up, in the TC−2, at 1000 rpm, 0.72 bar BMEP improvement in the closed configuration is found, whereas a decline of 0.37 bar BMEP is found at 1500 RPM.
Table 6.
Extended boost analysis for TC−2 in steady state operation.
This all shows that a potential benefit of 0.94 bar can be expected, but only at low engine speeds. It would be interesting to identify the transition from closed to open configuration in the engine map since, at some point, it may represent a decline. This would be expected to happen between 1000 and 1500 RPM.
3.2. Transient Engine Performance Assessment
The following assessment regarding transient engine running condition is proposed to analyze further the potential benefits of using VGO technology. Here, the tip-in pedal position changes from 2 bar BMEP to full load in a second. The following tip-out is modeled before tip-in: AFR changes from a constant value of 16 to a pulse width modulation (PWM) value which varies from 85 to 16, as shown in Figure 11A. Likewise, the VGT rack position is changed from 85% VGT opening to 40%, as shown in Figure 11B. This transient profile is maintained for both VGO configurations and engine speeds. The objective relies on keeping the same VGT evolution to avoid any impact from the experimental VGT signal evolution since, as previously stated, the actual VGT controller was explicitly developed for the open configuration of the VGO. Also, no boundaries dispersion or initial working conditions affect the simulation.
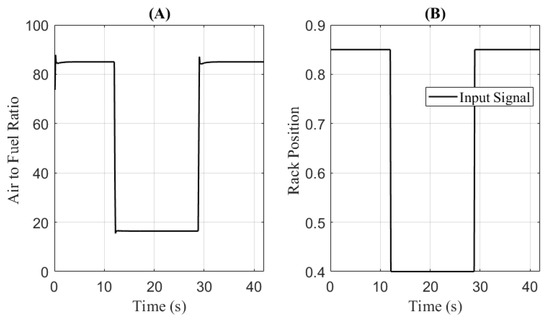
Figure 11.
Initial conditions for transient engine response: Air to Fuel Ratio (A), and Rack Position (B).
The information in Figure 12 and Figure 13 shows the results for tip-in engine running conditions at 1000 and 1500 RPM engine speeds, respectively. Red solid lines provide information on engine performance with VGO architecture in the closed position. In contrast, solid blue lines show results in VGO open condition. The area plot shows the percentage differences between VGO closed and open configurations through the running simulation time (see Equation (3)).
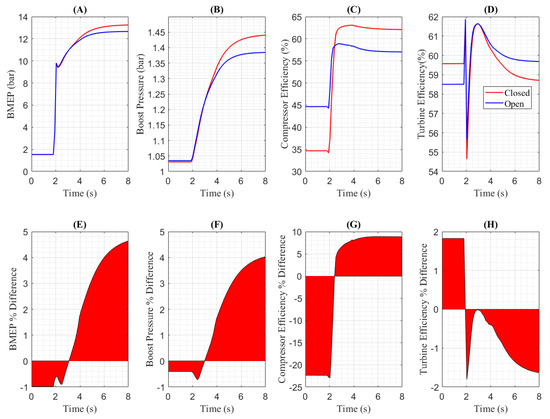
Figure 12.
Transient engine performance assessment at 1000 RPM: BMEP (A), Boost Pressure (B), Compressor Efficiency (C), Turbine Efficiency (D), Percentage difference in BMEP (E), Boost Pressure (F), Compressor Efficiency (G), and Turbine Efficiency (H).
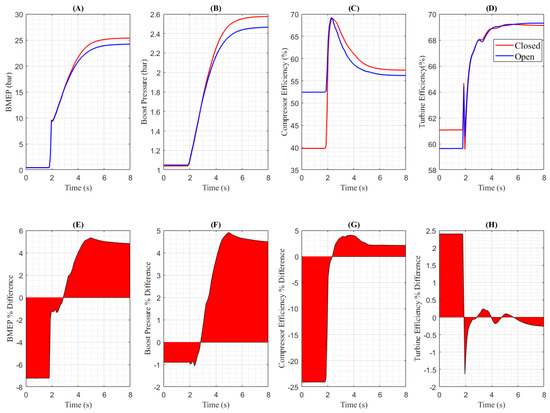
Figure 13.
Transient engine performance assessment at 1500 RPM: BMEP (A), Boost Pressure (B), Compressor Efficiency (C), Turbine Efficiency (D), Percentage difference in BMEP (E), Boost Pressure (F), Compressor Efficiency (G), and Turbine Efficiency (H).
At 1000 RPM, plotted in Figure 12, as soon as the transient starts, an improvement in BMEP becomes evident, reaching a peak value of 4.6%. BMEP differences originating in boost differences, as Figure 12B shows in absolute terms, and Figure 12F in a percentage. As the boost pressure increases, so does the intake air charge. As both simulated series are assessed under the same AFR evolution, more fuel is injected, leading to the enhanced engine BMEP performance in the VGO closed configuration. This is purely attributed to the differences in the compressor maps depending on the setup. In the closed VGO in particular, the compressor operates at a more efficient region in the map, thus leading to a compressor efficiency improvement of 8% in VGO closed configuration over VGO open architecture, as shown in Figure 12C,F. However, Figure 12H shows that the closed configuration leads to some decline in the turbine efficiency (oscillating between 0% and −1.6%). Overall, considering the compressor and turbine performance benefits and drawbacks, there is an improved global performance in engine response.
Similarly, at 1500 RPM, engine speed improvements in the transient simulation can be observed in Figure 13. Similar conclusions can be drawn: improved BMEP response, motivated by more considerable boost pressure (and more injected fuel), is supported by the compressor efficiency improvement when the VGO is closed. Enhanced compressor efficiency reaches a peak improvement of about 4%. In this case, the turbine efficiency differences are almost negligible, barely reaching a difference of 0.28%.
In summary, Table 7 shows the peak BMEP achieved, and the time taken to reach 90% of the final BMEP at VGO open configuration, which is the most restrictive. Table 7 shows, for 1500 RPM, that the open VGO takes 3.36 s to reach 90% of its steady state torque, while the closed VGO takes 3.24 s to achieve the exact value of BMEP. An improvement of 0.12 s is achieved with the closed configuration at 1500 RPM and 0.3 s at 1000 RPM.
Table 7.
Extended boost analysis for TC−1 in transient operation.
Computing the overall developed work according to Equation (2), there is an improvement of 1.19 kJ and 6.2 kJ at 1000 RPM and 1500 RPM, respectively. In relative terms, using Equation (3), 1.52 % and 3.21 % improvements in the energy produced can be obtained thanks to the impact of the VGO technology.
4. Conclusions
The main objective of this study was to assess the VGO technology to attain a better performance at low engine speeds in either steady state or transient working conditions. First, comparison of sole compressor maps is included to illustrate two VGO prototypes and how the closed vs. open configurations differ in efficiency and pressure ratio terms.
For this study, both experimental and modeling-based assessments were performed. Experiments were conducted at 1000 and 1500 RPM to develop and validate a 1D gas dynamics model in GT-Power software.
An extended boost pressure study in steady state and transient analysis was established, taking advantage of the robust model and understanding the potential benefits of using VGO architecture. These model assessments were conducted to avoid engine tests operating beyond the engine, turbocharger, or test bench’s safety limits, and to avoid any bias from changes in the scope of the experiments, such as environmental conditions.
The modeling assessment includes VGO prototypes under two main operating conditions: steady states at low-end and sudden tip-ins to analyze differences in transient response. As a result of the study, the following points were deduced:
- VGO closed configuration extended the operating characteristic map into lower mass flow rates stable operative range (retarding surge). In other words, the closed VGO improves surge margin and compressor efficiency. In the experiments, VGO closed configuration showed an improvement of approximately 0.6 bar BMEP higher at 1000 RPM. The model showed slightly improved behavior (with respect to the experiments), reaching a gain of 0.94–0.72 bar BMEP (depending on the TC unit) for the open configuration. The main difference between the experiments and the model relies on the daily dispersion of the experiments, which is avoided in the modeling stage.
- However, no benefits were identified at 1500 RPM, where T2 was the limitation for engine output. The closed VGO configuration efficiency was predicted to be lower than the open one, about 0.35%, in both theTC units analyzed. The differences in the model were about 0.43–0.37 bar less BMEP under the closed configuration, depending on the TC prototype.
- Transients at sea level showed improved breathing capabilities of the engine using VGO-closed by improving engine response at 1000 RPM and 1500 RPM. In this analysis, a VGT evolution profile was fixed (and the same) for both VGO configurations to avoid any impact on the results coming from any kind of VGT control. In conclusion, the time to achieve the same BMEP was reduced in the closed configuration, about 0.12 s and 0.3 s (at 1000 and 1500 RPM, respectively), while the engine output evolution also showed a 1.5–3.2 % improvement in produced work, which, in any case, represents the engine’s drivability under highly transient demand.
Author Contributions
Conceptualization, A.G.-V. and A.D.; methodology, A.G.-V. and A.D.; software, A.G.-V. and A.D.; validation, A.G-V. and A.D.; formal analysis, A.G.-V. and A.D.; investigation, A.G.-V. and A.D.; resources, J.R.S., H.C. and S.G.; data curation, A.G.-V. and J.R.S.; writing—original draft preparation, J.R.S., H.C., A.G-V. and A.D.; writing—review and editing, A.G.-V. and A.D.; visualization, A.G.-V. and A.D.; supervision, J.R.S., H.C. and S.G.; project administration, J.R.S., H.C. and S.G. All authors have read and agreed to the published version of the manuscript.
Funding
This research work has been supported by Grant PDC2021-120821-I00 funded by the Spanish Ministerio de Ciencia e Innovación—Agencia Estatal de Investigación (MCIN/AEI/10.13039/501100011033), and by the European Union NextGenerationEU/PRTR.
Institutional Review Board Statement
Not applicable.
Informed Consent Statement
Not applicable.
Data Availability Statement
The data that support the findings of this study are available from the corresponding author upon reasonable request.
Conflicts of Interest
The authors declare no conflict of interest.
Nomenclature
| AFR | Air-to-Fuel Ratio |
| ANN | Artificial Neural Network |
| BMEP | Brake Mean Effective Pressure |
| BSFC | Brake Specific Fuel Consumption |
| CFD | Computational Fluid Dynamics |
| DI | Direct Injection |
| HRR | Heat Release Rate |
| ICE | Internal Combustion Engine |
| LDA | Laser Droplet Anemometry |
| LES | Large Eddy Simulation |
| PIV | Particle Image Velocimetry |
| PWM | Pulse Width Modulation |
| TC−1 | Turbocharger 1 |
| TC−2 | Turbocharger 2 |
| VGC | Variable Geometry Compressor |
| VGO | Variable Geometry Orifices |
| VGT | Variable Geometry Turbine |
| VIGV | Variable Inlet Guide Vane |
| VNGV | Variable Nozzle Guide Vane |
| VSV | Variable Stator Vane |
| WCAC | Water Charged Air Cooler |
References
- Greitzer, E.M. Surge and Rotating Stall in Axial Flow Compressors—Part I: Theoretical Compression System Model. J. Eng. Power 1976, 98, 190–198. [Google Scholar] [CrossRef]
- Greitzer, E.M. Surge and Rotating Stall in Axial Flow Compressors—Part II: Experimental Results and Comparison with Theory. J. Eng. Power 1976, 98, 199–211. [Google Scholar] [CrossRef]
- Bühler, J.; Leichtfuß, S.; Schiffer, H.-P.; Lischer, T.; Raabe, S. Surge Limit Prediction for Automotive Air-Charged Systems. Int. J. Turbomach. Propuls. Power 2019, 4, 34. [Google Scholar] [CrossRef]
- Brandstetter, C.; Schiffer, H.-P. PIV measurements of the transient flow structure in the tip region of a transonic compressor near stability limit. J. Glob. Power Propuls. Soc. 2018, 2, 303–316. [Google Scholar] [CrossRef]
- Reitenbach, S.; Schnös, M.; Becker, R.-G.; Otten, T. Optimization of Compressor Variable Geometry Settings Using Multi-Fidelity Simulation. In Proceedings of the ASME Turbo Expo 2015: Turbine Technical Conference and Exposition, Montreal, QC, Canada, 15–19 June 2015. Volume 2C: Turbomachinery. [Google Scholar] [CrossRef]
- Frank, R.G.; Wacker, C.; Niehuis, R. A New Test Facility for Advanced Testing of Variable Inlet Guide Vanes. E3S Web Conf. 2022, 345, 03001. [Google Scholar] [CrossRef]
- Bringhenti, C.; Barbosa, J.R. Methodology for gas turbine performance improvement using variable-geometry compressors and turbines. Proc. Inst. Mech. Eng. Part A J. Power Energy 2004, 218, 541–549. [Google Scholar] [CrossRef]
- Canova, M.; Taburri, M.; Fiorentini, L.; Chiara, F.; Wang, Y.-Y. Modeling and Analysis of a Turbocharged Diesel Engine with Variable Geometry Compressor System. SAE Int. J. Engines 2011, 4, 2405–2417. [Google Scholar] [CrossRef]
- Herbst, F.; Stöber-Schmidt, C.-P.; Eilts, P.; Sextro, T.; Kammeyer, J.; Natkaniec, C.; Seume, J.; Porzig, D.; Schwarze, H. The Potential of Variable Compressor Geometry for Highly Boosted Gasoline Engines. In SAE Technical Paper; SAE International: Warrendale, PA, USA, 2011. [Google Scholar] [CrossRef]
- Wöhr, M.; Chebli, E.; Müller, M.; Zellbeck, H.; Leweux, J.; Gorbach, A. Development of a turbocharger compressor with variable geometry for heavy-duty engines. Int. J. Engine Res. 2015, 16, 23–30. [Google Scholar] [CrossRef]
- Stuart, C.; Spence, S.; Teichel, S.; Starke, A. Experimental and Numerical Assessment of the Impact of an Integrated Active Pre-Swirl Generator on Turbocharger Compressor Performance and Operating Range. Energies 2021, 14, 3537. [Google Scholar] [CrossRef]
- Mohtar, H.; Chesse, P.; Yammine, A.; Hetet, J.F. Variable Inlet Guide Vanes in a Turbocharger Centrifugal Compressor: Local and Global Study. In SAE Technical Paper; SAE International: Warrendale, PA, USA, 2008. [Google Scholar] [CrossRef]
- Uchida, H.; Kashimoto, A.; Iwakiri, Y. Development of Wide Flow Range Compressor with Variable Inlet Guide Vane. RD Rev. Toyota CRDL 2006, 41, 9–14. [Google Scholar]
- Xiao, J.; Gu, C.; Shu, X.; Gao, C. Performance analysis of a centrifugal compressor with variable inlet guide vanes. Front. Energy Power Eng. China 2007, 1, 473–476. [Google Scholar] [CrossRef]
- Zheng, X.; Huang, Q. Potential of the range extension of compressors with a variable inlet prewhirl for automotive turbocharged engines with an ultra-high-power density. Proc. Inst. Mech. Eng. Part D J. Automob. Eng. 2015, 229, 1959–1968. [Google Scholar] [CrossRef]
- Galindo, J.; Serrano, J.R.; Climent, H.; Tiseira, A. Experiments and modelling of surge in small centrifugal compressor for automotive engines. Exp. Therm. Fluid Sci. 2008, 32, 818–826. [Google Scholar] [CrossRef]
- Hellstrom, F.; Fuchs, L. Numerical computations of steady and unsteady flow in bended pipes. In Proceedings of the 37th AIAA Fluid Dynamics Conference and Exhibit, Miami, FL, USA, 25–28 June 2007. [Google Scholar] [CrossRef]
- Tamaki, H. Effect of piping systems on surge in centrifugal compressors. J. Mech. Sci. Technol. 2008, 22, 1857–1863. [Google Scholar] [CrossRef]
- Hellstrom, F.; Guillou, E.; Gancedo, M.; DiMicco, R.; Mohamed, A.; Gutmark, E.; Fuchs, L. Stall Development in a Ported Shroud Compressor using PIV Measurements and Large Eddy Simulation. In SAE Technical Paper; SAE International: Warrendale, PA, USA, 2010. [Google Scholar] [CrossRef]
- Sohail, M.U.; Hamdani, H.; Islam, A.; Parvez, K.; Khan, A.; Allauddin, U.; Khurram, M.; Elahi, H. Prediction of Non-Uniform Distorted Flows, Effects on Transonic Compressor Using CFD, Regression Analysis and Artificial Neural Networks. Appl. Sci. 2021, 11, 3706. [Google Scholar] [CrossRef]
- Zhao, B.; Shang, W.; Ke, H. Over-all performance analysis of a dual-entry turbocharger compressor with variable geometry orifice. Int. J. Engine Res. 2022, 14680874221075132. [Google Scholar] [CrossRef]
- Zhao, B.; Zhao, Q.; Zhao, W.; Xiang, X.; Zhou, X. Numerical and experimental investigation of turbocharger compressor low-end performance improvement using a variable geometry inlet orifice. Int. J. Engine Res. 2021, 22, 2492–2501. [Google Scholar] [CrossRef]
- Serrano, J.R.; Arnau, F.; Bares, P.; Gomez-Vilanova, A.; Garrido-Requena, J.; Luna-Blanca, M.; Contreras-Anguita, F. Analysis of a novel concept of 2-stroke rod-less opposed pistons engine (2S-ROPE): Testing, modelling, and forward potential. Appl. Energy 2021, 282, 116135. [Google Scholar] [CrossRef]
- Yuan, C.; Han, C.; Yang, M.; Zhang, Y. Numerical investigation into the fuel evaporation and mixture formation characteristics of a free-piston diesel engine. Int. J. Engine Res. 2020, 21, 1180–1192. [Google Scholar] [CrossRef]
- Serrano, J.R.; Piqueras, P.; de la Morena, J.; Gómez-Vilanova, A.; Guilain, S. Methodological analysis of variable geometry turbine technology impact on the performance of highly downsized spark-ignition engines. Energy 2021, 215, 119122. [Google Scholar] [CrossRef]
- Serrano, J.R.; Arnau, F.J.; García-Cuevas, L.M.; Dombrovsky, A.; Tartoussi, H. Development and validation of a radial turbine efficiency and mass flow model at design and off-design conditions. Energy Convers. Manag. 2016, 128, 281–293. [Google Scholar] [CrossRef]
- Serrano, J.R.; Arnau, F.J.; García-Cuevas, L.M.; Gómez-Vilanova, A.; Guilain, S.; Batard, S. A Methodology for Measuring Turbocharger Adiabatic Maps in a Gas-Stand and its Usage for Calibrating Control Oriented and 1D Models at Early ICE Design Stages. In Proceedings of the ASME 2019 Internal Combustion Engine Division Fall Technical Conference, Chicago, IL, USA, 20–23 October 2019. [Google Scholar] [CrossRef]
- Ghojel, J.I. Review of the development and applications of the Wiebe function: A tribute to the contribution of Ivan Wiebe to engine research. Int. J. Engine Res. 2010, 11, 297–312. [Google Scholar] [CrossRef]
- Serrano, J.; Climent, H.; Navarro, R.; González-Domínguez, D. Methodology to Standardize and Improve the Calibration Process of a 1D Model of a GTDI Engine. In SAE Technical Papers; SAE International: Warrendale, PA, USA, 2020. [Google Scholar] [CrossRef]
- Serrano, J.R.; Arnau, F.J.; de la Morena, J.; Gómez-Vilanova, A.; Guilain, S.; Batard, S. A Methodology to Calibrate Gas-Dynamic Models of Turbocharged Petrol Engines With Variable Geometry Turbines and With Focus on Dynamics Prediction During Tip-in Load Transient Tests. In Proceedings of the ASME Turbo Expo 2020: Turbomachinery Technical Conference and Exposition, Virtual, Online, 21–25 September 2020. Volume 8: Industrial and Cogeneration; Manufacturing Materials and Metallurgy; Marine; Microturbines, Turbochargers, and Small Turbomachines. [Google Scholar] [CrossRef]
Publisher’s Note: MDPI stays neutral with regard to jurisdictional claims in published maps and institutional affiliations. |
© 2022 by the authors. Licensee MDPI, Basel, Switzerland. This article is an open access article distributed under the terms and conditions of the Creative Commons Attribution (CC BY) license (https://creativecommons.org/licenses/by/4.0/).