1. Introduction
The increase in passenger flow has brought many difficulties to subway operation. In particular, it brings great challenges to the disaster prevention and evacuation of subway stations. The characteristics of subway stations, such as dense flow of people, numerous equipment, closed, low, narrow and long space, are not conducive to disaster prevention. Once a fire occurs, it will be difficult to fight and rescue, with great social influence and unpredictable losses. It is very important to evacuate people safely in case of a fire in a subway station. How to arrange the public area of a subway station reasonably in a certain space is particularly important to further improve the passing ability of vertical traffic in the evacuation process of subway stations.
The application of BIM technology first started in the construction industry and gradually expanded to other fields. BIM technology has high precision and credibility when building models, as it can provide simulation scenes for evacuation simulation and fire simulation and display the internal structure of buildings in three dimensions, as well as other advantages. Domestic and foreign scholars take BIM technology as the basis, combine it with numerical simulation and algorithms, and conduct detailed and in-depth research on fire safety evacuation and rescue. Uwe Rüppel et al. [
1] proposed the idea of personnel evacuation simulation on the basis of a BIM model, providing a new idea for the combination of a BIM model and an evacuation simulation. The BIM model was used to provide real scenes for personnel evacuation and fire combustion, and the process of fire combustion and evacuation can be observed intuitively. The simulation results were closer to the real situation. Srikukenthiran et al. [
2] established a relevant model for passengers’ selection of stairs and escalators during evacuation and verified the prediction accuracy of the model. Qin Yan [
3] combined BIM technology with a fire safety evacuation simulation of subway stations based on the shortcomings of traditional simulation methods in evacuation research, and verified that BIM technology was helpful to improve the accuracy of evacuation results and display the evacuation simulation process more intuitively. Zhang Ying et al. [
4] used the Revit software to build a subway model and imported it into PyroSim, and used this model to simulate the CO concentration and temperature at various locations in subway stations. Sagun A et al. [
5] and Gyu-Yeob Jeon et al. [
6] studied the differences in passenger evacuation behaviors and further determined the relevant factors affecting emergency evacuation. Zhao Gang [
7] and Yang Hui et al. [
8] studied the relationship between personnel density and walking speed, the maximum capacity of each traffic structure and the evacuation characteristics of personnel in different time periods. Tian Xin [
9] and Li Danchen et al. [
10], through studying the fire evacuation situation of subway stations, proposed to increase the width of exits, open all gates and lattice doors as well as other methods to reduce the evacuation time. Regarding the spatial optimization design method of public areas in subway stations, Liu Dan [
11], Yan Gaohui et al. [
12] and Gao Song [
13] expounded the behavior characteristics of passengers in subway stations with examples, and discussed the influence of passengers’ behavior on the setting of stairs and escalators in stations. Shi Guangyin [
14] carried out a simulation analysis in combination with three layout schemes of stairs and escalators in public areas of 12 m single-column island platform. It is determined that the form of stair and escalator + double escalators + vertical ladder + double escalators + stair and escalator is more conducive to passenger evacuation. Xue Binghan [
15] combined the built BIM model with fire simulation software and personnel safety evacuation software, analyzed the development process of fire and personnel evacuation process and proposed relevant feasible measures to further accelerate personnel safety evacuation. Sun Shaonan et al. [
16] established a Revit model combined with a subway station and imported it into the Pyrosim software for simulation, analyzed the simulation results and obtained the maximum evacuation time of each key node of the subway station. These studies have analyzed the characteristics of fire evacuation in subway stations and the spatial optimization design method of public areas in subway stations, which provide valuable data and experience for the simulation analysis of personnel evacuation in specific subway stations.
PyroSim is a fire smoke simulation and analysis software, and Pathfinder is a simulation and analysis software for evacuation capability. They are two important software in fire safety assessment. They are internationally used simulation software for fire smoke and safety evacuation, but their modeling process is relatively complex. The advantage of BIM technology in modeling can enhance the reliability of fire evacuation simulation in subway stations.
With the advantages of BIM technology, it makes up for the defects in the modeling process of the fire and evacuation simulation software. Based on the BIM model, through model format conversion, they can be directly imported into the Pathfinder and Pyrosim software, and then complete the information transmission and interaction process. Taking the actual subway station as an example, this paper combines BIM technology with the fire safety evacuation of a subway station. The evacuation facility layout of the station is optimized, and the BIM model of the subway station is established. Furthermore, the fire smoke model of the subway station is established by using the PyroSim software to analyze the fire development of different fire source locations in the optimization scheme. Additionally, the Pathfinder simulation software is used to establish the fire evacuation model of a subway station to study the problem of personnel safety evacuation in the case of fire, which can provide a reference for improving the evacuation ability of a subway station.
2. Calculation Method of Fire Evacuation in Subway Station
There is a certain pattern in the development process of a subway station fire, as shown in
Figure 1. According to the changing trend of temperature over time, the development process of the fire is mainly divided into ignition stage, golden stage and decline stage [
17]. The trend and speed of fire spread are mainly reflected in the initial development stage, and the maximum scale of fire development is mainly predicted through the development stage. Therefore, the ignition and golden stages of fire are generally focused on.
The space of subway stations is relatively closed and oxygen supply is insufficient, resulting in incomplete combustion and the release of smoke. Under high temperature conditions, some flame-retardant materials decompose to produce toxic gases such as CO, CO2, SO2, HCN and so on, and the concentration of O2 decreases. When the concentration of CO is too high, it will affect the combination of hemoglobin and oxygen, leading to the reduction in oxygen content in the blood. When it reaches 2500 ppm, it will pose a threat to human health and is one of the important causes of casualties in fire. When the smoke is not discharged in time, heat accumulates in the building, the temperature rises and high temperature smoke will burn human skin and respiratory tract, making people gradually lose their ability to exercise. When the smoke temperature reaches 65 °C, the human body begins to have adverse reactions. In addition to toxic gases such as CO and CO2, fire smoke also includes a large amount of dust and particulate matter. When dust and particulate matter float in the air, it has a strong light-blocking ability and reduces visibility to a large extent, leading to the inability of people to rapidly judge the location and evacuation conditions. In the case of insufficient visibility, if the people are not familiar with the environment of the subway station, it will be difficult to choose the appropriate evacuation path, which will make the flow of people in the station chaotic and increase the difficulty of rescue.
In order to ensure that people can safely evacuate to a safe area, this study takes the height of human eyes as a reference, and selects the temperature, CO concentration and visibility at the height of 1.65 m above the ground as the judgment basis for whether the fire has reached a dangerous state. According to relevant data, the critical values of the related indicators are shown in
Table 1:
Subway stations are enclosed and deep underground. The structure of the station is complex, and various functional areas have a certain hindering effect on personnel evacuation [
18]. In the case of sudden emergency, the safety evacuation of personnel depends on the available and required safe evacuation time. Available safe evacuation time (ASET) refers to the time from the occurrence of the accident to the threat to people’s life safety, or the time when the accident further expands and intensifies the threat to people. The required safe evacuation time (RSET) is the time taken for all people to evacuate to a safe area.
“The Subway Design Code” (GB50157-2013) stipulates that the stairs, escalators, entrances and exits of the common area of the station platform shall meet the requirements of evacuating all passengers and waiting people on the platform of an inbound train and reaching the safe area within 6 min in case of fire in the long term or in the peak hour of passenger flow control period.
The relationship between personnel safety evacuation and time is shown in
Figure 2. When the available safe evacuation time is longer than the required safe evacuation time, it means that personnel can be safely evacuated. On the contrary, accidents threaten the life safety of personnel and fail to evacuate safely [
19,
20].
This study intends to calculate and analyze the smoke development and personnel evacuation process under the condition of subway station fire through simulation. In this study, the PyroSim software [
21] was used to intuitively display the development of fire, simulate the combustion process of fire and analyze parameters such as smoke diffusion process, temperature, smoke concentration, visibility, etc. In combination with the Agent based Pathfinder evacuation software [
22,
23], in SFPE mode, the whole process of safety evacuation of people in subway stations under fire conditions was simulated and analyzed.
3. Subway Station Layout Optimization and BIM Model Construction
When the T-shaped stairs or L-shaped stairs in the vertical traffic of subway stations face the side wall, it is far away from the entrance gate. According to the passengers’ behavior habits, they usually choose the stair or escalator with the nearest and most direct distance on both sides to enter the station [
24]. When passengers enter the platform floor through the stairs and escalators on both sides, they usually wait nearby, resulting in an uneven distribution of waiting passenger flow on the platform floor. Taking a subway station as an example, by adding an ascending escalator and recombining all vertical traffic facilities as the optimization of station layout, the BIM software was used to model it.
3.1. Station Overview
The subway station selected in this study is an island station with two underground floors. The first underground floor is the public station hall floor, and the second underground floor is the platform floor. There are two track lines in different directions on both sides of the platform, which can realize transfer at the same station. The effective length of the platform layer of the station is 136 m, the width is 11.5 m, and the total area is 1654 m2. There are screen doors, evacuation signs, fire hydrants, fire extinguishers and other facilities distributed on the platform floor. The effective length of the station hall floor of the subway station is about 256 m, the effective width is about 20 m and the area of the pay area is about 1687 m2. There are ticket machines, gates, security inspection equipment, service centers and other facilities on the station hall floor.
The platform floor and the hall floor of the station are connected by barrier-free elevators, escalators and stairs. Two escalators and one staircase are arranged at both ends of the platform, and a T-shaped staircase and a barrier-free elevator are distributed in the middle. The inbound security equipment and the inbound gates are symmetrically distributed on the east and west sides of the paid area, and the outbound gates are located on the north side of the paid area. The station hall floor is connected to the ground through four entrances and exits.
3.2. Layout Optimization of Subway Station and Construction of BIM Model
With the same evacuation facilities, increasing the number of effective entrances can effectively balance the waiting passenger flow on the platform [
25]. Based on this, this study takes the layout scheme of the original subway station as the basis, by adding an ascending escalator, the evacuation facilities in the station are rearranged to optimize the layout of the station and its BIM model is constructed.
In the original layout scheme of the station payment area, three effective entrances are set and numbered as entrances ①, ② and ③. At the same time, all evacuation facilities (stairs, escalators, gates, etc.) in the station are numbered and their BIM three-dimensional model is established. The corresponding layout of the station hall floor is shown in
Figure 3a, and the specific combination form of evacuation facilities is shown in
Table 2.
In the original layout scheme, the T-shaped stairs are located in the middle of the pay area, so the evacuation path is relatively long when evacuating people in the station. In order to shorten the evacuation distance and improve the evacuation efficiency of the station, this study rearranges the vertical traffic facilities in the station by adding an escalator at the same time, and rearranges them in the form of alternate distribution, increasing the number of entrances in the pay area from three to four. The numbers correspond to ①, ②, ③ and ④ entrance. The corresponding layout of the station hall floor in the BIM model is shown in
Figure 3b. The specific combination form of evacuation facilities is shown in
Table 3.
The three-dimensional visualization model of the subway station established by BIM technology is shown in
Figure 4.
4. Fire Smoke Analysis of Subway Station
By determining the setting of fire type, heat release rate, grid division and other parameters, a subway station fire model is established using the PyroSim software to simulate the fire in the optimized subway station layout in this study. We can analyze the fire development from the smoke spread degree, smoke temperature, CO concentration and visibility, and determine the critical value of each scenario based on the hazard judgment basis.
4.1. Fire Model of Subway Station
4.1.1. Location of Fire Source
According to the location difference of fire source, subway station fires are generally divided into three types: platform fire, train fire and station hall fire. Through the analysis of the causes of the subway fire accidents, when the luggage and belongings of the passengers catch fire in the carriage, the train will not be affected to continue running, and the passengers can be evacuated at the next station. The evacuation can be completed after all the passengers leave the train, and the evacuation time is relatively short. The station hall floor has a larger area, which is closer to the ground and easier to evacuate. In terms of danger, the loss may be relatively small. However, in the fire condition of platform floor, the direction of smoke flow is consistent with the evacuation direction of passengers, and the evacuation distance is long and the flow density is high, so the risk is greater. Therefore, this study mainly considers the fire on both ends of the platform and the middle of the platform.
According to the most unfavorable principle, in this calculation, the subway station does not consider other mechanical smoke control measures, and only relies on natural ventilation.
4.1.2. Heat Release Rate of Fire
The heat release rate of fire refers to the amount and speed of heat released by the fire source. The greater the heat release rate, the higher the heat released in the combustion process and the faster the fire combustion speed, that is, the shorter the time it takes for the fire to reach the dangerous state that affects the safety evacuation of personnel [
25]. In this study, based on the consideration of the safety factor and combined with the relevant literature at home and abroad [
26], the heat release rate of a station fire is set as 5 MW, and the
t2 growth coefficient is selected as 0.04689. According to the fire growth formula given by NFPA, the effective growth time of fire is determined. The formula is given in Equation (1):
where
Qf is the heat release rate of fire source,
α is the growth coefficient of fire source and
t is the effective growth time of fire source combustion.
According to the formula, the effective growth time of fire is 327 s, and the simulation time in the fire model in this study is set as 360 s.
In addition to the heat release rate of the fire source, another important parameter in the fire source setting is the smoke generation rate of the fire. There are many combustion materials in the subway station, accompanied by a large amount of black smoke during the combustion process, which is not conducive to the safe evacuation of people. In combination with the layout of the subway platform and the thermodynamic property parameters of the materials, in reference to the SFPE Handbook of Fire Protection Engineering, the soot yield rate (yS) is set as 0.08 g/g (which is 8%) in the calculation model.
4.1.3. Grid Division
When the PyroSim software is used for fire simulation, it is necessary to mesh all objects. If the mesh is too small, the results are accurate, but the existing equipment will consume a lot of time and energy; if the mesh partition is too large, the calculation accuracy will be affected and the expected simulation effect cannot be obtained. In order to ensure the final calculation results, the appropriate accuracy must be selected. Whether the grid setting is reasonable is generally judged by the ratio of the special diameter of the fire source to the element size of the grid. The expression is as follows:
where
D* is the characteristic value of fire;
Qmax is the maximum heat release rate of fire;
is the relative density of air, under the normal temperature
= 1.2 kg/m
3;
cp is the specific heat capacity of air at constant pressure, generally 1.02 kJ/kg·K;
T0 is the environment temperature and
g is the acceleration of gravity.
From the above formula, when the heat release rate of the fire source is 5 MW, the fire source diameter is 1.82 m. Referring to the relevant literature at home and abroad, it is generally believed that the grid size is between 0.0625 D and 0.25 D, that is, the grid division is between 0.11 m and 0.45 m. In this study, considering the accuracy of the calculation results and the running ability of the computer, the multi-grid division method is adopted to divide the grid of the platform layer into 0.5 m × 0.5 m × 0.5 m, and other areas into 1 m × 1 m × 1 m. The total number of the calculation grids is 3,950,364.
4.2. Fire Simulation Analysis at the End of the Platform
4.2.1. Smoke Spread Degree
The smoke spread degree in the case of fire at the end of the platform is shown in
Figure 5. It can be seen from
Figure 5 that when t = 60 s, the smoke spreads to the group of escalators nearest to the fire source; when t = 120 s, the smoke spreads to the middle of the platform. Under the action of the smoke-retaining wall and the natural wind on the station hall floor, the two stairs and escalators on the left side of the platform can still participate in the evacuation; when t = 180 s, the smoke spreads to the effective evacuation area of the whole platform floor. At this time, the smoke on the left side of the platform sinks and the visibility decreases; when t = 240 s, the smoke sinks and the visibility at each stair and escalator entrance decreases; until t = 360 s, the smoke layer sinks to the ground, and the platform layer is full of smoke.
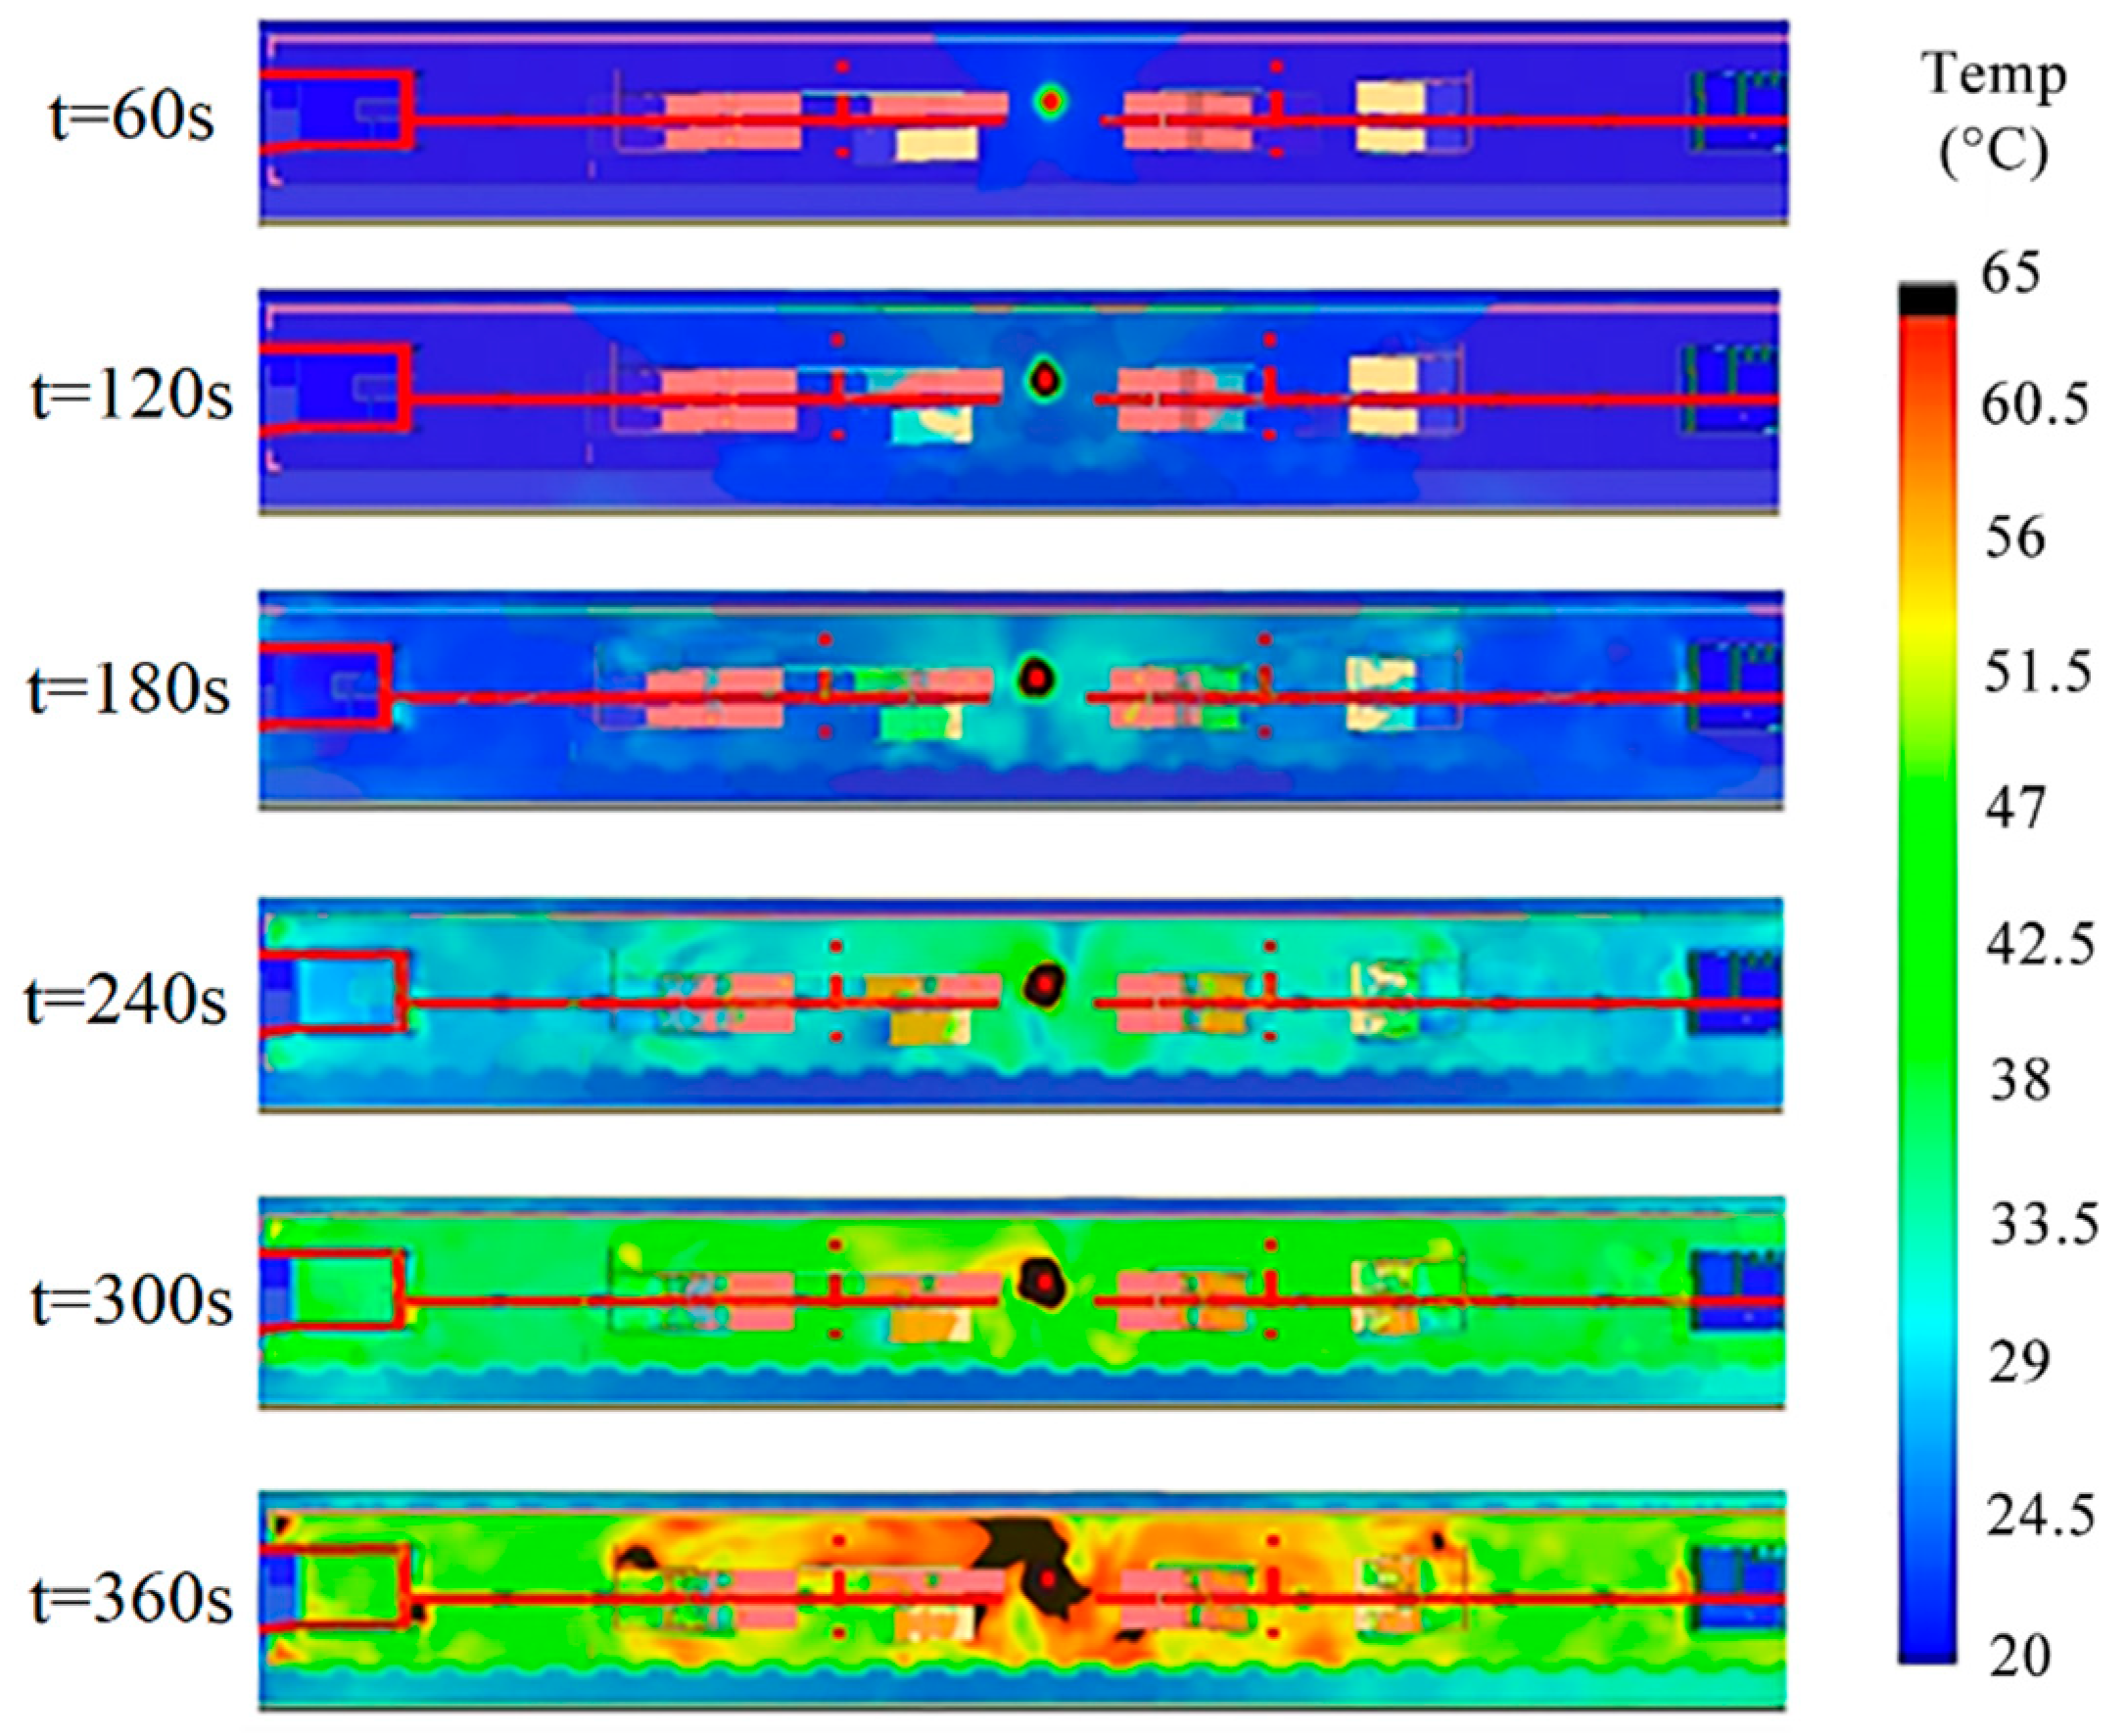
4.2.2. Smoke Temperature
The change of fire temperature at each time at the height 1.65 m from the ground of the subway platform is shown in
Figure 6. The temperature at the first group of escalators increases with time. When t = 240 s, the temperature rises to 38 °C–47 °C; when t = 300 s, the temperature at the first group of stairs and escalators rises to 65 °C, reaching the critical value of danger; when t = 360 s, the temperature from the left side of the platform to the first group of escalators reaches the critical value of danger.
Except for the first group of escalators, the temperature at the entrances of the other three groups of stairs increases with time, but is lower than 65 °C, which does not reach the critical value of danger and does not affect the safety evacuation.
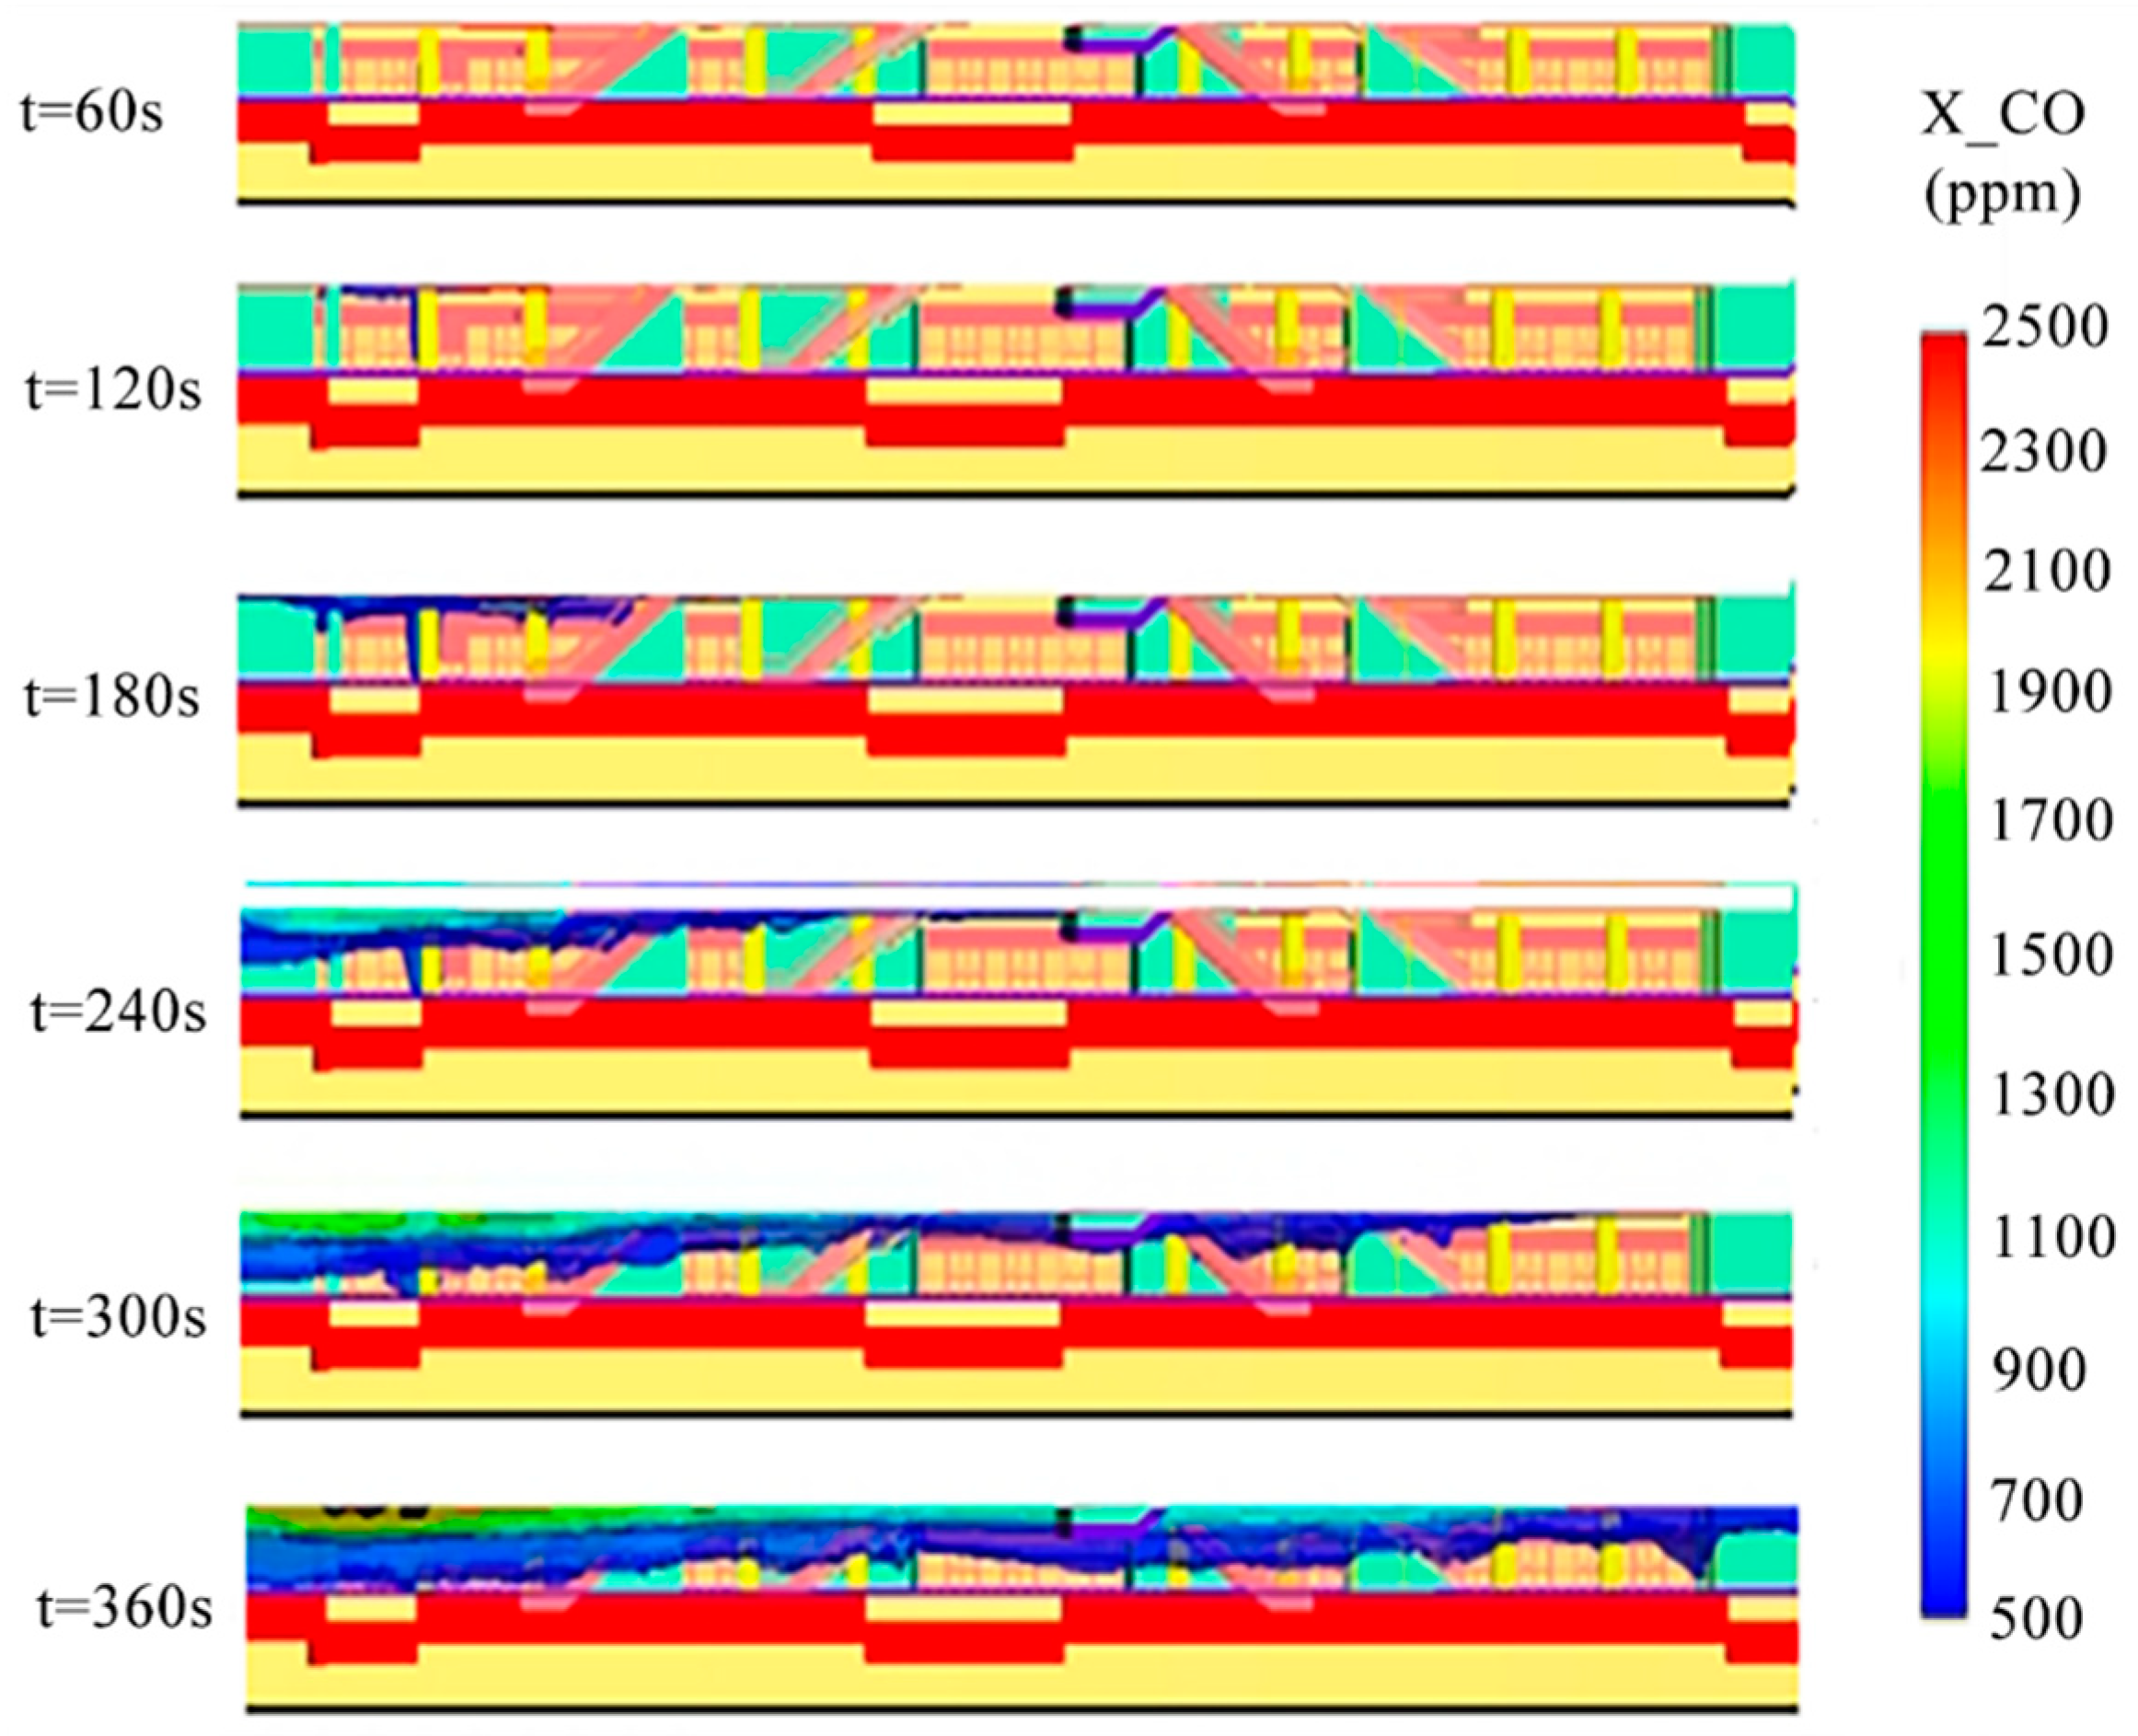
4.2.3. CO Concentration
The smoke concentrations at 60 s, 120 s, 180 s, 240 s, 300 s and 360 s after the fire at the end of the platform is shown in
Figure 7. With the continuous combustion of the ignition source, the CO concentration gradually increases. When t = 60 s, the CO concentration is low; when t = 120 s, the CO concentration at the top of the fire source at the end of the platform rises to 500 ppm; when t = 180 s, with the spread of smoke, the CO concentration at the top of the first group of escalators rises to 700 ppm; when t = 240 s, the CO concentration at the top of the fire source reaches 1100 ppm. Meanwhile, the CO concentration at the ceiling in the middle of the platform reaches 500 ppm. The CO concentration at the two groups of stairs and escalators on the right side of the platform is low; when t = 300 s, the CO concentration at the ceiling at the top of the fire source reaches 1700 ppm, and the CO concentration at the two groups of stairs and escalators on the right side of the platform reaches 500 ppm; when t = 360 s, the CO concentration at the top of the fire source reaches the dangerous critical value, and the CO concentration at other locations is lower than 1900 ppm.
Within 360 s, CO accumulates only near the fire source in the whole subway platform, leading to the critical value of CO concentration in the ceiling near the fire source. The CO concentration in other locations is low and does not reach the critical value, which does not affect the safety evacuation of the subway platform personnel.
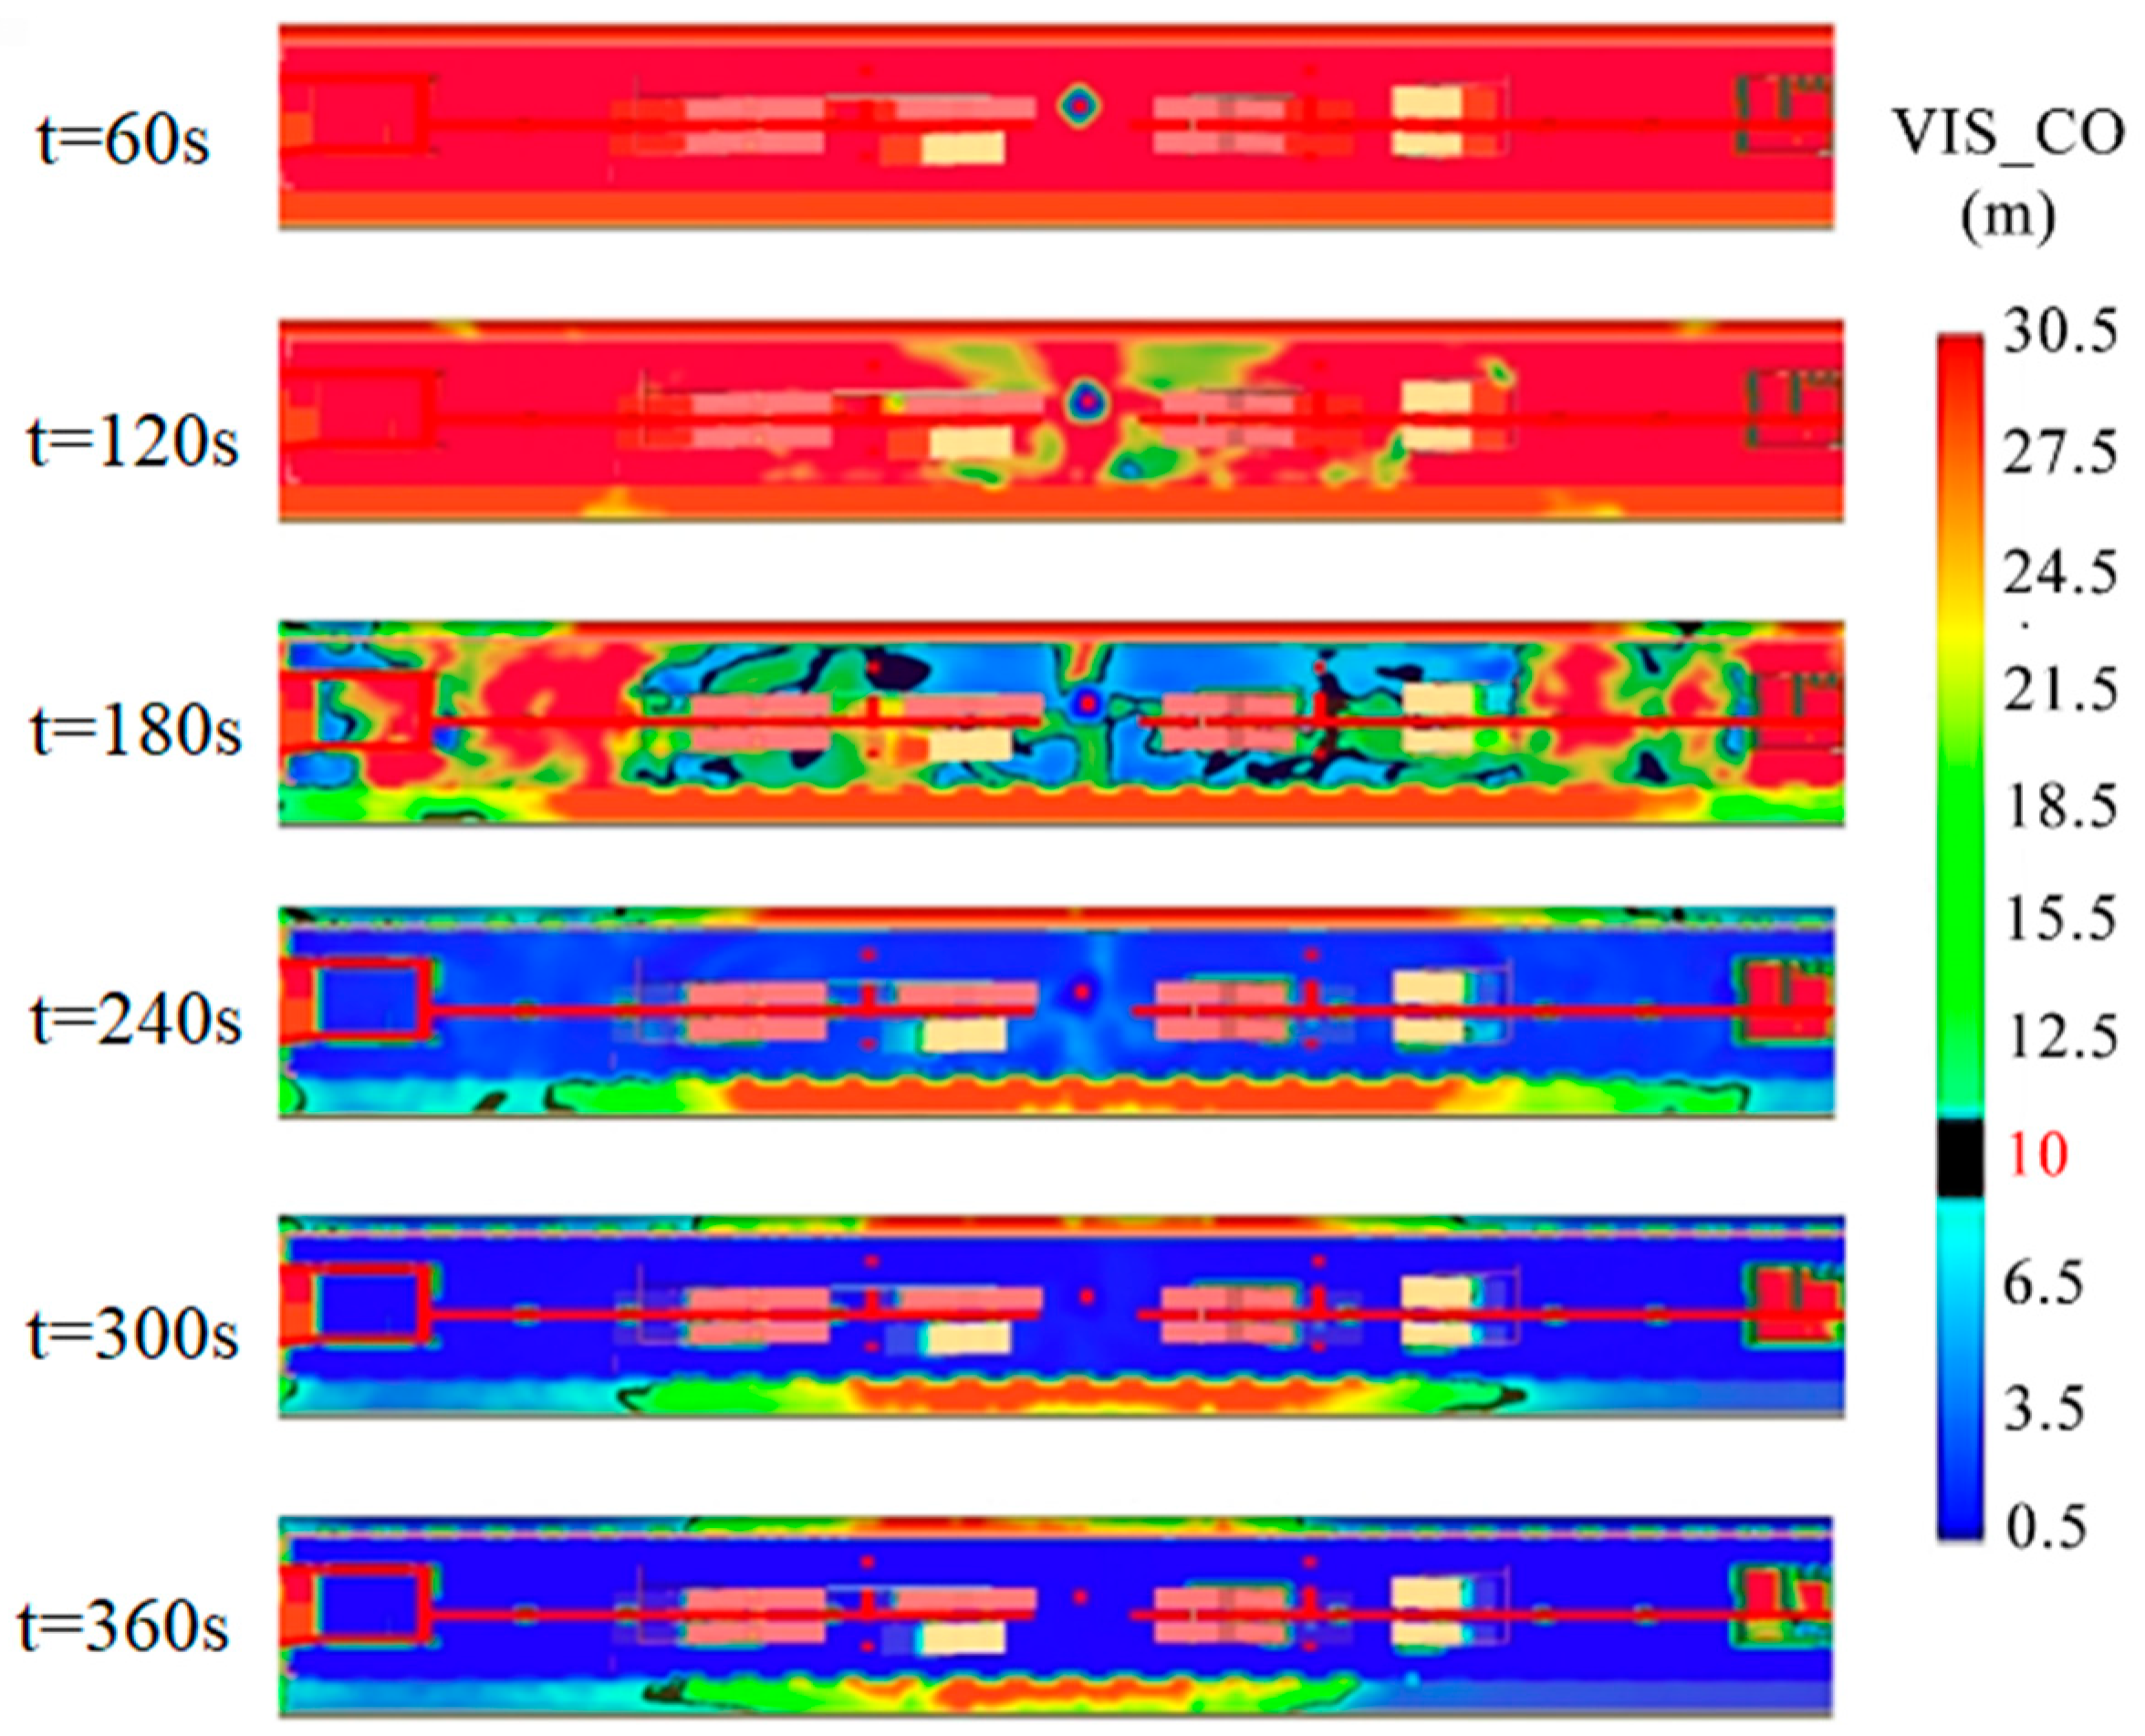
4.2.4. Visibility
The visibility at the height of 1.65 m from the platform ground in the fire at the end of the subway platform is shown in
Figure 8. With the continuous burning of the fire source, the visibility gradually decreases. When t = 60 s, only the visibility around the fire source is less than 10 m; when t = 120 s, the visibility at the left side of the fire source is less than 10 m, and the visibility at other locations does not drop to the critical value of danger; when t = 180 s, the visibility of the two groups of stairs and escalators on the left side of the platform drops to below 10 m, and the visibility of the third group of double escalators and the fourth group of stairs and escalators is still above 20 m; when t = 240 s, the visibility of four groups of stairs and escalators is affected; until t = 360 s, with the spread of smoke, the visibility of the whole platform layer is continuously reduced. That is, the visibility of the four groups of escalators in the platform floor drops to 10 m when the fire reaches 240 s, which affects the safety evacuation in the platform floor.
By sorting the data results of visibility in the fire at the end of the platform, the time when each monitoring point reached the critical value is obtained, as shown in
Figure 9. It can be seen that the visibility of the 00–07 monitoring points decreases to below 10 m at 88 s, 90 s, 131 s, 123 s, 168 s, 172 s, 181 s and 182 s, respectively (namely, the critical value is reached).
In summary, when a fire occurs at the end of the platform, the time taken for the smoke temperature, CO concentration and visibility at each group of stairs and escalators to reach the critical value of danger is shown in
Table 4. Considering the influence of various factors on the available safe evacuation time, it is determined that the available safe evacuation time of four groups of stairs and escalators is 88 s, 123 s, 168 s and 181 s in sequence.
4.3. Fire Simulation Analysis in the Middle of the Platform
4.3.1. Smoke Spread Degree
The smoke spread degree in case of fire in the middle of the platform is shown in
Figure 10. When t = 60 s, smoke accumulates at the top near the fire source in the middle of the platform, but does not affect the stairs and escalators on both ends of the fire source; when t = 120 s, smoke accumulates at the top of four groups of stairs and escalators; when t = 180 s, the smoke sinks and the visibility decreases. After 240 s, 300 s and 360 s, the smoke layer continuously sinks to the ground, and the whole platform layer is filled with smoke.
4.3.2. Smoke Temperature
The change of fire temperature at each time at the height 1.65 m from the ground of the platform is shown in
Figure 11. With the continuous combustion of the fire source, when t = 240 s, the temperature in the middle of the platform reaches 38 °C–47 °C; when t = 300 s, the temperature of other positions except the middle of the platform also reaches 38 °C–47 °C; when t = 360 s, the temperature near the fire source rises to 65 °C, reaching the critical value of danger, while the temperature at the two groups of stairs and escalators entrances in the middle of the platform is less than 65 °C, not reaching the critical value of danger.
With the continuous combustion of the fire source, the temperature of the platform floor continues to rise. The temperature of the two groups of stairs and escalators in the middle of the platform is slightly higher than on both ends, but neither of them reaches the critical value of 65 °C, which does not affect the safety evacuation of subway station personnel.
4.3.3. CO Concentration
The smoke concentration at 60 s, 120 s, 180 s, 240 s, 300 s and 360 s during the fire in the middle of the platform is shown in
Figure 12. During the whole fire burning process, the smoke in the platform gradually accumulates, and the CO concentration also increases. When the fire reaches 180 s, the CO concentration near the fire source rises to 700 ppm; when t = 240 s, the CO concentration at the ceiling reaches 1100 ppm, and the CO concentration at all stairs and escalators is low; when t = 300 s, the CO concentration at the top of the fire source reaches 1100 ppm, which is higher than that at other locations; when t = 360 s, the CO concentration at the top of the fire source reaches 1900 ppm.
Within 360 s of the fire, the maximum CO concentration in the whole platform is 1900 ppm, which does not reach the critical value of danger and does not affect the safety evacuation in the platform.
4.3.4. Visibility
The visibility at the height of 1.65 m from the platform ground in the fire in the middle of the platform is shown in
Figure 13. With the continuous burning of the fire source, the visibility gradually decreases. When t = 60 s, only the visibility around the fire source is less than 10 m; when t = 120 s, the visibility decreases, but does not drop below 10 m; when t = 180 s, the visibility of the effective evacuation area at the platform floor drops below 10 m, reaching the critical value of danger; until t = 360 s, with the spread of smoke, the visibility of the whole platform layer is continuously reduced. That is, when the fire reaches 180 s, the visibility of the four groups of stairs and escalators in the platform layer decreases to 10 m, which affects the safety evacuation of people at the platform layer.
By sorting the data results of fire visibility in the middle of the platform, the time for each monitoring point to reach the critical value of danger is obtained, as shown in
Figure 14. It can be seen that the visibility of the 00–07 monitoring points decreases to below 10 m at 181 s, 163 s, 95 s, 117 s, 95 s, 90 s, 119 s and 117 s, respectively (namely, the critical value is reached).
In summary, when a fire occurs in the middle of the platform, the time when the smoke temperature, CO concentration and visibility at each stair and escalator exit reach the critical value of danger is shown in
Table 5. Considering the influence of various factors on the available safe evacuation time, it is determined that the available safe evacuation time of the four groups is 163 s, 95 s, 90 s and 117 s, in sequence.
5. Analysis of Personnel Evacuation in Subway Station Fire
The established BIM model of a subway station is imported into the evacuation simulation software Pathfinder, and the personnel evacuation in the station is simulated and calculated to analyze the evacuation of personnel in the case of fire.
5.1. Setting of Evacuation Parameters
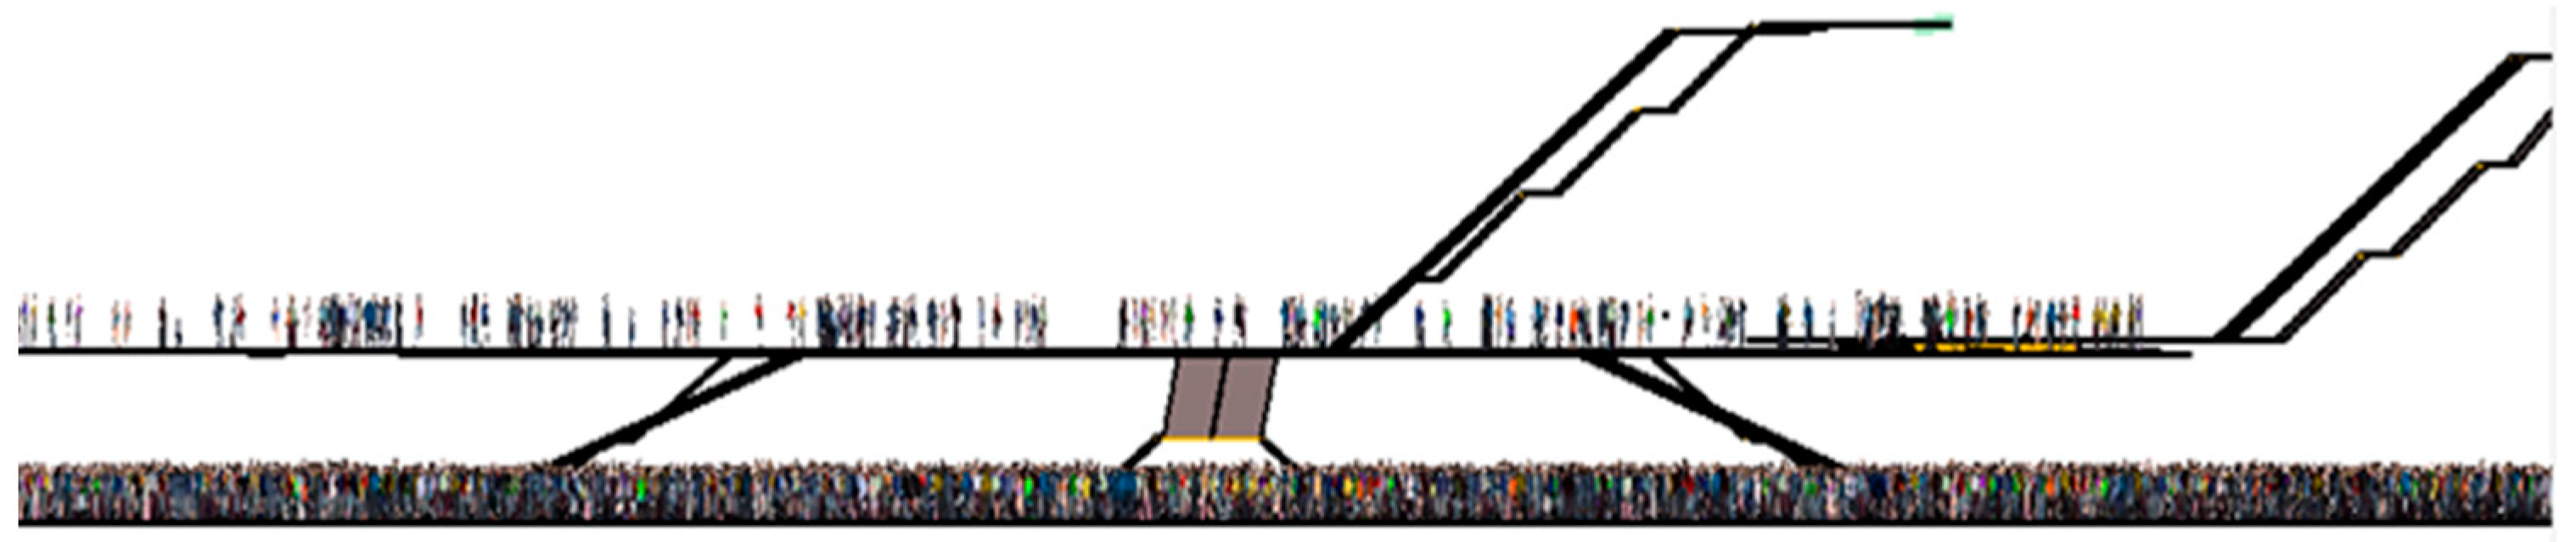
5.1.1. Evacuation Population Setting
According to the “Fire Prevention Standard for Subway Design”, the evacuation passenger flow is the number of passengers waiting at the station during the passenger flow control period plus the passengers carried by an inbound train. The station uses six marshalled A-trains, and the interval between the two trains is six minutes during the peak control period. With a designed passenger flow of 4634 per hour, the number of people waiting for each train is about 463. The set peak passenger flow, considering the evacuation situation, is the peak hour passenger flow in the passenger flow control period multiplied by the peak coefficient, and the peak coefficient of passenger flow is 1.2, that is, the set number of people waiting on the platform floor is 556. There are about 347 people on the floor of the station hall and the entrance and exit channels. In the calculation model, the initial location of personnel evacuation is set as random distribution, and the distribution of people is shown in
Figure 15.
5.1.2. Composition of the Evacuation People
Considering the influence of different ages and genders on evacuation time, this study divides the people in the subway station into seven categories: children, young women, young men, middle-aged women, middle-aged men, elderly women and elderly men [
27], and the people structure is shown in
Table 6.
5.1.3. Speed Setting of the Evacuation People
Relevant scholars at home and abroad have conducted a large number of investigations and observations on the walking speed of pedestrians. In the calculation of this study, the sample amount of pedestrian speed in the area the station belongs to is referred to in the relevant literature [
28], and the average walking speed of pedestrians under normal conditions is calculated. However, in the actual evacuation process, pedestrians usually accelerate the evacuation in the face of sudden emergency situations. It is worth considering that pedestrians, in the face of sudden emergency situations, may have stress reactions under the influence of environment, psychology and physiology, so as to promote people to accelerate movement. In this study, it is assumed that the stress factor of the walking speed of people is 1.3, that is, in emergency situations, people speed up to 1.3 times the average speed under normal conditions. The evacuation walking speed selected in this study is shown in
Table 7 below.
5.1.4. Shoulder Width for the Evacuation of People
When the evacuation people pass through doors, stairs, escalators, gates and other evacuation facilities, shoulder width is the main factor determining whether the people can pass, or the maximum number of people that can pass. According to the report of Chen Tao et al. [
29], the shoulder width of various people set in the calculation model in this study is shown in
Table 8.
5.2. Fire Evacuation Analysis at the End of the Platform
The effects of fire smoke on personnel evacuation are fully considered by combining fire smoke simulation results with a personnel evacuation simulation. According to the simulation analysis of personnel safety evacuation in the case of fire at the end of the platform, there are 556 people to be evacuated on the platform floor, and no inbound train stops at the station.
During the fire, according to the personal behavior habits and familiarity with the station, the platform floor people shall choose the appropriate stair or escalator exit for evacuation. In the case of fire at the end of the platform, the first group of stairs and escalators is too close to the fire source to participate in the evacuation. Other escalators pass normally, and people on the left side of the platform are evacuated by the second group of stairs and escalators. When a fire occurs at the end of the station platform, the number of people not evacuated from the subway station is shown in
Figure 16.
It can be seen from
Figure 16 that when t = 0 s, there are 556 people waiting for evacuation on the platform floor and 347 people waiting for evacuation in the station hall floor; when t = 65 s, there are no people waiting for evacuation in the platform floor; when t = 188 s, personnel evacuation in the platform is completed; when t = 255 s, all people in the whole subway station will be evacuated to the ground. In the process of evacuation, the queue length of the station hall floor has no impact on the evacuation efficiency of each stair and escalator, so the number of people who have not been evacuated on the platform floor continues to decline over time. When the evacuation of people on the platform floor is completed, the number of people not evacuated at the station hall floor reaches its peak.
In case of fire at the end of the platform, the critical values of each stair and escalator exit reaching the dangerous state and the time point when the evacuation of the last person at each stair and escalator exit on the platform floor is completed (the escalator at the 00 monitoring point does not participate in the evacuation; the escalators at the 01 and 05 monitoring points are downward-moving escalators and do not participate in the evacuation) are counted. The results are shown in
Table 9. By comparing the available safe evacuation time of fire smoke at the end of the platform, it can be determined that all people can safely evacuate under this fire scenario.
5.3. Fire Evacuation Analysis in the Middle of the Platform
According to the simulation analysis of personnel safety evacuation in the case of fire in the middle of the platform, the number and distribution of people to be evacuated are the same as those in the case of fire at the end of the platform, that is, there are 556 people to be evacuated on the platform floor, and no inbound train stops at the station. When there is a fire in the middle of the platform, because the second group of escalators and the ascending escalator in the third group of escalators are close to the fire source, they cannot participate in the evacuation. Other stairs and escalators pass normally, and the people on the right side of the platform are evacuated by the fourth group of double stairs. When a fire occurs in the middle of the platform, the number of people who are not evacuated in the subway station is shown in
Figure 15.
It can be seen from
Figure 17 that when t = 0 s, the number and distribution of people to be evacuated when the fire source is located at the end and middle of the platform are the same. When t = 73 s, there are no people waiting for evacuation ion the platform floor; when t = 80 s, all the people on the stairs and escalators enter the hall floor, and the number of people not evacuated from the hall floor reaches its peak; when t = 234 s, all the people in the whole subway station shall be evacuated to the ground. When there is a fire in the middle of the platform, the change trend of the number of people not evacuated is the same as that of the fire at the end of the platform. The number of people not evacuated in the platform layer decreases with time. When t = 80 s, the people on the stairs and escalators enter the hall floor, and the number of people not evacuated in the hall floor reaches its peak.
In the case of fire in the middle of the platform, the critical value of each stair and escalator exit reaching the dangerous state and the time point when the evacuation of the last person at each stair and escalator exit on the platform floor is completed (the escalators at the monitoring points 02 and 04 do not participate in the evacuation; the escalators at the monitoring points 01 and 05 are downward-moving escalators and do not participate in the evacuation) are counted. The results are shown in
Table 10. By comparing the available safe evacuation time of fire smoke in the middle of the platform, it can be determined that all people can safely evacuate under this fire scenario.
Combined with the influence of fire smoke on evacuation, the safety evacuation of personnel on the platform floor is analyzed. The required safe evacuation time is less than the available safe evacuation time under the fire smoke state, and the personnel at the platform floor can safely evacuate. That is to say, the public area in the subway station, which is arranged in the form of double escalators + stair and escalator + vertical ladder + double escalators + double stairs, can ensure the safe evacuation of personnel on the platform floor under the condition of fire smoke.
6. Conclusions
(1) Based on the example of a subway station, this paper optimized the station layout scheme by adding an ascending escalator and recombining all vertical traffic facilities, and it established a three-dimensional visual model of the station based on BIM technology;
(2) PyroSim software is used to establish a subway station fire model. The time taken for CO concentration, smoke temperature and visibility to reach the critical values of danger under different ignition points is calculated and analyzed. It is concluded that the time taken for visibility in the station to reach its critical value of danger is the shortest and that the threat to safety evacuation is the greatest. In case of fire at the end of the station platform, the available safe evacuation time of four groups of stairs and escalators is 88 s, 123 s, 168 s and 181 s, in sequence. In the case of fire in the middle of the station platform, the available safe evacuation time of the four groups of stairs and escalators is 163 s, 95 s, 90 s and 117 s;
(3) Using Pathfinder software to establish a subway station fire evacuation model, this study calculates and analyzes the safety evacuation time of people in subway station fire situations, and concludes that the safety evacuation time of people in different fire situations is less than the available safe evacuation time, that is, the optimized subway station layout can ensure the safety evacuation of people in the station. At the same time, under the condition of satisfying normal use, passengers can choose the nearest stairs or escalators for evacuation, and can re-plan the evacuation path according to congestion, which improves the service efficiency of the stairs and escalators and the emergency evacuation capacity of the subway station, which is more conducive to passenger evacuation;
(4) The combination of BIM technology and simulation software can effectively improve the efficiency and fineness of simulation modeling, facilitate comparative analysis and research and help to improve the accuracy of the evacuation results and show the evacuation simulation process more intuitively. The research results can provide a reference for the optimization of safety evacuation designs of similar subway stations;
(5) The types of people in subway stations are complex. In the process of evacuation simulation in this paper, the types of evacuation people have not been fully considered, such as whether there are people who evacuate in groups or who are not able to move. In the process of evacuation, the average speed is set according to the classification of people, but the average value cannot reflect the individual differences in the real scene. In the future, we can try to eliminate the impact of individual differences on evacuation results, and how to conduct evacuation research on individuals. In addition, because the structure of each subway station is different, it is necessary to further select different subway stations for research and analysis to draw a conclusion with a wider applicability.


