Abstract
Several methods are currently used to track the bio-component of co-processed fuels including energy/mass balance, yield methods and radiocarbon techniques. The methods used to track or estimate the bio-component of fuels produced when bio and fossil feedstocks are processed together (co-processed) in oil refineries were analysed in detail, together with their advantages and disadvantages. Some methods, such as radiocarbon methods that allow the direct measurement of the bio-content in a fuel, have been criticised due to low accuracy at low blends. However, these reservations have tended to misinterpret the options available for carbon dating and to discount recent improvements in these tests. As much higher co-pressing mixtures are anticipated if published national decarbonisation targets are to be achieved, any challenges at very low co-processing ratios affecting the accuracy of the radiocarbon methods should not be an issue. Energy/mass balance and yield methods might be supplemented with carbon-tracking to determine the real the biogenic content.
1. Introduction
The European Green Deal (COM (2019) 640 final), adopted by the European Commission in 2019, has set a vision of how to tackle climate and environmental challenges and to achieve a resource-efficient, sustainable and climate neutral economy by 2050 [1]. Transport accounts for a quarter of the European Union’s greenhouse gas emissions and these continue to grow, being the only economic sector whose GHG emissions are 32% above the 1990 levels despite the various mitigation efforts taken. The European Green Deal has set the objective to achieve a reduction of 90% of the GHG emissions from transport CO2, relative to 1990 levels.
The European Commission released on 14 July 2021 the proposal for the revision of the RED II under the “Fit for 55” package of legislative proposals in order to implement the new ambitious 2030 climate target. The new text require the increase of the target for the use of renewable energy to 40% and the increase of the level of renewable energy in transport by setting a 13% greenhouse gas intensity reduction target for 2030. This is a change in the approach for decarbonising the transport sector, focussing on a target based on greenhouse gas emissions instead of an energy-based target. The greenhouse gas emissions savings shall be calculated for biofuels and biogas, for renewable fuels of non-biological origin and recycled carbon fuels and for renewable electricity, by multiplying the amount of these fuels or renewable electricity supplied to all transport modes by their emissions savings.
In the European Union (EU), biofuels are eligible for counting towards the target set by the EU’s Renewable Energy Directive (RED), as long as they meet the required levels of GHG savings compared to the fossil fuel comparator and comply with sustainability criteria required by the RED. Therefore, an EU Member State is allowed to claim the amount of biofuels resulting from biomass feedstocks processed with fossil fuels in a common process (co-processed biofuels) used in their country towards their renewable energy targets.
Most biofuels currently used around the globe, i.e., FAME (Fatty Acid Methyl Ester) biodiesel and bioethanol, are produced in stand-alone facilities. These biofuels are typically blended into regular fossil fuels at low percentages, up to 7 vol% in European standard diesel fuel (sometimes referred to as B7), or at up to 5% or 10 vol% ethanol in regular gasoline (also known as E5 or E10 gasoline, respectively). Conversely to co-processed fuels, the blending percentage of FAME and ethanol can always be easily determined, on the basis of the differences in molecules when compared to fossil fuels.
Drop-in biofuels, defined as liquid bio-hydrocarbons that are functionally equivalent to petroleum fuels and are fully compatible with existing petroleum infrastructure [2] receive a lot of attention, as they can be used in internal combustion engines as such and with no limits on the blending levels. Drop-in biofuels can be produced through several processes that include oleochemical processes (hydroprocessing of lipid feedstock); thermochemical processes (thermal conversion of biomass through pyrolysis or gasification to intermediates followed by catalytic upgrading/hydroprocessing); biochemical processes (biological conversion of sugars or cellulosic feedstock to alcohols and hydrocarbons); and hybrid thermochemical/biochemical processes (fermentation of synthesis gas/off gas followed by catalytic reforming) [2].
Co-processing is an opportunity for the oil sector to contribute to decarbonisation objectives. Some sectors will continue to rely on liquid hydrocarbons even in the medium term, and co-processing is an economic option on short-term for some sectors that are difficult to decarbonise today, until renewable energy sources will be replacing fossil fuels. Despite co-processed fuels started to be put on the market, a tracking methodology to detect the final bio-content in the fuels produced in the oil refineries is still under definition at EU level. According to the proposal for the revision of RED II Directive (EU) 2018/2001 a methodology shall be developed and adopted by delegated acts to determine the share of biofuel, and biogas for transport, resulting from biomass feedstocks processed with fossil fuels in a common process. As the fossil and bio-products are chemically uniform, quantifying the bio-component share is challenging and cannot be determined with testing protocols used for sugar, starch or oil based biofuels. As a result, more advanced quantification methodologies are needed.
This paper will contribute to the definition of a methodology to determine the share of biofuels resulting from biomass feedstocks processed with fossil fuels in a common process. This paper will provide an overview of the options available to establish the bio-component in co-processed fuels, of the different methods by which biomass feedstocks can be co-processed in an oil refinery and of the feedstock types, i.e., biomass feedstocks which can be co-processed with fossil materials. The paper will provide a description of how co-processing takes place, either in a hydrotreatment unit or in a Fluid (fluidised) Catalytic Cracker (FCC). A number of methods exist to track the bio-component in co-processed fuels and companies engaged in co-processing tend to favour one method and can be less amenable to using other methods. This paper will discuss with an equal level of criticism the options now in use in industry, along with summarising other possible methods which are being developed.
2. Biomass Feedstocks Processing with Fossil Fuels in a Common Process
In the short term, the oil sector needs to reduce greenhouse gases emissions across the whole lifecycle of fossil fuels, as a first step toward meeting carbon neutrality in the EU by 2050. Toward this aim, co-processing of biogenic feedstocks together with crude oil in existing refineries is already an available option to produce liquid fuels with a green fraction. Many companies are implementing this strategy to green the sector without significant modifications to existing infrastructures. For this purpose, used cooking oils, waste lipids and biocrude produced from lignocellulosic material can be used as feedstock to produce advanced biofuels for the EU market.
2.1. The Role of Co-Processing in Decarbonising Transport
Most of the drop in biofuels are produced nowadays at commercial scale by hydrotreating of lipid-based material, such as vegetable oils or Crude Tall Oil (CTO) to produce is Hydrotreated Vegetable Oil (HVO) often referred to as renewable diesel. Renewable diesel is been produced in standalone plants using vegetable oil or crude tall oil such as Neste Oil and UPM [3,4].Technical issues and high initial investment costs have been challenging for reaching economic viability of thermochemical processes (such as gasification combined with Fischer-Tropsch synthesis or pyrolysis/hydrothermal liquefaction—HTL) from lignocellulosid feedstock, despite of their potential to provide drop-in biofuels. Upgrading of pyrolysis/hydrothermal liquefaction bio-oils/biocrudes/into finished fuels is challenging technically and this option has not reached yet commercial operation.
Unlike vegetable oils that have a relatively uniform nature, the composition of biomass-derived oils varies considerably and requires further upgrading by removing oxygen as well as cracking to reduce the chain length. This variation can be a result of the type of process used to convert biomass into an oil (e.g., via fast or slow pyrolysis, catalytic or hydro-pyrolysis, or via HTL) as well as the type of biomass feedstock used (for, e.g., wood, agricultural residues, sludge, etc.). The complex composition of bio-oils and their physical-chemical properties together with their instability prevent the direct blending of bio-oils with fossil fuels and pose large challenges for further upgrading into biofuels [5,6]. An alternative to standalone plants is the possibility to process bio and fossil feedstocks together in an oil refinery; this produces fuels (such as gasoline and jet fuel or diesel) which are chemically uniform with the biofuel portion indistinguishable from the fossil part. A schematic is provided to give an overview of the various co-processing pathways (see Figure 1).
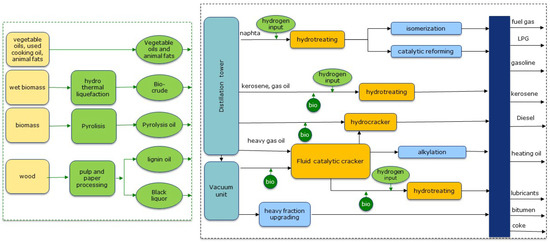
Figure 1.
Overview of possible co-processing pathways.
Oil refineries already have the infrastructure to produce fuels and base chemicals and, therefore they do not require additional major investments for processing additional alternative feedstocks. Therefore, co-processing vegetable oil, used cooking oil, or animal fat as well as other biomass-derived oils (biobased intermediates) with fossil fuels in a common processes in oil refineries has the potential to play an important role in the near future [2,7,8]. Co-processing has the advantage that small amounts of biomass-derived oils can be blended with petroleum feeds in order to mitigate the problems that come with pyrolysis oil processing [2]. Oil companies around the world are increasingly interested in blending bio or other renewable feedstocks into their refineries, as it is seen as a method of reducing the carbon intensity of the resulting fuel products. Co-processing allows biofuels to be produced without requiring the need for the construction of a dedicated facility and uses existing oil refinery assets. This brings significant economic advantages due to the avoidance of large capital investments generally associated with the production of advanced biofuels, although some modifications or equipment upgrading may still be required. Co-processing of biomass feedstocks has started and trials have been carried out in refineries [2,5], with a focus on the use of bio-oils from fast pyrolysis as well as bio-crudes from HydroThermal Liquefaction (HTL) [9,10,11,12,13].
An oil refinery produces a range of final fuels, including diesel fuel, gasoline, kerosene, Heavy Fuel Oil (HFO), and other less valuable products such as Liquefied Petroleum Gas (LPG), coke, fuel gas, etc.). Crude oil refining in refineries is highly complex that entails various processes and processing units, having multiple outputs. Depending on the market demand, process parameters are changed to enable the production of the different outputs. As a result of co-processing bio and fossil feedstocks, biogenic carbon can end up in the main products (such as diesel fuel, gasoline or kerosene) or side products (such as coke, gases) in different proportions. Accurate quantification of biogenic carbon in co-processed fuels is key for the further deployment of eligible lower carbon fuels, as they can contribute reduction of the carbon intensity of transportation fuels under the EU or US legislation [14,15]. The highly variable nature of bio-oils and bio-crudes, the complexity of the refinery designs and processes involved make it difficult to predict shares of bio-content in different fractions or outputs of the refinery.
2.2. Feedstocks for Co-Processing
The majority of biomass feedstocks currently used in co-processing are lipid feedstocks of either vegetable oils, fats and greases. Vegetable oils and fats can be sourced directly from oil crops, e.g., rapeseed, soybean oil and palm oil, or they can be waste cooking oils, i.e., vegetable oils which have been used, collected and recycled. Concerns over the sustainability of using new vegetable oils as fuel has put more focus on the use of waste or recycled materials. However, the amount of both waste cooking oil and the waste fraction of animal fats are a relatively limited, leading to searches for other options.
In the future, feedstocks used for co-processing may come from “advanced” biomass feedstocks, e.g., agriculture residues such as straw, bagasse from sugar cane production or the biomass fraction from Municipal Solid Waste (MSW). These materials are first thermally treated to produce crude biomass oils, and then co-processed to upgrade to finished fuels. For instance, crude biomass oils can be produced from lignocellulosic feedstocks using thermochemical technologies such as gasification, pyrolysis, and HydroThermal Liquefaction (HTL). Pyrolysis and gasification require relatively dry feedstock while HTL is able to process “wet biomass” or biomass feedstocks with high moisture content into bio-crude. In this paper “bio-oils” refer to those produced by pyrolysis of biomass, whilst “bio-crudes” come from HTL.
Another possibility is to use specific co-product streams from the wood or paper industry. Black Liquor from the paper pulping industry can be pre-treated to produce a suitable co-processing feedstock by deoxygenation via hydrotreating. Another proposed method is to remove the lignin from the black liquor in the paper mill, to mix it with diesel fuel, and then to co-process. It is highly likely however that only countries or areas with significant paper processing industries would be able to produce volumes of these materials to allow co-processing to take place, i.e., in Scandinavia.
In a significant review of refinery co-processing technologies, van Dyk et al. [12] indicate pyrolysis and HTL as the most promising pathways to produce crude biomass oils for co-processing. The rationale is that gasification (and thus Fischer-Tropsch technologies for biomass) is more challenging with issues such as economies of scale and gas clean up. Indeed, crude biomass oil gasification technologies have been slow to reach commercial maturity due to significant technical challenges, low reliability, high capital costs, and the generally lower oil prices [12]. Therefore, the use of such crude biomass oils remain a longer-term possibility. Table 1 shows the typical composition of various bio-based feedctocks that can be used for co-processing in refineries [16,17,18,19,20,21,22,23,24,25,26].

Table 1.
Typical composition of biobased feedctocks used for co-processing in refineries.
3. Industrial Co-Processing Options
Two main options exist for co-processing biomass feedstock in an oil refinery; inserting it into a hydrotreatment unit (hydrotreater) or in an FCC. A third option would be to insert the material into a hydrocracker [8], although this is seen as a less-likely option as hydrocracking reactors are not suitable for feedstocks containing oxygen or other impurities, unless the feeds have first been hydrotreated [12]. The choice of which to use depends on the type of bio-feedstock, the refinery configuration, and the types of fuel products desired.
3.1. Hydrotreating Vegetable Oils/Fats
Hydrotreating is primarily used in petroleum refineries to remove impurities (particularly sulphur) from petroleum product streams. Hydrotreating reactors are mostly fixed catalyst beds. Typically, the catalysts are regenerated at an off-site facility after months of operation (the cycle varies from 12 months to 36 months), as replacement of the catalyst is costly. Thus, there is a considerable financial risk involved in inserting unknown biomass feedstocks that could deactivate the catalyst prematurely.
Vegetable oils (or fats) are made up of triglycerides. A triglyceride is made up of three fatty acid chains linked to a glycerol molecule. When a fat is hydrotreated, the glycerol molecule is split from the fatty acid chains (note: waste oils and fats may contain free fatty acids which are fatty acids not connected to a glycerol). The glycerol becomes propane gas after more hydrotreating, and the fatty acid chains become liquid hydrocarbons. Both vegetable oils and fats, and animal fats are comprised principally of fatty acids with carbon chains 16 or 18 carbons long (i.e., “C16” and “C18”) (although minor amounts of other fatty acids can be present) [27]. Carbon chain lengths of the aliphatic components in petrol tend to be C5 to C10, those in diesel fuels tend to be C14 to C20 and in kerosene C10 to C16 [28]. Therefore, fatty acid chains following hydrotreating will normally end up as diesel fraction molecules, or possibly kerosene, as opposed to going into other products from the refinery. However, the hydrotreating process can also accidentally “hydro-crack” or split some of the fatty acid chains to produce shorter hydrocarbon molecules [29]. Figure 2 presents the renewable oil deoxygenation reaction pathways.
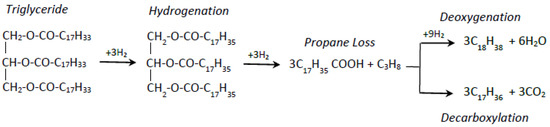
Figure 2.
Renewable oil deoxygenation reaction pathways [30].
When hydrotreating a vegetable oil, it is possible to reduce the amount of hydrogen needed by allowing some oxygen in the vegetable oil to be removed by combining it with some of the carbon within the vegetable oil itself (thus forming CO or CO2). This “wasting” of bio-carbon reduces the yield of co-processed fuels, but allows the refinery to co-process using lower amounts of hydrogen inputs (thus reducing their costs).
Production of HVO from tall oil, a by-product of the pulp and paper industry, has begun to occur mainly in Finland and Sweden. Both tall oil itself and tall oil pitch are included in Annex IX of RED II as counting double towards renewable energy targets in the transport sector.
3.2. Fluid Catalytic Cracking Vegetable Oils/Fats
Fluid Catalytic Crackers (FCC) take intermediate products that have too large molecules to be useful as final fuels, and crack them with a catalyst. This forms some light products such as gasoline, and heavier molecules that have to be upgraded in subsequent processing. Importantly, FCC catalysts are continuously regenerated on site by burning off any coke deposits. If coking of the catalyst by a vegetable oil or fat (this point is also relevant for bio-oils and bio-crudes) does occur, it can be dealt with more easily than in hydrotreaters, i.e., FCCs are more tolerant to contaminants in biomass feedstocks than hydrotreating catalysts. Coke burning produces heat, which can be used in the refinery. However, extra coke production resulting from the insertion of biobased feeds can cause overheating.
Co-processing vegetable oils or fats in an FCC produces a different product mix than a hydrotreater; Su et al. [31] described such co-processing as producing a “broad spectrum” of products, contrary to co-processing in a hydrotreater. Additionally, in an FCC there is no external input of hydrogen unlike in a hydrotreater. Any hydrogen used to remove oxygen from the bio-feedstock has to come from the fossil (i.e., hydrocarbon) feedstock itself. As a result of this “stealing” hydrogen from the fossil feedstock, more fossil olefins and aromatics are produced than if the FCC was just processing fossil feedstocks. Compared to hydrotreaters, less information is available on the reactions of vegetable oils/fats in FCCs.
3.3. Co-Processing Other “Biomass” Oils
In addition to the vegetable oil and fat, or animal fat type feedstocks, there is considerable interest in co-processing other “biomass” oils. As noted, “bio-oils” refer to biomass oils made via pyrolysis, whilst “bio-crudes” refer to biomass oils made via HTL. However, it is important to note that in general these “biomass” oils are far more challenging to produce, store, and co-process than vegetable oil/animal fat-type feedstocks. Some researchers note the relatively limited availability of fast pyrolysis oil likely makes co-processing possible only at low blend levels [32], although higher co-processing levels might be possible depending on the batch size chosen. Additionally, Van Dyk et al. [12] noted that most co-processing studies focused on fast pyrolysis bio-oil. While some general conclusions can be made, the results of these studies cannot be automatically extrapolated to all bio-oils/bio-crudes.
Unlike vegetable oils which have a relatively uniform nature, the composition and stability of biomass oils can vary considerably (although using a single-type or uniform feedstock may reduce variability). This variation can be a result of the type of process used to convert the original biomass into an oil (e.g., via fast or slow pyrolysis, catalytic or hydro-pyrolysis, or via HTL) and the type of biomass feedstock used (for, e.g., wood, bark, agricultural residues, sludge; wet or dry, large or small dimensions).
Regarding their stability, biomass oils and especially bio-oils (i.e., made by pyrolysis) are both unstable and corrosive, and easily degrade (polymerise) to form solids even when being stored. This degradation is accelerated when the oil is heated in an oil refinery. In addition, biomass oils contain water and oxygenated compounds making them immiscible with fossil feeds unless additives are used (raising another difficulty to be overcome for co-processing). Bio-crudes from HTL have an oxygen content of around 10% whereas fast pyrolysis bio-oils have an oxygen content of around 40%. Upgrading these biomass oils to fuels involves removing oxygen as well as cracking the molecules to reduce the chain length. Upgrading fast pyrolysis oils enables their co-processing at higher shares, to up to 20–30%. As a result of the variations in the properties of these biomass oils, there will be large variations in the hydrogen demand during co-processing.
In summary, the variable nature of bio-oils and bio-crudes makes it virtually impossible to predict an average yield of bio-fractions in products, unless there is a consistent and tightly specified feedstock, which is used in a process which itself is consistent. In addition, bio-crudes and bio-oils will likely be processed in an FCC, although bio-oils would probably need to be partially deoxygenated (in a dedicated hydrotreatment unit) beforehand to increase the bio-oil share being co-processed and thus the renewable content in the finished fuel [12].
4. Review of Existing Methods to Track Bio-Fraction of Co-Processed Fuels
As summarised in the introduction, there are three principle methods in use by which the biogenic fraction (bio-component) of co-processed fuels can be tracked or determined, as shown in Table 2. Methods to determine the bio-content in co-processing. Each method will be described below.
Table 2.
Methods to determine the bio-content in co-processing.
4.1. Energy (or Mass) Balance plus Equal Allocation Method
The energy balance approach records the energy content in (a) the biomass feedstocks and (b) the fossil feedstocks entering the co-processing facility. The energy content of both feedstocks is calculated using the mass of feedstock and its heating value. The energy in the biomass feedstock is then expressed as a percentage of the total energy content of all feedstocks (i.e., bio and fossil) entering the co-processing facility. This calculated “bio-percentage” is then applied to the outputs, i.e., the fuels which result from co-processing, to give an estimation of the bio-content in the final fuel products. In the case of equal allocation, this bio-fraction of the energy content in the input fuels is shared equally across the different fractions resulting from the co-processing produced, e.g., if 10% of the total energy in the feedstocks entering the co-processor is bio in origin, and if the co-process produced diesel, kerosene and propane gases, then this method estimates that the products contain 10% bio-content by energy.
In the energy balance method, the fraction of bio-component in the inputs is calculated with Equation (1) below using based on energetic weighted ratios of bio-based and fossil inputs.
where:
f—bio yield factor
—mass flow of i biomass feedstock entering co-processing unit
—low heating value of i biomass feedstock entering co-processing unit
—mass flow of j fossil feedstock entering co-processing unit
—low heating value of j fossil feedstock entering co-processing unit
The amount of renewable fuel is determined by Equation (2) below
The mass balance approach is a straight forward method, somewhat similar to the energy balance, albeit it relies on the mass flows of the biomass feedstock and fossil fuels. The mass of biomass feedstock going into co-processing is recorded, and expressed as a percentage of the total mass of feedstocks going into the co-processer. The products are then considered to have this percentage (by mass) of bio-content. Water input with the feedstock would need to be excluded.
In this method, the bio-content of the co-processed fuel is determined with the mass balance ratio given by Equation (3) below.
where:
f—bio yield factor
—mass flow of i biomass feedstock entering co-processing unit
—mass flow of j fossil feedstock entering co-processing unit
The amount of the renewable (bio) fuel output is calculated with Equation (2) below.
where:
—the amount of the renewable (bio) fuel produced
—mass flow of the fuel produced
A further modification to this is the carbon mass balance and the so-called total mass balance methods, which are described by [33,34]. In the carbon mass balance method, the mass of carbon rather than total mass is used to estimate the percentage of biomass used in co-processing. However, this method needs also to consider the losses of carbon in the process as CO and CO2 in the gaseous phase. The total mass balance method includes a consideration of H2O production. It is not thought that co-processing companies are using these latter two options in practice.
In the carbon mass balance method, the bio-content of the co-processed fuel is determined, using the mass balance ratio is given by Equation (3), but it accounts for the loss of carbon to CO and CO2 by using a correction factor accounting for the loss of carbon in co-processing given by Equation (3).
where:
—correction factor accounting for the loss of carbon to CO and CO2
The amount of the renewable (bio) fuel output is calculated in the carbon mass balance method with Equation (6) below.
4.2. Yield Methods
Yield methods refers to two distinct approaches resulting in a yield factor which can then be applied to co-processing systems. Each method will be discussed separately.
Yield Method A: In this method, the yields of the various products are observed and recorded when an oil refinery runs on pure fossil feedstock. Then, a biomass feedstock is added, and the incremental effect on the final fuels yields is observed and recorded. This extra production of final fuels is considered to be result of the bio-feedstock which entered the co-processing facility, and this extra amount of final fuels is considered of biological origin. The bio-feedstock is then attributed to each product in proportion to the increase in its production.
Ecofys [33] provides the following example to illustrate this methodology at work; beginning with “a baseline scenario where 100 kg of fossil feedstock is processed in a refinery unit, yielding 90 kg of finished fuel, e.g., Diesel, gasoline, kerosene, etc. In the co-processing scenario, 10 kg of renewable feedstock (bio-oil) is added to the process, which increases the total yield to 97 kg. The increase in yield of 7 kg can be fully labelled as “renewable”. When more bio-feedstock is added for co-processing, the yield factor of 7.2% (i.e., 7/97) can be applied to all outputs to calculate the kg renewable fuel” [33]. The Californian Air Resources Board (CARB) in their Low Carbon Fuel Standard (LCFS) program, are working on a guidance document for co-processing and had considered this method as a possible approach to tracking bio-carbon. The yield of biofuel in the finished products can be verified with 14C. Once verified, a company co-processing a vegetable oil would simply apply the yield to estimate the bio-content in their co-processed fuels. Su et al. [31] described tests using a similar “observed yield” method, and they noted when it was supplemented with 14C assessment much greater accuracy (than using the observed yield method alone) can be obtained.
In the observed yield method A, the fraction of bio-component in the outputs is calculated with Equation (7) below, using based on the ratio between the increase in yield of co-processed fuels in the co-processing scenario due to the addition of the bio-feedstock and the yield obtained in the reference scenario.
where:
is the mass of k fuel output from co-processing unit
is the is the mass flow of total fuel output from refining without co-processing (reference scenario)
The yield factor of would be then applied to all outputs to calculate the production of the renewable fuels.
Yield Method B: again it calculates a yield factor, but instead of applying a factor to the outputs, the factor is applied to the bio-inputs entering the co-processing system which establishes a known level of bio-output per unit of bio-input. It is found (via experimentation and again confirmed by 14C testing), that a set volume of biofuel is produced by a co-processing system for every tonne of (for example) vegetable oil hydrotreated. Ecofys [19] provides a similar example, where in a baseline scenario 100 kg of fossil feedstock is processed in a refinery unit, yielding 40 kg of gasoline and 50 kg of Diesel. Adding 10 kg of renewable feedstock (bio-oil) to the process increases the total gasoline yield to 42 kg and the Diesel yield to 55 kg. In this case, a yield factor of 4.8% (i.e., 2/42) would be applied to calculate the biogenic content of gasoline and a yield factor of 9.1% (i.e., 5/55) to calculate the biogenic content of Diesel. Additionally, once this yield factor is established, it can be applied to every tonne of the same type and standard quality of vegetable oil which is entering the same co-processing unit.
In the observed yield method B, the fraction of bio-component in each output is calculated for each fuel with Equation (8) below using based on the ratio between the increase in yield of co-processed fuels in the co-processing scenario and the yield obtained in the reference scenario.
where:
f—bio yield factor
—mass flow of output k fuel from co-processing unit
—mass of output k fuel from refining without co-processing
In this method, the yield factor calculated for each output would be applied to calculate the production of each co-processed output.
4.3. Radiocarbon Methods
Radiocarbon methods or “Carbon 14” methods, quantify the bio-fraction in fuel samples by measuring the amount of biological carbon present through laboratory testing. These methods (unlike the energy/mass balance or the yield methods) allow the bio-content in the finished fuels to be measured directly. Some of the carbon in the co-processed fuel comes from fossil crude oil and is hundreds of millions of years old, while some of the carbon comes from biomass (e.g., from vegetable oil) which is at most a few years old. This newer “bio-carbon” includes a 14C isotope that is slightly radioactive, and which is present in biofuels and not in fossil fuels. The key to this method’s usefulness in determining the bio-content of a fuel is that 14C is not stable, i.e., it decays over time. The radioactivity coming from the “recent” carbon in the fuel can be detected in a laboratory using 14C dating methods, thus quantifying the bio-carbon fraction in the final fuel.
The vast majority (almost 99%) of all carbon found on Earth is 12C. Approximately 1% of all carbon on Earth is 13C, while 14C is even rarer, present in only one out of every trillion carbon atoms [35,36]. The isotope 14C is slightly radioactive and is produced by radiation in the earth’s upper atmosphere. The way in which 14C becomes incorporated into fuels is via CO2; CO2 in the atmosphere contains all three of these carbon isotopes in a fixed ratio and the same ratio can be found in living plants and animals [37]. However, when an organism dies, its uptake of atmospheric carbon stops and it thus stops taking in 14C. As noted 14C is unstable and it decays gradually, halving in content every 5730 years. The 14C originally present in fossil fuels has decayed completely. Biofuels on the other hand are much younger and thus the original 14C is still present.
Three methods exist for measuring the amount of 14C in a material, two of which are applicable to fuel testing. These are: (i) Accelerator Mass Spectrometry (AMS) and (ii) Liquid Scintillation Counting (LSC) (beta ionization being the third, see also the section on EN16640). The merits and limitations of 14C testing vary depending on which of these two methods are considered; these differences are explained further in the next section, followed by an overview of two additional alternatives which are in development.
4.3.1. Accelerator Mass Spectrometry
An Accelerator Mass Spectrometer detects atoms of specific elements according to their different masses. In essence, it converts atoms in the test sample into a beam of fast-moving ions. It is this conversion into fast moving ions which gives the system the ‘accelerator” part to its name. The mass of these ions is then measured by applying magnetic and electric fields and recording their retention time.
The method is highly sensitive (or accurate), and as such AMS is successful at detecting 14C in a sample as it can ignore the other more abundant carbon isotopes (i.e., 12C and 13C) that would otherwise “swamp” or mask the 14C signal (which needs to be seen clearly in order for its measurement to occur). More details on AMS can be found in [38,39] While AMS can be used to detect the 14C and hence bio-content in a fuel, it is useful to have some perspective on this method. AMS has been used traditionally by archeologists to estimate the age of archaeological samples such as bones. It is able to test for 14C content using very small samples (and can also measure 14C in gas samples), but this is no advantage in fuel testing. In summary, its application in fuel testing is a relatively new development.
4.3.2. Liquid Scintillation Counting
In this Liquid Scintillation Counting (LSC) method (also known as LSC-direct), a fuel sample is directly injected into a small vial containing a mixture of organic liquids that give off light (or “scintillate”) when hit by radiation coming from the 14C in the fuel. The light emitted in response to this radiation is detected by the liquid scintillation counter and taken as a measure of the amount of radioactivity in the sample. The counter in the LSC simply counts the number of scintillation flashes; the number of flashes are then used to calculate the amount of 14C present. The accuracy of the counting increases with the length of time which the machine is given to count. By eliminating the steps needed for gas phase analysis, the LSC reduces the time required to analyze the samples from hours to minutes.
4.4. Isotope Ratio, Optical and Inline Techniques
Another method to determine biogenic carbon in fuel blending is based on the measurement of the ratio of 12C and 13C isotopes in the blend for pyrolysis-derived bio-oil by means of simpler equipment than AMS [8]. It has the potential to be lower cost than AMS and faster analysis time than LSC. The amount of 13C depends mainly on organic source and geographical origin. The measurement of the 13C isotope can be carried out by an Isotope Ratio Mass Spectrometer (EA-IRMS or IRMS), or Nuclear Magnetic Resonance spectroscopy (NMR) [28,29]. IRMS can be used for biofuel characterization and can provide information based on the ratio of stable isotopes of carbon (13C/12C). However, C3 and C4 plants shows differences in the ratio of stable carbon isotopes they contain. As a result, C3 plants show δ13C ranges that largely overlaps with that of petroleum fossil sources, while for C4 plants the range of values is clearly separated from fossil sources [40,41]. This makes this method difficult to apply to certain blends where the bio component originates from C3 plants.
Dell’Orco et al. [8] also discuss optical and laser techniques for the detection of carbon isotopes. They note these methods have shown some issues, especially when high precision and low limits of detection are required, although it also appears quite some degree of research is being carried out to improve accuracy. Finally, given that other refinery online analytical tools are already in place, they propose that online biogenic carbon measurement could be a practical route to analyzing the bio-carbon fraction in products from co-processing. However, they clarify that current refinery control and instrumentation systems lack the means to measure renewable carbon contents accurately, reliably, and quickly.
4.5. Radiocarbon Test Standards
4.5.1. EN16640 (CEN)
CEN (the European Committee for Standardisation) published in 2017 EN16640 entitled “Bio-based products—Bio-based carbon content—Determination of the bio-based carbon content using the radiocarbon method”. The radiocarbon content can be measured by three methods: LSC, AMS, and Beta Ionization (this final method measures radioactive decay in a similar way to Geiger counters and is considered much less suitable for fuel products compared to the first two methods). According to EN16640, the amount of biobased carbon is expressed as a fraction of the total mass or carbon of the sample. The calculation method is applicable to any product containing organic carbon, including bio-composites [42].
4.5.2. Recent CEN Work Specific to Fast Pyrolysis Bio Oil Co-Processing
CEN have begun work which originates in a mandate (M525) agreed between CEN and the European Commission (DG ENER) from 2013, which requested CEN to focus efforts on fuel standard issues related specifically to fast pyrolysis bio-oil. The work aims to investigate allocation techniques for co-processing pyrolysis oil in refineries to produce alternative fuels, and seeks to produce a draft standard by the end of the project [43]. While work is on-going, the work is focused on FPBO, so it’s applicability may be most pertinent for that particular feedstock.
4.5.3. DIN 51637
The German standard DIN 51637 itself specifies direct injection LSC as the methodology to carry out measurements. However, the precision when conducting 14C testing as per the EN standard is not very high; DIN 51637 reports that a four-hour measurement of a sample in of 7 vol% HVO typically results in an estimated error of 0.6 vol% [44]. Crucially Bronic et al. [45] have improved on the EN standard by clarifying that the method is most accurate with clear liquid fuel samples, and by further creating a method which accounts for reduced amount of scintillation which can occur when testing darker liquid samples.
4.5.4. ASTM D6866
The U.S. standard for determining the bio-content in a material is ASTM’s (the American Society for Testing and Materials) D6866-12 Standard Test Methods for Determining the Biobased Content of Solid, Liquid, and Gaseous Samples Using Radiocarbon Analysis [46]. ASTM D6866 (current version D6866-21) provides a standard for performing 14C analysis using AMS (Method B) and LSC (Method C). Using D6866, the absolute error in results from both AMS and LSC methods is up to ±3%. Although updated in 2018, 2020 and again in 2021, it does not fully consider recent improvements in the accuracy of LSC measurement for clear liquid fuels. Recent work by Haverly et al. [47] presented significant improvements to D6866 with regard to 14C testing using AMS. In their work, 15 duplicate fuel samples with varying bio-contents from 0–10 vol% were sent to 4 different labs using ASTM D6866-16 Method B (which is AMS). The labs did not know the bio-contents of the samples. In addition, each of the labs received 2 samples which had no bio-content, and these were used to obtain a lab specific blank value (i.e., any reported biocontents in these samples were taken from the biocontents found by the same lab in the other samples, to eliminate the impact of laboratory background bias).
5. Legislation for Bio-Component Tracking
5.1. European Guidelines
In EU legislation co-processing appeared in 2015 in the Council Directive (EU) 2015/652. It was in the context of a method for the calcul1ation and reporting of the life cycle greenhouse gas intensity of fuels and energy by suppliers [48]. Some EU Member States while transposing the Directive into their national law added details about co-processing relevant to their country. In general, when considering individual countries in the EU, specific Member State (MS) legislative frameworks are often derived from joint evaluation involving the local relevant authorities, along with stakeholders and oil companies. Although not legislators, in the EU there exist Voluntary Schemes which are entities which help ensure biofuels are sustainably produced by verifying that they comply with the EU sustainability criteria. In summary, it can be said that some of the Voluntary Schemes (VS) have guidance on how the bio-component from co-processed fuels should be tracked, while others have not addressed the issue. A method to determine the share of bio-component in co-processed fuels is included in national legislation several Member States: France, Germany, Italy, Poland and Spain. In Finland the tax authority provides the guidance on requirements. In other Member States, their respective national legislation on biofuels sets general requirements concerning demonstration of biofuel content in fuels, but these are not specific for co-processing. Some provisions related to co-processing are set by a legislative text on fuel quality, however the provisions are a transposition of the respective provisions of Council Directive 2015/652 on the calculation and reporting requirements pursuant to Directive 98/70/EC relating to the quality of petrol and diesel fuels and cover calculations rather than testing [48].
5.2. North America
5.2.1. California Air Resources Board
CARB’s Low Carbon Fuel Standard (LCFS) aims to reduce the carbon intensity of the transportation fuel pool in California by at least 20% by 2030. The LCFS recognizes co-processed fuels processed in either an FCC or hydrotreater, though the only pathways that have been approved co-process in a hydrotreater. CARB has had several working group meetings with industry to discuss the various accounting methodologies for determining the bio-content within the finished products. Their June 2017 draft report, proposed two methodologies for accounting that could be used: the observed yields method and the carbon mass balance method [34]. The 14C method was not included due to concerns from industry about the error cited in ASTM D6866 for this method, but research presented by Davide Rocke from the University of California, Davis at a working group on 19 October 2018, showed that the 3% absolute error contained within ASTM D6866 is likely an overestimate for biofuels. Rocke sent samples to several labs and found that the interlaboratory error was 0.13% relative. Since this study, CARB has approved two applications for co-processed fuels from British Petroleum and Kern Oil. Both applications use the 14C AMS method of bio-content accounting and require testing on each storage container of liquid fuel produced.
5.2.2. US Renewable Fuel Standard
The Renewable Fuel Standard (RFS) credits low carbon fuel production by assigning Renewable Identification Numbers (RINs) to the fuel based on the quantity of fuel produced. Co-processed fuel is qualified under the program and the quantity of fuel produced must be calculated by one of the two methods presented in 40 CFR § 80.1426 (f) (4). The allowable methods for quantifying the bio-content in the finished fuels are 14C and mass balance. If used, the 14C test must be performed on each batch of co-processed fuel (or a composite sample of all batches produced over one month) produced in accordance with ASTM D6866 Method B (LSC) or C (AMS). The mass balance method requires daily or batch measurements of the fuel streams with a converted fuel fraction determined annually.
5.2.3. Canada
British Columbia has a Low Carbon Fuel Standard similar to the one in California. Co-processed fuels are recognized under the policy, but a methodology for bio-content accounting has not yet been determined. The province is currently working with industry to determine appropriate bio-content accounting methodologies for both FCC and hydrotreater co-processing. A nationwide Clean Fuel Standard (CFS) is also under development which will also recognize co-processed fuels, however a methodology for bio-content accounting has not yet been proposed.
6. Discussion
Currently there is no universally recognised method to routinely track the biogenic content of all co-processed fuels. Some companies have developed a method for their own refinery configuration and preferred feedstock(s), but that same method is not necessarily readily applicable to all other companies and possible feedstocks.
6.1. Pros & Cons of Energy & Mass Balance Methods
The energy and mass balance method estimates the energy input using the mass and lower heating value (LHV) of the biogenic and fossil feedstocks. This method has the advantage of being relatively quick and easy to implement. Although the LHV could be a value from literature or found by conducting a direct measurement on the feedstock (using a bomb calorimeter), the method has no requirement to define the quality of the feedstock. For example, if Used Cooking Oils (UCO) are co-processed, the moisture, impurities and FFA content can vary between batches. Thus, if a literature value for the LHV of UCO is used to calculate the bio-energy of this feedstock and the actual batch of UCO contains impurities (dirt, water, etc.), the actual UCO LHV will be lower than in the literature.
This method also assumes that the share of biogenic content in all the outputs from a co-processing step in an oil refinery is equal to the share of biogenic content in the refinery’s inputs. This is termed “equal-allocation”. However, this is an over-simplification, and in practice, different shares of bio-component can be expected in different fuels. In Europe, vegetable oils are co-processed in hydrotreaters. For these types of feedstocks when hydrotreated, most of the bio-component will end up in the diesel or kerosene fraction, and a small fraction will be propane and fuel gas (which can be burned on-site in the oil refinery for energy, or used as a component in LPG gas). Thus the distribution of the bio-carbon is not equal across hydrotreater products. As an alternative, one solution is to use unequal allocation, based on the actual shares of the bio-component that ends-up in each fuel fraction (gasoline, kerosene, diesel, heavy fuel oil, etc.) produced in the process. This requires however, conducting radiocarbon measurements of all inputs and outputs to establish the bio-content in each fuel fraction produced. The resulting values are valid only for that batch and the specific combination of feedstocks type and composition and process parameters. A challenge remains the accuracy of measurements, in particular at low levels of bio-content.
However, if the vegetable oil is co-processed in an FCC, the bio-component in the products is less easy to predict, as the FCC “cracks” or splits hydrocarbon chains into smaller chains. If the vegetable oil is cracked into smaller components, these will be lighter so more bio-component could be expected in the gasoline fraction or lighter gases than the heavier diesel fraction. In an FCC, hydrodeoxygenation is the dominant reaction mechanism followed by decarboxylation and decarbonylation. The latter two reactions cause losses of bio-carbon (as bio-CO2 and bio-CO). This loss in carbon occurs in the vegetable oil only. Thus a simple energy-balance will ignore such bio-losses (and overestimate the bio-component in the final fuels).
Biomass oils tend to be relatively more complex and contain carbon chain lengths which are less defined or regular. So it is difficult to predict into which fuels the bio-component would finally end up and at what share. Additionally, in doing so, one would have to assume the biomass oil remains uniform in nature throughout a period of co-processing, which is unlikely to be the case.
6.2. Pros & Cons of Yield Methods
The main pros to using yield methods are that they are less costly than 14C testing methods and appear straightforward to use, although their setting up would take time and involves some 14C testing to define the yield factors.
The negatives to the “type A” yield method is that the outputs of a refinery may vary significantly, depending on many factors, including process parameters (catalyst age, temperature, etc.) and variations in the composition of the feedstocks. In addition, a new type of feedstock is blended into the system. Therefore, simply ascribing an increase in an output of a certain fraction entirely due to the addition of a bio-feedstock, may miss the effect variation in the aforementioned parameters could have on yields. Ecofys [33] warns that if the input feedstocks change regularly and the relationship between the mass of biogenic input and the mass of biogenic output is not linear, the yield factor may need to be recalculated regularly. This yield method can also be considered more problematic during FCC co-processing. Hydrogen transfer occurs as shown by Pinho et al. [32] where there are interactions between the fossil stream and the biogenic stream. This contradicts the assumption that the fossil yield during such co-processing is unchanged.
Regarding the “type B” yield method, this appears to be suitable for vegetable oil type feedstocks that can be supplied to the refinery within a strict specification, and to hydrotreaters. In the EU some companies are using this method and it has been specified in the MS legislation where the refinery is based. Looking at the legislation, it appears there is a single fixed yield value for vegetable oil feedstocks. However, a fixed value is only accurate for one vegetable oil type and quality standard. It does not take into account impurities or variations in the vegetable oil quality. For example, De Paz Carmona et al. [49] co-processed UCO in an oil refinery. The UCO’s specifications used were not provided. Their results showed a large variance in yields of HVO from the UCO, between 75.3–88.1 wt%. This implies that it is essential to define strict quality parameters for the vegetable oils. This is easier with virgin vegetable oils such as soybean oil, but virtually impossible with UCO or other oils which are available in relatively small batches from multiple suppliers, unless there is a very strict pre-processing facility to pass the oil through (before sending it for co-processing) which produces a uniform product. In addition, how a hydrotreater is set-up and run affects yields. It is possible to deoxygenate (i.e., turn a vegetable oil into a hydrocarbon) using hydrogen, but the hydrogen comes at a cost. Another option for hydrotreating uses less hydrogen, but some oxygen is removed from the vegetable oil by combining it with bio-carbon, thus producing CO or CO2 gas. The formation of these waste carbon gases (i.e., CO or CO2) reduces the amount of carbon which could be combined with hydrogen to make fuel; thus the yield of bio-fuel in the products is lowered.
In summary, in descriptions of yield methods there does not appear to be any requirement for either (a) strict parameters on the vegetable oil (or bio-feedstock) quality, or (b) indications whether a yield factor obtained via this method affects the aforementioned bio-carbon loss or not. Both parameters change the co-processing yield, making the use of a fixed value questionable, unless these other two parameters are defined. In addition (for yield method “A”), there is the factor of baseline variability related to petroleum quality and process fluctuations. These points highlight that this method relies on accurate measurements of all inputs and outputs and a consistent baseline, which assumes that the petroleum quality and processing parameters remain constant. The resulting values are valid however only for that batch and the specific combination of feedstocks and process parameters used. If operating conditions are changed in the refinery, when for example a higher fraction of gasoline or diesel is desired—then the distribution of bio-content is changed as compared to the reference operation. Therefore, it can be the case that there may be so much variability in the system that it could be challenging to identify the yield change from the “noise”.
6.3. Pros and Cons of Radiocarbon Methods
6.3.1. Accelerator Mass Spectrometry
Price appears to be a concern with AMS; it is relatively expensive compared to other types of laboratory tests carried on fuels, and also to the other 14C test method available for fuels (LSC, discussed in the next section). The University of Arizona quote commercial rates per single sample of $460 [50]. Their price closely matches that noted by [51] who estimate the cost one test at $500. If a company wished to purchase their own AMS machine and thus conduct the testing in-house, the price of such a machine would be several million euros [51].
Despite the issue of costs, it is a highly accurate method for detecting the bio-content in a fuel sample. Haverly et al. [47] investigated using AMS to quantify the bio-content of liquid fuels using 15 different hydrocarbon diesel test samples, with biobased carbon contents ranging from 0 to 10%, and these fuel samples were tested across 4 separate laboratories. Their results showed an accuracy of ±0.26 wt% (absolute), precision of ±0.26 wt% (absolute) the 95% confidence interval, and 0.40 wt% Limit Of Detection (LOD). Further improvements in accuracy and precision of results was deemed to be possible by averaging duplicate tests from each of the laboratories in the study. They noted their results marked a significant improvement over guidance provided in ASTM D6866-21, which cites a 3% absolute error, which has been the most common concern with this method. Bronić [52] also reported a much better detection limit from AMS than described in the ASTM method. In addition it is possible to test the bio-component of a gas with this method.
6.3.2. Liquid Scintillation Counting
An advantage of the LSC direct method is that it is much cheaper and more simple than AMS. The Institut Ruđer Bošković in Croatia have been investigating the use of the LSC method to detect bio-content in liquid fuels for several years. They have produced peer reviewed papers on the subject (for, e.g., [45], and in addition their laboratory carries out LSC testing of fuel samples commercially. They indicate the cost of LSC analysis on a liquid fuel sample is EUR 110 per sample [53]. A second option would be to install an LSC machine in the refinery and carry out testing in-house. The cost of a new LSC capable of measuring biofuel at a concentration less than 1% is ~EUR 100,000 [54].
One of the issues with LSC direct is that it works best with clear fuels, as the flashes of light during scintillation need to be detected by the LSC machine. Darker liquids (especially those coloured yellow or brown) absorb some of the flashes before they can be detected, hence causing an under-estimation of the bio-content. This effect is called “colour quenching” but there are methods to greatly reduce this problem. A further difficulty with using LSC would be how to consider the production of Bio-LPG (liquified petroleum gas, the bio-fraction is in the propane of the LPG). Gases are considered unsuitable for testing with LSC using the direct method.
Regarding precision, at 5% bio-content in a clear liquid, Bronić et al. [45] report a 95% confidence range of ±0.17%. Absolute error is approximately proportional to the square root of the bio-content, so that at 10% bio-content the 95% confidence interval after 10 h counting should be ±0.24%. However, at very low bio-contents, the uncertainty in the background counts of a 14C-free sample becomes significant, so that the 95% detection limit is ~0.46%. This means that LSC gives a large proportional error if a given amount of bio-feedstock is spread at low concentration over many batches. A graph showing the precision of the LSC method with increasing bio-content is provided in Figure 3. It shows the measured bio contents using LSC for mixtures of vegetable oils and fossil fuel and compares it to the nominal (actual) bio-contents. The diagonal line in the middle of the graph shows the test results are accurate with respect to actual values. The blue line relates to the degree of quenching (colouring) which the fuel blends caused; there was little movement in the values as the quenching due to the slight colour in both the vegetable oil and the fossil test fuels [45].
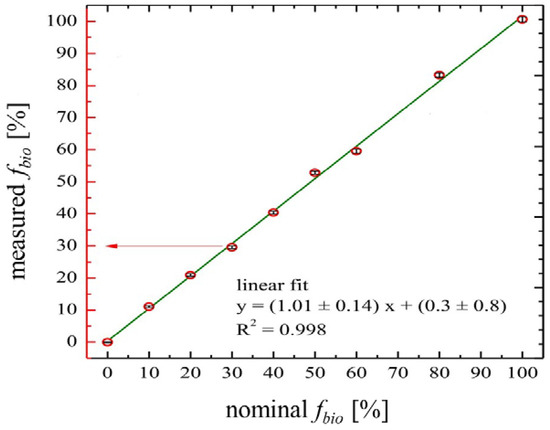
Figure 3.
Measured vs. actual vegetable oil content in fossil fuel (source: [45]).
Hurt et al. [55] also worked on LSC to determine the bio component in liquid fuels. Their method aimed to reduce the background signal and maximize the detection efficiency of 14C, through better choice of scintillation cocktail, increasing the analysis time as well as the type of LSC instrumentation used [55]. A statistical analysis of their results shows a good correlation between their LSC method and AMS, with a LSC detection limit between 0.53% and 0.72% depending on sample type. Figure 4 shows the results of AMS and LSC measurements for gasoline with repeatability error bars.
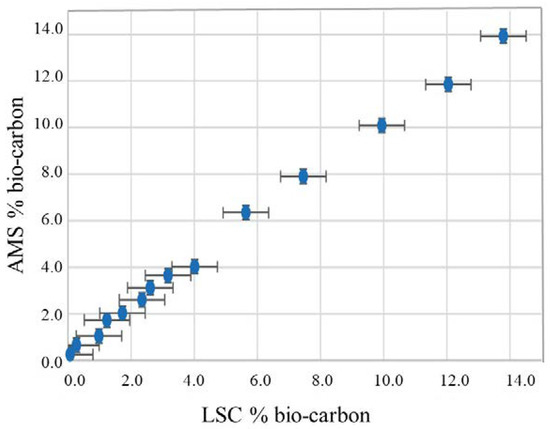
Figure 4.
Comparison between AMS and LSC measurement for gasoline with repeatability error bars (source: [55]).
In summary, both AMS and LSC allow the direct quantification of the bio-component in co-processed fuels. AMS is the more expensive and slower method of the two, but is said to be more accurate, at least at very low bio-concentrations in fuels (below 1%). Significant improvements in the costs and accuracies of both methods, and in particular for the testing of clear liquid fuels with the LSC method have occurred. These improvements do not yet appear to have been reflected in fuel testing standards and may not yet be fully understood by the co-processing industry. This is especially pertinent given that specialized laboratories (e.g., recent work by [53,55]) have improved testing accuracy and reduced costs, most notably for liquid fuel tests using the ‘direct’ LSC method.
The output of the hydrotreater or FCC is measured frequently for process control reasons, so it would not add a considerable extra burden to measure 14C with LSC, e.g., with samples averaging the day’s output. AMS would be more costly, but depending on the test schedule, it could be still cheap compared to the value of the fuel and to the cost of other tests a refinery performs on a daily basis. The output of the process units are usually blended in with other refinery streams. The challenge then is to account for how much of the total refinery diesel output comes from the hydrotreater or FCC. The refinery will know this from its own internal accounting, but it is difficult for an external verifier to check the claims.
Due to the often highly variable nature of other “biomass” oils, it is likely that many of the non 14C bio-tracking methods currently in use by co-processing entities are unsuitable for bio-crudes and bio-oils. However, it should also be reiterated that the co-processing of these oils is much more technically challenging than for vegetable oils, therefore while interest in this area remains high, it is an area where little or no production exists currently. It is likely better to measure the 14C content of the fuel products from these bio-crudes and bio-oils directly—although concerns exist regarding very low blend percentages.
6.3.3. C and Detection Limits
Biofuels put on the market in the EU (domestically produced or imported) must comply with certain sustainability criteria, including GHG emission savings. Various certification schemes have been developed to ensure that biofuels are produced in a sustainable way by verifying that they comply with the EU sustainability criteria. From the legislative point of view, the bio-content of each consignment of final fuel needs to be certified. The most direct way of doing that is by measuring the 14C of each consignment. However, the bio-content may be very diluted at this stage, which could raise problems of detection limits if LSC is used for less than ~1 vol% bio-content.
The problem with detection limits could be dealt with by restricting certification to consignments of co-processed fuel with a bio-content above 1% for LSC testing and 0.4% for AMS. A related point is about precision. There is a 95% chance that the bio-carbon fraction of a particular batch falls within the error-ranges quoted for LSC and AMS. If a company produces a thousand batches per year, the average error in the total annual co-processed biofuel production would be 30 times less. One can argue that from the point of view of the annual total of bio-certificates issued to the company, this level of accuracy is excessive.
Although not discussed in this work, it is worth noting that in the event Fatty Acid Methyl Ester (FAME) biodiesel has been added or blended into a co-processed fuel, this would add additional 14C to the fuel blend, and must be taken into account. Therefore, before 14C measurement on such a fuel blend (i.e., a FAME + fossil + co-processed bio-fuel), the biocarbon content due to the FAME has to be quantified and its contribution to the bio-carbon in the fuel be subtracted from the total 14C measured in the fuel blend. In Germany there is a method described in a fuel testing laboratory standard for 14C measurement in fuels, and in particular it includes an instruction on how to quantify the FAME biodiesel content in the fuel, and thus take into account the presence of bio-carbon from the FAME, i.e., its bio-carbon in the fuel which did not come from co-processing [44].
6.3.4. Possible Interaction with Mass Balance Systems
Testing for 14C in fuels could be carried out at production sites, or throughout the chain of custody, as well as by public authorities at the excise duty point. It is possible these measurements could determine the renewable content of the fuel for the purposes of fulfilling legal obligations placed on the fuels suppliers. However, the bio-content in transportation fuels cannot be segregated from pure fossil fuels. In the EU, following the principle of the mass balance system, claims about the bio-content remain assigned to the fuel no matter the physical bio-content. Thus, following fuel production, claims on the bio-content are virtual and cannot be confirmed with the 14C method alone. Verification of the physical properties can only be done at the refinery and should then be done by a party that is truly independent. A book-keeping approach may be less accurate than 14C testing fuel samples, but it is likely easier to retrospectively verify claims as it would rely on data of amounts of bio-feedstock which was sourced by the fuel plant. If having carried out 14C testing on a fuel consignment a different renewable content to that declared by mass balancing is found, this discrepancy would need to be resolved. A combination of (book-keeping; i.e., energy or mass balance) and a reasonable 14C testing regime approach could make most sense overall. Table 3 provides an overview of the pros and cons for the different methods used to track the biogenic component of co-processing with fossil fuels.
Table 3.
Pros and cons for the methods to track the biogenic component of co-processing with fossil fuels.
7. Conclusions
Several methods have been assessed for their ability to track the biogenic component of co-processing with fossil fuels. The energy/mass balance method accounts for the biogenic component of the co-processed fuel by estimating the energy input by using the mass and lower heating value (LHV) of the bio-and-fossil-based feedstocks. This method has the advantage of being relatively quick and easy to implement. However, since the energy content of the biomass feedstock (LHV, moisture) will likely be highly variable, the “real” amount of the biogenic-component in the co-processed fuel mix will need to be established for each batch. Similarly, depending on the insertion point within the refinery, the distribution of the “green molecules” would require the determination of the bio-component that ends-up in each fuel fraction (gasoline, kerosene, diesel, heavy fuel oil, etc.). Many refineries are better “equipped” to do these types of assessment routine, although the accuracy of measurement, particularly at low co-processing ratios, will likely be challenging.
The yield methods are, in theory, relatively easy to implement. However, it relies on accurate measurements of all inputs and outputs and a consistent baseline. Type A assumes that the petroleum quality and processing parameters remain constant. The resulting values are valid only for a particular batch and the specific combination of feedstocks and process parameters. If the operational conditions are changed, which happens routinely within refineries, (for example, a higher fraction of gasoline or diesel is desired), the distribution of the “green molecules” will change as compared to the reference operation. Type B requires a precisely defined bio-feedstock, so would not work for highly variable feedstocks. Additionally, the yield factor would have to be described with a certain processing parameter, to avoid companies claiming a high bio-yield when in fact some of the bio-carbon could be lost by decarboxylation for example.
Although the radiocarbon method (either LSC or AMS) is able to quantify directly the biogenic content of a fuel, unlike the other methods (i.e., energy/mass balancing and yield methods), its accuracy might be an issue when applied to low percentages (e.g., lower than 2%). It is possible that higher co-processing ratios will predominate in the near future (for example Preem in Sweden are currently pursuing an inclusion level as high as 30%). These techniques allow a reduction of uncertainties embedded in other methods.
A determination of the real ratio of biogenic feedstock will result in a more transparent market, which is in the interests of the operators. Considering the current status of the presented techniques, it is probable that the energy/mass balance and yield methods would be supplemented with carbon-tracking to ensure the biogenic content to determine the real the biogenic content of co-processed fuels.
Author Contributions
Conceptualization, A.O., J.S. (Jianping Su) and N.S.; methodology, A.O., J.S. (Jianping Su), M.P. and N.S.; validation, J.S. (Jack Saddler) and N.S.; formal analysis, A.O., J.S. (Jianping Su) and M.P.; investigation, A.O., J.S. (Jianping Su), A.R. and M.P.; writing—original draft preparation, A.O., A.R., J.S. (Jianping Su) and M.P.; writing—review and editing, J.S. (Jianping Su), J.S. (Jack Saddler), M.P. and N.S.; supervision, J.S. (Jack Saddler) and N.S. All authors have read and agreed to the published version of the manuscript.
Funding
This research received no external funding.
Conflicts of Interest
The authors declare no conflict of interest.
Disclaimer
The views expressed here are purely those of the authors and may not, under any circumstances, be regarded as an official position of the European Commission.
References
- COM(2019) 640 Final. Communication from the Commission to the European Parliament, the European Council, the Council, the European Economic and Social Committee and the Committee of the Regions—The European Green Deal. 2019. Available online: https://eur-lex.europa.eu/legal-content/EN/TXT/?uri=COM%3A2019%3A640%3AFIN (accessed on 20 June 2022).
- Karatzos, S.; Mcmillan, J.; Saddler, J. The Potential and Challenges of “Drop in” Biofuels; IEA Bioenergy Task 39; IEA Bioenergy: Paris, France, 2014; ISBN 978-1-910154-07-6. [Google Scholar]
- Neste Corporation. Neste Renewable Diesel Handbook; Neste: Espoo, Finland, 2020; pp. 1–33. [Google Scholar]
- UPM. UPM BioVerno Fuel for All Diesel Engines. Available online: https://www.upmbiofuels.com/traffic-fuels/upm-bioverno-diesel-for-fuels/ (accessed on 20 June 2022).
- Bezergianni, S.; Dimitriadis, A.; Kikhtyanin, O.; Kubička, D. Refinery co-processing of renewable feeds. Prog. Energy Combust. Sci. 2018, 68, 29–64. [Google Scholar] [CrossRef]
- Venderbosch, R.; Prins, W. Fast Pyrolysis. In Thermochemical Processing of Biomass: Conversion into Fuels, Chemicals and Power; Wiley-VCH: Hoboken, NJ, USA, 2011; pp. 144–176. [Google Scholar]
- Van Dyk, S.; Su, J.; McMillan, J.D.; Saddler, J.N. Drop in Biofuels: The Key Role That Co-Processing Will Play in Its Production; IEA Bioenergy Task 39; IEA Bioenergy: Paris, France, 2019; ISBN 978-1-910154-61-8. [Google Scholar]
- Dell’Orco, S.; Christensen, E.D.; Iisa, K.; Starace, A.K.; Dutta, A.; Talmadge, M.S.; Magrini, K.A.; Mukarakate, C. Online biogenic carbon analysis enables refineries to reduce carbon footprint during coprocessing biomass- and petroleum- derived liquids. Anal. Chem. 2021, 93, 4351–4360. [Google Scholar] [CrossRef] [PubMed]
- Fogassy, G.; Thegarid, N.; Toussaint, G.; van Veen, A.C.; Schuurman, Y.; Mirodatos, C. Biomass derived feedstock co-processing with vacuum gas oil for second-generation fuel production in FCC units. Appl. Catal. B Environ. 2010, 96, 476–485. [Google Scholar] [CrossRef]
- De Miguel Mercader, F.; Groeneveld, M.J.; Kersten, S.R.A.; Geantet, C.; Toussaint, G.; Way, N.W.J.; Schaverienc, C.J. Hydrodeoxygenation of pyrolysis oil fractions: Process understanding and quality assessment through co-processing in refinery units. Energy Environ. Sci. 2011, 4, 985–997. [Google Scholar] [CrossRef]
- Stefanidis, S.D.; Kalogiannis, K.G.; Lappas, A.A. Co-processing bio-oil in the refinery for drop-in biofuels via fluid catalytic cracking. Wiley Interdiscip. Rev. Energy Environ. 2017, 7, e281. [Google Scholar] [CrossRef]
- van Dyk, S.; Su, J.; Mcmillan, J.D.; Saddler (John), J. Potential synergies of drop-in biofuel production with further co-processing at oil refineries. Biofuels Bioprod. Biorefining 2019, 13, 760–775. [Google Scholar] [CrossRef]
- Wang, C.; Venderbosch, R.; Fang, Y. Co-processing of crude and hydrotreated pyrolysis liquids and VGO in a pilot scale FCC riser setup. Fuel Process. Technol. 2018, 181, 157–165. [Google Scholar] [CrossRef]
- Directive (EU) 2018/2001 of the European Parliament and of the Council of 11 December 2018 on the promotion of the use of energy from renewable sources. Off. J. Eur. Union 2018, 2018, 82–209.
- EPA. Renewable Fuel Standard Program. Available online: https://www.epa.gov/renewable-fuel-standard-program (accessed on 20 June 2022).
- Chireshe, F.; Collard, F.; Johann, F.G. Production of low oxygen bio-oil via catalytic pyrolysis of forest residues in a kilogram-scale rotary kiln reactor. J. Clean. Prod. 2020, 260, 120987. [Google Scholar] [CrossRef]
- Dada, T.K.; Sheehan, M.; Murugavelh, S.; Antunes, E. A review on catalytic pyrolysis for high-quality bio-oil production from biomass. Biomass Convers. Biorefinery 2021. [Google Scholar] [CrossRef]
- Pinto, F.; Martins, S.; Gonçalves, M.; Costa, P.; Gulyurtlu, I.; Alves, A.; Mendes, B. Hydrogenation of rapeseed oil for production of liquid bio-chemicals. Appl. Energy 2013, 102, 272–282. [Google Scholar] [CrossRef]
- Vispute, T. Pyrolysis Oils: Characterisation, Stability Analysis, and Catalytic Upgrading to Fuels and Chemicals. University of Massachusetts Amherst: Amherst, MA, USA, 2011. [Google Scholar]
- Li, P.; Shi, X.; Wang, X.; Song, J.; Fang, S.; Bai, J. Bio-oil from biomass fast pyrolysis: Yields, related properties and energy consumption analysis of the pyrolysis system. J. Clean. Prod. 2021, 328, 129613. [Google Scholar] [CrossRef]
- Negahdar, L.; Gonzalez-Quiroga, A.; Otyuskaya, D.; Toraman, H.E.; Liu, L.; Jastrzebski, J.T.B.H.; Van Geem, K.M.; Marin, G.B.; Thybaut, J.W.; Weckhuysen, B.M. Characterization and Comparison of Fast Pyrolysis Bio-oils from Pinewood, Rapeseed Cake, and Wheat Straw Using 13 C NMR and Comprehensive GC × GC. ACS Sustain. Chem. Eng. 2016, 4, 4974–4985. [Google Scholar] [CrossRef]
- Wang, C.; Li, M.; Fang, Y. Coprocessing of Catalytic-Pyrolysis-Derived Bio-Oil with VGO in a Pilot-Scale Riser. I&EC Res. 2016, 55, 3525–3534. [Google Scholar] [CrossRef]
- Liu, Y.; Sotelo-Boyás, R.; Murata, K.; Minowa, T.; Sakanishi, K. Production of Bio-Hydrogenated Diesel by Hydrotreatment of High-Acid-Value Waste Cooking Oil over Ruthenium Catalyst Supported on Al-Polyoxocation-Pillared Montmorillonite. Catalysts 2012, 2, 171–190. [Google Scholar] [CrossRef]
- Tamošiūnas, A.; Gimžauskaitė, D.; Aikas, M.; Uscila, R.; Praspaliauskas, M.; Eimontas, J. Gasification of Waste Cooking Oil to Syngas by Thermal Arc Plasma. Energies 2019, 12, 2612. [Google Scholar] [CrossRef]
- Giakoumis, E.G. Analysis of 22 vegetable oils’ physico-chemical properties and fatty acid composition on a statistical basis, and correlation with the degree of unsaturation. Renew. Energy 2018, 126, 403–419. [Google Scholar] [CrossRef]
- Karaba, A.; Patera, J.; Ruskayova, P.D.; Carmona, D.P.; Zamostny, P. Experimental Evaluation of Hydrotreated Vegetable Oils as Novel Feedstocks for Steam-Cracking Process. Processes 2021, 9, 1504. [Google Scholar] [CrossRef]
- Hammond, E.W. Vegetable oils. Types and Properties. In Encyclopedia of Food Sciences and Nutrition, 2nd ed.; Caballero, B., Ed.; Academic Press: Cambridge, MA, USA, 2003; pp. 5899–5904. [Google Scholar]
- Peng, B. Transformation of Triglycerides and Fatty Acids into Biofuels with Sulfur-Free Catalysts; Technischen Universität München: Munich, Germany, 2012. [Google Scholar]
- Dayton, D.C.; Foust, T.D. Chapter Ten—Alternative. In Emerging Issues in Analytical Chemistry, Analytical Methods for Biomass Characterization and Conversion; David, C.D., Foust, T.D., Eds.; Elsevier: Amsterdam, The Netherlands, 2020; pp. 147–165. [Google Scholar]
- Pearlson, M.N. A Techno-Economic and Environmental Assessment of Hydroprocessed Renewable Distillate Fuels. Ph.D. Thesis, Massachusetts Institute of Technology, Cambridge, MA, USA, 2011. [Google Scholar]
- Su, J.; Cao, L.; Lee, G.; Tyler, J.; Ringsred, A.; Rensing, M.; van Dyk, S.; O’Connor, D.; Pinchuk, R.; Saddler, J. Challenges in determining the renewable content of the final fuels after co-processing biogenic feedstocks in the fluid catalytic cracker (FCC) of a commercial oil refinery. Fuel 2021, 294, 120526. [Google Scholar] [CrossRef]
- Pinho, A.D.R.; Almeida, D.; Bezerra, M.B.; Leal, F.M.; Ximenes, V.L. Production of lignocellulosic gasoline using fast pyrolysis of biomass and a conventional refining scheme. Pure Appl. Chem. 2014, 86, 859–865. [Google Scholar] [CrossRef]
- ECOFYS. Determining the Renewability of Co-Processed Fuels Final Report Determining the Renewability of Co-Processed Fuels. BIENL15839 Final Report. 2018. Available online: https://www.ufop.de/files/8215/3373/2754/ecofys-studie_Co-processing.pdf (accessed on 20 June 2022).
- CARB. Co-Processing of Low Carbon Feedstocks in Petroleum Refineries Draft Discussion Paper. 2017. Available online: https://ww2.arb.ca.gov/sites/default/files/classic/fuels/lcfs/lcfs_meetings/053017draft_discussion_paper_coprocessing.pdf (accessed on 20 June 2022).
- ESRL. Earth System Research Laboratory, U.S. Dept. of Commerce. 2019. Available online: https://www.esrl.noaa.gov/gmd/ccgg/isotopes/chemistry.html (accessed on 20 June 2022).
- Real Climate. How Do We Know That Recent CO2 Increases Are Due to Human Activities? 2004. Available online: http://www.realclimate.org/index.php/archives/2004/12/how-do-we-know-that-recent-cosub2sub-increases-are-due-to-human-activities-updated/ (accessed on 20 June 2022).
- Edler, R.; Kaihola, L. Determination of the 14C Content in Fuels Containing Bioethanol and Other Biogenic Materials with Liquid Scintillation Counting. LSC Application Note 43; Perkin Elmer: Waltham, MA, USA, 2007. [Google Scholar]
- University of Oxford. Oxford Radiocarbon Accelerator Unit. Accelerator Mass Spectrometry (AMS) Measurement. 2019. Available online: https://c14.arch.ox.ac.uk/ams.html (accessed on 20 June 2022).
- Beta Analytic. Accelerator Mass Spectrometry (AMS) Dating. 2019. Available online: https://www.radiocarbon.com/accelerator-mass-spectrometry.htm (accessed on 20 June 2022).
- Dos Santos, V.H.J.; Ramos, A.S.; Pires, J.P.; Engelmann, P.D.M.; Lourega, R.V.; Ketzer, J.M.; Rodrigues, L.F. Discriminant analysis of biodiesel fuel blends based on combined data from Fourier Transform Infrared Spectroscopy and stable carbon isotope analysis. Chemom. Intell. Lab. Syst. 2017, 161, 70–78. [Google Scholar] [CrossRef]
- Kaklamanos, G.; Aprea, E.; Theodoridis, G. Mass spectrometry: Principles and instrumentation. In Chemical Analysis of Food, 2nd ed.; Elsevier Inc.: Amsterdam, The Netherlands, 2020; pp. 525–552. [Google Scholar]
- CEN. EN 16640:2017 Bio-Based Products—Bio-Based Carbon Content—Determination of the Bio-Based Carbon Content Using the Radiocarbon Method. 2017. Available online: https://standards.iteh.ai/catalog/standards/cen/53004db7-e85b-433a-9ed5-5aaed4242fde/en-16640-2017 (accessed on 20 June 2022).
- CEN. Co-Processing Pyrolysis Oil. Project ID: SA/CEN/ENER/475/2019-15, Project Acronym H2020-CPO. 2021. Available online: https://www.nen.nl/onderzoek (accessed on 20 June 2022).
- DIN 51637 Standard; Liquid Petroleum Products—Determination of the Bio-Based Hydrocarbon Content in Diesel Fuels and Middle Distillates Using Liquid Scintillation Method. 2014. Available online: https://www.din.de/en/wdc-beuth:din21:194490746 (accessed on 20 June 2022).
- Bronić, I.K.; Barešić, J.; Horvatinčić, N.; Sironić, A. Determination of biogenic component in liquid fuels by the 14C direct LSC method by using quenching properties of modern liquids for calibration. Radiat. Phys. Chem. 2017, 137, 248–253. [Google Scholar] [CrossRef]
- ASTM D6866-21; Standard Test Methods for Determining the Biobased Content of Solid, Liquid, and Gaseous Samples Using Radiocarbon Analysis, Last Updated: 23 March 2022. Available online: https://www.astm.org/d6866-22.html, (accessed on 20 June 2022).
- Haverly, M.R.; Fenwick, S.R.; Patterson, F.P.K.; Slade, D.A. Biobased carbon content quantification through AMS radiocarbon analysis of liquid fuels. Fuel 2019, 237, 1108–1111. [Google Scholar] [CrossRef]
- Council Directive (EU) 2015/652. Laying Down Calculation Methods and Reporting Requirements Pursuant to Directive 98/70/EC of the European Parliament and of the Council Relating to the Quality of Petrol and Diesel Fuels; Official Journal of the European Union: Brussels, Belgium, 2015; pp. 116–133. [Google Scholar]
- De Paz Carmona, H. Co-Processing of Light Gasoil and Used Cooking Oil in a Hydrotreatment Industrial Unit. Prog. Petrochemical. Sci. 2018, 2, 202–203. [Google Scholar] [CrossRef]
- University of Arizona. Accelerator Mass Spectrometry 2019 rates. 2019 Rates. 2019. Available online: https://ams.arizona.edu/portal/download/rates.pdf (accessed on 20 June 2022).
- C&EN. An Easier Way to Tell Fossil Fuels from Biofuels. C&EN Chemical and Engineering News. 3 October 2017. ISSN 0009-2347. Available online: https://cen.acs.org/articles/95/web/2017/10/easier-way-tell-fossil-fuels.html (accessed on 20 June 2022).
- Bronić, I. Presentation on 14C Testing of Co-Processed Fuels; Personal communication; May 2019. [Google Scholar]
- Institut Ruđer Bošković. General 14C Testing Information and 2016 Price List Sent to JRC Feb 2018. 2018. Available online: http://www.irb.hr/eng/content/download/21048/588576/file/Pricelist.pdf (accessed on 20 June 2022).
- Perkin Elmer. Price List. 2017. Available online: https://www.ogs.ny.gov/purchase/spg/pdfdocs/3870022962PL_PerkinElmer.pdf (accessed on 20 June 2022).
- Hurt, M.; Martinez, J.; Pradhan, A.; Young, M.; Moir, M.E. Liquid Scintillation Counting Method for the Refinery Laboratory-Based Measurements of Fuels to Support Refinery Bio-Feed Co-Processing. Energy Fuels 2021, 35, 1503–1510. [Google Scholar] [CrossRef]
Publisher’s Note: MDPI stays neutral with regard to jurisdictional claims in published maps and institutional affiliations. |
© 2022 by the authors. Licensee MDPI, Basel, Switzerland. This article is an open access article distributed under the terms and conditions of the Creative Commons Attribution (CC BY) license (https://creativecommons.org/licenses/by/4.0/).