Abstract
The determination of an isolation-bearing scheme usually depends on experience, and needs numerous iterative calculations, especially when considering many factors such as total cost of the scheme, various design indicators, eccentricity of stiffness center of isolation bearings and the center of gravity of superstructure, and so on. Moreover, during the usual optimization process, the isolation scheme is often limited in several kinds of sizes and fixed predetermined distribution of types of isolation bearings based on experience or trial calculations due to computational efficiency, which would make it incapable of exploring other possible schemes. In this paper, artificial intelligence technology is applied to optimize the layout of isolation bearings. Types of isolation bearings are predicted through a Convolutional Neural Network, and sizes of isolation bearings are optimized by Hunter–prey optimization algorithm to improve computational efficiency and optimal arrangements of bearings. To simplify the optimization process, an optimization objective function considering a seismic decrease coefficient, story drift ratio and total cost of isolation bearings is proposed. In this function, weight coefficients reflect significance of various factors during the optimization process. In order to investigate influence of different combinations of weight coefficients on the optimal layout, 12 groups of combinations of weight coefficients are designed and analyzed. The results show that the optimal layout method of isolation bearings based on the artificial intelligence algorithm has good convergence efficiency of optimization and makes it possible to search more practical isolation scheme with good performance. When focusing on total cost of bearings, the ideal weight coefficient of the total cost would be larger than 0.4. While the structural performance factors are mainly considered, the weight coefficient of the maximum story drift ratio or seismic decrease coefficient should be larger than 0.2. For factors that designers pay more attention to, the corresponding weight coefficient should be larger than others.
1. Introduction
The Circuit Pacific seismic zone has been comparatively active since the 20th century, resulting in numerous powerful earthquakes. For instance, earthquakes with magnitudes greater than seven have successively occurred in Peru, Japan, Mexico, Haiti, and other nations in 2021. Meanwhile, enormous progress has been made in the theory and application [1,2] of seismic isolation technology as scientists have delved deeper into seismic resistance research in the field of structural engineering. Accordingly, in regions with high seismic fortification intensity, the utilization of isolation bearings in buildings [3,4,5,6], bridges [7], nuclear power plants [8], and other structures has become a priority seismic design strategy and also receives support from national legislation.
Furthermore, as the research on the isolation mechanism of various isolation bearings gradually deepens [9,10,11,12,13,14,15], researchers gradually began to pay more attention to how to draw up better isolation design schemes and apply intelligent algorithms [16] to the optimization of isolation design schemes so as to perform the function of isolation bearing in structures more effectively. Pourzeynali et al. [17] built a 2D model and utilized genetic algorithms to search parameters of isolated bearings; afterwards, they used a non-dominated sorting genetic algorithm to acquire a series of Pareto-optimal isolation schemes for high rise buildings. However, this method did not consider the 3D model and needed numerous iterative calculations. Masaaki et al. [18] investigated an approach to apply the Strength Pareto Evolutionary Algorithm 2 to figure out an optimal isolator scheme. During the optimization process, the cost of the isolation scheme was not considered. Fan et al. [19] utilized a sequential quadratic programming algorithm to optimize objective function concerning yielding stiffness and the strength of isolation bearings. Aiming to minimize the maximum seismic response of the superstructure, numerous iterative calculations would be needed when considering various other factors. Ayla et al. [20] optimized isolator parameters using an adaptive harmony search algorithm. Three different damping ratio limits and isolator displacement limits were taken to optimize the isolation scheme without considering cost and other design indicators. Dang [21] proposed a two-stage optimization method to acquire isolation arrangement, firstly introducing a multi-objective genetic optimization algorithm to obtain the optimal parameters of isolated bearings, then further optimizing the type distribution of the bearings to cut the cost of the isolation scheme, which made the optimization process time consuming and needed to assign a predefined small range of size and type of bearings manually. Once the predetermined range is unfit, a replay of the second step is needed. Shiravand et al. [22] compared various predefined allocation schemes of isolators between buildings with different stories and irregularities to obtain an optimal isolation arrangement. The research results may not be fit for other number of floors, and it was unknown if there were other isolation schemes besides the 11 kinds of predefined arrangements of isolators. Chang et al. [23] proposed an active control algorithm to search the isolator layer parameters and optimize weighting through structure seismic response. Only the parameters of the isolator layer were optimized, while other factors such as cost of scheme had not been taken into consideration. Zhang et al. [24] compared a laminated natural rubber bearing (LNR) with high damping rubber bearing to search an optimal isolation scheme for continuous beam bridge. During the whole process of optimization, the isolation schemes were artificially designated. Mousazadeh et al. [25] developed a cost model employing a multi-objective genetic algorithm to reduce the cost of LRB (Lead Rubber Bearing) systems. However, the variability of properties of LRB was not considered, meanwhile the prototype model was a 2D structure.
The aforementioned optimization algorithms are usually constrained by the fact that the computational power of the computer can only take into account a limited amount of optimization examples during an iterative optimization process, thus the efficiency of the optimization process is mainly dependent on the computer’s performance. Therefore, a relatively narrow range of isolation bearing sizes is applied during the optimization process, and the layout positions of various types of isolation bearings in the structure are usually fixed. Additionally, because the actual requirements for isolation bearings of the structure are not fully taken into account, once some indexes could not meet the requirement, more iterative calculations would be needed. Summarizing the previous research works, there are still several items to be considered comprehensively or work to be improved:
- Not fully considering factors such as total cost of scheme, various design indicators, eccentricity of the stiffness center of isolation bearings and the center of gravity of the superstructure, and so on.
- Only utilizing one or two kinds of sizes and fixed predetermined type distributions of isolation bearings based on experience or trial calculation during the optimization process.
- Needing large amounts of iterative calculations and depending on previous experience to set initial range of scheme to be optimized.
- The complex optimization objective function and time-consuming analysis process.
With the quick development of AI (Artificial Intelligence) technology, deep learning technology represented by neural network has been extensively utilized in vision, machinery, engineering and other fields. Based on feedback as a result of error calculation of the neural network output layer, the weight coefficient of the neural network would be updated, leading to the continuous improvement of the successful rate of learning of training set. Accordingly, in many fields, including disease detection [26], image recognition [27], structural health monitor [28], engineering optimization [29], vibration or displacement prediction [30,31], and vulnerability assessment [32], AI technology has reached or even surpassed manual capabilities of recognition [33], analysis [34], and calculation. In the field of structural engineering, Quaranta et al. [35] proposed a machine-learning-aided approach to improve mechanics-based code-conforming formulation so as to obtain the shear capacity equation for reinforced concrete beams and columns. Via verification with experimental data, this method is not only beneficial to develop capacity equations, but also can enhance accuracy of the final predictions. Mangalathu et al. [36] utilized the machine-learning approach to analyze predictions of the shear strength of components and assess the regional damage of bridges. Through comparison, they identified the efficiency of proper implementation of this method and key influential variables, which was helpful to understand reasons for behaviors and predictions of the machine-learning model. Because of the excellent capacity of AI technology, more and more researchers have begun to introduce AI technology in various applications of structural engineering. To improve the efficiency of optimization calculation and arrangement of isolation bearings, a joint algorithm based on AI technology is proposed in this paper. In this joint algorithm by means of setting reasonable model parameters, a Hunter–prey optimization (HPO) algorithm proposed by Naruei [37] is applied to optimize sizes of isolation bearings; similarly, CNN (Convolutional Neural Network) is utilized to predict types of isolation bearings during the optimization process, which is manipulated by Python based on the Application Program Interface (API) interface provided by ETABS.
Based on the considerations mentioned above, this paper introduces the AI algorithm to improve calculation efficiency during the optimization analysis process of isolation bearings and comprehensively considers the impact of economic cost, seismic decrease coefficient, and story drift ratio, as well as the constraint condition of eccentricity of the stiffness center of isolation bearings and the center of gravity of the superstructure, eventually forming an optimization method of isolation bearings based on the joint algorithm of CNN and HPO.
The overall structure of this paper is as follows: Section 2 introduces the calculating parameters and optimization objective function investigated in this paper. Section 3 presents the joint algorithm in which the type of isolation bearings is predicted through CNN algorithm; the optimization selection of the bearing size is based on the HPO algorithm, as well as the overall process of optimization calculation of isolation bearings using the joint algorithm. Section 4 introduces a calculation model example of the seismic isolation structure utilizing the optimization method proposed in this paper. Section 5 discusses the influence of different weight coefficient combinations of the optimization objective function on optimization analysis. Section 6 gives conclusions and prospects of the whole study, summarizing the optimization method of isolation bearings proposed in this paper.
2. Calculation Parameters and Objective Function
In order to acquire a more practical isolation scheme and make calculations more efficiently, real parameters and proper optimization objective function considering various factors are essential. Therefore, comprehensive parameters of isolation bearings are collected to form a data resource to be utilized in optimization. Moreover, a multi-objective optimization function is proposed to simplify the process of optimization.
2.1. Isolation Bearing Parameters
For the laminated natural rubber bearing (LNR) and lead rubber bearing (LRB) commonly used in structural isolation design, the geometric and mechanical properties as well as the prices of isolation bearings with isolation pad diameters of 200~1000 mm gathered in this paper are displayed in Table 1 and Table 2. The optimal arrangement analysis in this paper is mainly based on the isolation-bearing parameters in these two tables.

Table 1.
Parameters of laminated natural rubber bearing, collected from user manual book in http://www.shidier.com/ (accessed on 8 November 2022).

Table 2.
Parameters of lead rubber bearing, collected from user manual book in http://www.shidier.com/ (accessed on 8 November 2022).
2.2. Optimization Objective Function
In consideration that the cost of the isolation scheme is to a great extent determined by the cost of isolation bearings, which are the primary components in an isolation scheme based on reasonable performance optimization, the more economical isolation design scheme will undoubtedly possess stronger market competitiveness in the bidding-dominated construction market. Therefore, the cost of isolation bearings ought to be taken into account during the process of optimization calculation.
The seismic decrease coefficient can still serve the purpose of intuitively testing the damping effect of isolation bearings in a structure, even though isolation design concepts based on an overall analysis approach have been updated by the Chinese design code [38]. Meanwhile, lateral displacement of the base-isolated structure should be more strictly regulated than it is for the non-isolation structure due to the comparatively low lateral resistance of the base-isolated structure. Besides, the optimization arrangement of isolation bearing would be better carried out in conjunction with the market price of bearings, as mentioned above. During the optimization analysis process, because of the significant differences of magnitude between seismic decrease coefficient, story drift ratio, and total cost of bearings, the scale of the latter two factors is lowered by the initial value of the factor to highlight their significance in the optimization objective function. Additionally, the weight coefficient is set respectively to take into account the relative importance of various factors, and the optimization objective function is established as indicated in Formula (1):
where: α, λ, γ are respectively the weight coefficients of seismic decrease coefficient, maximum story drift ratio, and total cost of isolation bearings in the analysis of optimization arrangement. Here, the maximum story drift ratio is equal to the maximum ratio between maximum horizontal displacement and floor height in all the floors except the isolation layer. β is the seismic decrease coefficient for the base-isolated structure, equal to the maximum ratio of inter-story shear force between isolated and non-isolated structures in all floors except the isolation layer. Vi, V0, i are the inter-story shear force of the ith floor for the isolated and non-isolated structure, respectively. Though there is no requirement for this index in Eurocode 8 [39] and AASHTO (American Association of State Highway and Transportation Officials) standards [40], considering that the variation of inter shear force represents the energy dissipation of the isolated structure to some extent, this indicator could still be utilized for optimization when applying Eurocode 8 or AASHTO standards, and could also be replaced with other cared indexes or ignored by taking the weight coefficient as 0. θ0,max, p0 are respectively the maximum story drift ratio of the non-isolation structure and the total cost of isolation bearings in the initial scheme of the isolation bearing layout; θmax, p are respectively the maximum story drift ratio of the base-isolated structure and the total cost of isolation bearings during the optimization process. p1,max is the price of a single isolation bearing with the largest size used in the initial isolation scheme, and n is the total number of isolation bearings.
In the actual design of isolation structures, projects with different construction purposes often have different requirements for factors such as seismic decrease coefficient, structural performance and cost of isolation scheme. Therefore, the importance of various factors should be handled differently during the optimization process of isolation bearings to fulfill the unique requirements of actual projects. In order to evaluate the impact of different weight coefficients on optimization results, 12 groups of various weight coefficient combinations are designed for the seismic decrease coefficient, maximum story drift ratio, and total cost of isolation bearings, as indicated in Table 3. The influence of weight coefficients on the seismic decrease coefficient, structural performance, and cost will be investigated through subsequent analysis and comparison.

Table 3.
Weight coefficient combinations.
3. Optimal Arrangement Method of Isolation Bearings
Because there are two kinds of parameters for bearings to be optimized, i.e., size and type distribution, the aforementioned approaches usually predetermine size distribution or type distribution of an isolation scheme, or several kinds of bearings with fixed size and type. Then optimization would be performed around these prespecified combinations of bearings. If the requirements of design indicators are not satisfactory when considering various factors, more iterative calculations are usually needed, which makes the process of optimization very time consuming.
Due to calculation efficiency of computers, the optimization algorithm of isolation bearings mentioned in the introduction is initially restricted to a limited range of isolation bearings with fixed sizes, usually one or two types of prespecified sizes for all bearings throughout the process, such as all 800 mm bearings with prespecified positions. Therefore, the optimized isolation scheme is limited by the prespecified sizes of isolation bearings, and the eventual scheme would usually locate in that size range of isolation bearings assigned in advance, resulting in difficulty obtaining other possible applicable size combinations of isolation bearings, such as combinations of 700 mm, 800 mm, and 900 mm.
In order to improve optimization efficiency and the arrangement of bearings, two kinds of parameters for bearings, i.e., size and type distribution, are assigned to two algorithms to simplify the process of optimization. In this section, a CNN algorithm is applied in the prediction of type distribution; afterwards, an HPO algorithm is utilized to optimize the size of the isolation bearings to obtain an isolation scheme that fulfils design requirements.
3.1. Calculation Procedure of Isolation Structure
During seismic isolation design, if eccentricity of the isolation bearings stiffness center and the center of gravity of the superstructure is too large, the relative displacement between the superstructure and the isolation layer will be large under a seldom-occurred earthquake, which would cause the isolation bearings to be destroyed early or even cause the superstructure to continuously collapse, making it impossible for the isolation bearings to fully exert their effect. Hence, eccentricity of the stiffness center of isolation bearings and the center of gravity of the superstructure is clearly specified in the Chinese design code [38]: the eccentricity under the seismic fortification intensity should not be greater than 3%, and it would be better for the stiffness center of the isolation layer to be close to the center of gravity of the superstructure. Here, seismic fortification intensity is applied as the design reference for seismic fortification in a region. In general, this seismic intensity represents design seismic action with 10% exceedance probability in 50 years in Chinese design code, corresponding to design earthquake ground motion in International Building Code [41] and no-(local-) collapse level in Eurocode 8 [39]. Accordingly, in this paper, eccentricity is also taken into account as a constraint condition for isolation optimization analysis.
In a conventional isolation scheme, the layout of isolation bearings is typically arranged based on previous experience and trial calculations. Then, according to the gap between the predetermined design target and various design indicators of isolated structures under the action of fortification earthquakes and rare earthquakes, the isolation bearing scheme will be iteratively adjusted. To improve this process, Convolutional Neural Network and Hunter–prey optimization specifically elaborated in Section 3.2 and Section 3.3 are applied in the selection of types and sizes of bearings to acquire an isolation scheme more intelligently, even for freshman without any experience. Afterwards, Python is utilized to update the isolation scheme in the structural model via API of ETABS to perform calculation procedure. During this period, the specific processes of each iteration are as follows:
- Selecting initial bearings: the isolation bearings that meet the requirements are preliminarily chosen based on vertical reaction at column bottom under the action of the standard gravity load of the non-isolation structure model, limit value of bearings compressive stress, and yield force of bearings listed in Table 1 and Table 2.
- The isolation model is established in the analysis software according to the bearing parameters. In this paper, the optimization calculation is performed with the ETABS, which is manipulated by Python through API interface. For LNR, LRB bearings, the Rubber isolator element is used to create tensile and biaxial shear model. Moreover, on account of the significant difference between compression and tensile stiffness, the compression constitutive relation is reflected by the Gap element. For an intuitionistic demonstration, the Rubber isolator element and Gap element are exhaustively depicted in Figure 1. Based on the isolation model, the column axial force at the bottom, the inter-story shear force, the eccentricity of the stiffness center of isolation bearings and the center of gravity of superstructure, and the story drift ratio would be calculated through nonlinear dynamic time history analysis under fortification earthquakes, as well as the seismic decrease coefficient combined with calculation results of the non-isolated model.
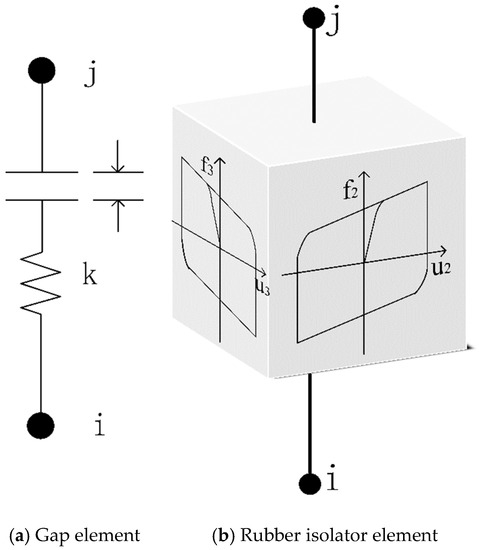 Figure 1. Isolation element: i and j are the two ends of the element, respectively; (a) k represents stiffness of bearing, though gap element would work only after the gap is closed and could not bear any tension; (b) u2, u3 and f2, f3 are the maximum displacement and horizontal bearing forces in two directions of the Rubber isolator element.
 - Based on nonlinear dynamic time history analysis under rare earthquakes, the stress of the isolation layer and maximum horizontal displacement of bearings would be examined.
3.2. HPO Algorithm
In 2021, Naruei [37] proposed a new optimization algorithm to simulate the hunting process of predatory animals, which has good convergence speed and optimization capability. Its main algorithm flow is as follows:
Firstly, the predator or prey population randomly initializes its position through the upper and lower boundary:
where: RAND (0, 1) is a random number between (0, 1), lb, ub are respectively the lower and upper boundary, which are determined by the specific problem investigated.
X1, X2, …, Xk (k = 1, 2, …N) = lb + RAND (0, 1) (ub − lb)
Secondly, the predator searches the prey population then attacks an individual far away from the prey population, and updates its position according to the position of the prey and the best position through the fitness mechanism of objective function in the process of predation. During the search process of predators, an adaptive parameter Z is applied to adjust the range of position and updated to ensure search efficiency:
where: Ppos,j is the position of prey in kth iteration. Xj,k+1, Xj,k are the positions of predators in iteration k + 1 and k, respectively. μ is the average position of all predators, and the adaptive parameter Z is adjusted by Formula (6):
where: R1 and R3 are random vectors between [0, 1]. C is a gradually decreasing balance parameter that enables predators to choose their exploration and development state. Iter and maxiter are current and total iteration numbers, respectively, while P is the index value of the random vector when R1 < C, and index (R1) is the index value when random vector R1 meets P = 0.
Xj,k+1 = Xk + 0.5[(2CZPpos,j − X j,k) + (2(1 − C)Zμ − Xj,k)]
During hunting, through searching the prey with the largest distance to average position of all prey, the predator determines corresponding prey to be hunted.
where: D represents distance of all predators to the average position of μ, which is the average position of all predators. XDmax is the individual that is farthest from the population.
After a hunt is finished, the predator updates a new hunting target. Initially C = 1 and kbest = N; as the number of iterations rises, the balance parameters C and kbest gradually decrease, ensuring better convergence accuracy in the latter period.
If prey successfully escapes or find safe shelter, the predators have no opportunity to hunt. In order to improve the efficiency of hunting, with the updating of prey, the predators will also update their positions:
where: Pbest is the global optimal location of prey, while R4 is a random number between [−1, 1].
Xj,k+1 = Pbest + CZcos(2πR4) (Pbest − Xj,k)]
Based on the fast convergence speed of the predator algorithm, the sizes of isolation bearings can be optimized through this algorithm because the size of an isolation bearing is fixed within a predetermined range, which could be substituted into the Formula (4). The size of the isolation bearing can be considered as each individual of prey, while the iterative optimization of multiple populations will be simultaneously executed to obtain the size groups of isolation bearings that minimize the fitness value of objective function.
3.3. Prediction of Isolation Bearing Type Based on CNN Algorithm
After the sizes of isolation bearings are determined, the types of isolation bearings are usually chosen according to total horizontal yield force of the isolation layer to ensure that the isolation layer can withstand horizontal shear force. The selection principle of types of isolation bearings in traditional design method is to arrange LRB bearings on the periphery of the structure and LNR bearings inside and then check the eccentricity of the stiffness center of the isolation bearings and the center of gravity of the superstructure, the seismic decrease target, the stress of isolation layer, and the isolation bearing displacement, eventually performing iterative calculation and optimization according to whether each index meets design requirements.
However, for large-scale or complex arrangement structures, the selection approach of types of isolation bearings is somehow limited by the design period and computer calculation speed. Even experienced designers require more iterative calculations to obtain a somewhat satisfactory design scheme. Moreover, due to the limited number of samples compared, the selected isolation scheme may not achieve the best isolation performance. Accordingly, a CNN algorithm to select the types of isolation bearings is introduced in this paper. The major workflow is as follows:
Initially, a batch of size groups of isolation bearings would be established to generate the data set. Based on the sizes of isolation bearings selected at random, by setting the constraints of eccentricity, stress, and horizontal yield force of isolation bearings, the objective function concerning the cost of isolation bearings, seismic decrease coefficient and horizontal stiffness is considered. The types of isolation bearings are optimized by HPO algorithm so as to obtain the type distribution of bearings with minimum value of objective function, during which the LNR bearing is represented by 0, while 1 means the LRB bearing. Through this means, a data set with a capacity of 500 different combinations of sizes and types of isolation bearings is generated, operating flow of which is shown in Figure 2.
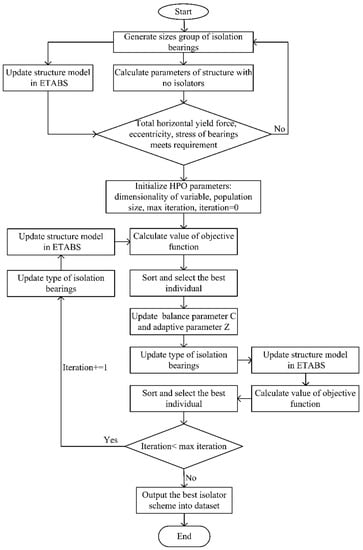
Figure 2.
Flow diagram of generating data set.
Subsequently, the data set will be divided into training set and test set. During the training period—by taking the sizes of isolation bearings as the input parameters, and the types of isolation bearings and the value of optimization objective function as the output parameters—the CNN network is trained. Meanwhile, the error calculation with information of the bearings in the data set is conducted so as to acquire feedback to update weight coefficients in the neural network. In order to determine weight coefficient in the neural network with higher efficiency, a genetic algorithm is introduced in the training process, and the structure of the neural network is updated through the selection, crossover, and mutation mechanism [42] of the genetic algorithm. Through this process, the neural network has better performance in predicting types of isolation bearings. The CNN network structure is shown in Figure 3.
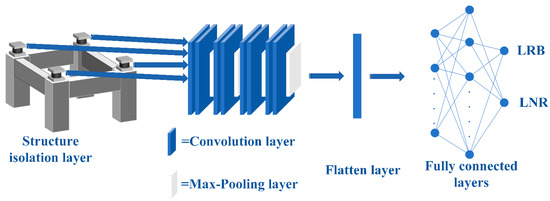
Figure 3.
Schematic diagram for type prediction of isolation bearings based on CNN network.
After trial calculation, for the calculation example in Section 4, the adopted CNN network structure chooses the sizes of 54 isolation bearings at the column base as the input layer; the convolution layer-pooling layer-full connection layer is set to be 98-98-84, respectively. The output layer contains the types of isolation bearings (LRB, LNR) at the base of 54 columns.
3.4. Optimization Approach of Isolation Bearing Arrangement Based on AI Algorithm
Based on the calculation procedure of the isolation structure and the selection method of sizes and types for isolation bearings mentioned in Section 3.1, Section 3.2 and Section 3.3, the optimization method of the isolation bearing layout based on the AI algorithm is obtained as follows:
- Preliminary selection of bearing size and type: according to vertical reaction force of the column base under the action of the standard value of the gravity load of the non-isolation structure model, the limit value of compressive stress and yield force of isolation bearings and size groups of isolation bearings corresponding to the population number in the HPO algorithm are generated. As a guarantee for the feasibility of the isolation scheme, we check whether the total horizontal yield force and eccentricity of the isolation scheme meet requirements when bearings are all LRB. If they do, the size groups of the bearings would be submitted to the trained CNN neural network to predict types of isolation bearings. Otherwise, size groups of isolation bearings would be regenerated until the requirements above are met. Then, a population of isolation bearings containing information of sizes and types is formed.
- According to the sizes and types of information of isolation bearings, isolation structure models will be established by Python calling ETABS through API interface. Through nonlinear dynamic time history analysis, axial force at the column bottom, inter-story shear force, and story drift ratio would be calculated, as well as the seismic decrease coefficient and eccentricity in combination with calculation results of the non-isolation structure model. Then, prices of isolation bearings in Table 1 and Table 2 will be utilized to calculate the total cost of bearing scheme. Furthermore, the total cost will be substituted into Formula (1) to acquire value of objective function, based on which the minimum fitness value of function in the current iteration and its corresponding scheme of isolation bearings are updated.
- After parameters of the HPO algorithm, including sizes of isolation bearings, and types of isolation bearings based on step (1), are updated, the isolation structure model will be rebuilt by Python automatically calling ETABS through API interface. Through a nonlinear dynamic time history analysis of the new isolation model under a rare earthquake, the stress of the isolation layer and the maximum horizontal displacement of the bearings will be calculated. If all the design indexes meet requirements, the historical best value of objective function and its corresponding isolation scheme will be updated. Otherwise, return to step (1) to regenerate sizes of isolation bearings and continue calculation of step (2)~(3) to complete an iterative calculation.
- If iteration number has reached the maximum number of predetermined iterations, or the difference between optimum fitness values of the function of two adjacent iterations has reached the limit value predetermined, the process of iterative calculation has been accomplished.
Summarizing the above steps, the optimization flow of this approach is displayed in Figure 4.
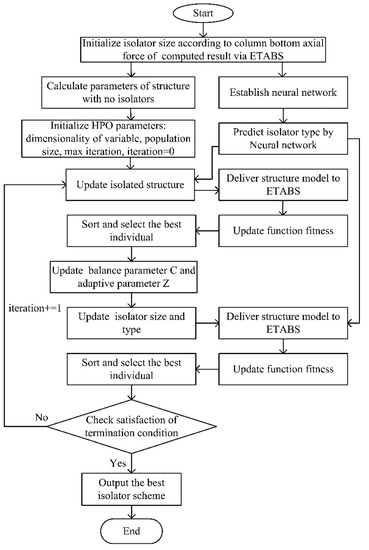
Figure 4.
Flow chart for the optimization approach of isolation bearing arrangement based on the AI algorithm.
4. Example Analysis
According to the calculation parameters and optimization objective function presented in Section 2, a 9-story concrete frame structure model for the optimization calculation of the isolation scheme is established and its corresponding isolation model is optimized utilizing the optimization approach proposed in Section 3 to verify its effectiveness.
4.1. Structure Model
The Location of a structure has a seismic fortification intensity of 8 degrees 0.2 g with site Class II, and design earthquake group 2. According to the Chinese design code [43], a 9-story concrete frame structure is designed, with standard story height 3.3 m, and isolation story height 2 m. As is shown in Figure 5 and Figure 6, the structural plane and elevation layout, the structure has five transverse spans—which are 4.6 m, 8.2 m, 3.5 m, 8.2 m, and 4.6 m, respectively—and eight longitudinal spans of 6.3 m × 8 m. The main beam size is 300 mm × 700 mm and the thickness of the slab is 120 mm, while column sizes of 1–3 layer, 4–6 layer, and 7–9 layer are 1000 mm × 1000 mm, 900 mm × 900 mm, and 800 mm × 800 mm, respectively. The concrete strength grade of the beam and slab is C35, and C40 for column. The floor live load, floor dead load, and design basic wind pressure are 2.5 kN/m2, 3.5 kN/m2, and 0.3 kN/m2, respectively. The structural damping ratio is 0.05, and the compressive stress limit value of isolation bearings is 12 Mpa. More details and design parameters are listed in Table 4.
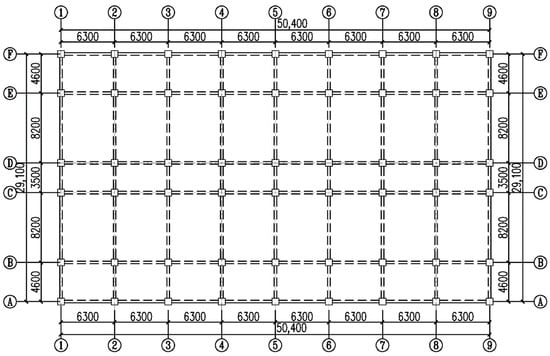
Figure 5.
Structural plane layout (unit: mm): letters A–F represent serial numbers of lengthwise axis.
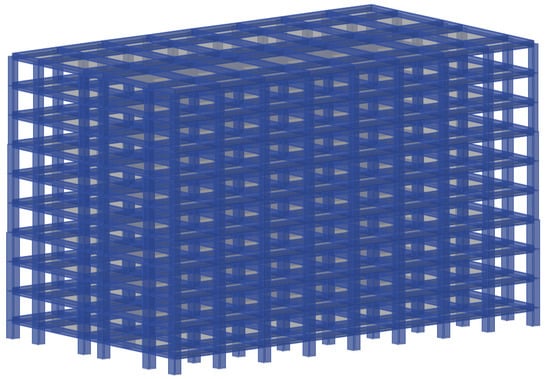
Figure 6.
Structural elevation layout.

Table 4.
Design parameters for the example structure.
According to the design response spectrum and calculation results of non-isolation and preliminary base-isolated structure models under a fortification earthquake, two artificial waves and five natural waves are selected, the spectrum curves of which are shown in Figure 7. The peak amplitude of seismic wave acceleration is adjusted to 200 gal under the fortification earthquake, and 400 gal under the rare earthquake. Here, the fortification earthquake is a design seismic action with 10% exceedance probability in 50 years in the Chinese design code [43], corresponding to design earthquake ground motion in the International Building Code [41] and no-(local-) collapse level in Eurocode 8 [39]. The rare earthquake is design seismic action with 2–3% exceedance probability in 50 years in the Chinese design code [43], corresponding to the maximum considered earthquake ground motion in the International Building Code [41].
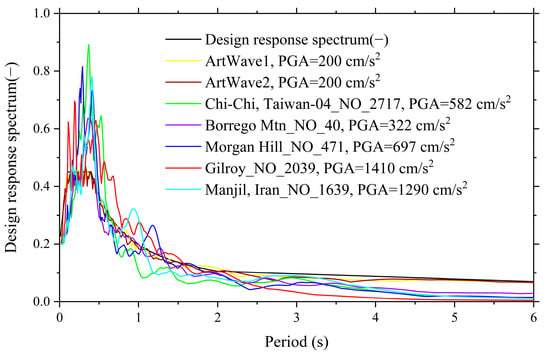
Figure 7.
Diagram of seismic wave response spectrum: scale factor for natural waves: Chi-Chi, Taiwan-04_NO_2717: 0.34, Borrego Mtn_NO_40: 0.62, Morgan Hill_NO_471: 0.29, Gilroy_NO_2039: 0.14, Manjil, Iran_NO_1639: 0.16.
4.2. Layout Optimization of Isolation Bearings
In this section, take the weight coefficient α = 0.4, λ = 0.2, and γ = 0.4, respectively, as an example to optimize the isolation bearings. After trial calculations, the optimization parameters applied in the size optimization process of isolation bearings are adjusted as follows: set population size as 5 and iteration number as 10. When recording data during the iterative optimization process, since the second iteration the value of the optimization objective function calculated by Formula (1) gradually diminishes to a stable value at the seventh iteration, as shown in Figure 8, demonstrating that the proposed joint algorithm has good convergence efficiency during the process of optimization. The optimized isolation design scheme is depicted in Figure 9, in which the type distribution of the isolation bearings appears to be uniform due to considering the eccentricity of the stiffness center of isolation bearings and the center of gravity of the superstructure.
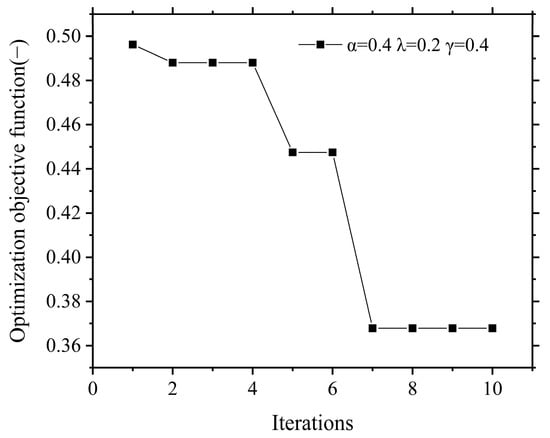
Figure 8.
Convergence diagram of optimization objective function.
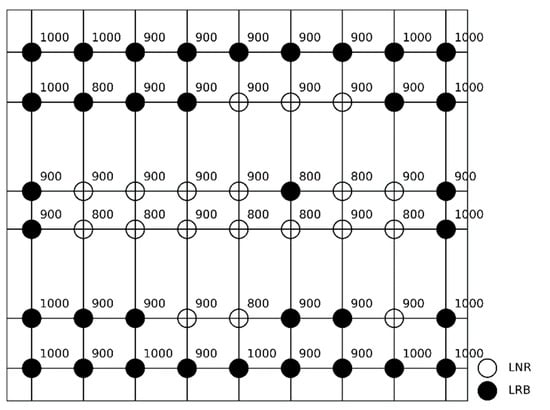
Figure 9.
Optimization isolation design scheme based on AI algorithm; the number beside the circle represents bearing size to be applied at that place (unit: mm), filled circle represents the LRB bearing, and hollow circle represents the LNR bearing.
4.3. Analysis of Optimization Results
The calculation results of shear force and story displacement of non-isolation structure and isolation structure are respectively extracted, as shown in Figure 10. After optimization calculation, the maximum story drift ratio and the base shear force greatly decrease, and during the iterative process, eccentricity of the isolation layer is always considered so that the stiffness center of isolation layer is relatively close to the center of gravity of the superstructure. The maximum story drift ratio of the superstructure under the rare earthquake meets the requirement of the design code [38], as well as displacement and stress of the isolation bearings, as depicted in Figure 11.
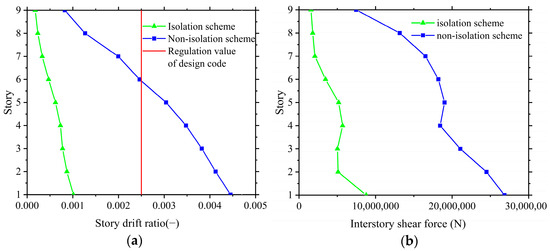
Figure 10.
Comparison of calculation results of non-isolation and isolation design schemes. (a) Story drift ratio; (b) Inter-story shear force.
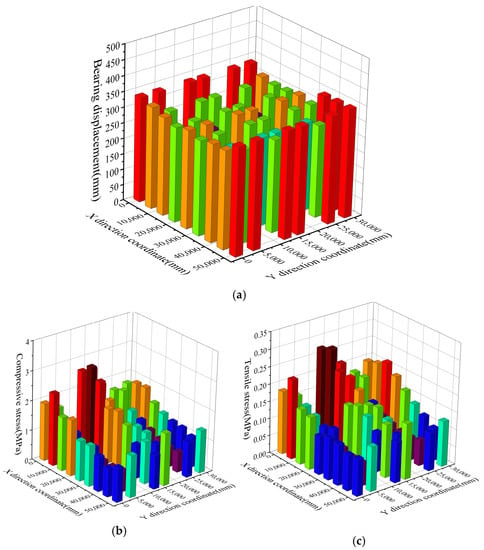
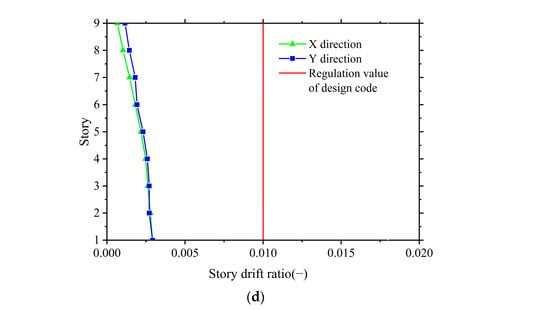
Figure 11.
Calculation results of isolation bearings under the rare earthquake. (a) Bearing displacement; (b) Bearing compressive stress; (c) Bearing tensile stress; (d) Superstructure displacement.
Under the rare earthquake, displacements of bearings are all less than 0.55 times bearings diameter and 3 times total rubber thickness prescribed by the Chinese design code [38], as is shown in Figure 11a. Meanwhile, displacements of periphery bearings are larger than the inside ones, similarly corresponding to the distribution of different diameters of bearings, as is shown in Figure 9.
5. Discussion
Through carrying out optimization analysis of isolation bearings under the various combinations of weight coefficients listed in Table 3, results are investigated and analyzed in this Section. More details are demonstrated, such as variation of total cost and design indexes of various isolation schemes with different weight coefficient combinations during the convergence process of optimization analysis, as depicted in Figure 12, Figure 13 and Figure 14.
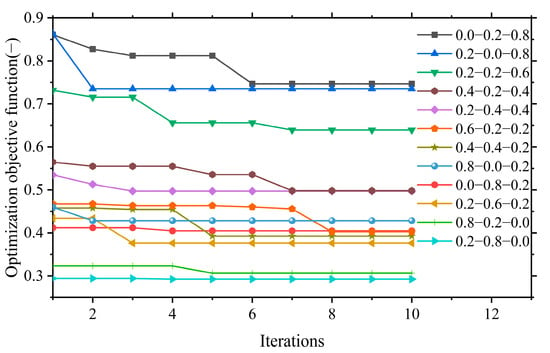
Figure 12.
Convergence diagram of optimization objective function with different combinations of weight coefficient: numbers in the legend represent weight coefficient α, λ, and γ, respectively; for example, 0.0–0.2–0.8 means α = 0.0, λ = 0.2, γ = 0.8.
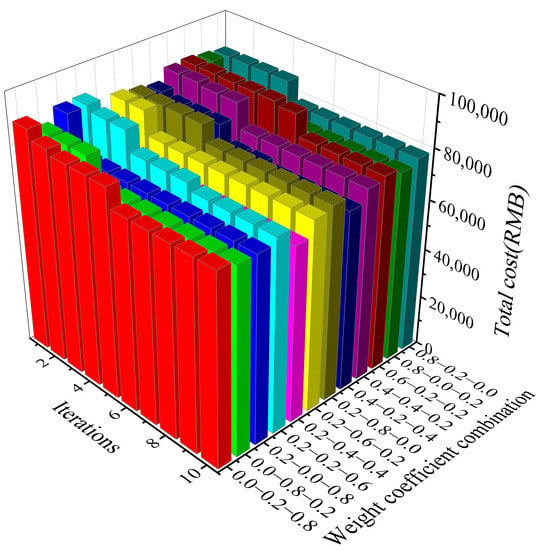
Figure 13.
Variation of total cost of isolation scheme with different weight coefficient combinations: numbers in the weight coefficient combination represent weight coefficient α, λ and γ respectively, for example, 0.0–0.2–0.8 means α = 0.0, λ = 0.2, γ = 0.8.
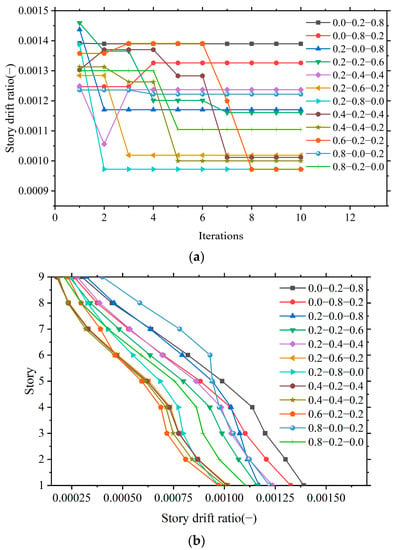
Figure 14.
(a) Maximum story drift ratio; (b) Story drift ratio. Variation of story drift ratio of isolation scheme with different weight coefficient combinations: numbers in the legend represent weight coefficient α, λ, and γ, respectively; for example, 0.0–0.2–0.8 means α = 0.0, λ = 0.2, γ = 0.8.
5.1. Computational Efficiency
The convergence with different combinations of weight coefficients in the iterative process is illustrated in Figure 12. Though the iteration numbers of different combinations are diverse, optimization objective function could usually converge to fixed value efficiently. According to the variation of objective function, the value of objective function gradually decreases with the augment of iteration number, and generally tends to remain stable after 4–8 iterations, further demonstrating the good convergence efficiency of the optimization method proposed.
5.2. Optimization Objective Function
In the line chart of Figure 12, when the weight coefficient of total cost γ increases in a range from 0.0 to 0.8, the starting point and ending convergence point of the optimization objective function value gradually rise. Meanwhile, compared to the former weight coefficient of total cost, the average increments of optimization objective function value are 33.9%, 24.1%, 28.4%, and 15.9%, respectively, while for weight coefficient of seismic decrease coefficient α, weight coefficient of maximum story drift ratio λ, there is no significant variation of objective function value. For example, fixing weight coefficient γ at 0.2, when weight coefficient α increases from 0.0 to 0.8, and the weight coefficient λ decreases from 0.8 to 0.0, the value of objective function increases by—7%, 4.3%, 2.6%, and 6.4% respectively. If fixing weight coefficient α at 0.2, when weight coefficient γ increases from 0.0 to 0.8, and weight coefficient λ decreases from 0.8 to 0.0, the value of objective function increases by 28.6%, 32.1%, 28.5%, and 15% respectively. If fixing weight coefficient λ at 0.2, when weight coefficient α increases from 0.0 to 0.8, and weight coefficient γ decreases from 0.8 to 0.0, the value of objective function decreases by 14.4%, 22.1%, 19.2%, and 23.9% respectively. This indicates that, for the example structure, the value of optimization objective function is more sensitive to the weight coefficient of total cost γ relatively. The possible reason is that the size of isolation bearings to be employed is relatively large due to the comparatively large building volume. Then, the size of isolation bearing tends to the upper boundaries of bearing size in Table 1 and Table 2, thus the optimized size of the bearing is close to the initial size during the optimization process, resulting in the third item in Formula (1) being relatively larger than the first two items. Therefore, the total cost has a greater impact on the objective function compared with the seismic decrease coefficient and maximum story drift ratio.
5.3. Total Cost
Compared with the initial stage, when the weight coefficient of total cost γ varies between 0.8 and 0.0, the total cost of isolation bearing in the stable stage is reduced by 15.25%, 13.8%, 12.95%, 11.35%, and 8.55%, respectively, as depicted in Figure 13. The greater the weight coefficient of total cost γ, the larger the decrease percent is. Moreover, fixing the weight coefficient of total cost γ at 0.8, when weight coefficient of the seismic decrease coefficient α increases from 0.0 to 0.2, the decrease percent of total cost rises from 14.3% to 16.2%. If fixing weight coefficient γ at 0.4, when weight coefficient α increases from 0.2 to 0.4, the decrease percent of total cost rises from 12.6% to 13.3%. While fixing weight coefficient γ at 0.2, when weight coefficient α increases from 0.0 to 0.8, the total cost of bearings decreases by 11.3%, 10.9%, 12.1%, 11.1%, and 12.6%, respectively.
When weight coefficient γ is greater than 0.4, the reduction of total cost tends to increase with the increment of weight coefficient α. While weight coefficient γ is less than 0.4, there is no obvious correlation between the decrease percent of total cost and the variation of weight coefficient α. Therefore, when focusing on total cost of bearings during optimization, it would be better if the weight coefficient of total cost γ is larger than 0.4. The greater the weight coefficient of total cost γ is, the larger the decrease magnitude of total cost is. Meanwhile, it would be better if the weight coefficient of the seismic decrease coefficient α is as large as possible, which would bring 1–2% decrease percent of total cost for every increase of 0.2 in weight coefficient α.
5.4. Maximum Story Drift Ratio
In initial stage, the maximum story drift ratio does not clearly decrease with the variation of objective function. On the contrary, it oscillates during the optimization process, but it tends to remain stable in the later stage. There are mainly three obvious trends: when the weight coefficient α = 0.0, compared with the initial value, the maximum story drift ratio does not decrease significantly, and even increases in the case of 0.0–0.8–0.2. Because the seismic decrease coefficient is not considered during the optimization process, when α = 0.0, seismic decrease coefficient and base shear force would not decrease significantly, thus the reduction of seismic action on the superstructure is not significant, as is the variation trend of maximum story drift ratio. However, the maximum story drift ratio decreases significantly from its initial value when weight coefficient α > 0.0. Especially in the cases of α > 0, γ < 0.4, λ = 0.8, 0.6, 0.4, and 0.2, the decrease amplitude of maximum story drift ratio is 29.9%, 20.7%, 23.8%, and 28.4%, respectively, compared to initial the value, as depicted in Figure 14. The greater the weight coefficient of maximum story drift ratio λ is, the larger the decrease percent of maximum story drift ratio is. Fixing weight coefficient of maximum story drift ratio λ at 0, when weight coefficient of seismic decrease coefficient α increases from 0.2 to 0.8, maximum story drift ratio increases by 9.8%. Fixing weight coefficient of maximum story drift ratio λ at 0.2, when weight coefficient of seismic decrease coefficient α increases from 0.2 to 0.8, maximum story drift ratio decreases by 11.8%, 12.9%, and 13.7%, respectively. If fixing the weight coefficient λ at 0.4, when weight coefficient α increases from 0.2 to 0.4, maximum story drift ratio decreases by 19.2%.
In a nutshell, when the weight coefficient α = 0.0 or λ = 0, the maximum story drift ratio would not decrease significantly or even increase. When maximum story drift ratio is mainly considered, the weight coefficient of the maximum story drift ratio λ would better be larger than 0.2. Meanwhile, the maximum story drift ratio would acquire 1–5% decrease for every increase of 0.2 in weight coefficient α.
5.5. Seismic Decrease Coefficient
Similar to the variation trend of maximum story drift ratio, the seismic decrease coefficient shows three obvious trends during the optimization process: when the weight coefficient of seismic decrease coefficient α = 0.0, the seismic decrease coefficient does not decrease significantly in comparison to the initial value, and especially increases gradually in the case of 0.0–0.8–0.2, as shown in Figure 15a,b. In addition, the seismic decrease coefficient shows an increasing trend, increasing by 1.7%, 5.6%, 13%, and 1.3%, respectively, when α = 0.2, γ = 0.0, 0.2, 0.4, and 0.8, compared to the initial value. Except in the case γ = 0.6, the seismic decrease coefficient decreases by 1.3%, which could be ignored. When weight coefficient α > 0.2, the seismic decrease coefficient exhibits a descending trend. Fixing the weight coefficient of seismic decrease coefficient α at 0.4, when weight coefficient of maximum story drift ratio λ increases from 0.2 to 0.4, the seismic decrease coefficient decreases by 1.8%.
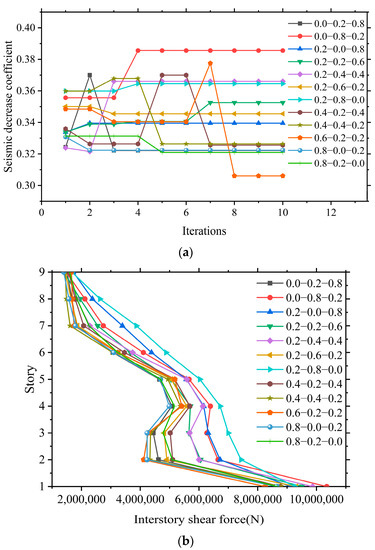
Figure 15.
(a) Seismic decrease coefficient; (b) Inter story shear force. Variation of design indexes of isolation scheme with different weight coefficient combinations: numbers in the legend represent weight coefficient α, λ, and γ, respectively; for example, 0.0–0.2–0.8 means α = 0.0, λ = 0.2, γ = 0.8.
Therefore, when the seismic decrease coefficient is mainly considered, the weight coefficient of the seismic decrease coefficient α should be larger than 0.2. Meanwhile, the seismic decrease coefficient would acquire 1–2% decrease percent for every increase of 0.2 in weight coefficient λ.
5.6. Determination of Weight Coefficients
To conclude, the total cost of bearings, maximum story drift ratio, and seismic decrease coefficient decrease as the corresponding weight coefficient rises. When focusing on cost of bearings, it is advisable to make the weight coefficient of the total cost γ ≥ 0.4 and acquire 1–2% decrease percent of the total cost for every increase of 0.2 in weight coefficient α. Conversely, when taking maximum story drift ratio into account, the weight coefficient of the maximum story drift ratio λ should be larger than or equal to 0.2, and maximum story drift ratio would acquire a 1–5% decrease for every increase of 0.2 in weight coefficient α. When the seismic decrease coefficient is mainly considered, the weight coefficient of seismic decrease coefficient α should be larger than 0.2; meanwhile, the seismic decrease coefficient would acquire 1–2% decrease for every increase of 0.2 in weight coefficient λ.
6. Conclusions and Prospect
A joint algorithm-based optimization approach that employs a CNN network to predict types of isolation bearings and an HPO algorithm to optimize sizes of isolation bearings is proposed in this paper. To simplify the optimization process, an optimization objective function that takes the seismic decrease coefficient, story drift ratio, and economic cost into account is applied. By assigning various combinations of weight coefficients in the optimization objective function, the significance of various optimization objectives can be taken into consideration. Through employing the optimization objective function as a function fitness value of the HPO algorithm, the joint algorithm is utilized to optimize the arrangement scheme of the isolation bearings. After applying a joint algorithm-based optimization approach in an actual engineering example, the impact on each optimization objective of different combinations of weight coefficients is analyzed and the efficiency of this method has been demonstrated. Summarizing the analysis above, the main conclusions are enumerated as follows:
- This study establishes a framework to optimize an isolation scheme by means of updating a structural model and value of optimization function using Python based on the Application Program Interface (API) interface provided by ETABS, optimizing sizes of isolation bearings by Python based on HPO algorithm, and predicting types of isolation bearings by Python based on CNN. It performs automatically in isolation analysis and the arrangement optimization of isolation bearings without artificial intervention.
- The isolation bearing optimization method based on the AI algorithm possesses high convergence efficiency during the optimizing process for all the combinations discussed in this study. For several factors that have been completely considered and optimized, the isolation scheme utilizing the combined algorithm using CNN and HPO is practicable for type selection and size optimization of isolation bearings and meets the requirements of the design code.
- The total cost weight coefficient of isolation scheme has a greater impact on the optimization objective function. Moreover, the total cost of bearings, maximum story drift ratio, and seismic decrease coefficient decrease as corresponding weight coefficient rises. According to variations of these factors, for factors that designers pay more attention to, the corresponding weight coefficient should be larger than others.
- Several required factors are simultaneously considered by the proposed optimization objective function, through the optimization of which all objects about these factors acquire optimization at different levels by means of different combinations of weight coefficient. This approach is beneficial to simplify and accelerate the optimization process of isolation scheme.
- Concerning the constraint condition about eccentricity of the stiffness center of isolation bearing and the center of gravity of the superstructure throughout the optimization process, not only would the isolation scheme meet specifications of design code, but the type distribution of isolation bearings also appears to be uniform and more sizes of isolation bearings could be employed in an isolation layer scheme during the optimization process.
Current work is applied on ETABS version 2018, therefore accessibility of other versions of ETABS needs to be verified. Moreover, future work is worth investigating, such as programming into a software that would facilitate practical engineering applications, verifying other possible combinations of more factors in optimization objective functions, improving the calculation method of the weight coefficient, and so on.
Author Contributions
Conceptualization, Z.Z.; methodology, Z.Z.; software, Z.Z.; validation, Z.Z.; formal analysis, Z.Z.; investigation, Z.Z.; resources, Z.Z.; data curation, Z.Z.; writing—original draft preparation, Z.Z.; writing—review and editing, Z.Z. and Q.Y.; visualization, Z.Z.; supervision, Q.Y.; project administration, Q.Y.; funding acquisition, Q.Y. All authors have read and agreed to the published version of the manuscript.
Funding
This research received no external funding.
Institutional Review Board Statement
Not applicable.
Informed Consent Statement
Not applicable.
Data Availability Statement
The data used to support the findings of this study are included within the article.
Conflicts of Interest
The authors declare no conflict of interest.
References
- Miranda, S.; Miranda, E.; Carlos, L.J. A simplified and versatile element model for elastomeric seismic isolation bearings. Earthq. Spectra 2022, 38, 331–357. [Google Scholar] [CrossRef]
- Ye, K.; Xu, Y.; Ni, G.; Fu, R. Integrated seismic design method for base-isolated structure incorporating direct displacement-based design procedure. J. Build. Struct. 2022, 43, 58–67. [Google Scholar] [CrossRef]
- Forcellini, D.; Kalfas, K.N. Inter-story seismic isolation for high-rise buildings. Eng. Struct. 2023, 275, 115175. [Google Scholar] [CrossRef]
- Darwish, A.Q.; Bhandari, M. Vibration Response Reduction of Seismic Forces Using Lead Rubber Bearing Isolators in Composite Buildings. J. Vib. Eng. Technol. 2022, 10, 1309–1324. [Google Scholar] [CrossRef]
- Wu, Y.X.; Liu, N.; Ai, Q. Seismic performance of a new structural design solution for first-story isolated RC buildings with coupled beam-column connections. Appl. Sci. 2019, 9, 177. [Google Scholar] [CrossRef]
- Chey, M.-H.; Chase, J.G.; Mander, J.B.; Carr, A.J. Innovative seismic retrofitting strategy of added stories isolation system. Front. Struct. Civ. Eng. 2013, 7, 13–23. [Google Scholar] [CrossRef]
- Wang, W.S.; Zhang, Y.M.; Wang, W.R. Optimal allocation and seismic isolation effect analysis of high-damping rubber bearing for Beam Bridge. In Proceedings of the 2017 2nd International Conference on Machinery, Electronics and Control Simulation (MECS 2017), Taiyuan, China, 24–25 June 2017; pp. 18–22. [Google Scholar]
- An, G.; Kim, M.; Jung, J.W.; Mosqueda, G.; Marquez, J.F. Evaluation of Clearance to Stop Requirements in A Seismically Isolated Nuclear Power Plant. Energies 2020, 13, 6156. [Google Scholar] [CrossRef]
- Kalfas, K.N.; Amirabad, N.G.; Forcellini, D. The role of shear modulus on the mechanical behavior of elastomeric bearings when subjected to combined axial and shear loads. Eng. Struct. 2021, 248, 113248. [Google Scholar] [CrossRef]
- Zhang, J.C.; Ding, Y.; Guan, X.C. Study of the mechanics of progressive collapse of FPB isolated beam-pier substructures. Front. Struct. Civ. Eng. 2022, 16, 718–728. [Google Scholar] [CrossRef]
- Yang, Z.; Lei, Y.; Deng, X.; Yu, Y.; Li, Q. Design and analysis of a RC frame structure with friction pendulum isolation bearings. Build. Struct. 2021, 51, 1–7. [Google Scholar] [CrossRef]
- Gao, J.; Xue, Y.; Xiao, C.; Zhou, X.; Han, X. Experimental study on variable stiffness laminated rubber isolation bearing of series connection type. Build. Struct. 2020, 50, 109–113. [Google Scholar] [CrossRef]
- Du, H.; Zhu, Y.; Lu, W.; He, Y. Experimental study and analysis on vertical ultimate properties of thick lead-rubber bearings. J. Earthq. Eng. Eng. Vib. 2022, 42, 153–162. [Google Scholar] [CrossRef]
- Gu, Z.; Lei, Y.; Qian, W.; Xiang, Z.; Hao, F.; Wang, Y. An Experimental Study on the Mechanical Properties of a High Damping Rubber Bearing with Low Shape Factor. Appl. Sci. 2021, 11, 59. [Google Scholar] [CrossRef]
- Shinozuka, M.; Chaudhuri, S.R.; Mishra, S.K. Shape-Memory-Alloy supplemented Lead Rubber Bearing (SMA-LRB) for seismic isolation. Probabilistic Eng. Mech. 2015, 41, 34–45. [Google Scholar] [CrossRef]
- Shandilya, S.; Izonin, I.; Shandilya, S.K.; Singh, K.K. Mathematical modelling of bio-inspired frog leap optimization algorithm for transmission expansion planning. Mathematical Biosci. Eng. 2022, 19, 7232–7247. [Google Scholar] [CrossRef]
- Pourzeynali, S.; Zarif, M. Multi-objective optimization of seismically isolated high-rise building structures using genetic algorithms. J. Sound Vib. 2008, 311, 1141–1160. [Google Scholar] [CrossRef]
- Yasue, M.; Kobayashi, K.; Tamori, S. Multi-objective optimal design of base isolated device in base-isolated structure Method by multi-objective genetic algorithm. J. Struct. Constr. Eng. (Trans. AIJ) 2010, 75, 1645–1652. [Google Scholar] [CrossRef]
- Fan, J.; Long, X.H.; Zhang, Y.P. Optimum design of lead-rubber bearing system with uncertainty parameters. Struct. Eng. Mechanics 2015, 56, 959–982. [Google Scholar] [CrossRef]
- Ocak, A.; Nigdeli, S.M.; Bekdaş, G.; Kim, S.; Geem, Z.W. Optimization of Seismic Base Isolation System Using Adaptive Harmony Search Algorithm. Sustainability 2022, 14, 7456. [Google Scholar] [CrossRef]
- Dang, Y.; Zhao, G.; Tian, H.; Li, G. Two-Stage Optimization Method for the Bearing Layout of Isolated Structure. Adv. Civ. Eng. 2021, 2021, 1–10. [Google Scholar] [CrossRef]
- Shiravand, M.R.; Ketabdari, H.; Rasouli, M. Optimum arrangement investigation of LRB and FPS isolators for seismic response control in irregular buildings. Structures 2022, 39, 1031–1044. [Google Scholar] [CrossRef]
- Chang, C.M.; Shia, S.; Yang, C.Y. Use of active control algorithm for optimal design of base-isolated buildings against earthquakes. Struct. Multidiscip. Optim. 2018, 58, 613–626. [Google Scholar] [CrossRef]
- Zhang, Y.; Weng, G.; Dai, J.; Shi, Y.; Zhu, X.; Lv, G. Isolation Effect and Optimal Allocation for High-damping Rubber Bearing on Beam Bridges. J. Catastrophology 2019, 34, 16–20. [Google Scholar] [CrossRef]
- Mousazadeh, M.; Pourreza, F.; Basim, M.C.; Chenaghlou, M.R. An efficient approach for LCC-based optimum design of lead-rubber base isolation system via FFD and analysis of variance (ANOVA). Bull. Earthq. Eng. 2020, 18, 1805–1827. [Google Scholar] [CrossRef]
- Singh, A.; Singh, K.K.; Greguš, M.; Izonin, I. CNGOD-An improved convolution neural network with grasshopper optimization for detection of COVID-19. Mathematical Biosci. Eng. 2022, 19, 12518–12531. [Google Scholar] [CrossRef]
- Wang, H.; Liao, J.; Cheng, T.; Gao, Z.; Liu, H.; Ren, B.; Liu, W. Knowledge Mining with Scene Text for Fine-Grained Recognition. In Proceedings of the IEEE/CVF Conference on Computer Vision and Pattern Recognition (CVPR) 2022, New Orleans, LA, USA, 19–24 June 2022. [Google Scholar]
- Billie, F.S.; Vedhus, H.; Yasutaka, N. Advances in Computer Vision-Based Civil Infrastructure Inspection and Monitoring. Engineering 2019, 5, 199–222. [Google Scholar] [CrossRef]
- Lu, X.Z.; Liao, W.J.; Zhang, Y.; Huang, Y.L. Intelligent structural design of shear wall residence using physics-enhanced generative adversarial networks. Earthq. Eng. Struct. Dyn. 2022, 51, 1657–1676. [Google Scholar] [CrossRef]
- Rawashdeh, M.A.; Yousef, I.; Nawaiseh, M.A. Predicting the Inelastic Response of Base Isolated Structures Utilizing Regression Analysis and Artificial Neural Network. Civ. Eng. J. 2022, 8, 1178–1193. [Google Scholar] [CrossRef]
- Nguyen, H.D.; Dao, N.D.; Shin, M. Machine learning-based prediction for maximum displacement of seismic isolation systems. J. Build. Eng. 2022, 51, 104251. [Google Scholar] [CrossRef]
- Bülbül, M.A.; Harirchian, E.; Işık, M.F.; Aghakouchaki Hosseini, S.E.; Işık, E. A Hybrid ANN-GA Model for an Automated Rapid Vulnerability Assessment of Existing RC Buildings. Appl. Sci. 2022, 12, 5138. [Google Scholar] [CrossRef]
- Harirchian, E.; Kumari, V.; Jadhav, K.; Rasulzade, S.; Lahmer, T.; Raj Das, R. A Synthesized Study Based on Machine Learning Approaches for Rapid Classifying Earthquake Damage Grades to RC Buildings. Appl. Sci. 2021, 11, 7540. [Google Scholar] [CrossRef]
- Wang, H.; Li, Q.; Liu, Y.; Yang, S. Anomaly Data Detection of Rolling Element Bearings Vibration Signal Based on Parameter Optimization Isolation Forest. Machines 2022, 10, 459. [Google Scholar] [CrossRef]
- Quaranta, G.; De Domenico, D.; Monti, G. Machine-learning-aided improvement of mechanics-based code-conforming shear capacity equation for RC elements with stirrups. Eng. Struct. 2022, 267, 114665. [Google Scholar] [CrossRef]
- Mangalathu, S.; Karthikeyan, K.; Feng, D.C.; Jeon, J.S. Machine-learning interpretability techniques for seismic performance assessment of infrastructure systems. Eng. Struct. 2022, 250, 112883. [Google Scholar] [CrossRef]
- Naruei, I.; Keynia, F.; Sabbagh, M.A. Hunter-prey optimization: Algorithm and applications. Soft Comput. 2022, 26, 1279–1314. [Google Scholar] [CrossRef]
- Ministry of Housing and Urban Rural Development of the People’s Republic of China. GB/T 51408-2021; Standard for Seismic Isolation Design of Building. China Planning Press: Beijing, China, 2021. (In Chinese)
- EN1998-1:2004; Eurocode 8: Design of Structures for Earthquake Resistance. European Committee for Standardization: Berlin, Germany, 2004.
- AASHTO. Guide Specifications for Seismic Isolation Design, 4th ed.; American Association of State Highway and Transportation Officials: Washington, DC, USA, 2014. [Google Scholar]
- IBC. 2021 International Building Code; International Code Council, Inc.: Falls Church, VA, USA, 2021. [Google Scholar]
- Sun, Y.N.; Xue, B.; Zhang, M.J.; Yen, G.G. Evolving Deep Convolutional Neural Networks for Image Classification. IEEE Trans. Evol. Comput. 2020, 24, 394–407. [Google Scholar] [CrossRef]
- Ministry of Housing and Urban Rural Development of the People’s Republic of China. Code for Seismic Design of Buildings: (Version 2016); China Architecture & Building Press: Beijing, China, 2016. (In Chinese)
Publisher’s Note: MDPI stays neutral with regard to jurisdictional claims in published maps and institutional affiliations. |
© 2022 by the authors. Licensee MDPI, Basel, Switzerland. This article is an open access article distributed under the terms and conditions of the Creative Commons Attribution (CC BY) license (https://creativecommons.org/licenses/by/4.0/).