Article

Numerical Optimization of the EGR Rate and Injection Timing with a Novel Cavitation Model in a Diesel Engine Fueled with PODE/Diesel Blends

School of Energy and Power Engineering, Xi’an Jiaotong University, Xi’an 710049, China
*
Author to whom correspondence should be addressed.
Appl. Sci. 2022, 12(24), 12556; https://doi.org/10.3390/app122412556
Submission received: 20 November 2022 / Revised: 3 December 2022 / Accepted: 5 December 2022 / Published: 7 December 2022
(This article belongs to the Section Energy Science and Technology)

Abstract

:
Polyoxymethylene dimethyl ether (PODE) is one of the most promising alternative fuels for diesel engines with a high cetane number, high oxygen content, and no C-C bonds. In this paper, a new spray model with a novel cavitation sub-model is adopted in order to create a numerical model suitable for engine simulation fueled with PODE/diesel blends. The effects of the blending ratio, injection timing, and EGR rate on the combustion and emission characteristics are investigated by the simulation. The simulation results show that the self-restoring oxygen properties of PODE can efficiently improve the combustion, causing a higher in-cylinder temperature, and therefore, higher NOx emissions. Additionally, with the increase in the blending ratio, the increase in the oxidation activity of PODE/diesel blends and the improvement of atomization are conducive to reducing soot emissions. Then, the injection timing and EGR rate are optimized. The numerical results suggest that the NOx emissions decrease initially and then increase; however, soot emissions decrease monotonically with the delay of the injection timing. When the volume blending ratio is 15%, the emission performance is best when the injection timing is between 710 °CA and 715 °CA. The increase in EGR rate can effectively reduce the in-cylinder temperature and control the NOx emissions, but the excessive EGR rate leads to higher soot emissions and a deteriorated combustion process. Therefore, an EGR rate in the range of 0.0 to 0.2 has a better comprehensive emission performance from the perspective of controlling both the NOx and soot emissions.

1. Introduction

In the foreseeable future, internal combustion engine vehicles will still play an important role in long-distance transportation, but internal combustion engine technology faces more stringent emissions regulations [1,2]. Some investigations have proved that adding some small-molecule oxygenated fuels into diesel can significantly reduce the CO, HC, and soot emissions, and even avoid the soot-NOx trade-off in the diesel engine combustion process [3]. In order to reduce the harmful emissions of diesel engines, alternative fuels, such as methanol, ethanol, biodiesel, dimethyl ether (DME), and polyoxymethylene dimethyl ether (PODE), have attracted more and more attention [4,5,6,7].
Polyoxymethylene dimethyl ether (PODE) is one of the most promising small molecule oxygenated fuels that can be made from methanol [8,9], which is abundant and inexpensive. Its molecular formula is CH3O-(CH2O)n-CH3, and the composition distribution of PODE obtained by different production technologies is slightly different, with n values typically ranging from 3 to 8 and 3 to 5 predominating. Table 1 shows the physical properties of several components of PODE [10], with their common characteristics being high cetane number and oxygen content, no sulfur, no aromatic hydrocarbons, and the ability to be miscible with diesel fuel [11,12], which are physically suitable for use in diesel engines alone or blended with diesel without major changes to the diesel engine [10].
After extensive experimental studies, the potential of PODE to improve engine performance and emissions has been well documented. Pellegrini et al. [13,14] conducted combustion visualization tests based on different PODE/diesel blends in a single-cylinder optical engine and found that particulate matter (PM) emissions were reduced by 40% when 12.5% PODE3-5/diesel was blended directly in an unmodified engine. The experimental results revealed that PODE can improve the combustion quality and reduce the soot emission due to its oxygen content. Lumpp et al. [15] also found from engine tests that the absence of C-C bonds in PODE leads to a significant reduction in particle emissions from PODE/diesel blends compared with diesel. In addition, blended fuels can shorten the combustion duration, increase the maximum in-cylinder pressure, and improve the brake thermal efficiency (BTE) [16,17].
Although PODE can improve engine combustion, this does not necessarily imply that a larger blending ratio is preferable. The power performance of a diesel engine will be affected by blends with a high PODE content [17], and as the blending ratio rises, so does the break-specific fuel consumption [18]. Furthermore, numerous studies have demonstrated that the addition of PODE dramatically enhanced the NOx emissions of diesel engines [19,20]. Barro et al. [3,21] studied the combustion behavior of a pure PODE composed of about 80% PODE3 and 20% PODE4 on a heavy-duty single-cylinder engine and showed that the CO and HC emissions exhibited extreme peaks. The NOx emissions showed a strong dependence on the applied exhaust gas recirculation (EGR) rate, but when the stoichiometric conditions were approached by increasing the EGR rate, the engine thermal efficiency showed a decrease. Therefore, the combustion of pure PODE or a high ratio of blended fuel is of little significance to improve the fuel economy and emissions of the engine, and PODE has a better application prospect when blended with diesel at a low ratio.
EGR is a good way to achieve highly efficient and clean combustion [12]. Due to the absence of C-to-C bonds, PODE considerably reduces soot formation, allowing, in turn, significantly higher EGR rates to reduce NOx emissions [10], LeBlanc et al. [22] proved that blending PODE3 fuels with diesel is an effective technique to reduce soot emissions with minimal effect on NOx emissions. Moreover, neat PODE3 was capable of emitting low NOx and soot emissions with a lower EGR amount than those of PODE/diesel blends, mitigating the negative combustion implication of EGR at high levels. Experiments conducted on the influence of EGR rates on the combustion and emission characteristics of n-butanol/diesel/PODE3-4 blends showed that at an EGR rate below 30%, as the EGR rate grows, the effects on the emissions of soot, CO, and HC are not significant, while the emissions of NOx are sharply reduced; when the EGR rate is above 30%, as it grows, the emissions of soot, CO, and HC drastically rise. Therefore, the further exploration of the optimal EGR rate of the engine using PODE/diesel blends is of great significance to improve the engine performance.
At present, although there are many experimental investigations on the application of PODE in diesel engines, numerical investigations on the spray characteristics of PODE, the combustion process, and pollution generation mechanisms of engines are still relatively rare. In addition, the influence of the blended fuel properties on the spray model was ignored in the previous numerical studies on PODE. Therefore, in order to develop a numerical model applicable to PODE engines, this paper adopts a more accurate cavitation and spray model developed by authors [23]. This paper investigates the influence of the blend ratio of PODE, the EGR rate, and the injection strategy on the combustion and emissions characteristics. These results can provide an important reference value for developing and improving the PODE engine, and the numerical model can also be used in the further numerical simulation process of engine development.

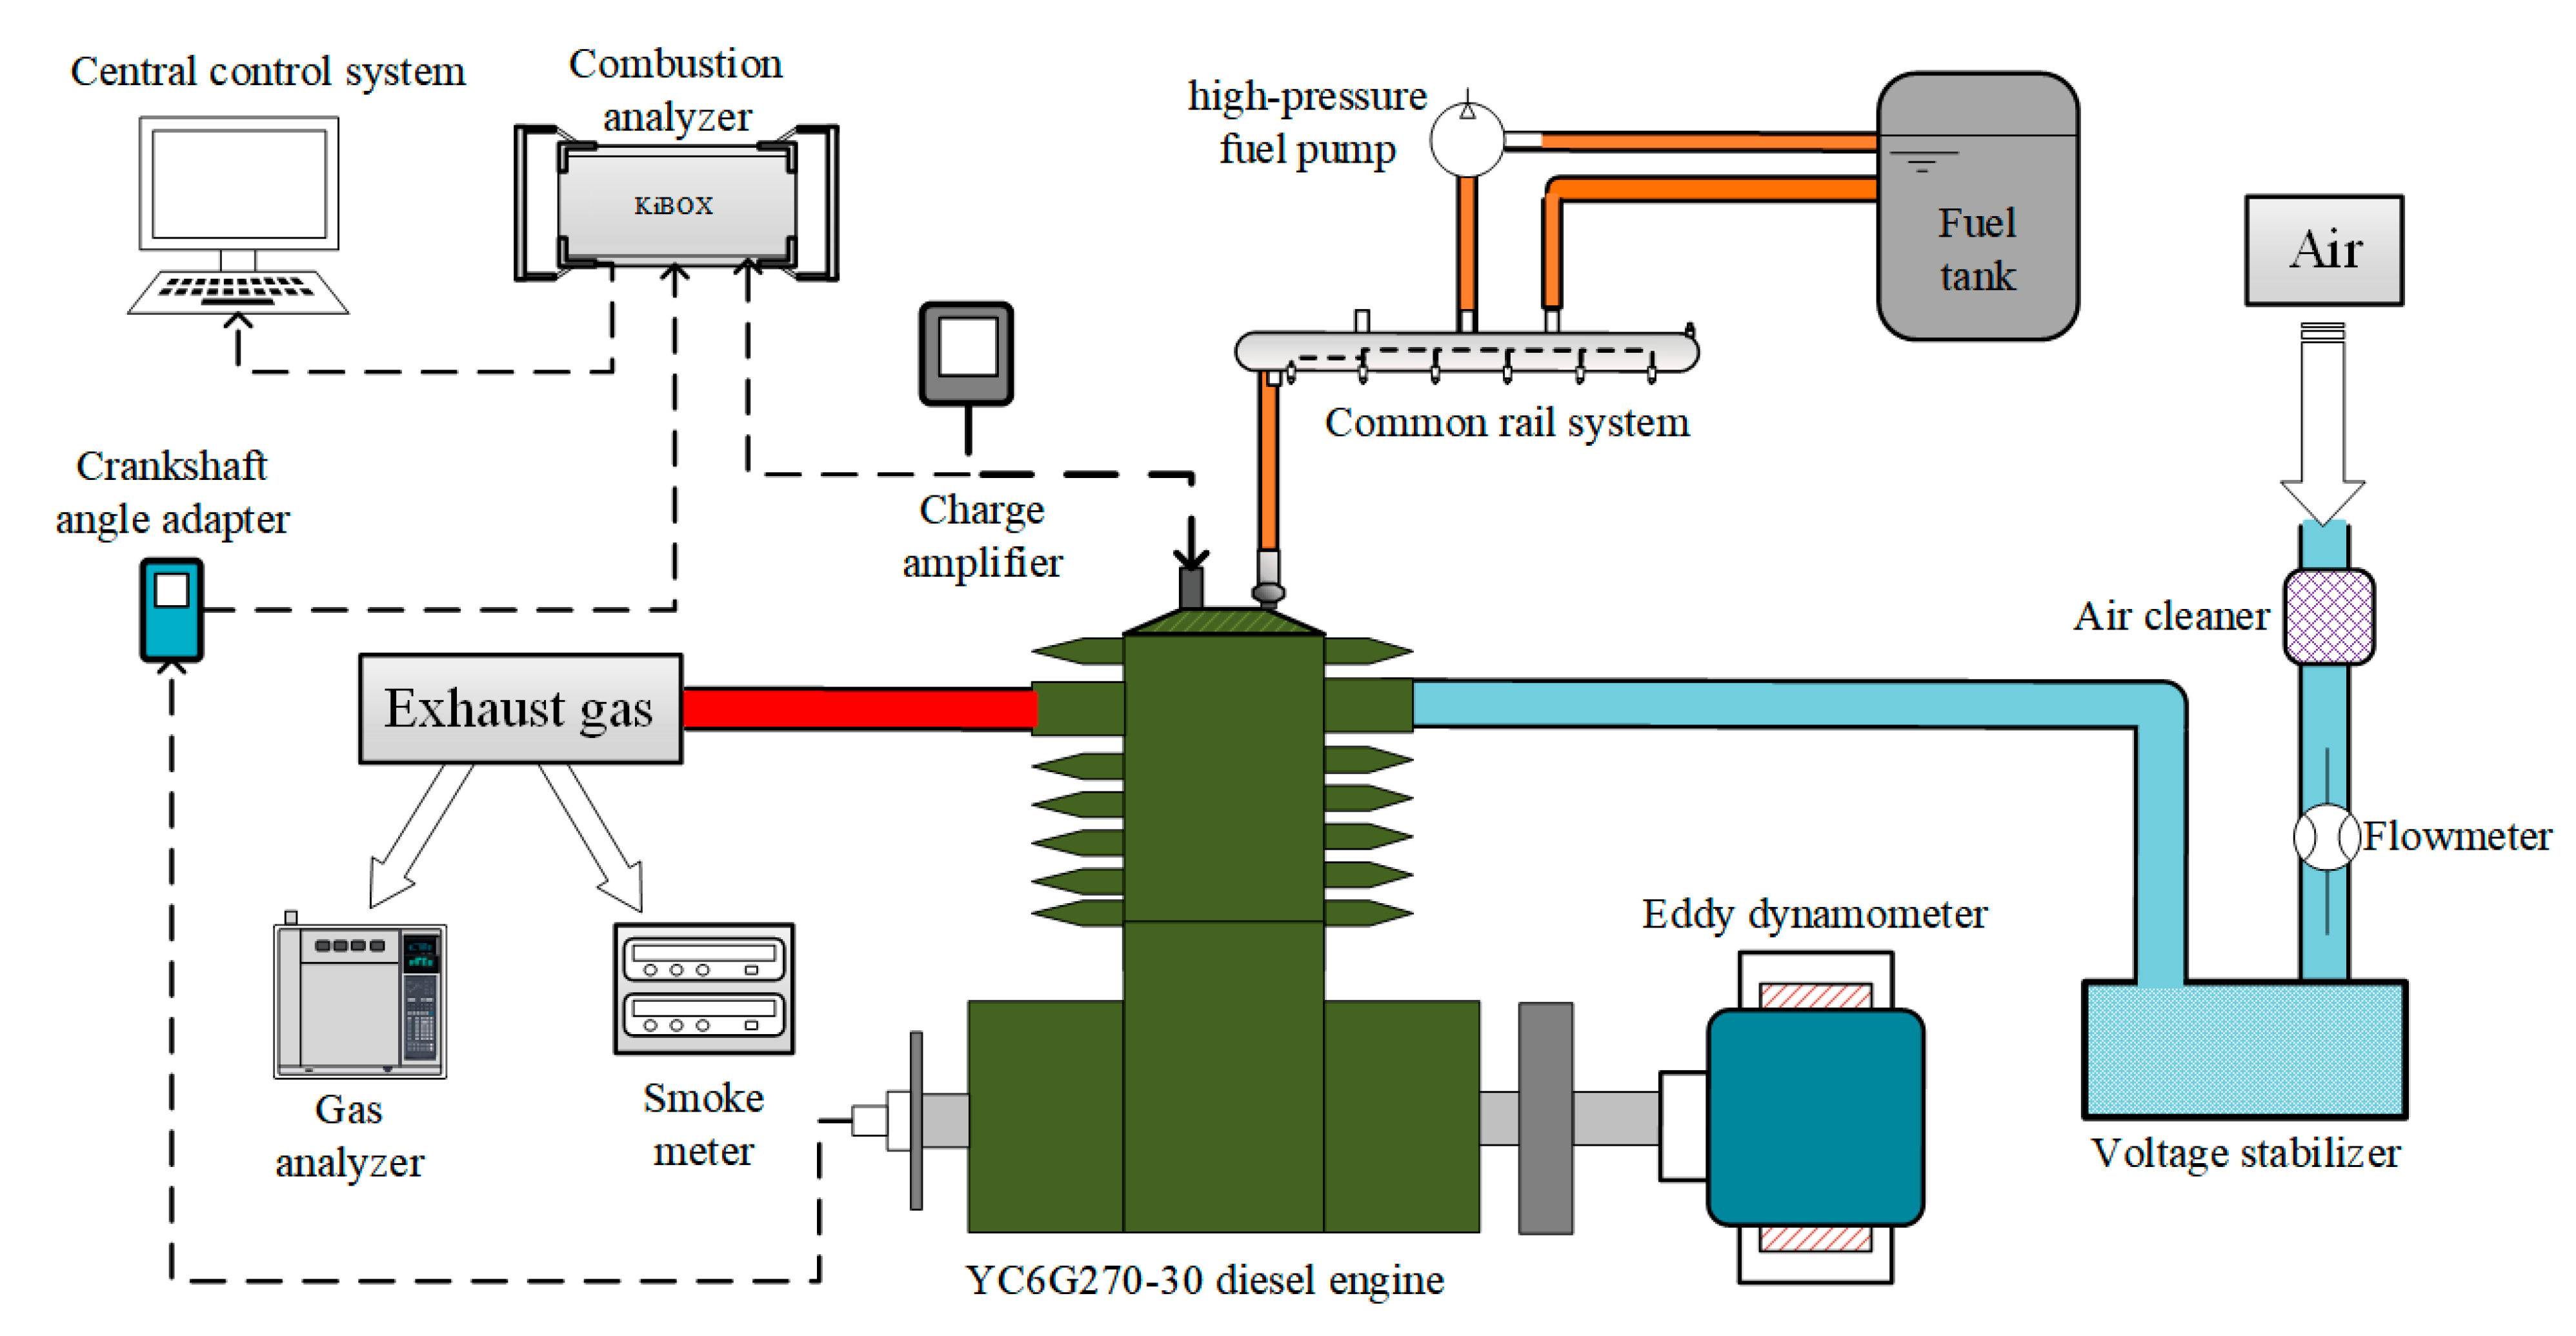
2. Experimental Setup and Methodology

The experiments were conducted in a six-cylinder inline engine with direct injection and a common rail injection system, the main specifications of which are shown in Table 2. The experiments were conducted under 1400 rpm and a BMEP of 0.15 MPa to 1.5 MPa. The PODE used in this paper was provided by Shandong Yuhuang Group; the mass ratio of PODE2, PODE3, and PODE4 was 2.553∶88.9∶8.48, respectively; the measured low calorific value was 19.6 MJ/kg. Properties of the three test fuels, P0 (PODE volume fraction: 0%), P10 (PODE volume fraction: 10%), and P15 (PODE volume fraction: 15%), are presented in Table 3. It can be observed that as the blending ratio increased, the density, surface tension, and cetane number of blends increased, while the viscosity and calorific value of blends decreased.
The experimental setup is shown in Figure 1. During the tests, the intake temperature after the intercooler and coolant temperatures was controlled at 50 ± 1 °C and 85 ± 2 °C, respectively. The fuel injection parameters were controlled by an electronic control unit (ECU) made by Bosch. The in-cylinder pressure was measured by a Piezoelectric pressure sensor (Kistler 6052A: Kistler, Winterthur, Switzerland) coupled with a charge amplifier (Kistler 5019: Kistler, Winterthur, Switzerland). The optical crank angle encoder (Kistler 2619: Kistler, Winterthur, Switzerland) was used to trigger the cylinder pressure data acquisition with a 0.5 degree crank angle (°CA) increment. The gaseous exhaust, including CO, CO2, HC, and NOx, was measured by an emission analyzer (HORIBA MEXA 7100DEGR: Horiba, Kyoto, Japan), and the torque was measured by an eddy current dynamometer (GW400: Hunan Xiangyi Laboratory Instrument Development Co., LTD, Changsha, China).
Furthermore, the AVL DiSmoke 4000 opaque smoke meter was utilized in the test to measure the emission of particulate matter. According to the Beer–Lambert law [24], the numerical transformation between the opacity O and the light absorption coefficient K can be calculated by the following formula (Equation (1)):
K = 1 L ln 1 O 100
where L represents the effective length of the optical channel, 0.430 mm; O is the impermeability (%).
In addition, there is a relationship between diesel PM emissions and opacity according to Equation (2).
P M = 0.18 O 2 + 5.57 O
where PM represents the mass concentration of particles (mg/m3). The correlation coefficient of this formula is 0.98, which is relatively accurate. Therefore, the particle emission equation can be calculated by the following formula (Equation (3)).
P M = 1800 1 e K L 2 + 557 1 e K L
As can be observed, there is a positive correlation between the particle mass concentration PM and the experimentally determined light absorption coefficient. The particle mass concentration variation process inside the entire calculation volume may be derived by dividing the soot mass inside the simulated calculation volume and the calculated volume of the combustion chamber.
In order to avoid the effect of the fuel switching on the test results, the fuel supply pipeline was cleaned with the fuel to be tested when switching fuels. After the diesel engine ran stably for 15 min, data such as the speed, torque, in-cylinder pressure, and exhaust emissions of the diesel engine when using different test fuels were tested and recorded. The in-cylinder pressure data were obtained by calculating the average value of the in-cylinder pressure data for 100 consecutive cycles. Based on the measured in-cylinder pressure data and the gas state equation, the heat release rate can be calculated.

3. Simulation Setup and Validation
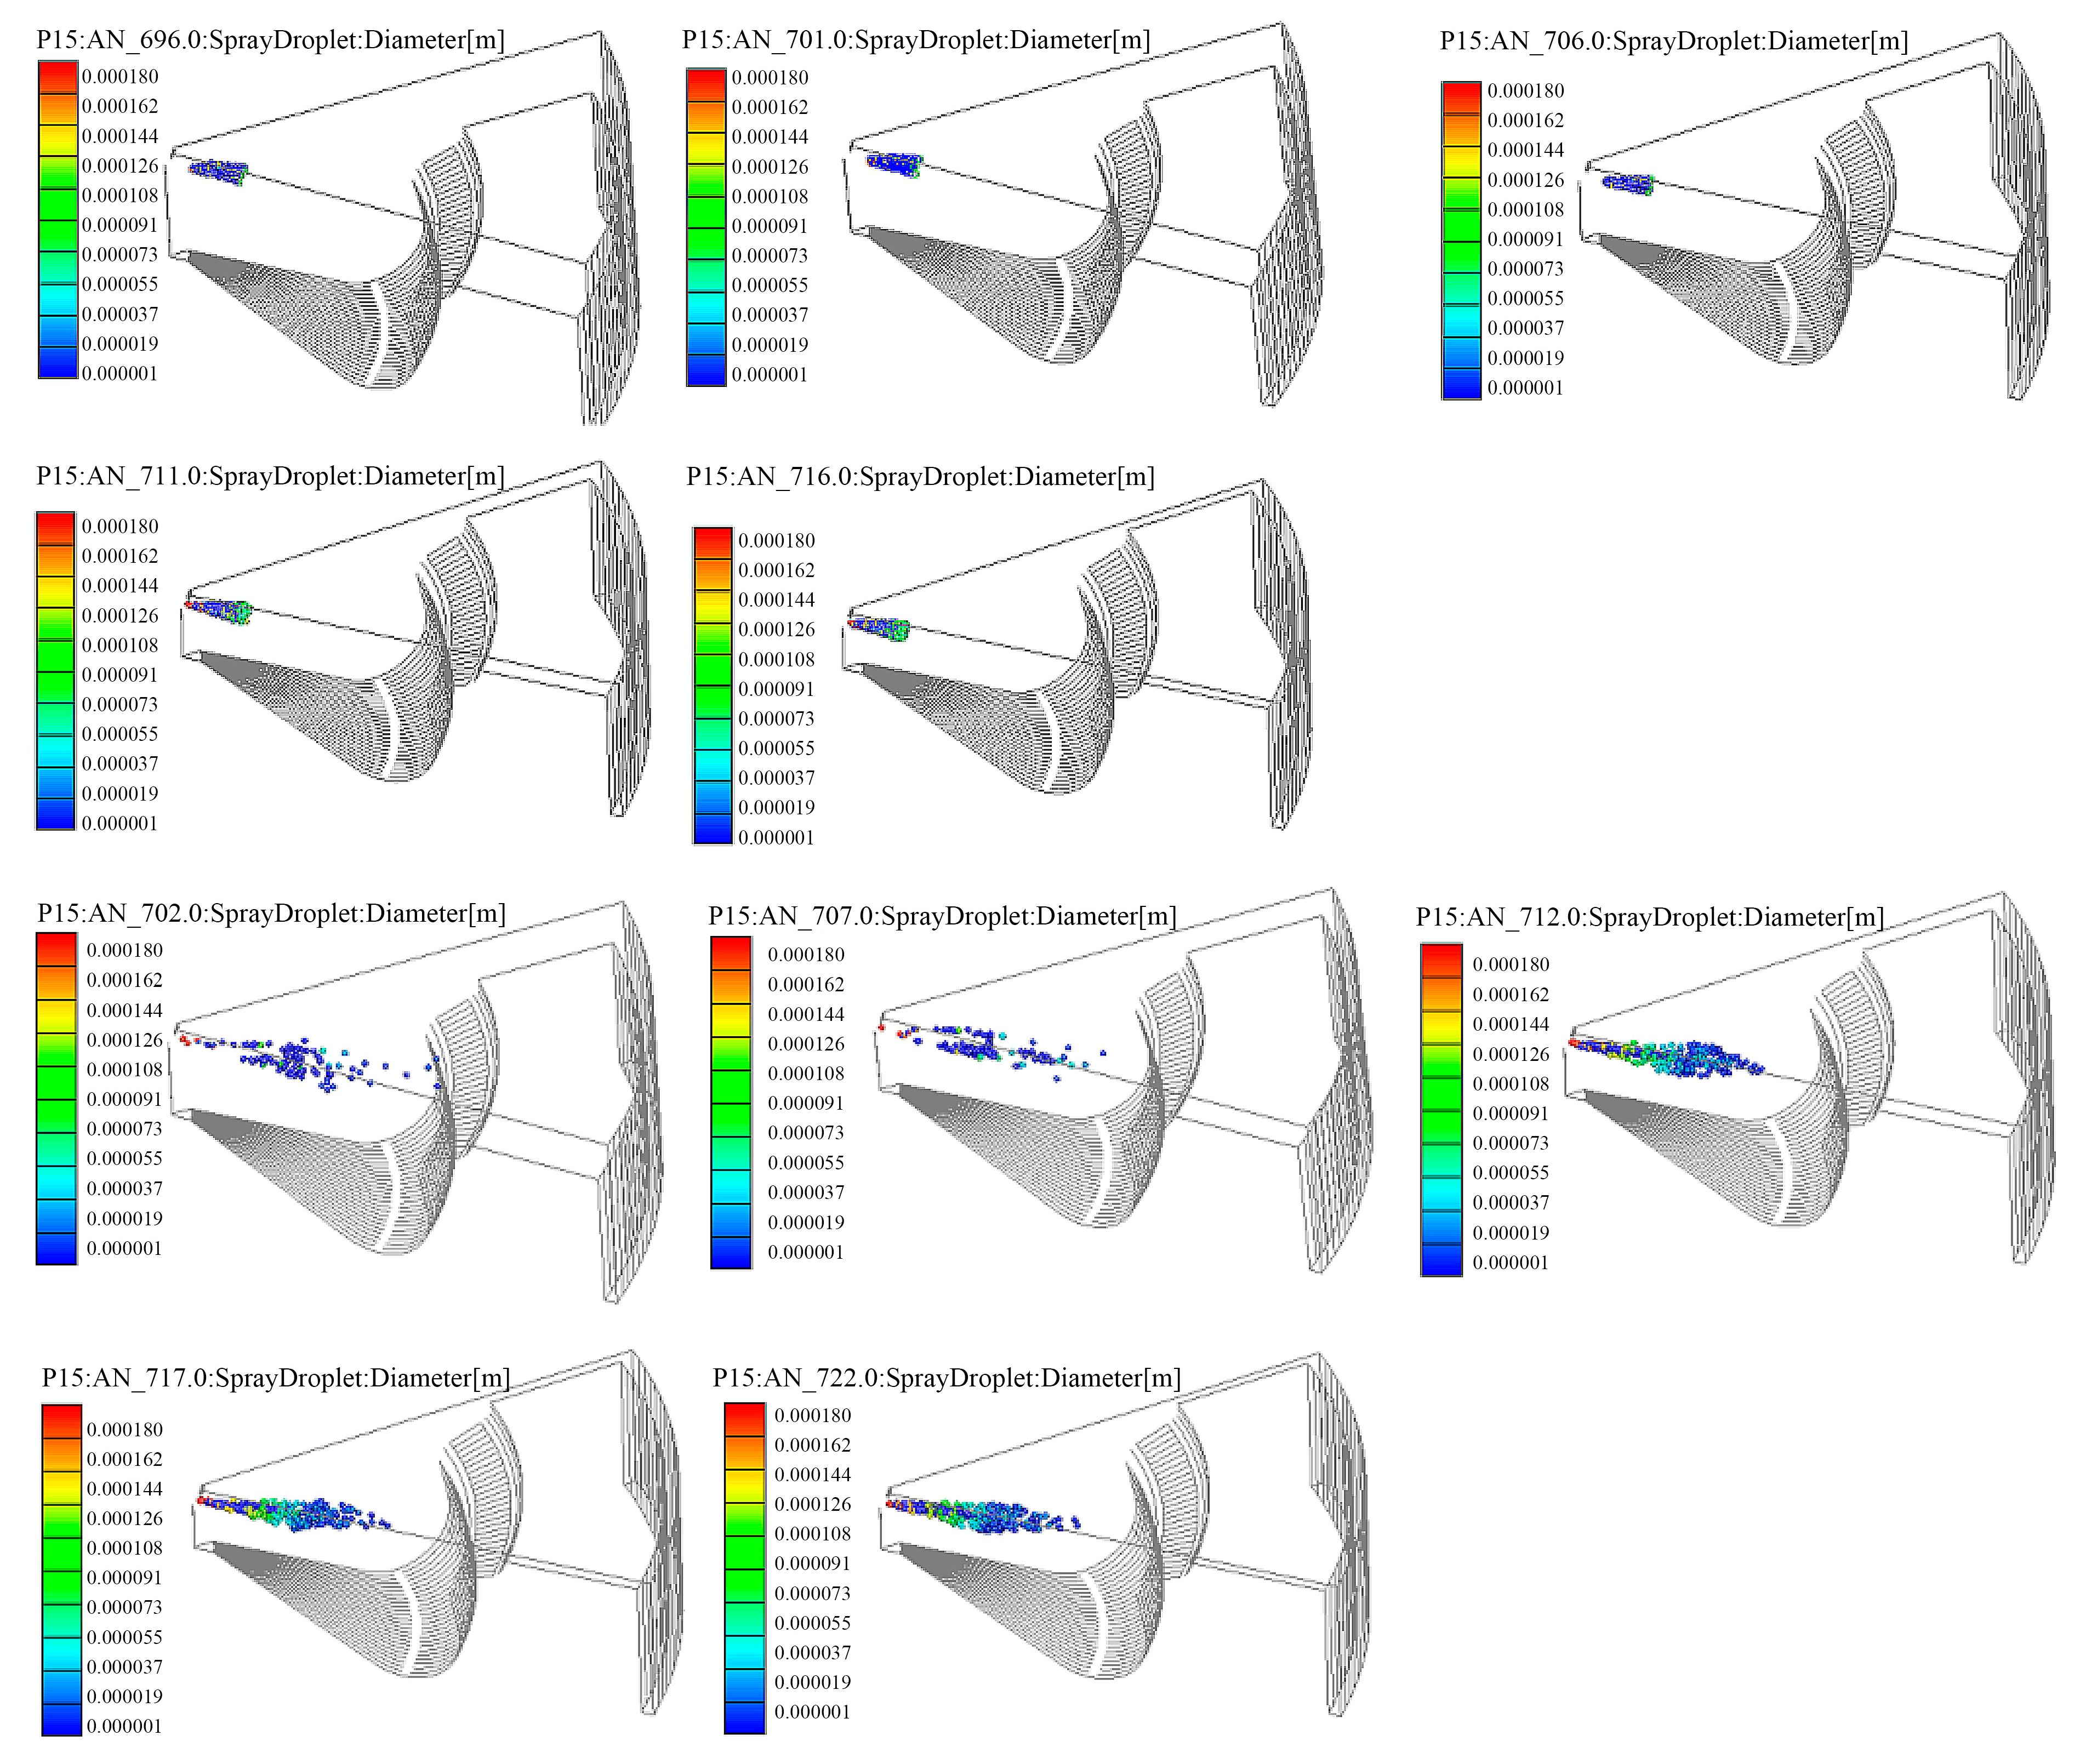
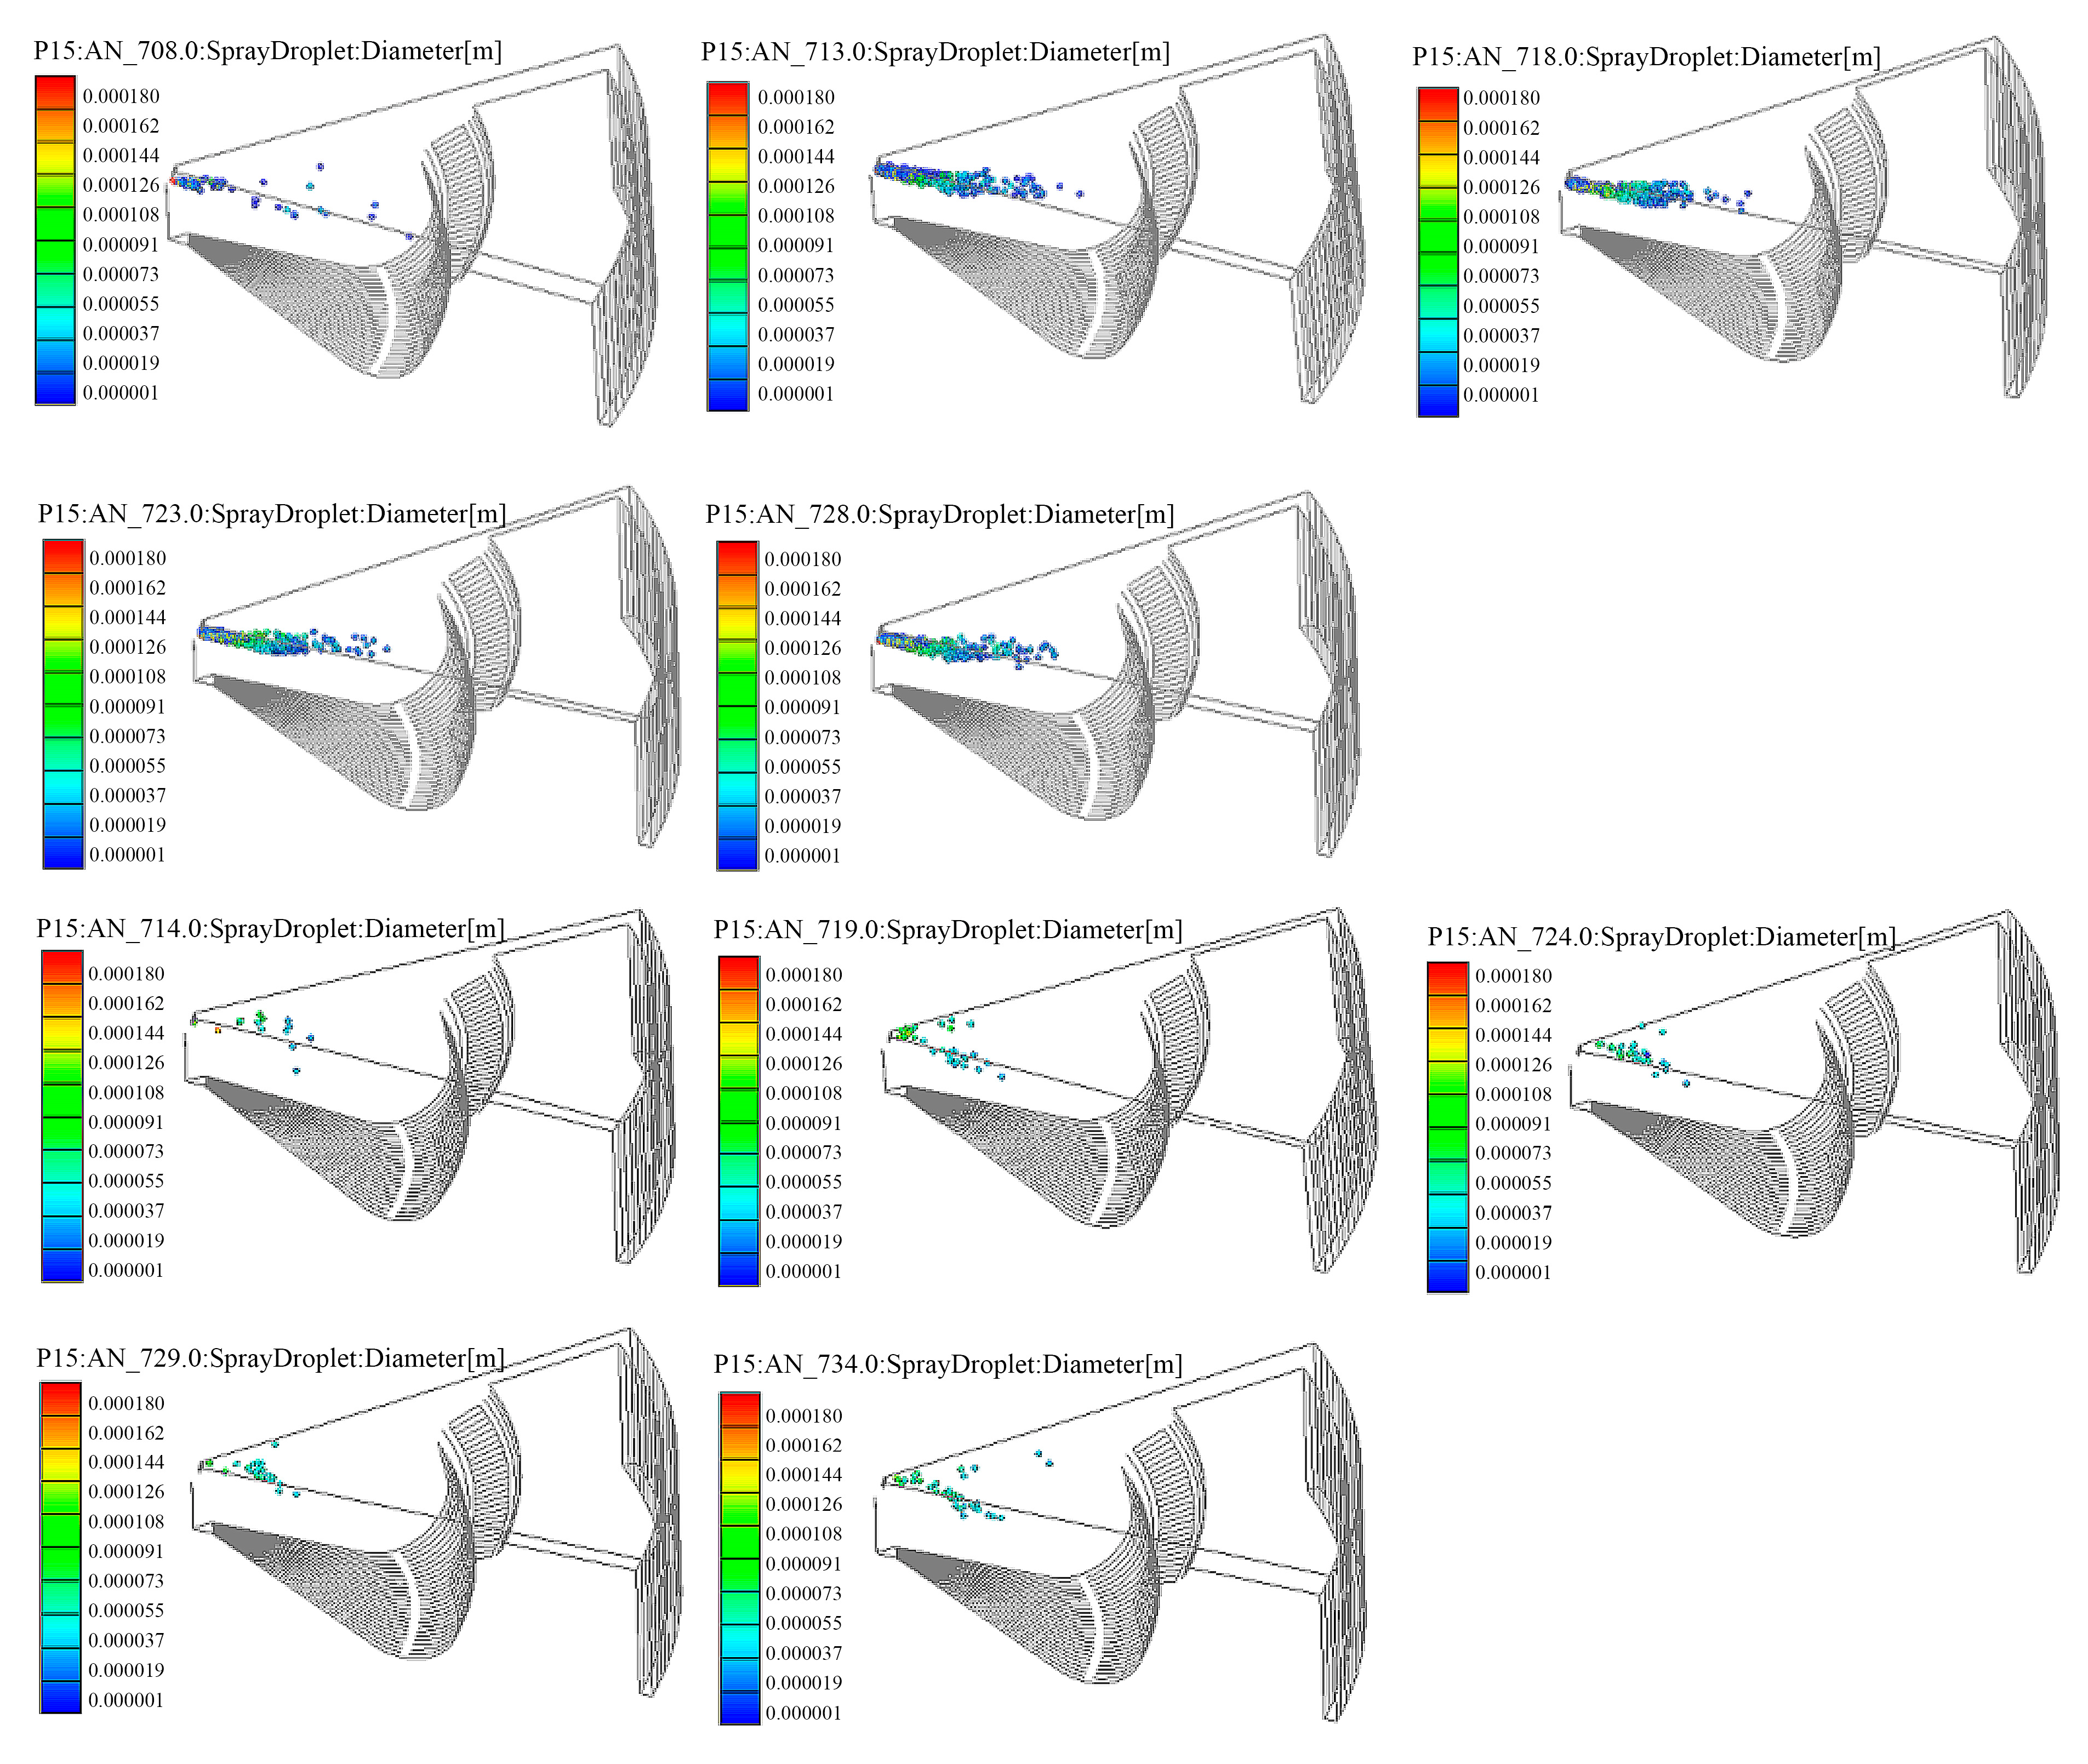
3.1. Spray Model

In this paper, the spray model with a novel cavitation sub-model considering the influence of the physical properties of blended fuel on the spray characteristics was adopted. The calculation accuracy in terms of spray shape and penetration distance was significantly increased, as well as the robustness and applicability of cavitation flow characteristics prediction.

3.1.1. Cavitation Sub-Model

In this paper, a new cavitation sub-model developed by authors [23] based on the homogeneous nucleation theory is adopted. Instead of regulating the relationship between bubble nucleation and gas phase volume fraction only by empirical parameters, a theoretical analysis of the causes of bubble nucleation and nucleation scale is carried out, and the effects of turbulence, mass transfer rate, equivalent bubble radius, differences in dissolved amounts of different gases, and temperature on nucleation are considered. The homogeneous nucleation theory is applied to the bubble nucleation process, where the bubble nucleation scale within each cell is presented in terms of nucleation probability; thus, the bubble nucleation phenomenon becomes a specific process related to surface tension, temperature, and pressure. The new model also subdivides the dissolved gases into different types, and each type of gas is considered and calculated separately according to its contribution to the partial pressure inside the bubble. For each gas dissolved in the test, the overall partial pressures of dissolved gases are calculated based on Henry’s law and the partial pressure law and then added to obtain them. In addition, the model also introduces the concept of equivalent bubble radius, which is calculated by combining experimental data to characterize the size of bubbles in the working mass. This method is helpful to make the numerical model close to the actual situation. Compared with the previous empirical model, the new model has better accuracy, robustness, and applicability for cavitation flow characteristics prediction.
The internal flow simulation of the nozzle of PODE/diesel blends is carried out for the injector in order to apply the cavitation and primary crushing model to the engine combustion process. The injector used for the engine test is a CRIN-138 injector from the BOCSH electronically controlled high-pressure common rail system. It has eight injector nozzle holes with a 0.18 mm diameter and a 75° inclination at the center. Experiments using 0# diesel and P10, P15 are applicable to the current CFD calculation framework because solubility, saturation vapor pressure, and other characteristics of PODE/diesel blends are very similar to those of diesel. The simulation process of blended fuel is set unitedly by the physical and chemical properties measured by the test to simplify the calculation. The calculation grid, which is shown in Figure 2, is a dynamic grid that is used for the simulation from the beginning of the fuel injection to the end. The fuel injection mass of each single-hole injection is calculated based on the engine’s consumption of fuel per cycle at 1400 rpm, while the needle valve movement law is set based on the injector needle valve lift law and the injection rate curve. The total mass obtained by adjusting the injection pulse width is equal to that of the single-hole injection calculated based on the mass of fuel consumed per cycle, so the transient mass flow rate at the nozzle is calculated. Additionally, the back pressure condition for the nozzle flow will be determined by the pressure in the engine cylinder during fuel injection.
The temperature of the injected fuel rises along with the high ambient temperature surrounding the engine and the high return fuel temperature. As a result, the spray simulation for the engine differs from the cold spray simulation, the model’s fuel temperature is set at 57 °C, and the fuel density and the saturated vapor pressure adjust in line with the temperature change. The needle valve lift is around 0.4 mm, and the common rail’s rail pressure is 109 MPa. In addition, the real engine combustion process simulation is used to improve the model accuracy of the internal flow characteristics of the nozzle at the nozzle outlet, including nozzle unit position, area, gas–liquid phase velocity distribution, temperature, turbulent kinetic energy, and turbulent dissipation rate.

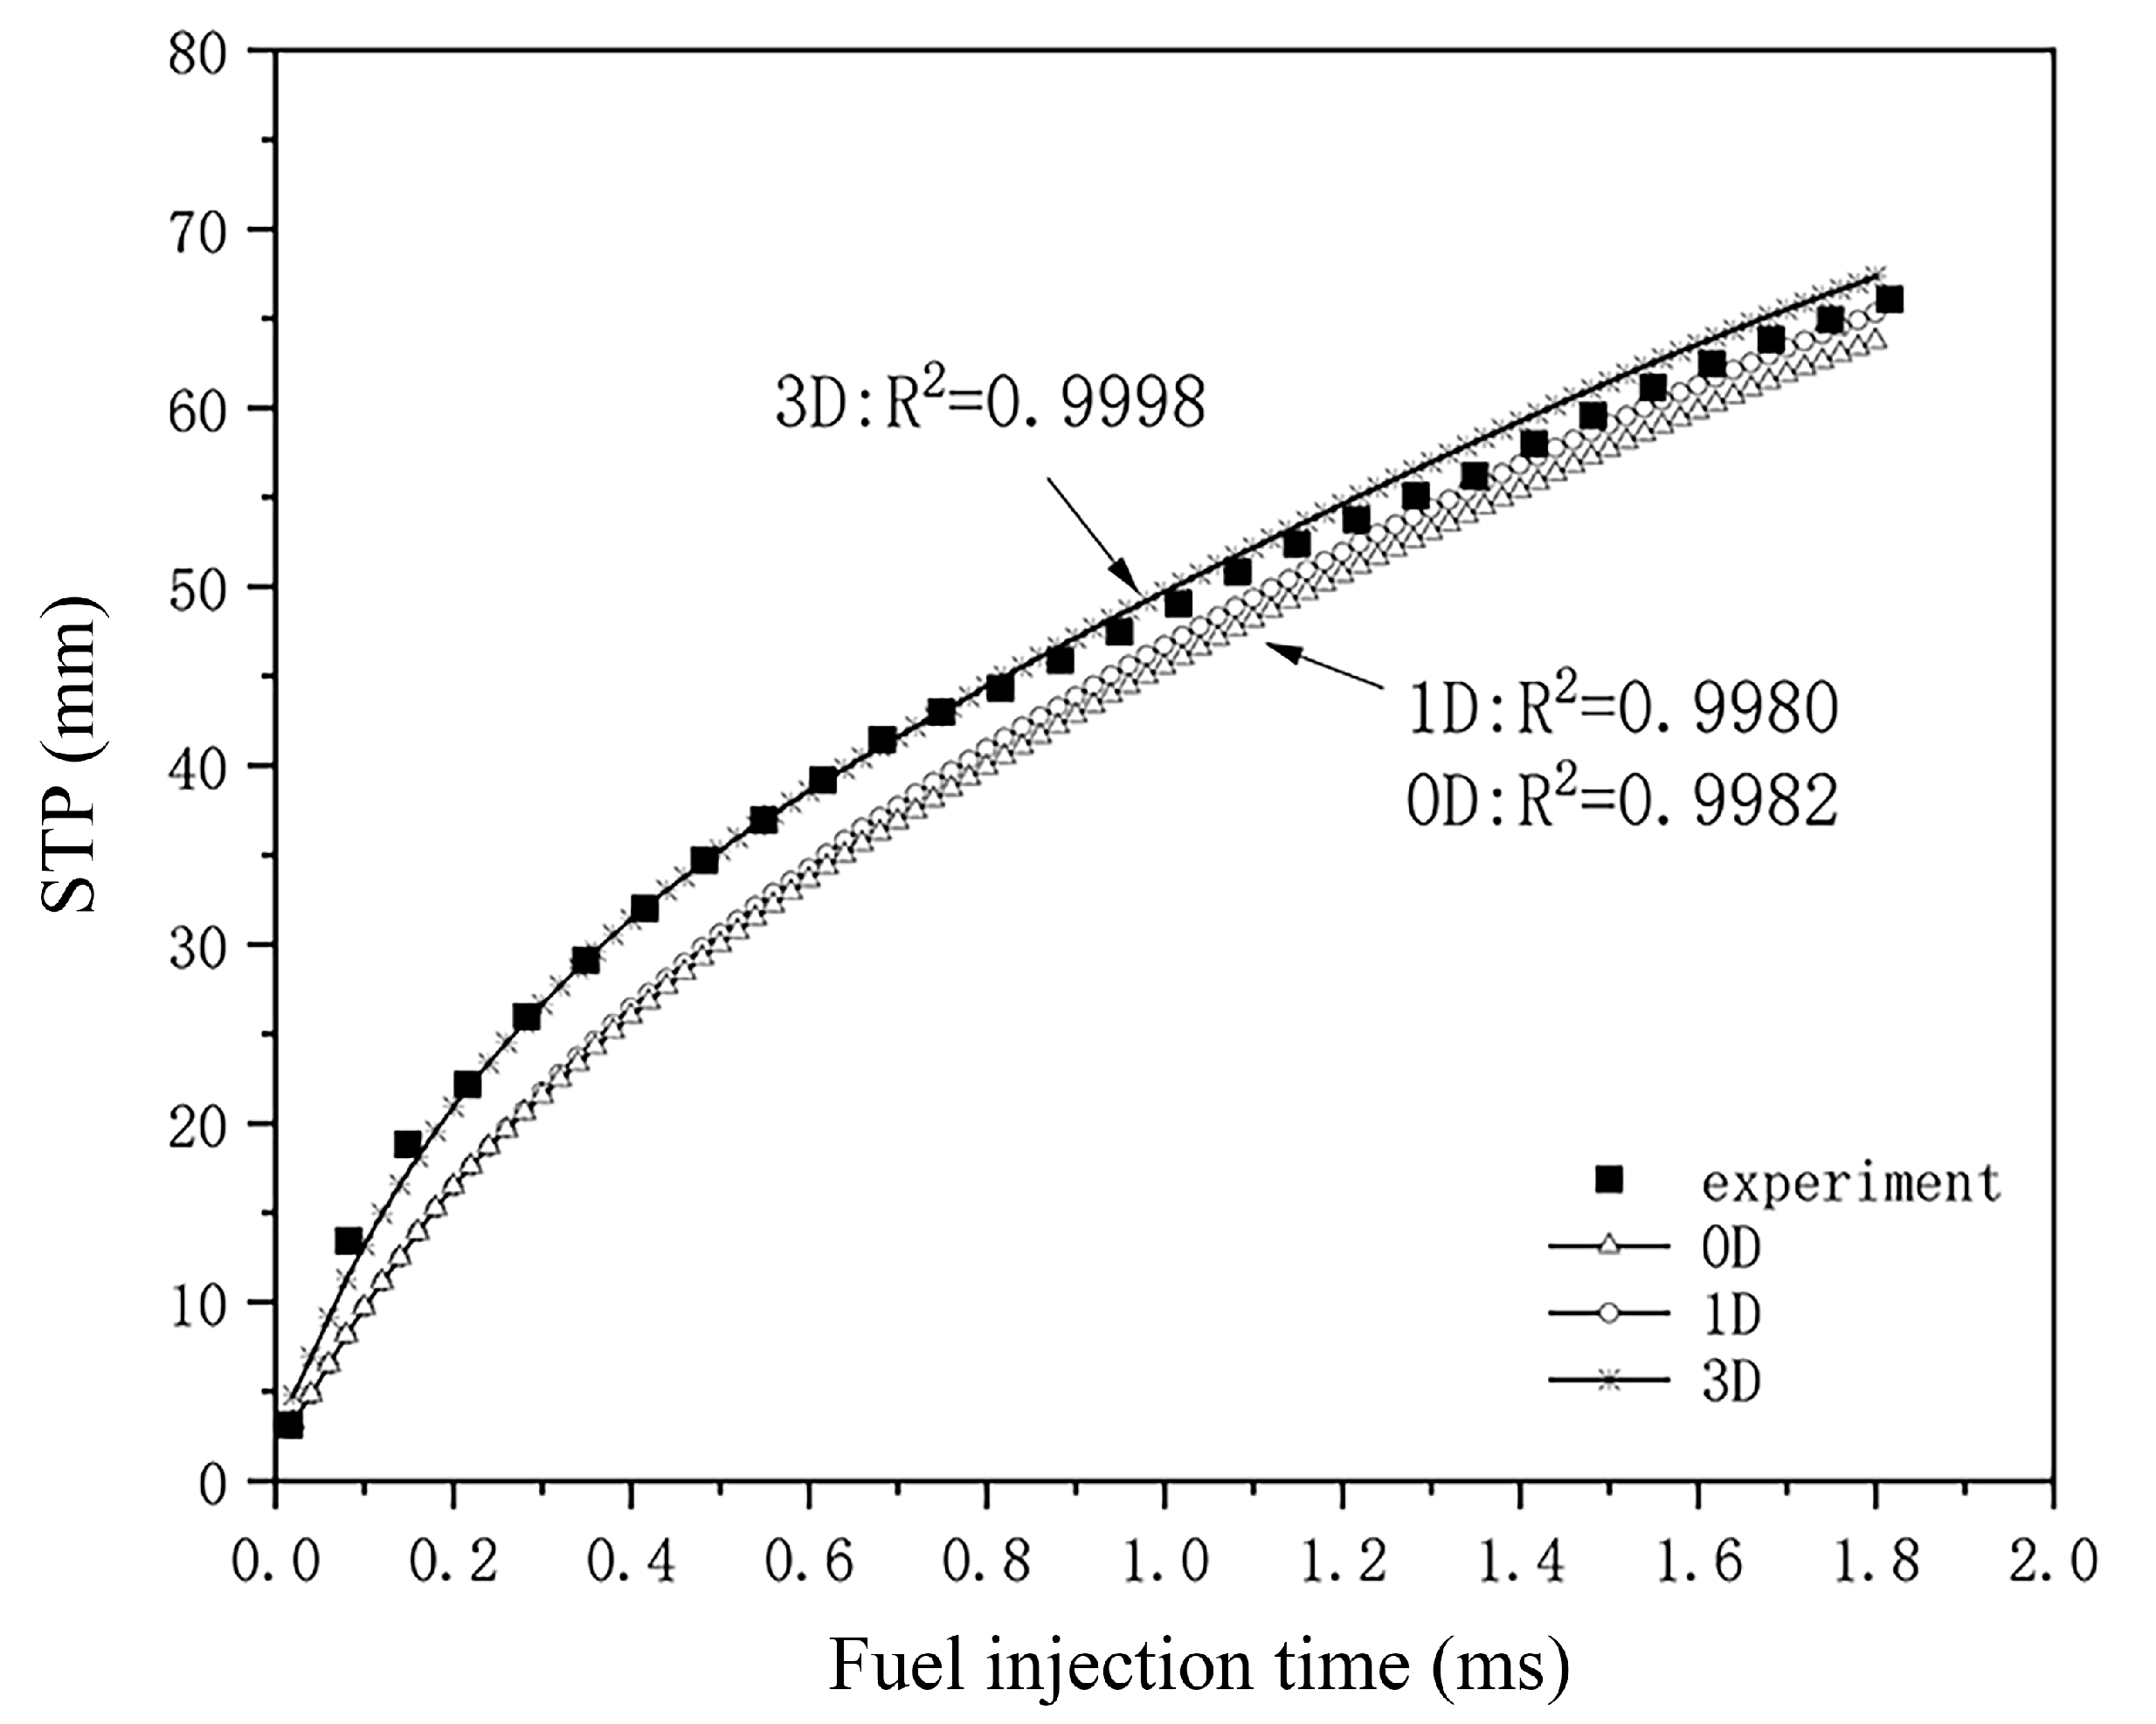
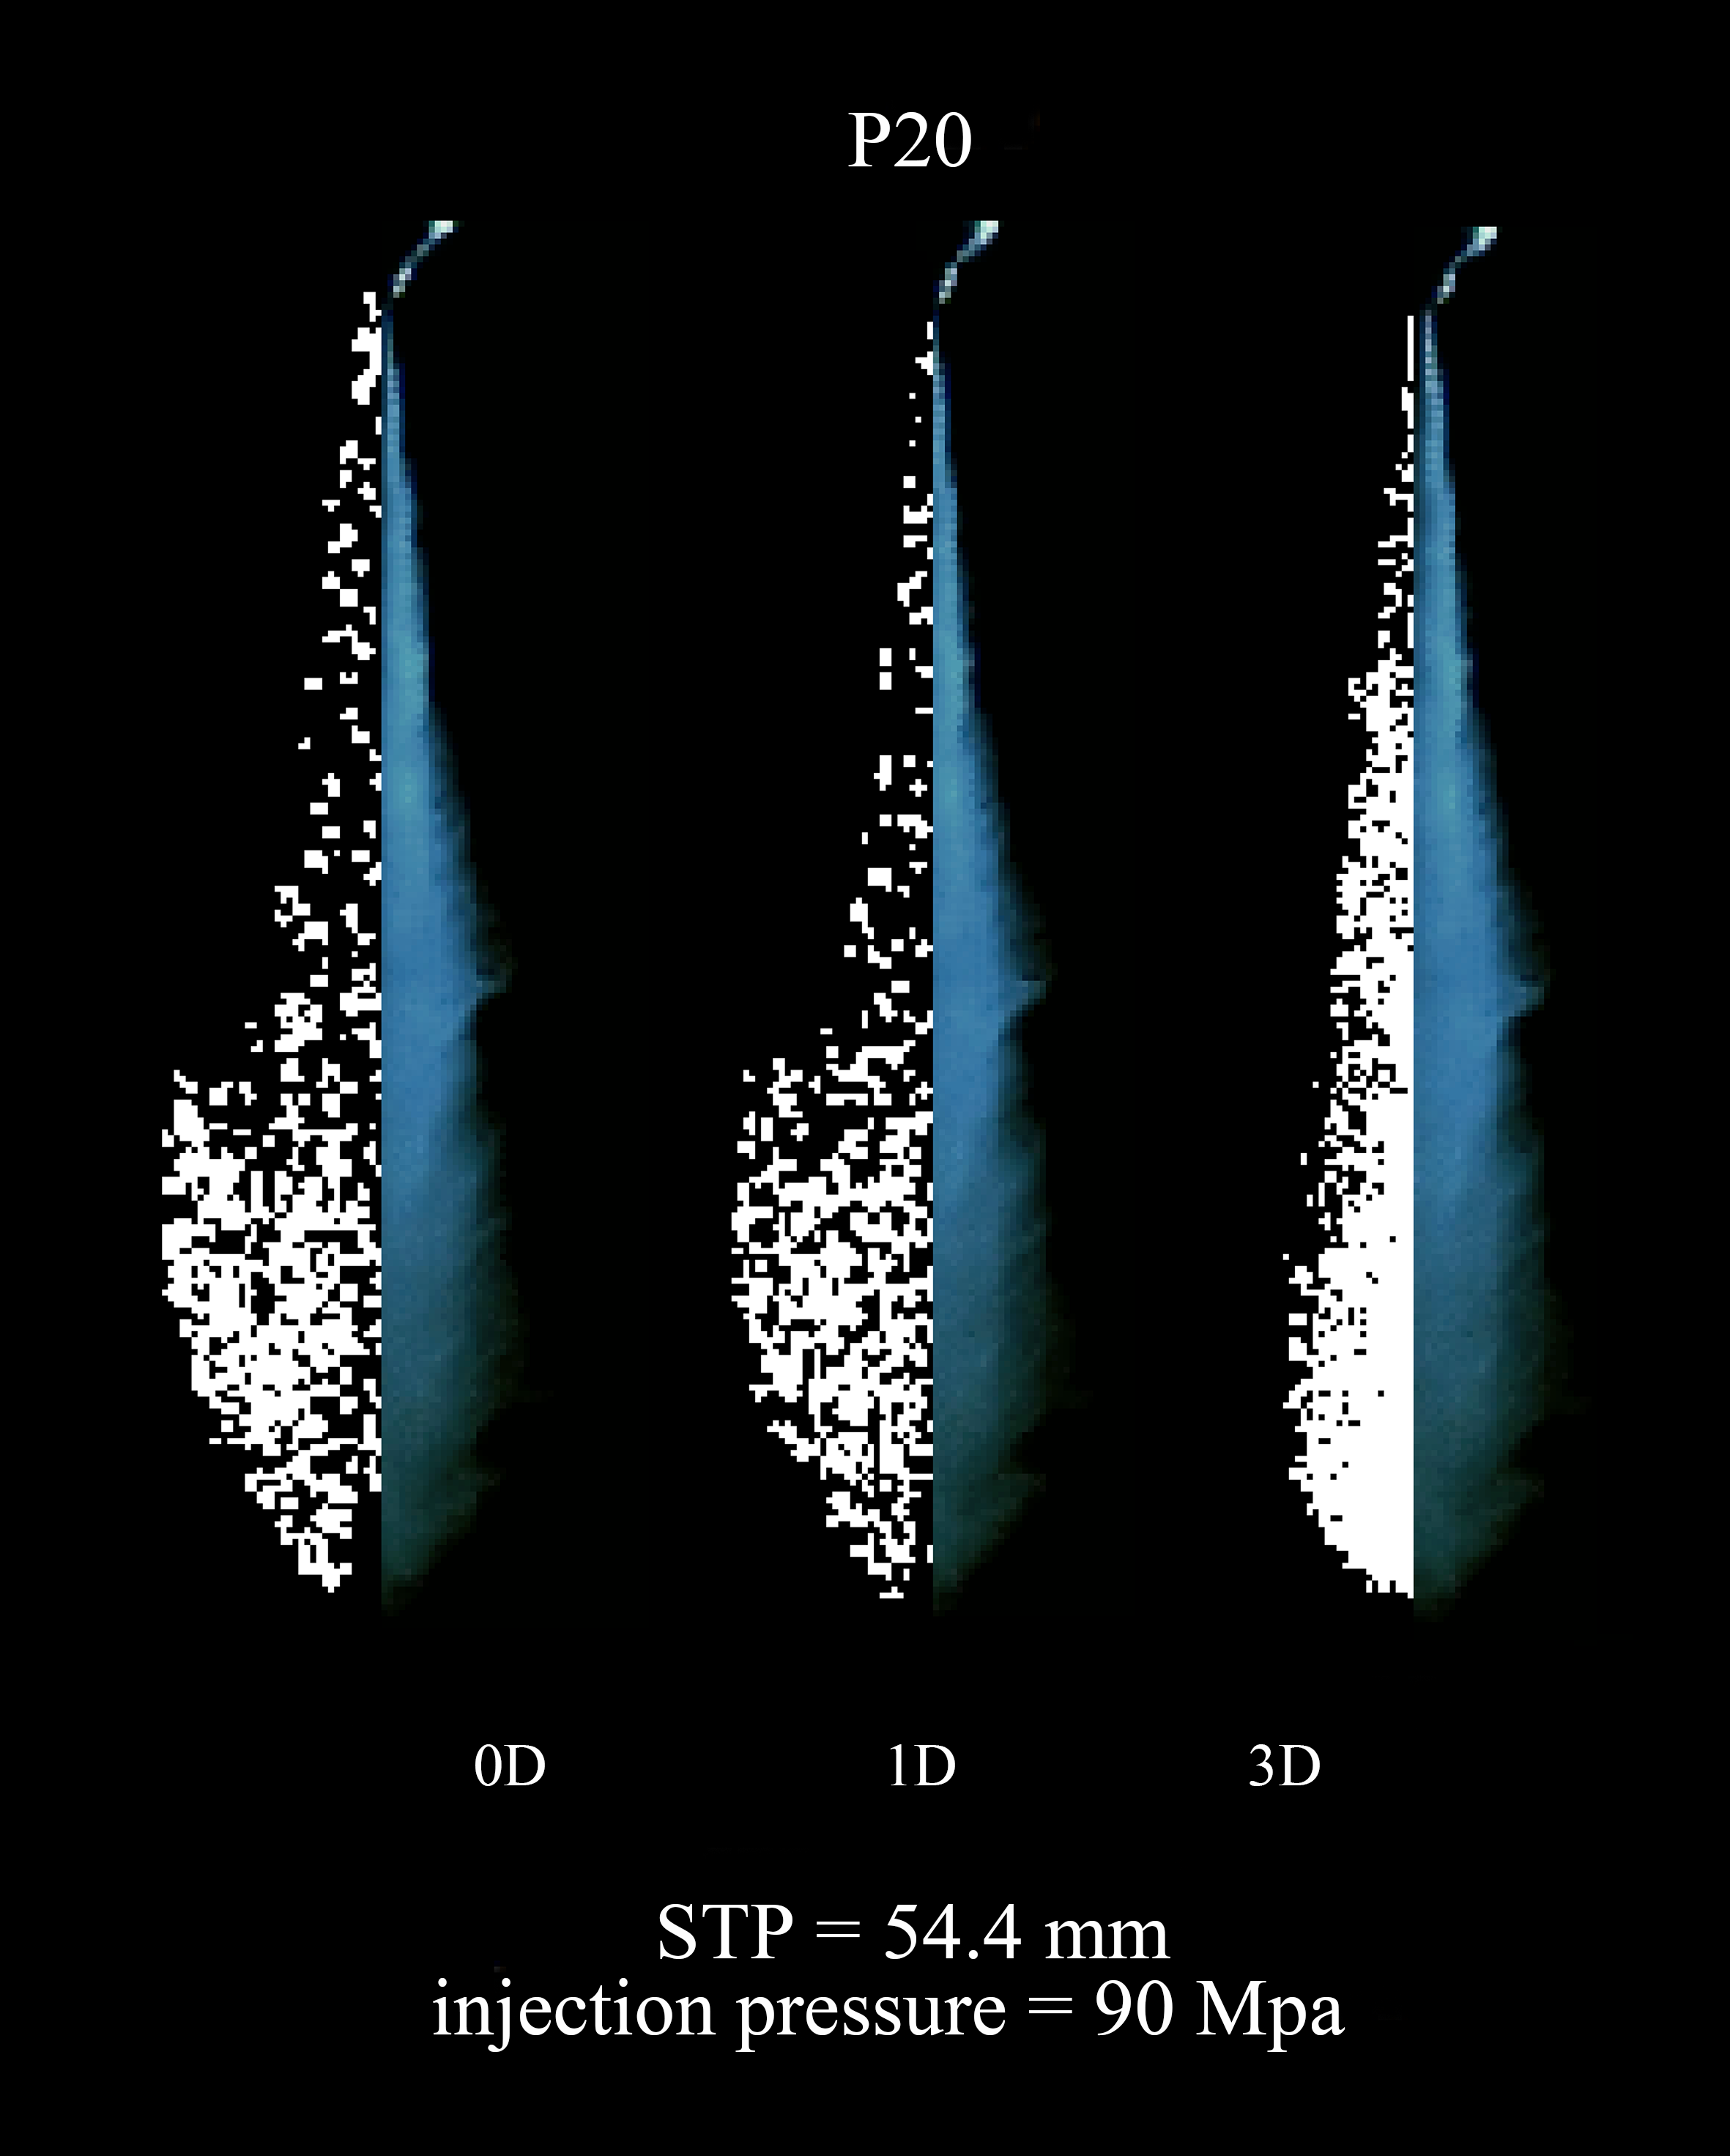
3.1.2. Spray Model Validation

In order to obtain the transient flow characteristics file, the distributions of exit section velocity, density, liquid-phase fuel, gas-phase fuel, turbulent kinetic energy, etc., as well as the area and coordinate position of the corresponding cell, are obtained for each angle step based on the simulation results of the flow cavitation phenomenon inside the multi-hole injector nozzle. The parent droplet is introduced using the 3D method for primary fragmentation [23], so the corresponding instantaneous flow characteristics file will be obtained for each angular step, which is an improvement based on Reitz’s Blob-type injection, with the main difference being the initial introduction of the parent droplet. The influence of nozzle inlet rounding on the spray characteristics [25] is also considered to make the model more accurate.
In this paper, the spray tip penetration (STP) distance and shape of P20 are measured in the standard spray visualization test bench. Figure 3 shows the comparison between the numerical spray tip penetration and experimental results, and Figure 4 shows the comparison between the simulation and experimental results of spray shape, in which the spray is divided into two halves from the middle, the left side is the numerical simulation results, and the right side is the experimental results. It can be seen from the figure that the traditional 0D and 1D spray models underestimate the development of the penetration distance and over-predict the spray shape, while the improved 3D model has a good prediction of the spray shape and a better accuracy of the penetration distance than the traditional method.

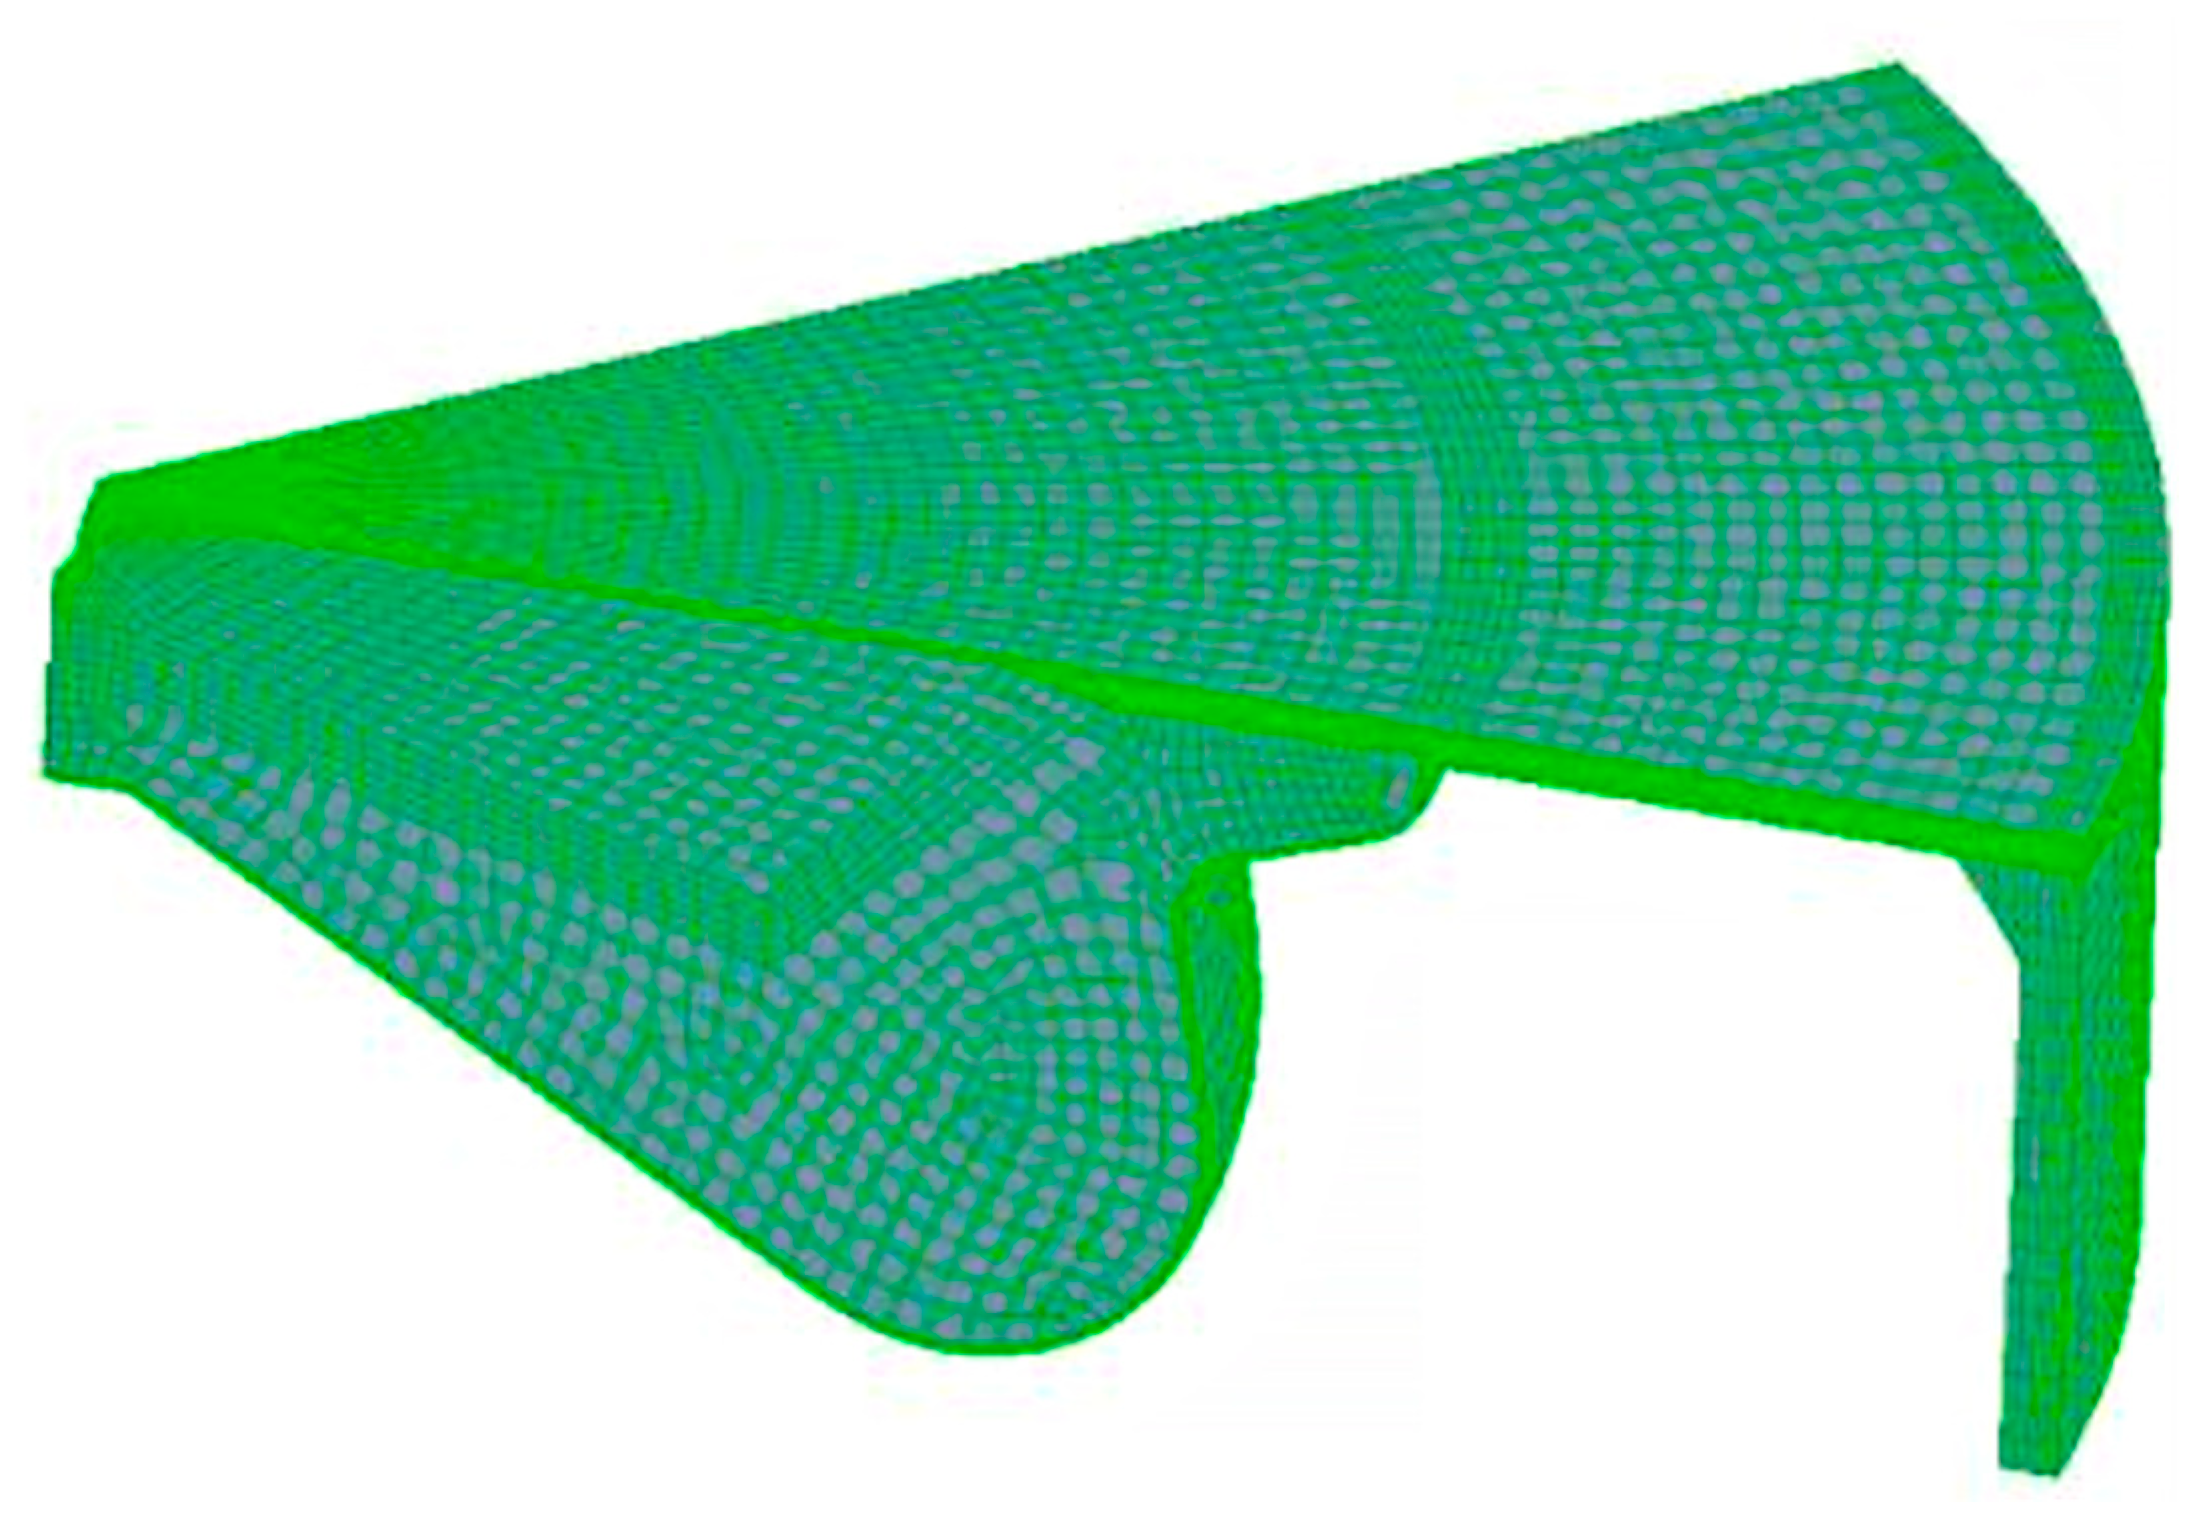
3.2. Numerical Engine Model

3.2.1. Model Summary and Simulation Procedure

The ECFM-3Z model is used in this paper, which is a very robust combustion model, especially for diesel engines. The models related to the calculation of the combustion process are summarized in Table 4. In order to fully verify the reliability and accuracy of the model, the in-cylinder combustion and emission data are used for model validation under the BMEP of 1.1 MPa and 1400 rpm. The specific parameters of this operating point are listed in Table 5.
The operating process from the moment of intake valve closure (IVC) to the moment of exhaust valve opening (EVO) is chosen as the model computation interval.
Figure 5 shows the mesh model of the combustion chamber. By dividing the entire combustion chamber evenly by the number of injector nozzles, the calculation grid uses the partial combustion chamber grid model created by AVL Fire’s ESE Diesel module. The combustion chamber is divided into a 1/8 combustion chamber grid model because the injector nozzles have 8 nozzles, as shown in Figure 5. The grid is constructed with a compensation volume to guarantee the compression ratio, and the compensation component of the radial direction should contain at least three layers of the grid to guarantee the calculation’s accuracy. The ESE dynamic grid is used to generate the grid corresponding to the crank angle between 0 and 360 °CA, which contains a complete piston reciprocation process. The grid corresponding to the crank angle between 30 °CA before and after the upper stop is encrypted, and the important spray area at each moment is also encrypted. To validate the model, the model’s calculation results are compared to the outcomes of the tests. Then, utilizing the validated numerical model, a thorough investigation of the impact of injection timing and EGR on in-cylinder combustion and NOx and soot emissions is conducted.

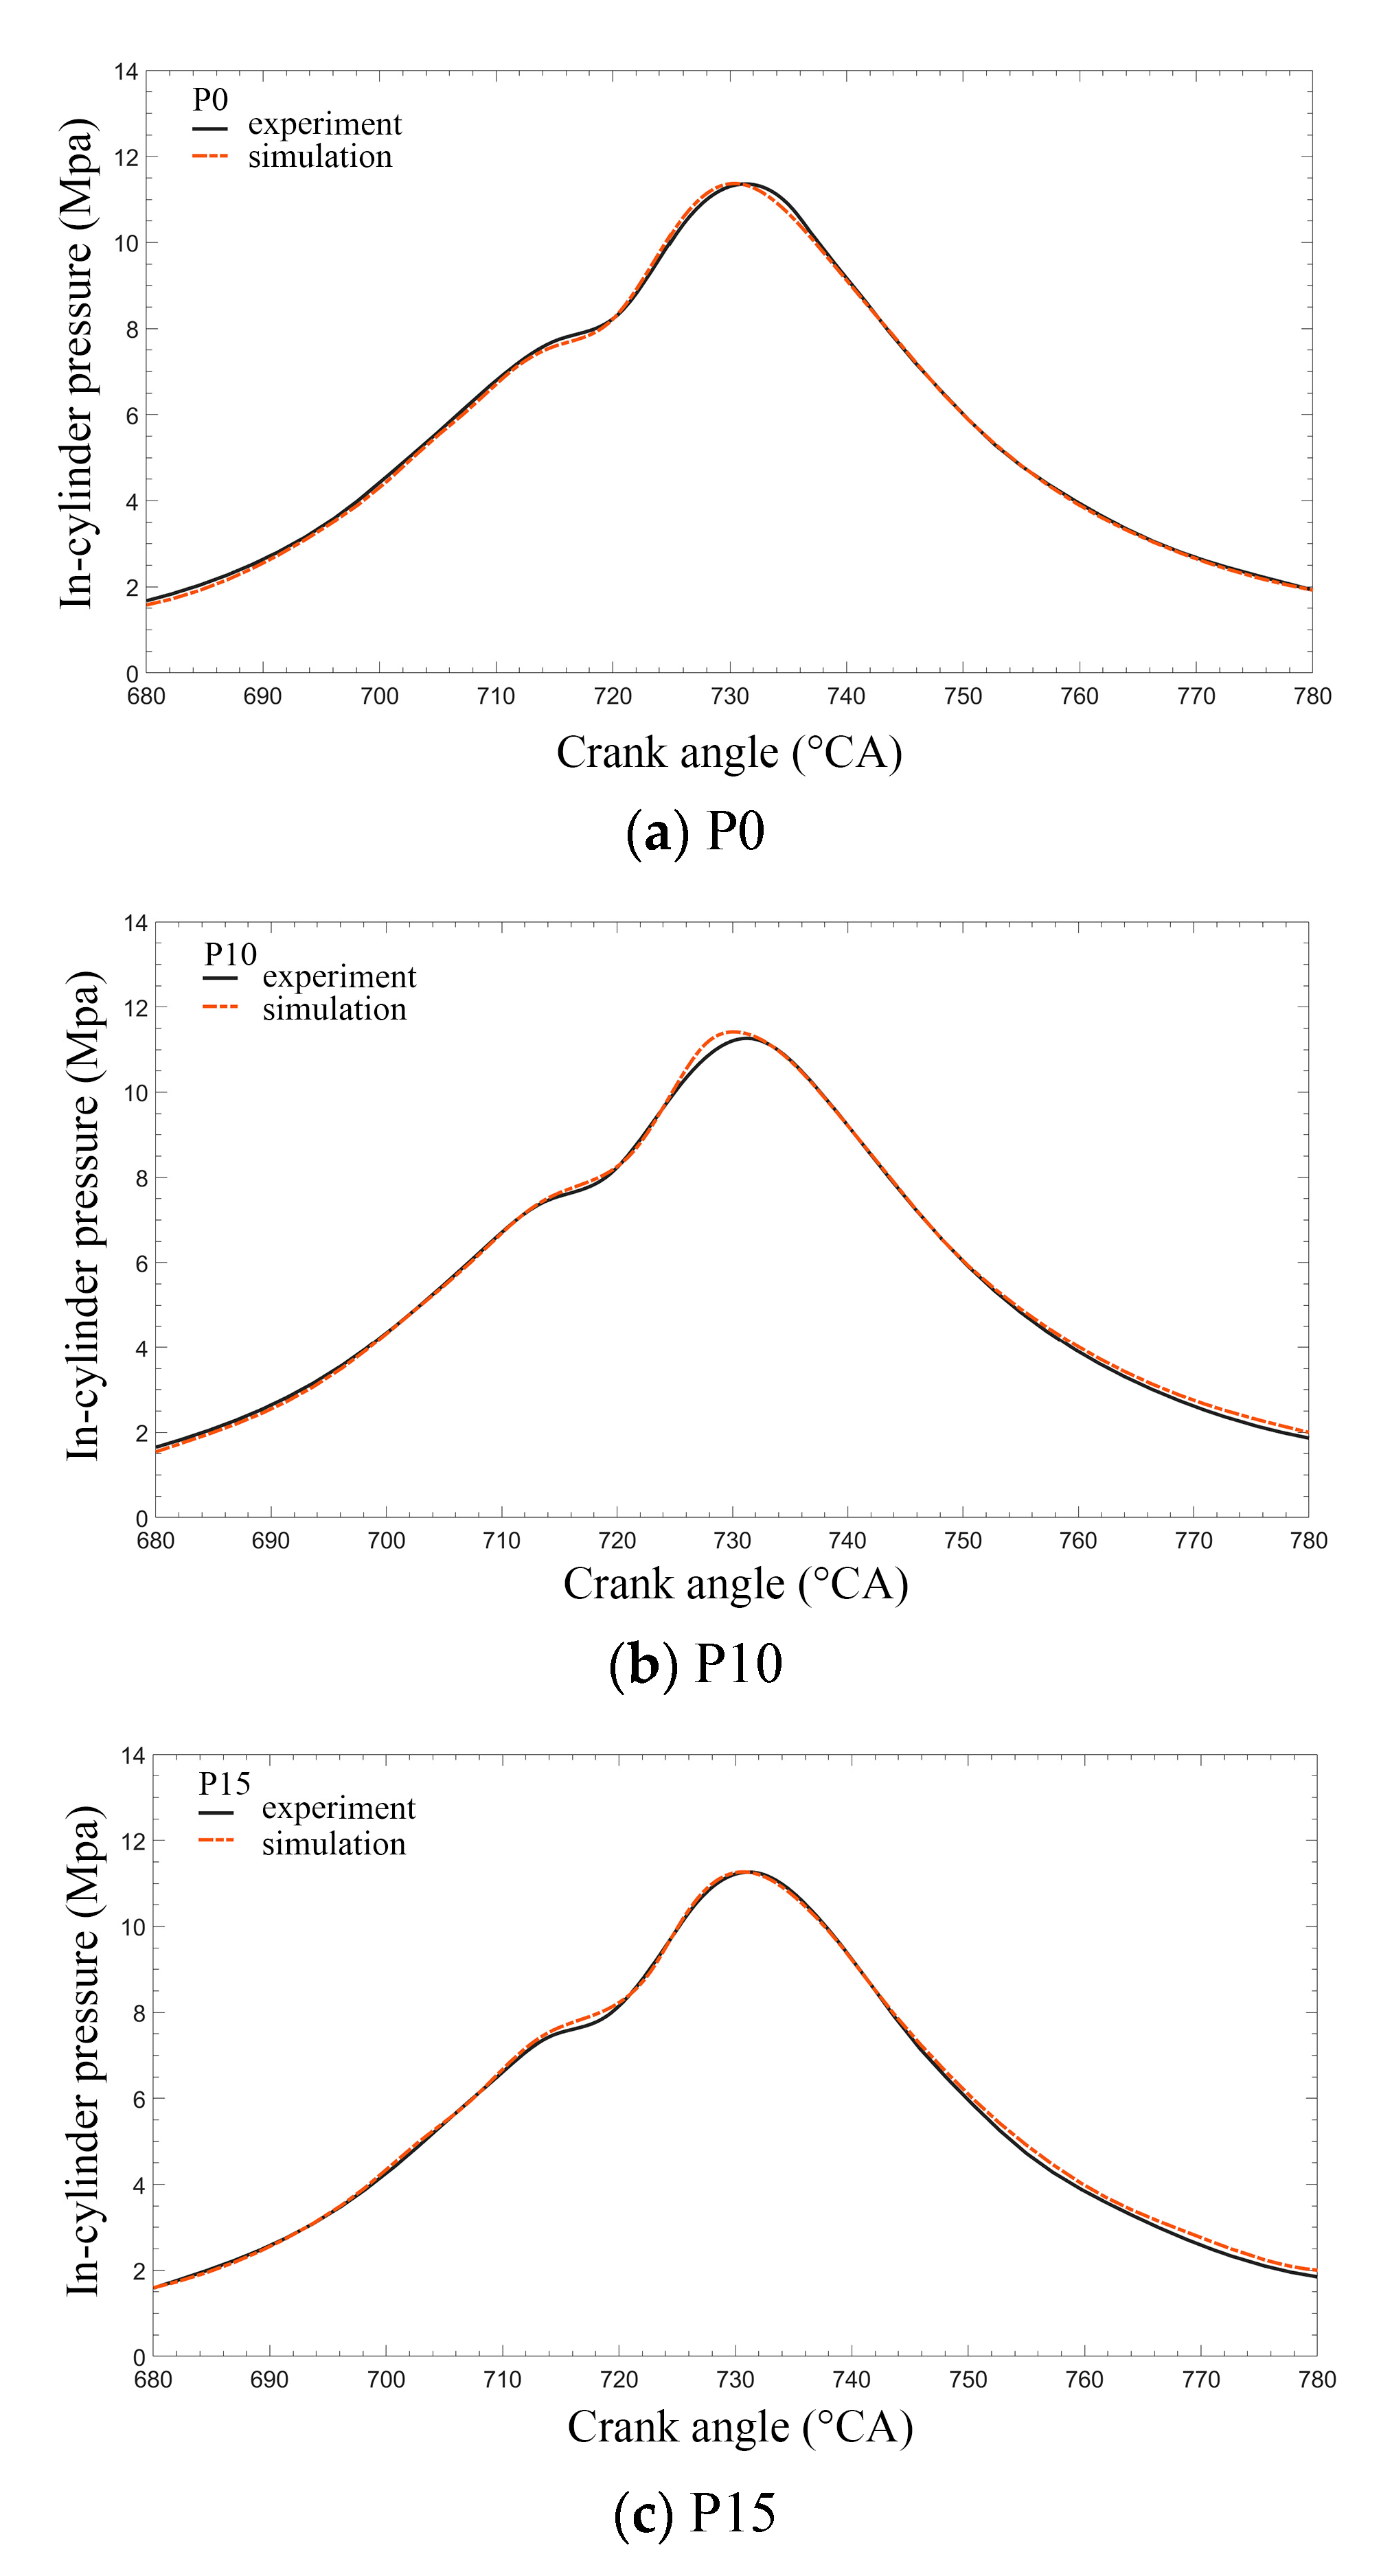
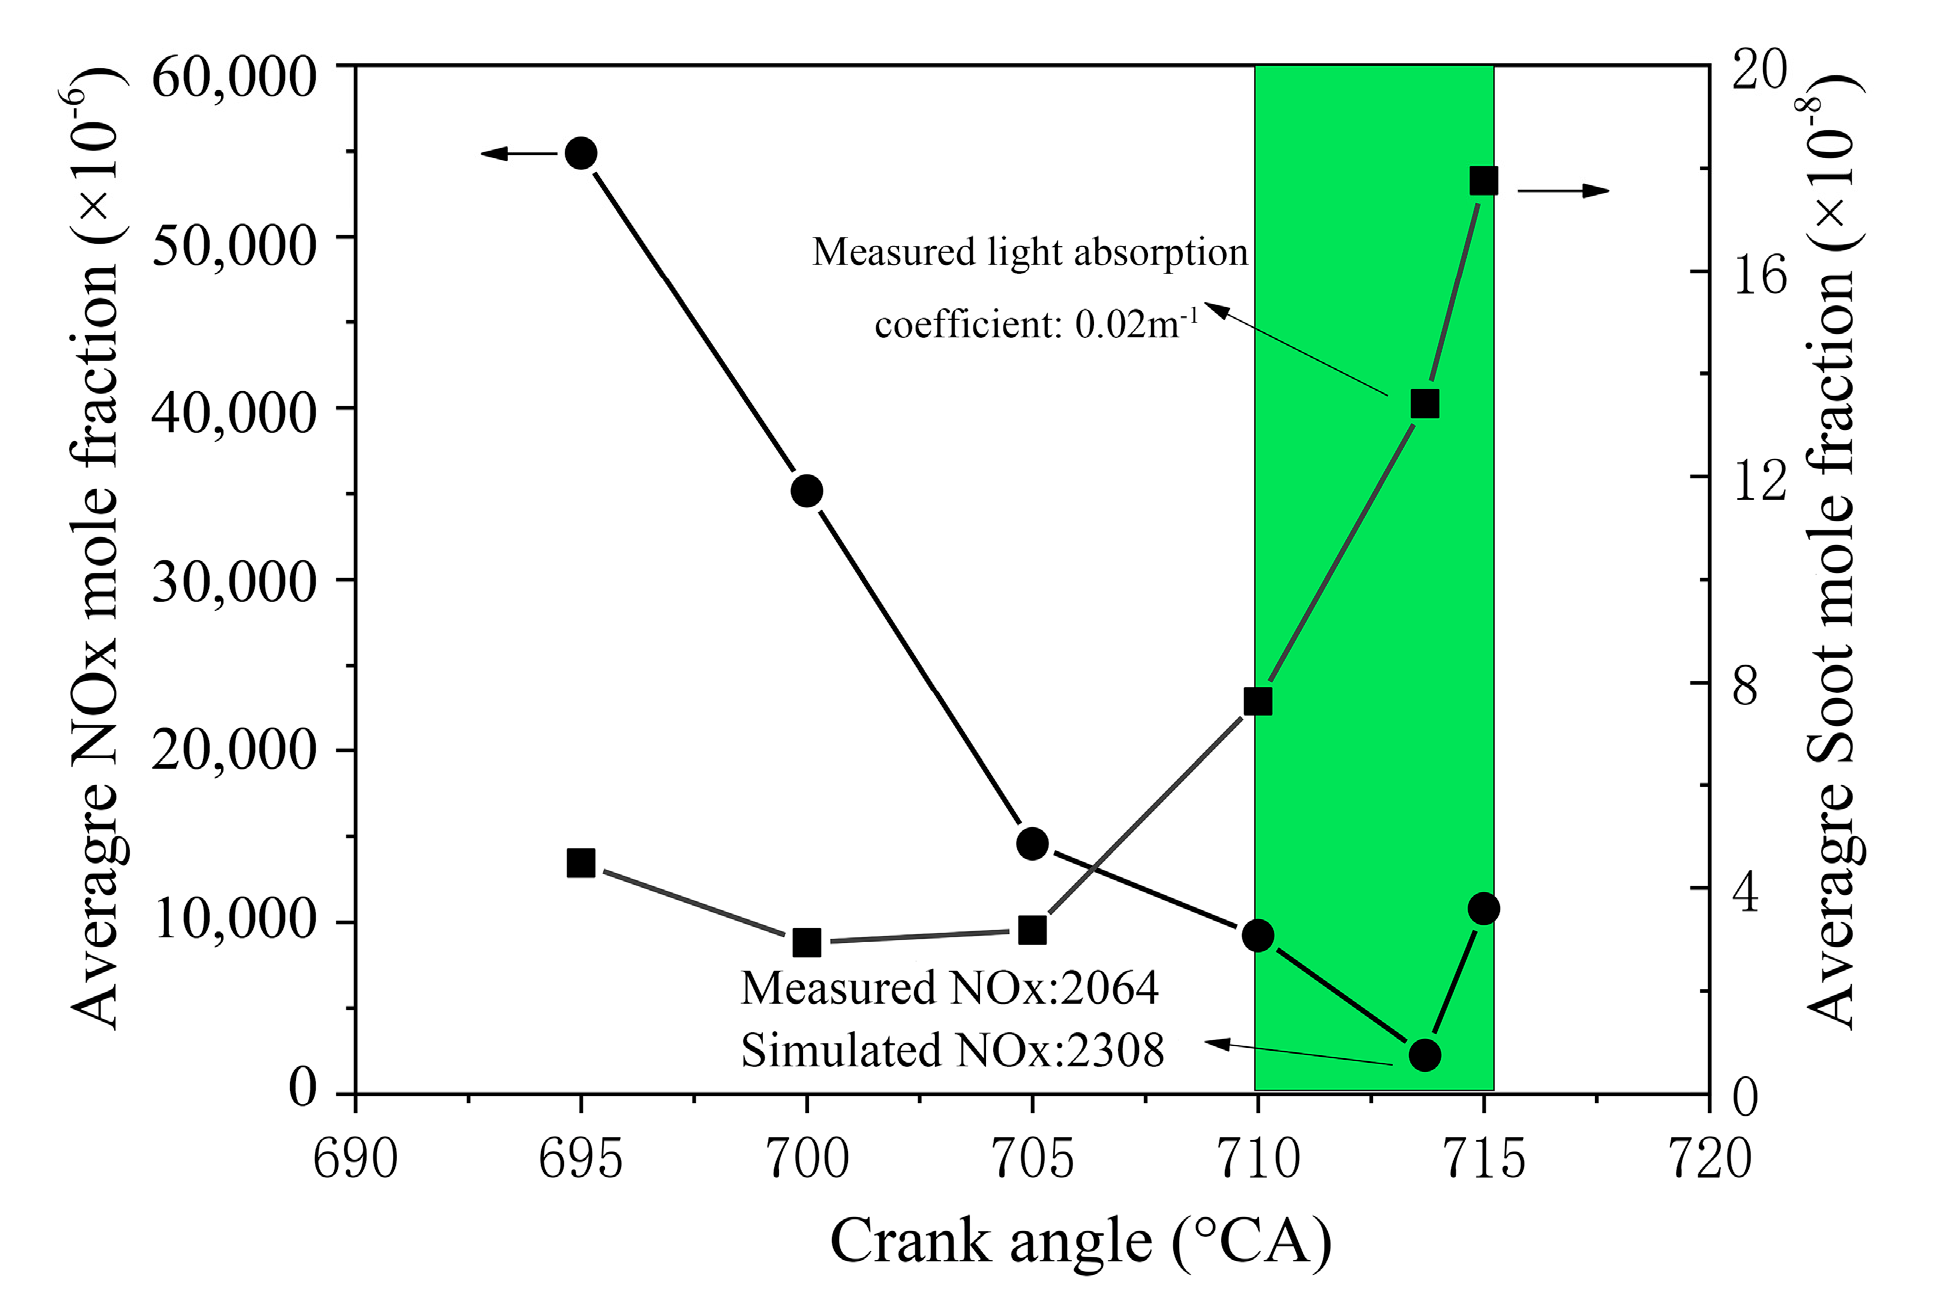
3.2.2. Model Validation

Figure 6 shows the comparison of the simulation and test results of in-cylinder pressure with different PODE blending ratios, and both the experiment and simulation are conducted under 1400 rpm and a BMEP of 1.1 MPa. It is clear from Figure 6a–c that the simulated cylinder pressure of P0, P10, and P15 matches with the measured in-cylinder pressure very well. Therefore, the numerical model developed and the model parameters selected during the numerical calculation process are reasonable.
Table 6 shows the comparison of the NOx emission simulation and test results for different PODE/diesel blends. The value of the NOx emission error is the ratio of the error between the simulated and experimental results to the simulated results. Although the error is inevitable, the numerical results can predict the influence of the blending ratio on the NOx emission well.

4. Results and Discussion

4.1. Effects of the Blending Ratios on Emissions

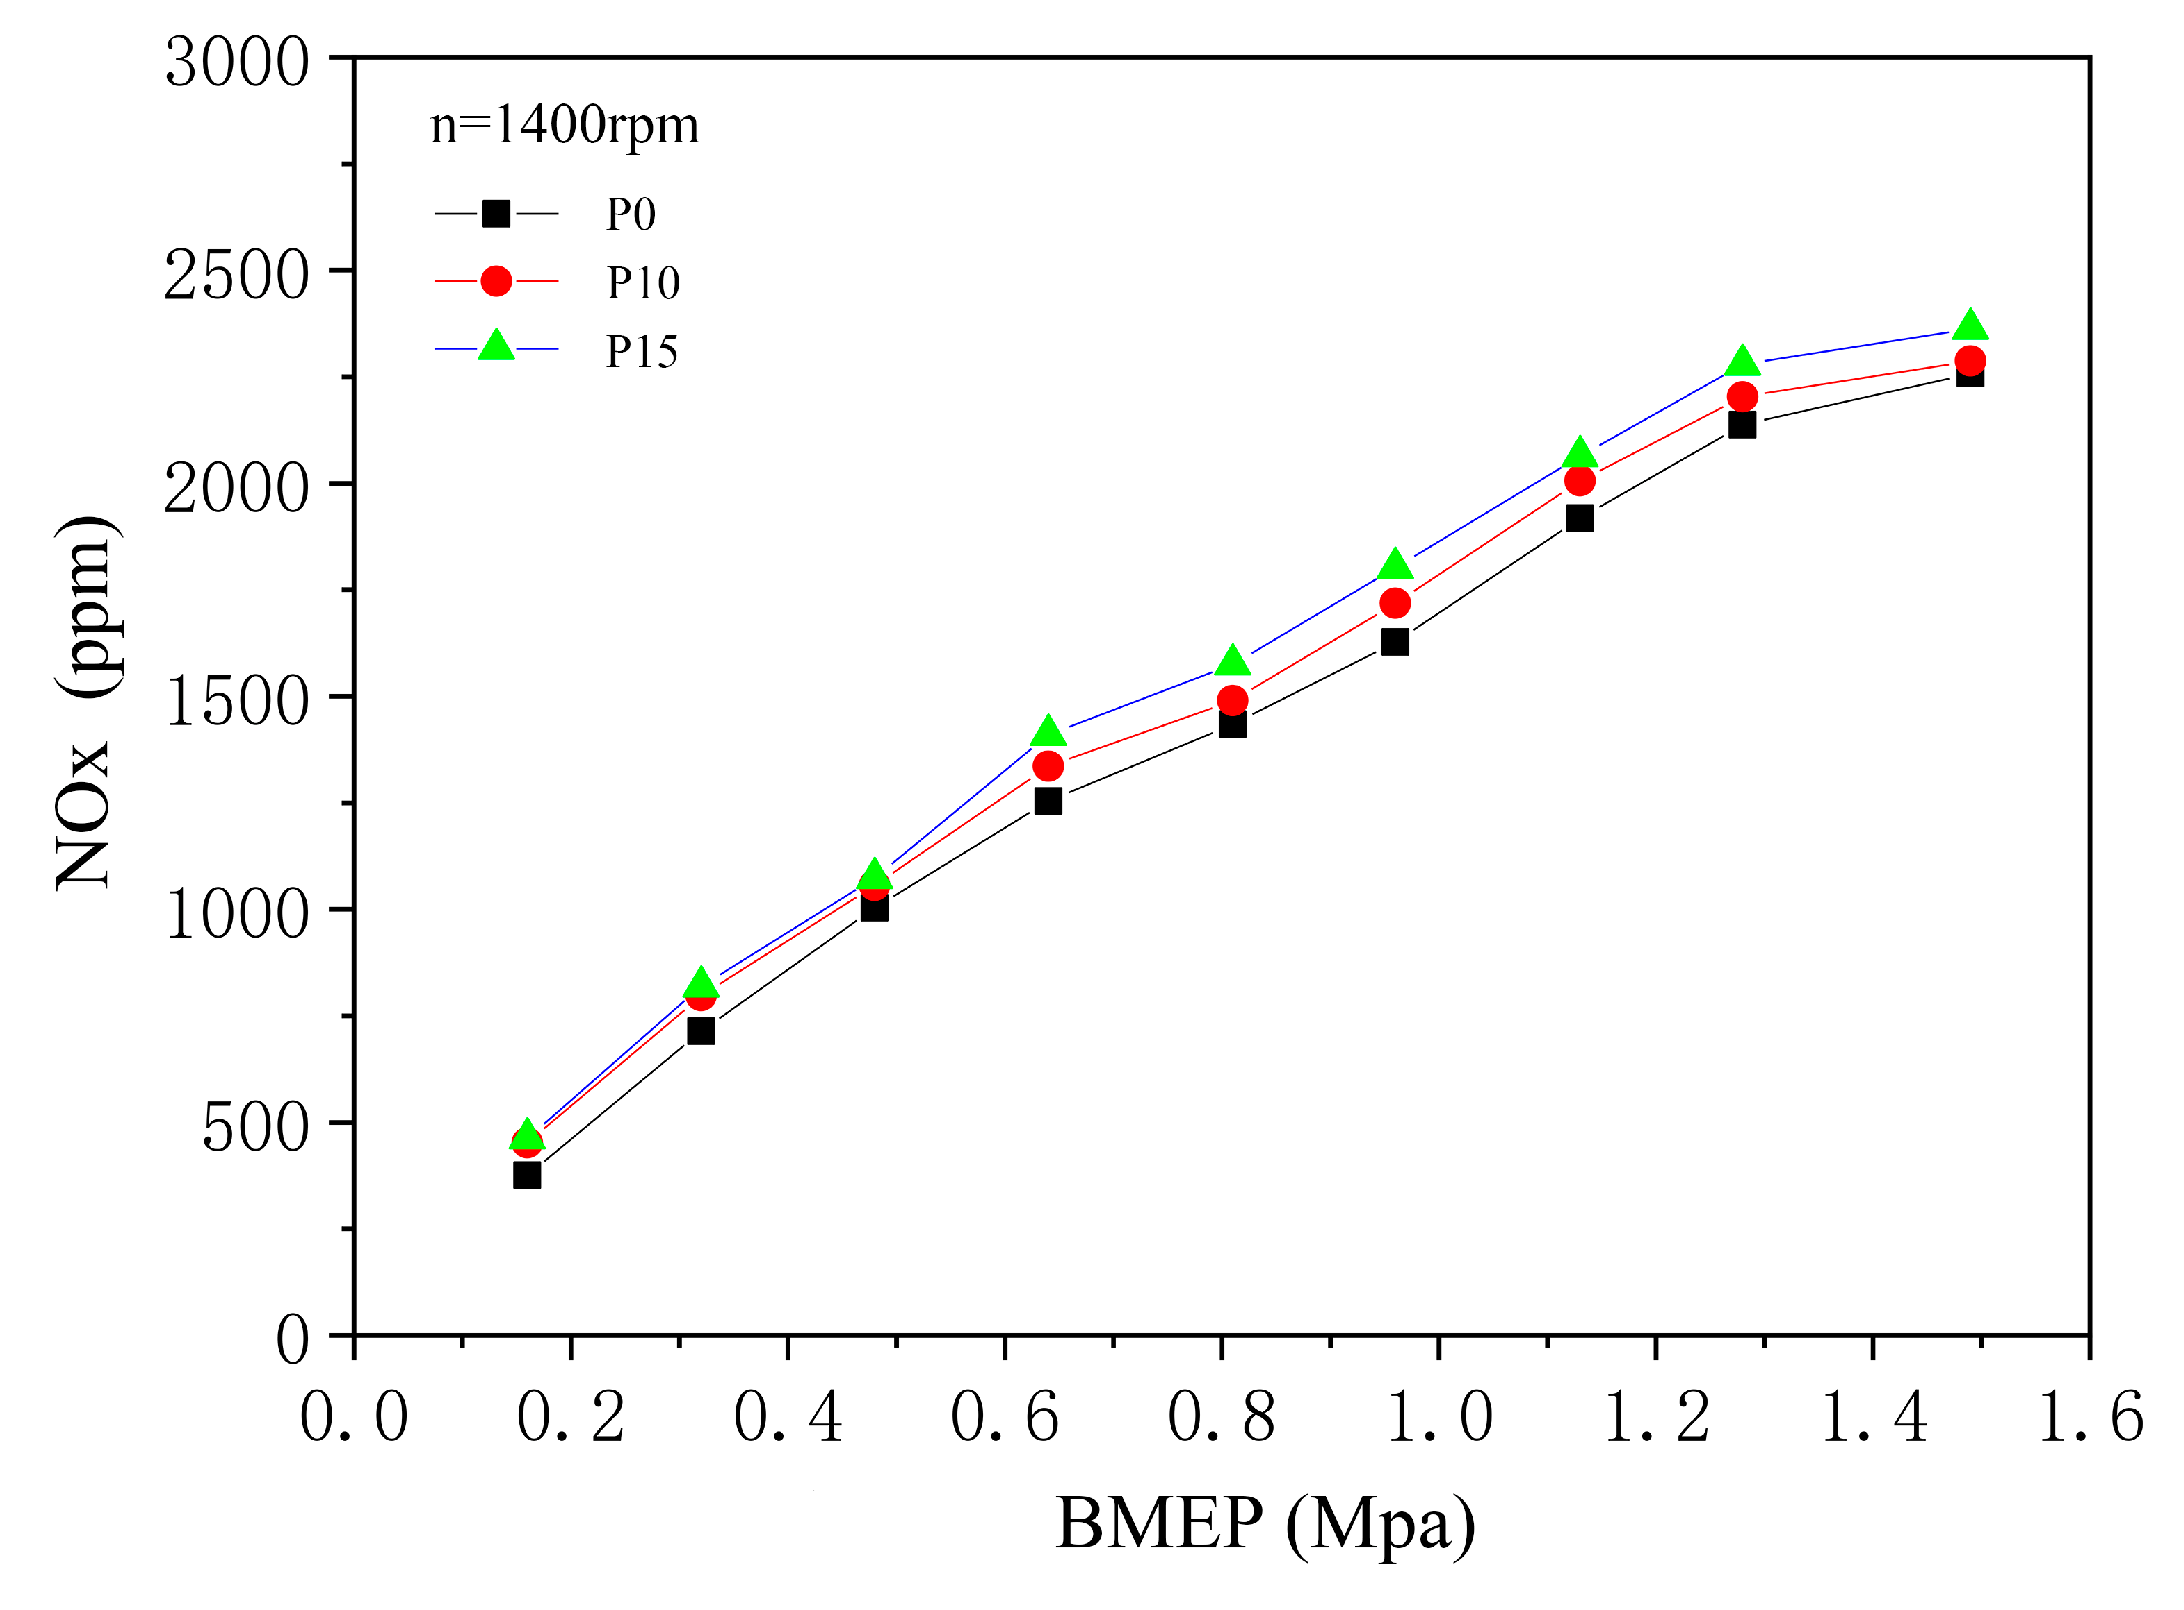
4.1.1. NOx Emission Characteristics

Figure 7 shows the trend of NOx emissions of different fuels at 1400 rpm. With the increase in the PODE blending ratio, the NOx emission under each load condition slightly increases, and with the increase in load, the NOx emission is significantly larger and the difference between different fuels increases. The rising in-cylinder temperature is the reason that the NOx emission increases as engine power increases.
The NOx emission is mainly controlled by combustion temperature, the duration of high temperature, and the oxygen concentration of the mixture. The numerical model can accurately predict the variations in the engine in-cylinder temperature. The in-cylinder temperature field when burning various PODE/diesel blends is shown in Figure 8. It can be observed that the volume of the region with high temperature increases with the increase in the blending ratio. In addition, the higher oxygen content of PODE helps to improve the distribution range of oxygen atoms, thus reducing the range of the poor combustion zone with uneven mixing [33], which is beneficial to the generation of NOx. Therefore, the NOx emission increases as the blending ratio increases.

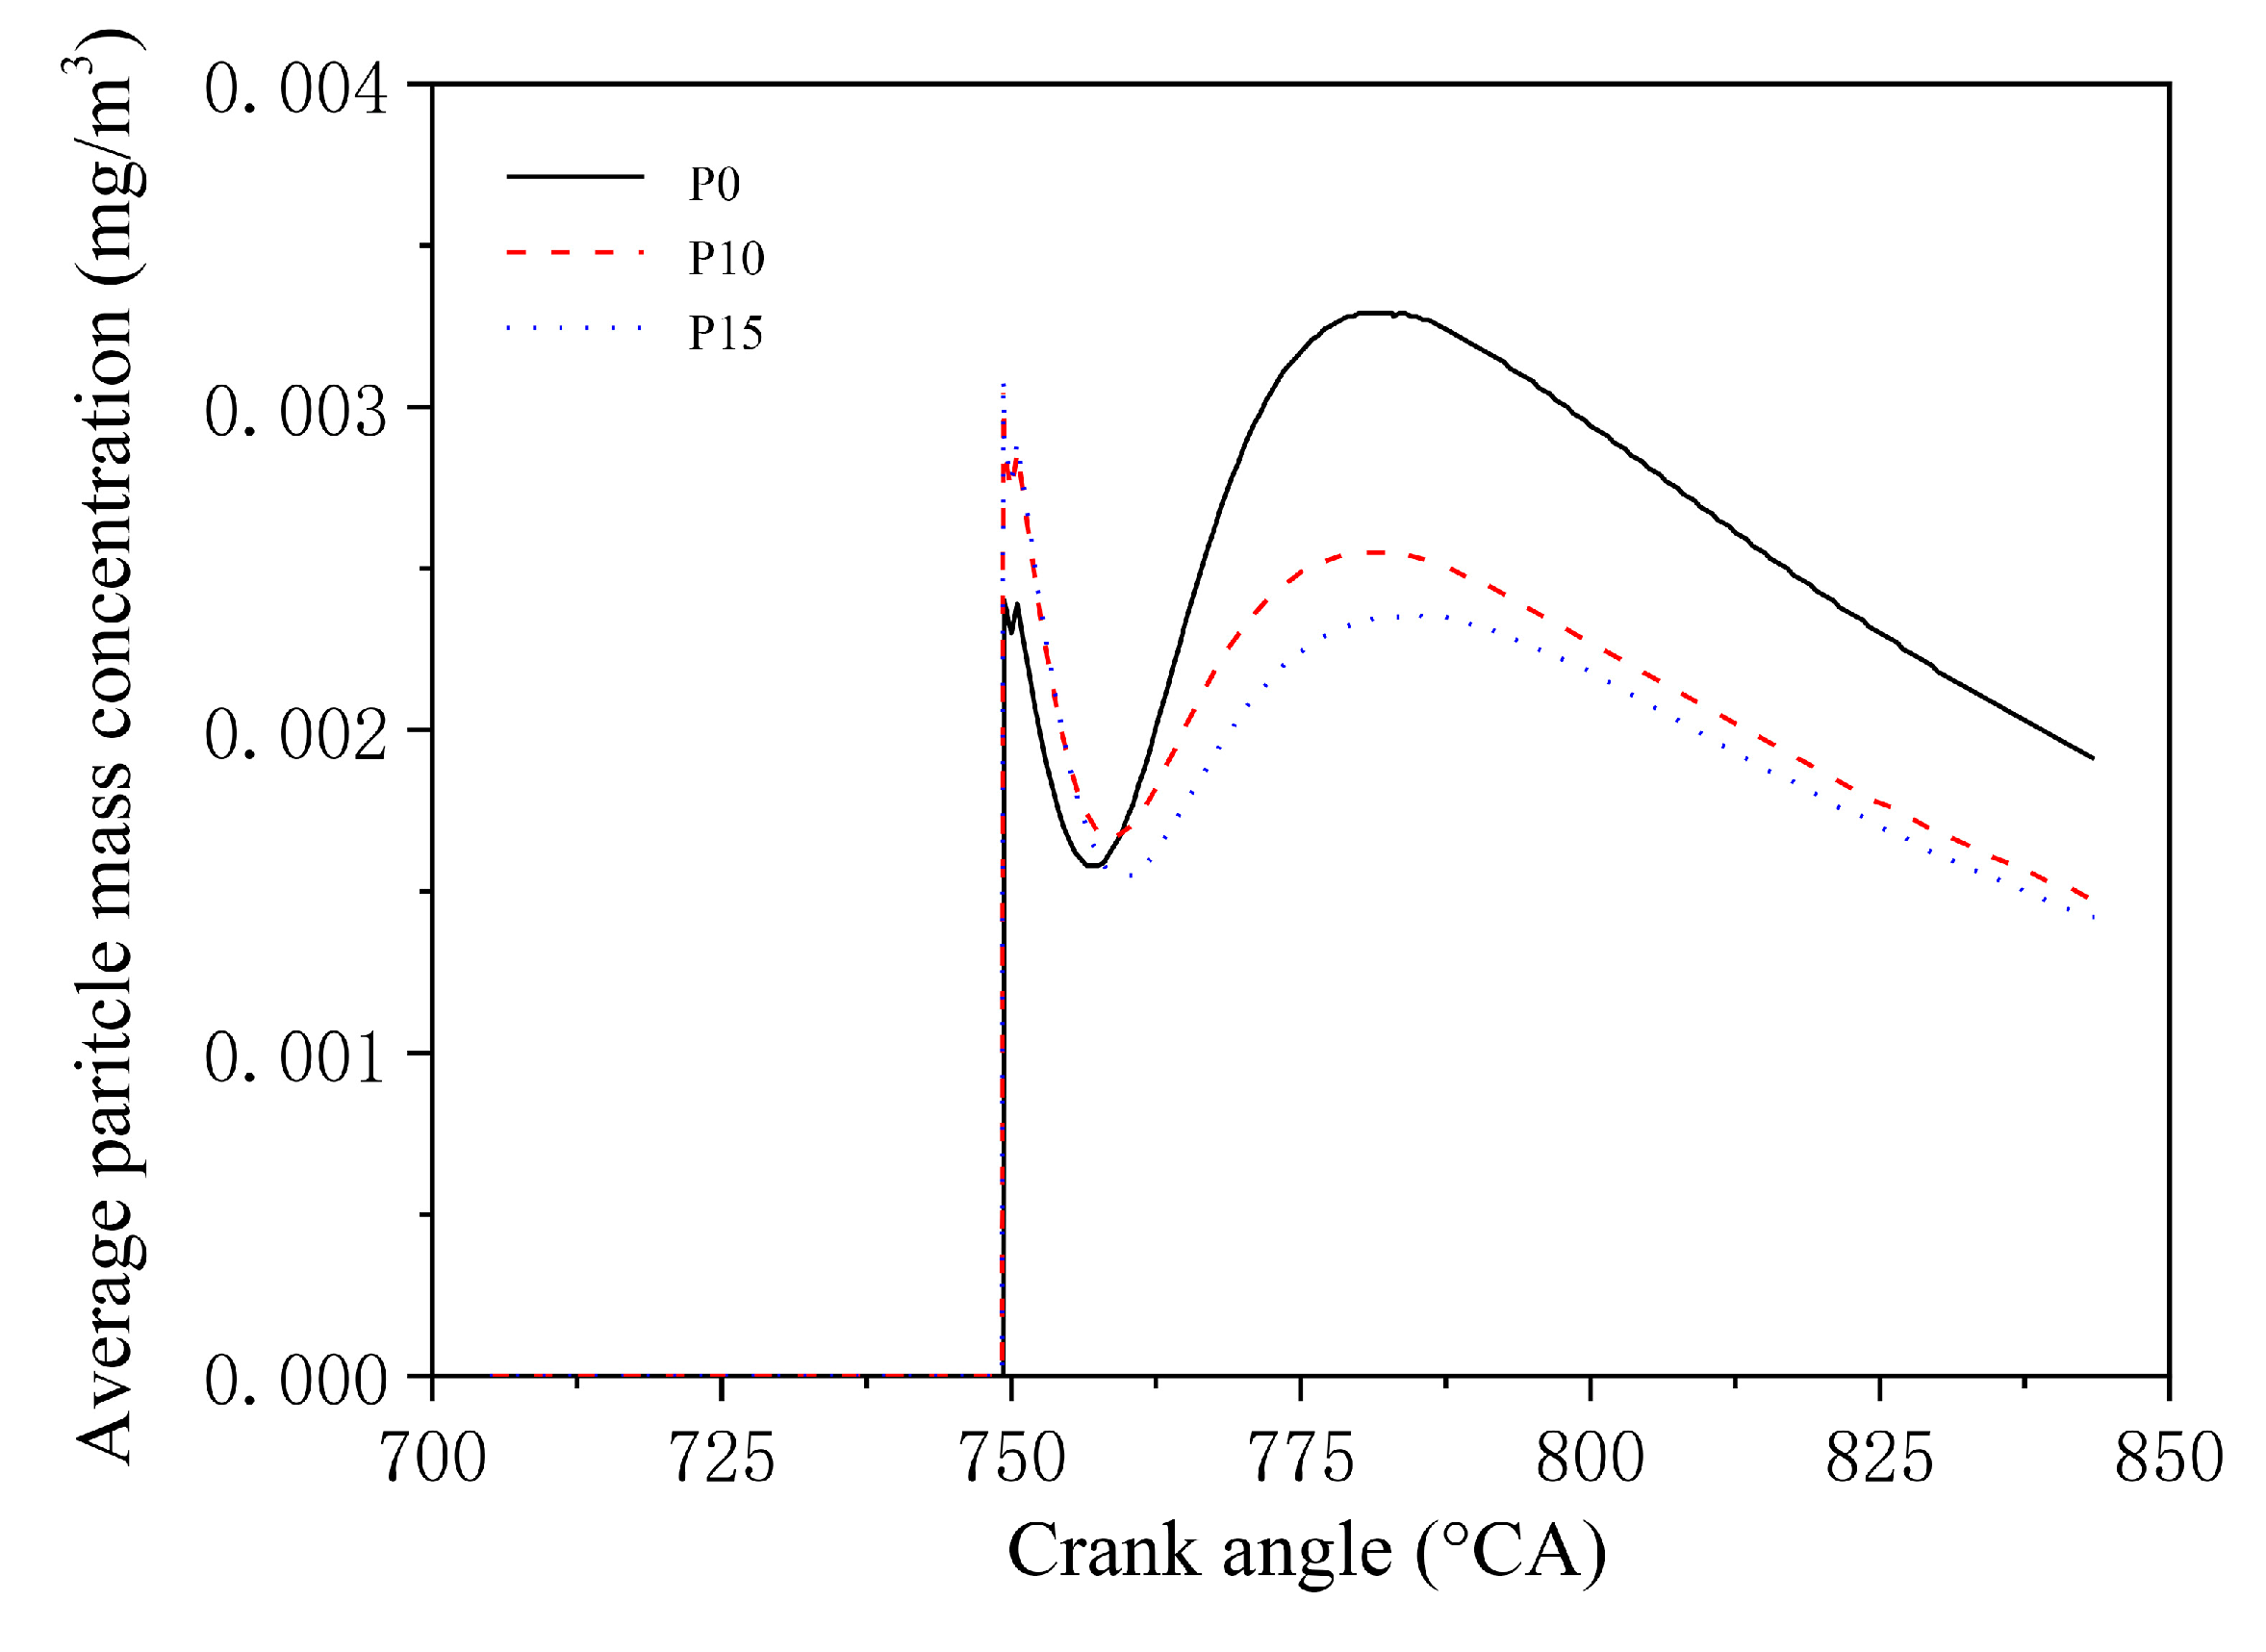
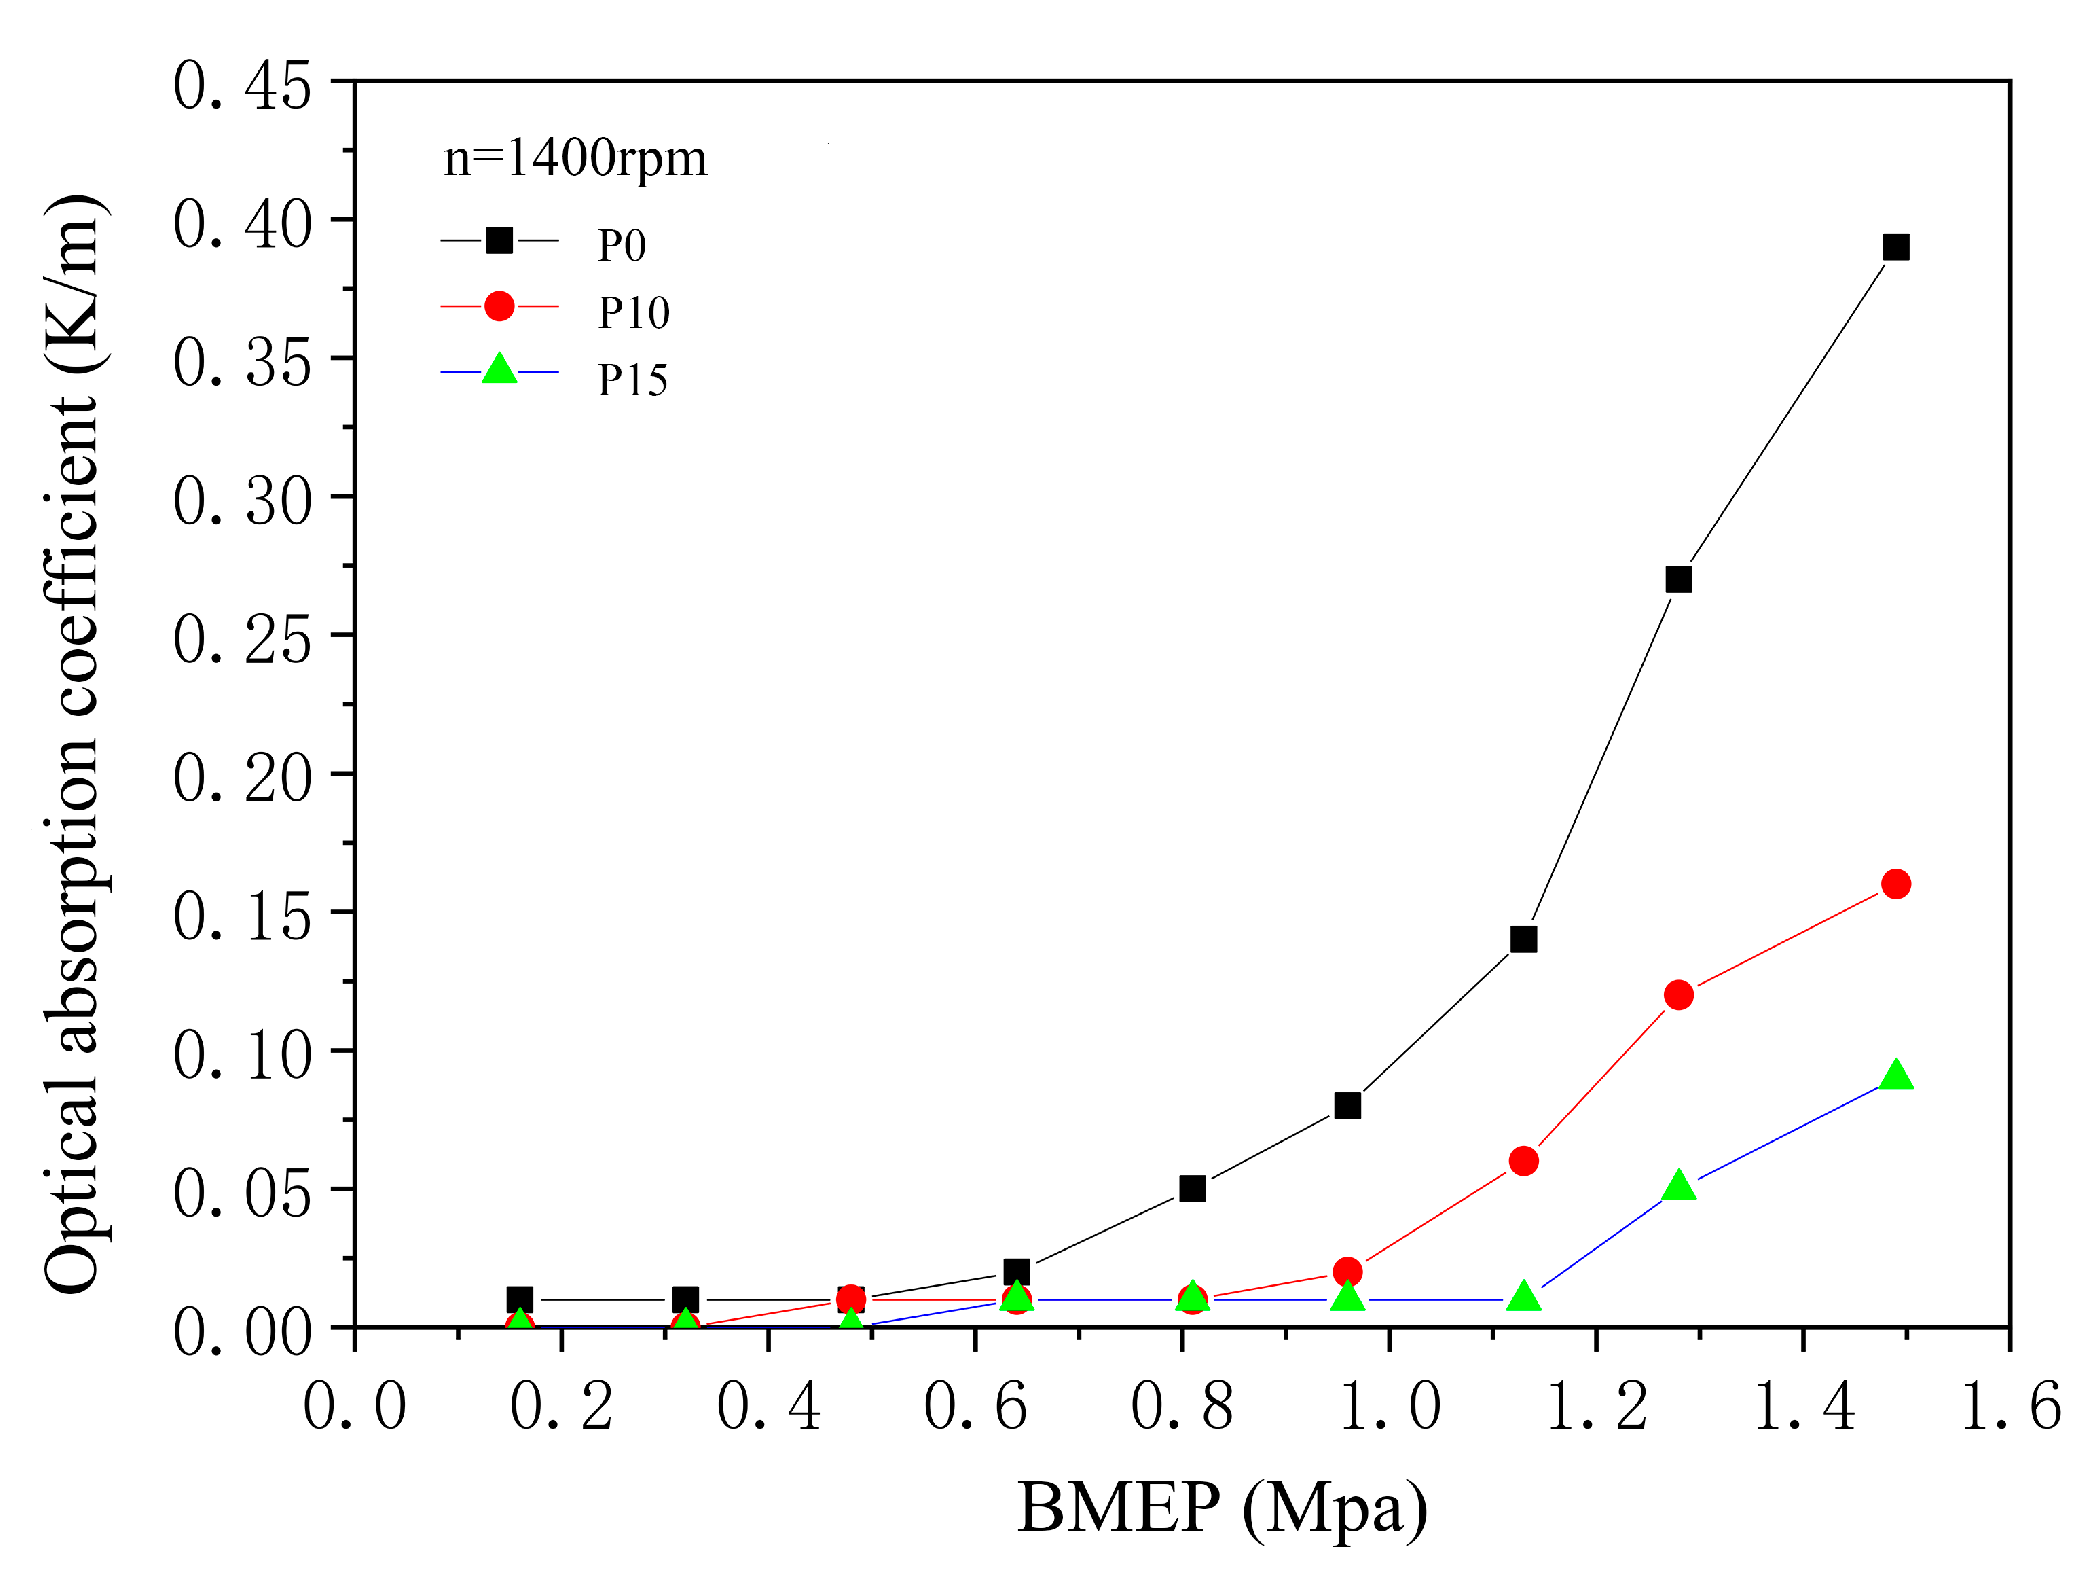
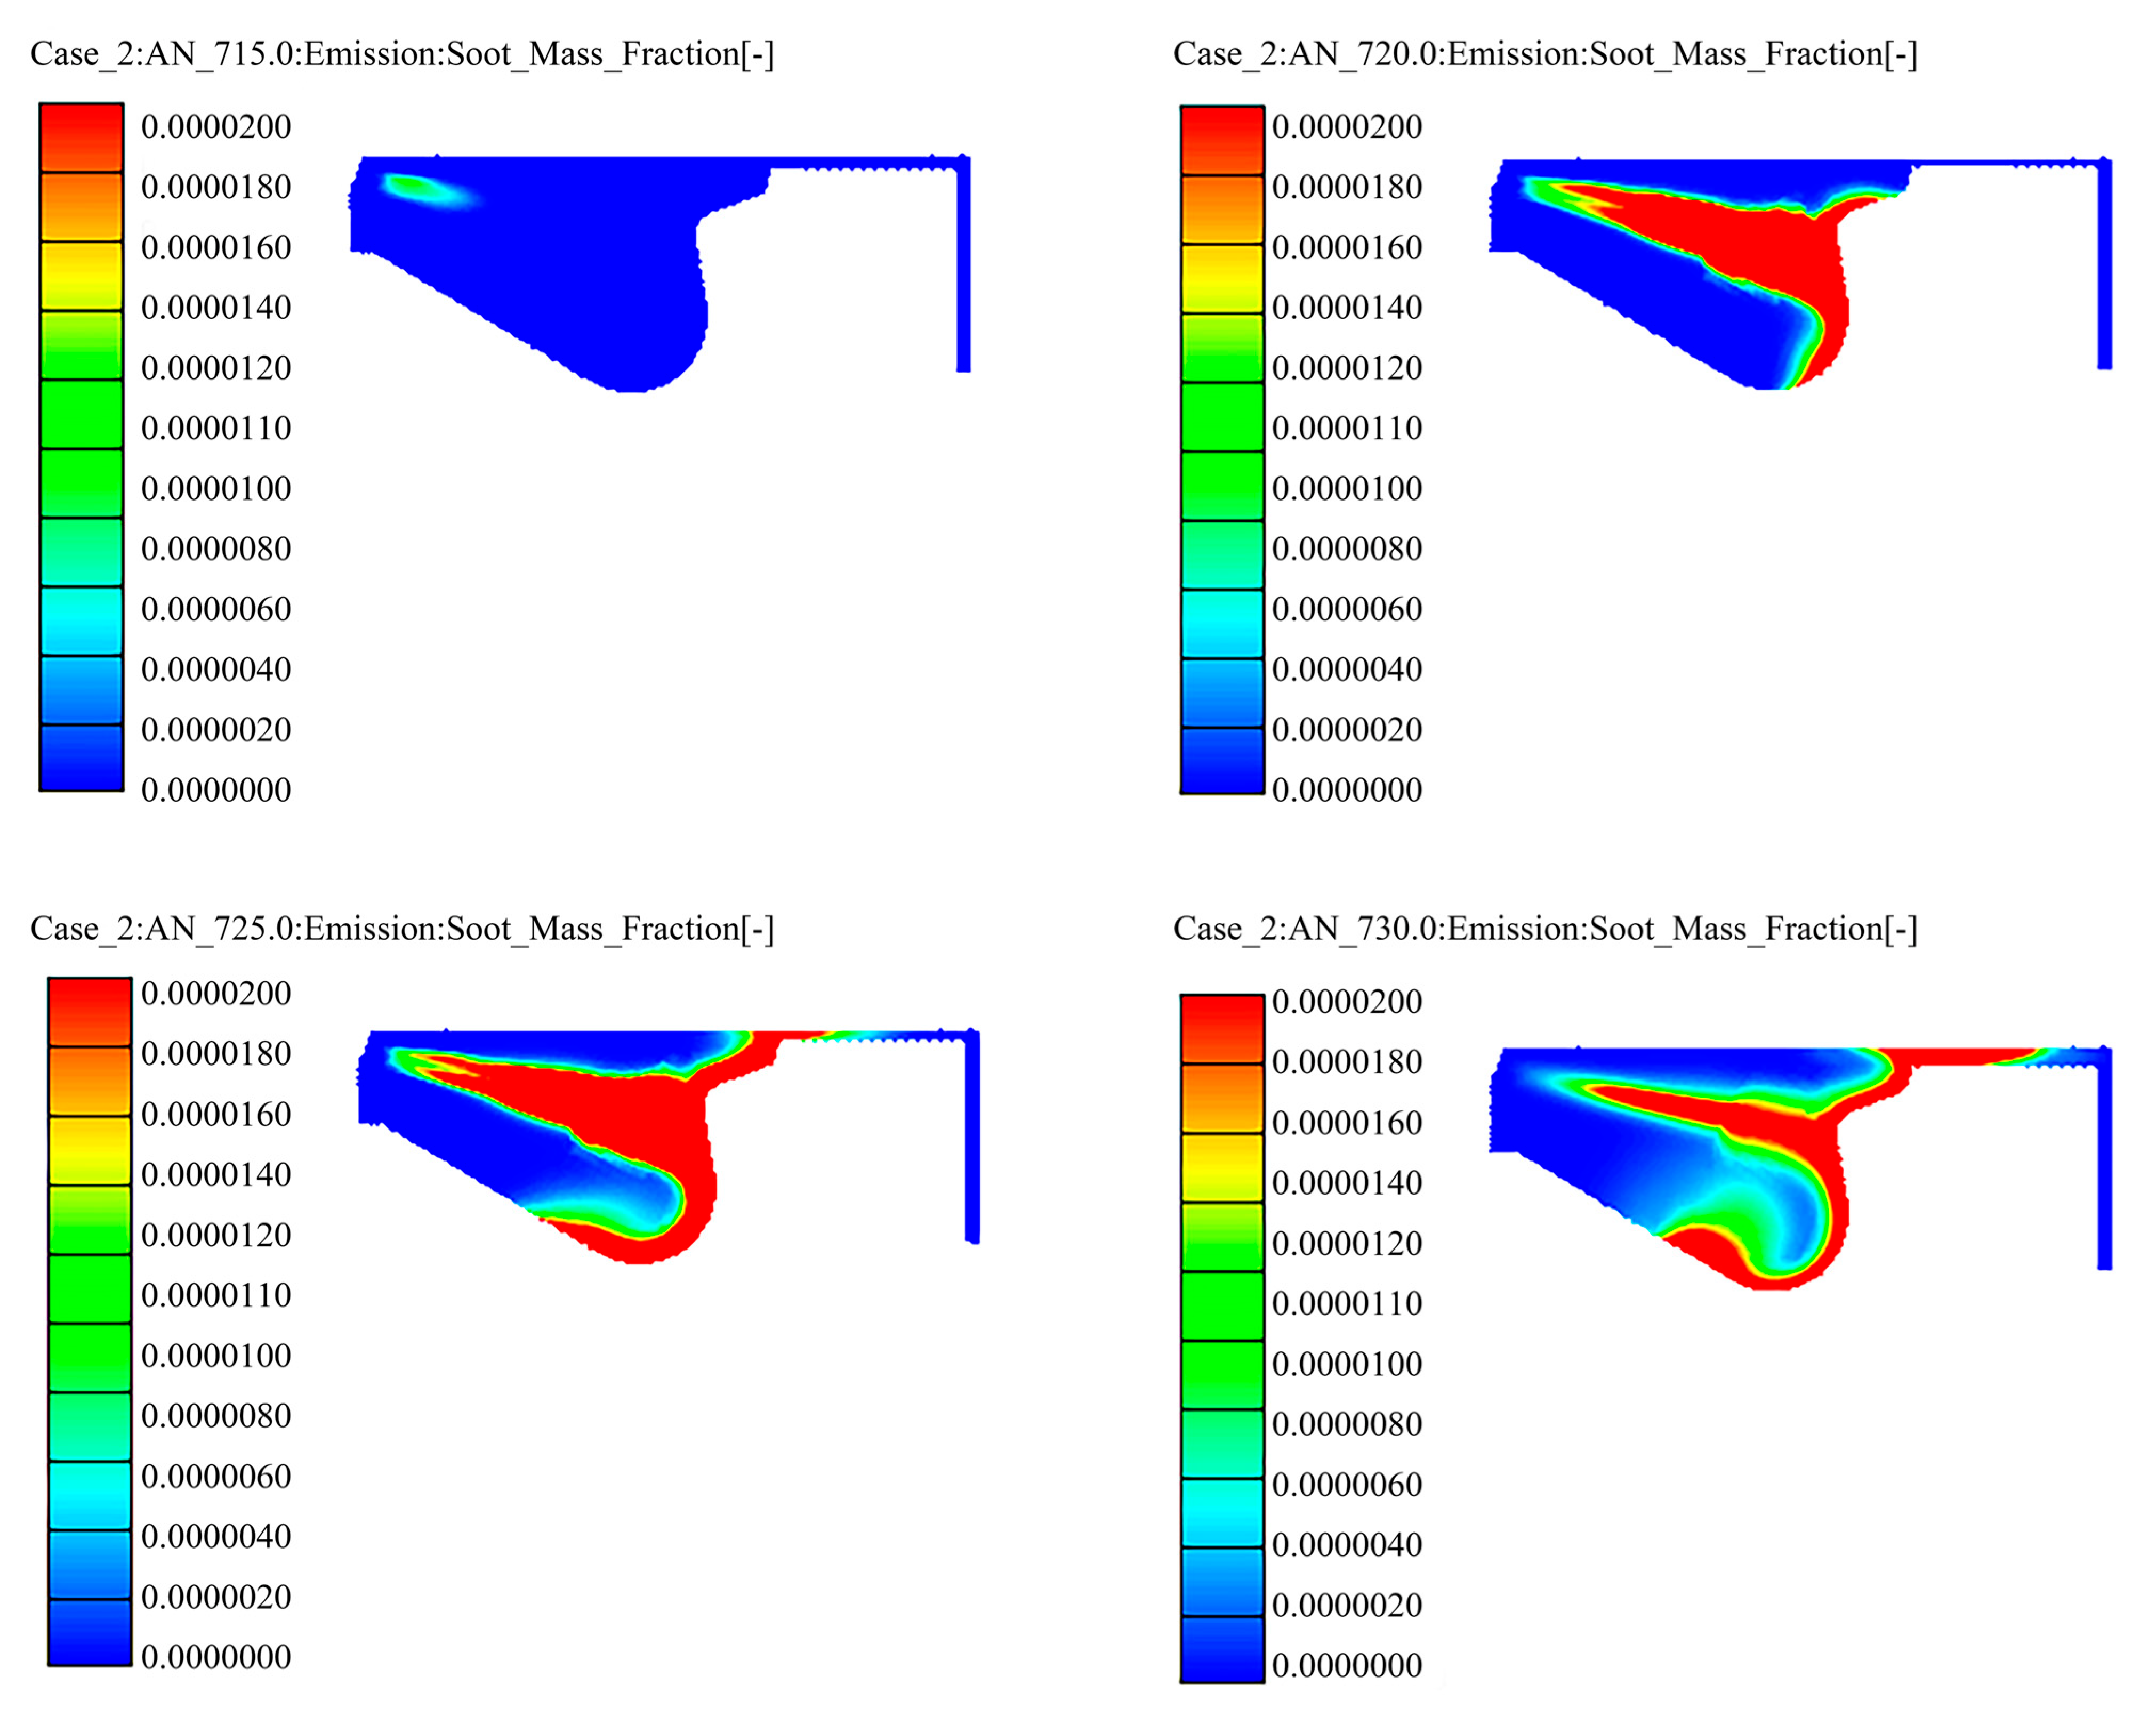
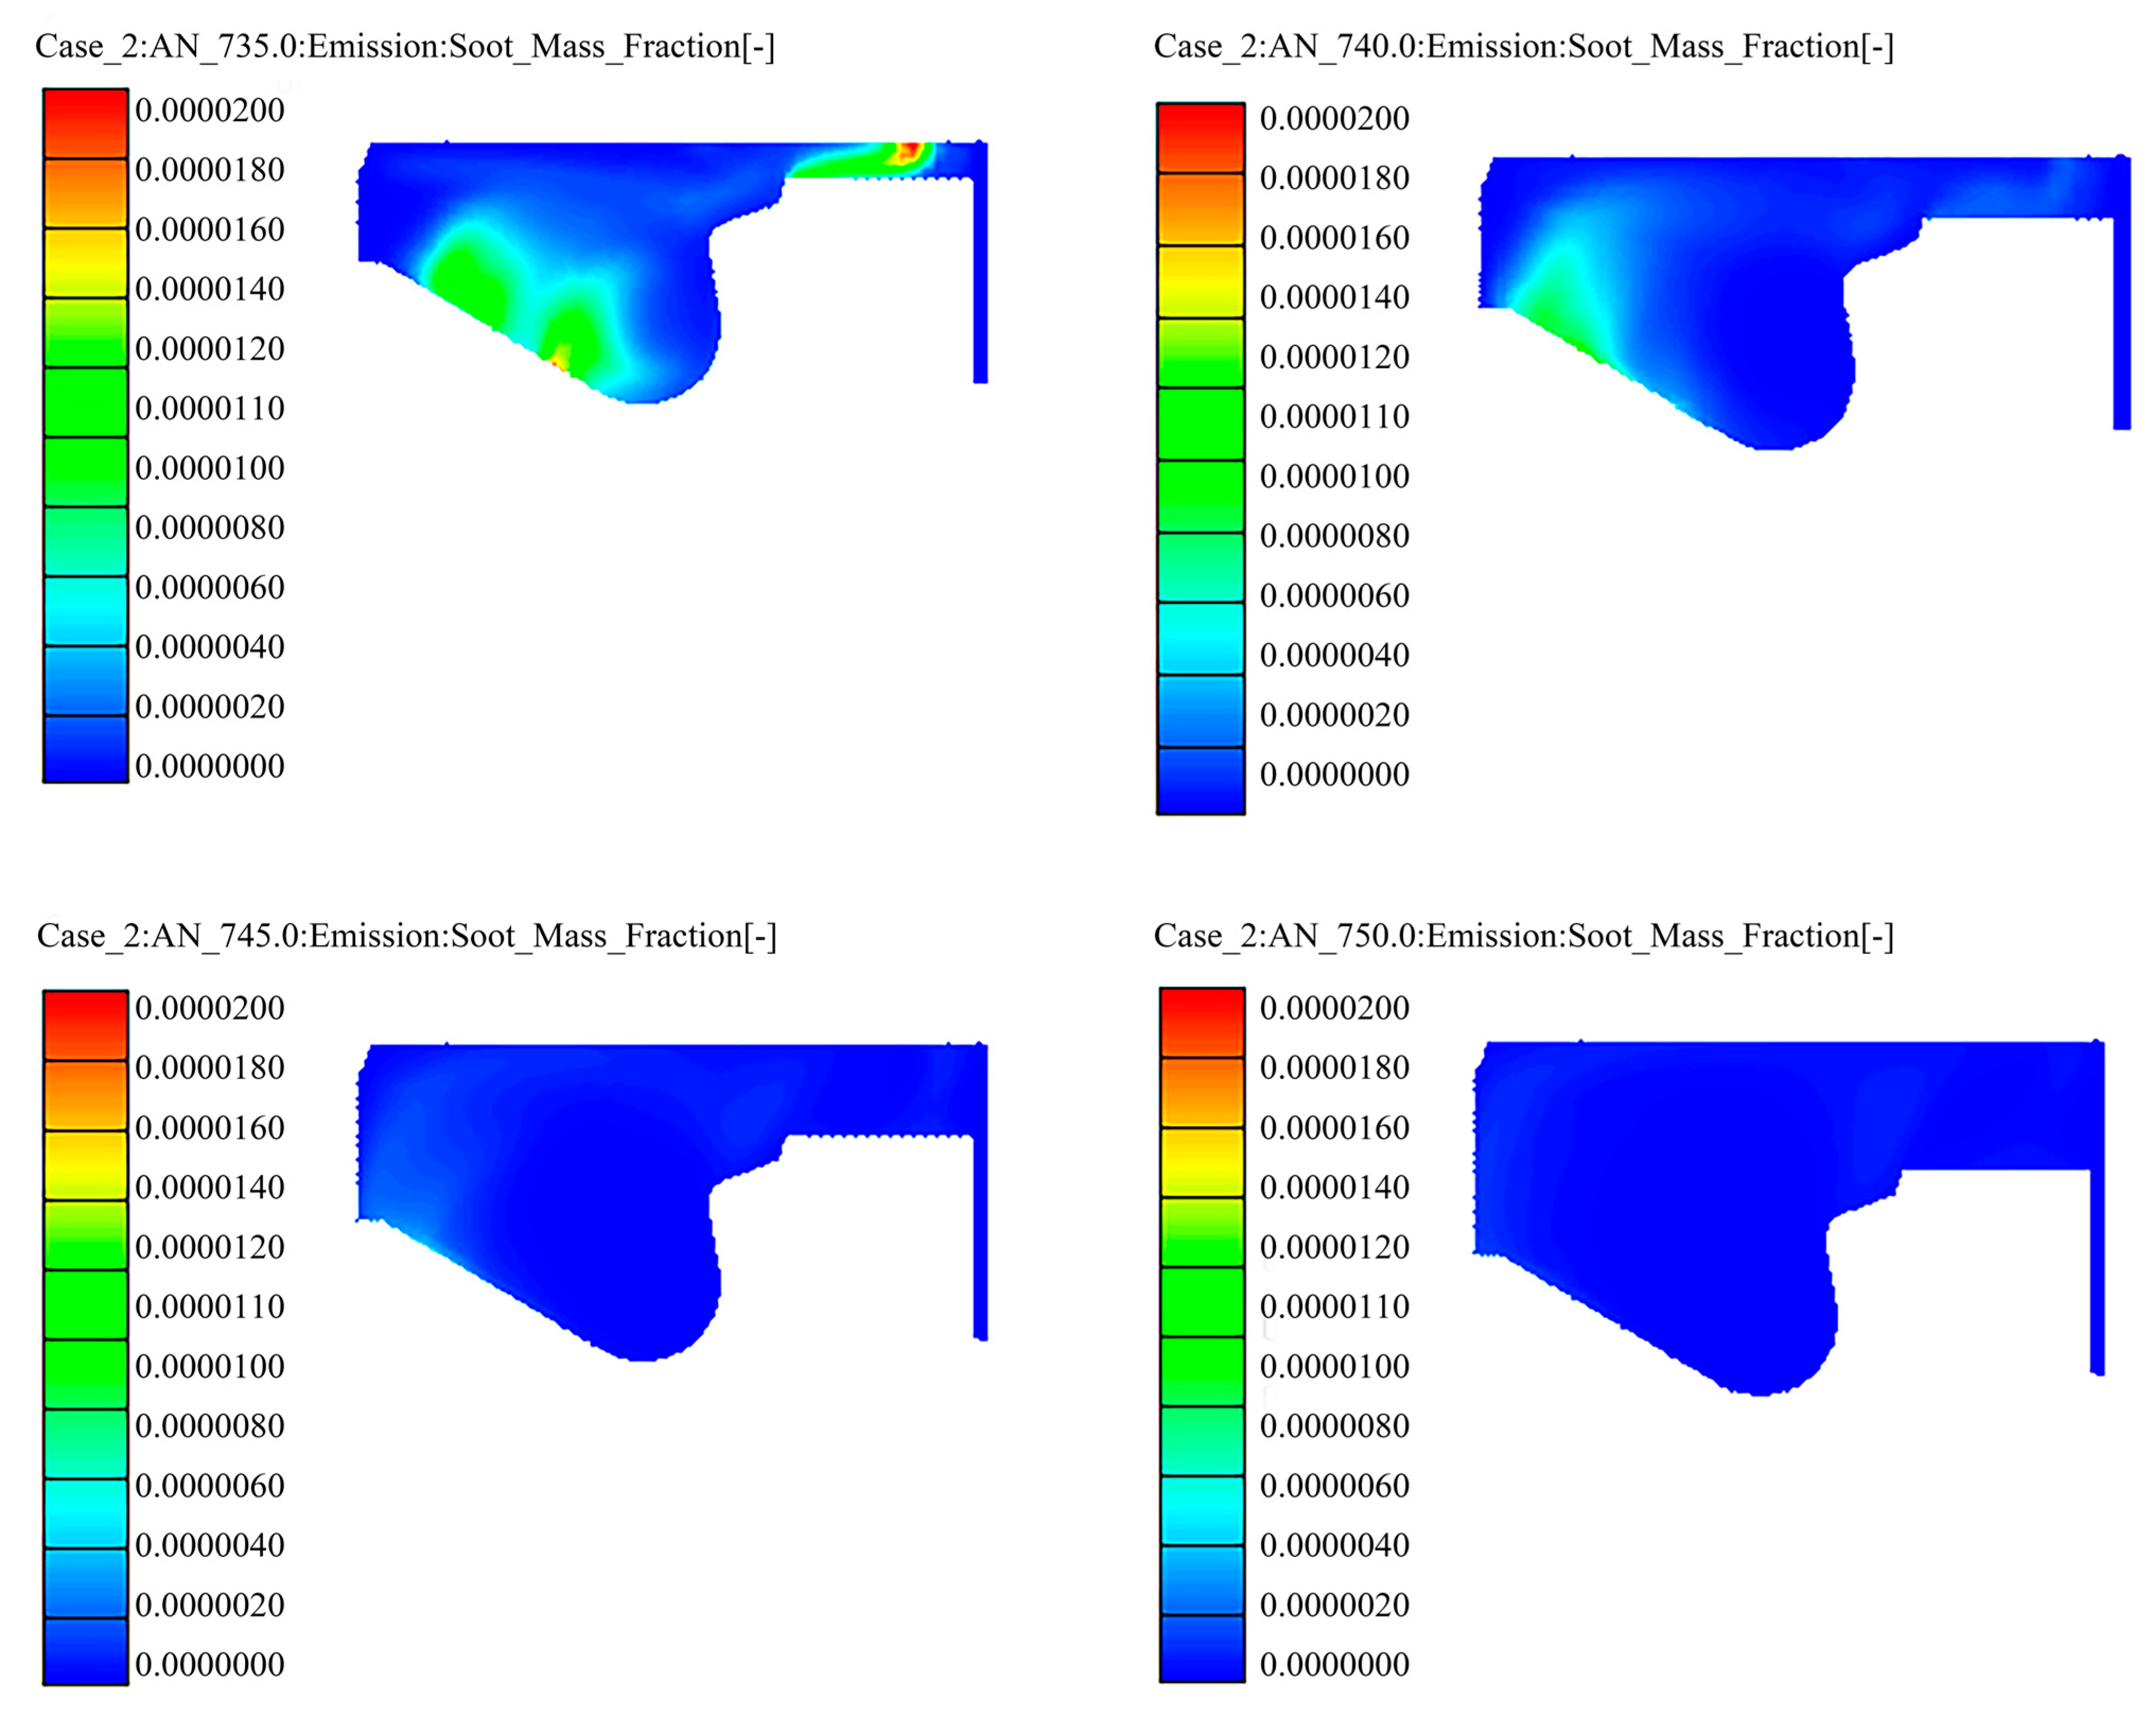
4.1.2. Soot Emission Characteristics

Figure 9 shows the variation in the average in-cylinder particle mass concentration obtained from numerical simulation for different blending ratios; the soot concentration in the figure is the in-cylinder concentration variation, based on the concentration at the time of exhaust valve opening, which is not consistent with the sampled gas volume of the concentration obtained from the actual test, so the results are only used for trend prediction. In the experimental results, under the condition that the engine speed is 1400 rpm and the BMEP is 1.1 MPa, the light absorption coefficients of particulate emission for P0, P10, and P15 are 0.1127, 0.0510, and 0.0117, respectively, and the corresponding mass fractions can be obtained by conversion to 0.0270 (mg/m3), 0.0122 (mg/m3), and 0.0028 (mg/m3), respectively. It is obvious that there is a positive correlation between the simulated and experimental results of particle mass concentration. The pattern is consistent with the experimental results. In general, the particle mass concentrations obtained from both experiments and simulations decrease significantly with the increase in the PODE blending ratio.
Figure 10 shows the trend of soot emission of different fuels at 1400 rpm and under different loads. Under the low engine load, the soot emission is low and the influence of the PODE blending ratio on the soot emission is slight. However, as the engine load increases, the PODE blending ratio on the soot emission becomes significant. For example, when the BMEP is 1.5 MPa, the soot emission of P0, P10, and P15 is 0.0935 (mg/m3), 0.0384 (mg/m3), and 0.0216 (mg/m3), respectively. Compared with the P0, the particle mass concentration of P10 decreases by 58.9%, while the particle mass concentration of P15 decreases by 76.9%. The main reasons for this trend are: (1) Under low load conditions, the fuel injection volume is less; whether it is diesel or PODE/diesel blends, the oxygen in the cylinder is sufficient during combustion, so the soot emissions are lower and very close. (2) Under medium- and high-load conditions, the in-cylinder temperature is higher, the increase in fuel injection volume is likely to cause local oxygen deficiency, and diesel soot emissions increase, but the self-restoring oxygen properties of PODE can improve the local oxygen deficiency environment. As a result, a high ratio of PODE blending can sharply reduce the soot emissions. (3) With the use of PODE as an additive to diesel fuel, the mass fraction and oxidative activity of the volatiles increase [34,35], so particle oxidation becomes easier, and the distribution shifts toward smaller particles. As a result, particle concentration decreases.
Figure 11 shows the development of the in-cylinder soot mass fraction distribution with crank angle when burning P15. It can be seen from the figure that the soot is formed at the early stage of fuel injection. In the process afterward, the soot increases sharply inside the edge of the fuel bundle as the diffusion flame develops, while the soot oxidizes and disappears rapidly at the edge of the fuel bundle. Overall, the soot mass fraction in the cylinder initially increases and then decreases rapidly along with the development of the fuel bundle. The variation in soot mass fraction in the cylinder with time shows that the effect of spraying has a great influence on the production and emission of soot.
As the blending ratio increases, the change in the physical properties of the blended fuel affects the spray characteristics, especially the cavitation phenomenon, which, in turn, has an impact on the soot emission characteristics. The comparison of gas-phase volume fractions of different fuels in the range of 0.6~1.0 for the cross-section at 0.2 mm from the nozzle inlet is shown in Figure 12. On the one hand, it can be seen that for different PODE/diesel blends, the saturated vapor pressure and the cavitation area of the exit section slightly rises with an increase in PODE blending ratio, and the cavitation area expands further, all of which are very beneficial to the formation of a good spray. On the other hand, due to the low blending ratio, there is no significant change in its gas phase volume fraction distribution from an overall perspective. To demonstrate that the cavitation zone is located within the P0, P10, and P15 envelopes, the cavitation flow region in the gas phase volume fraction in the range of 0.6 to 1.0 contours is enlarged for comparison purposes. For low-ratio blended fuels, as the blending ratio increases, the gas phase cavitation area increases slightly, which will not bring drastic changes to in-cylinder combustion, while the further expansion of the outlet cavitation area can reduce the spray particle size and make the combustion more adequate, which is conducive to improving the combustion process and soot emission of the engine.

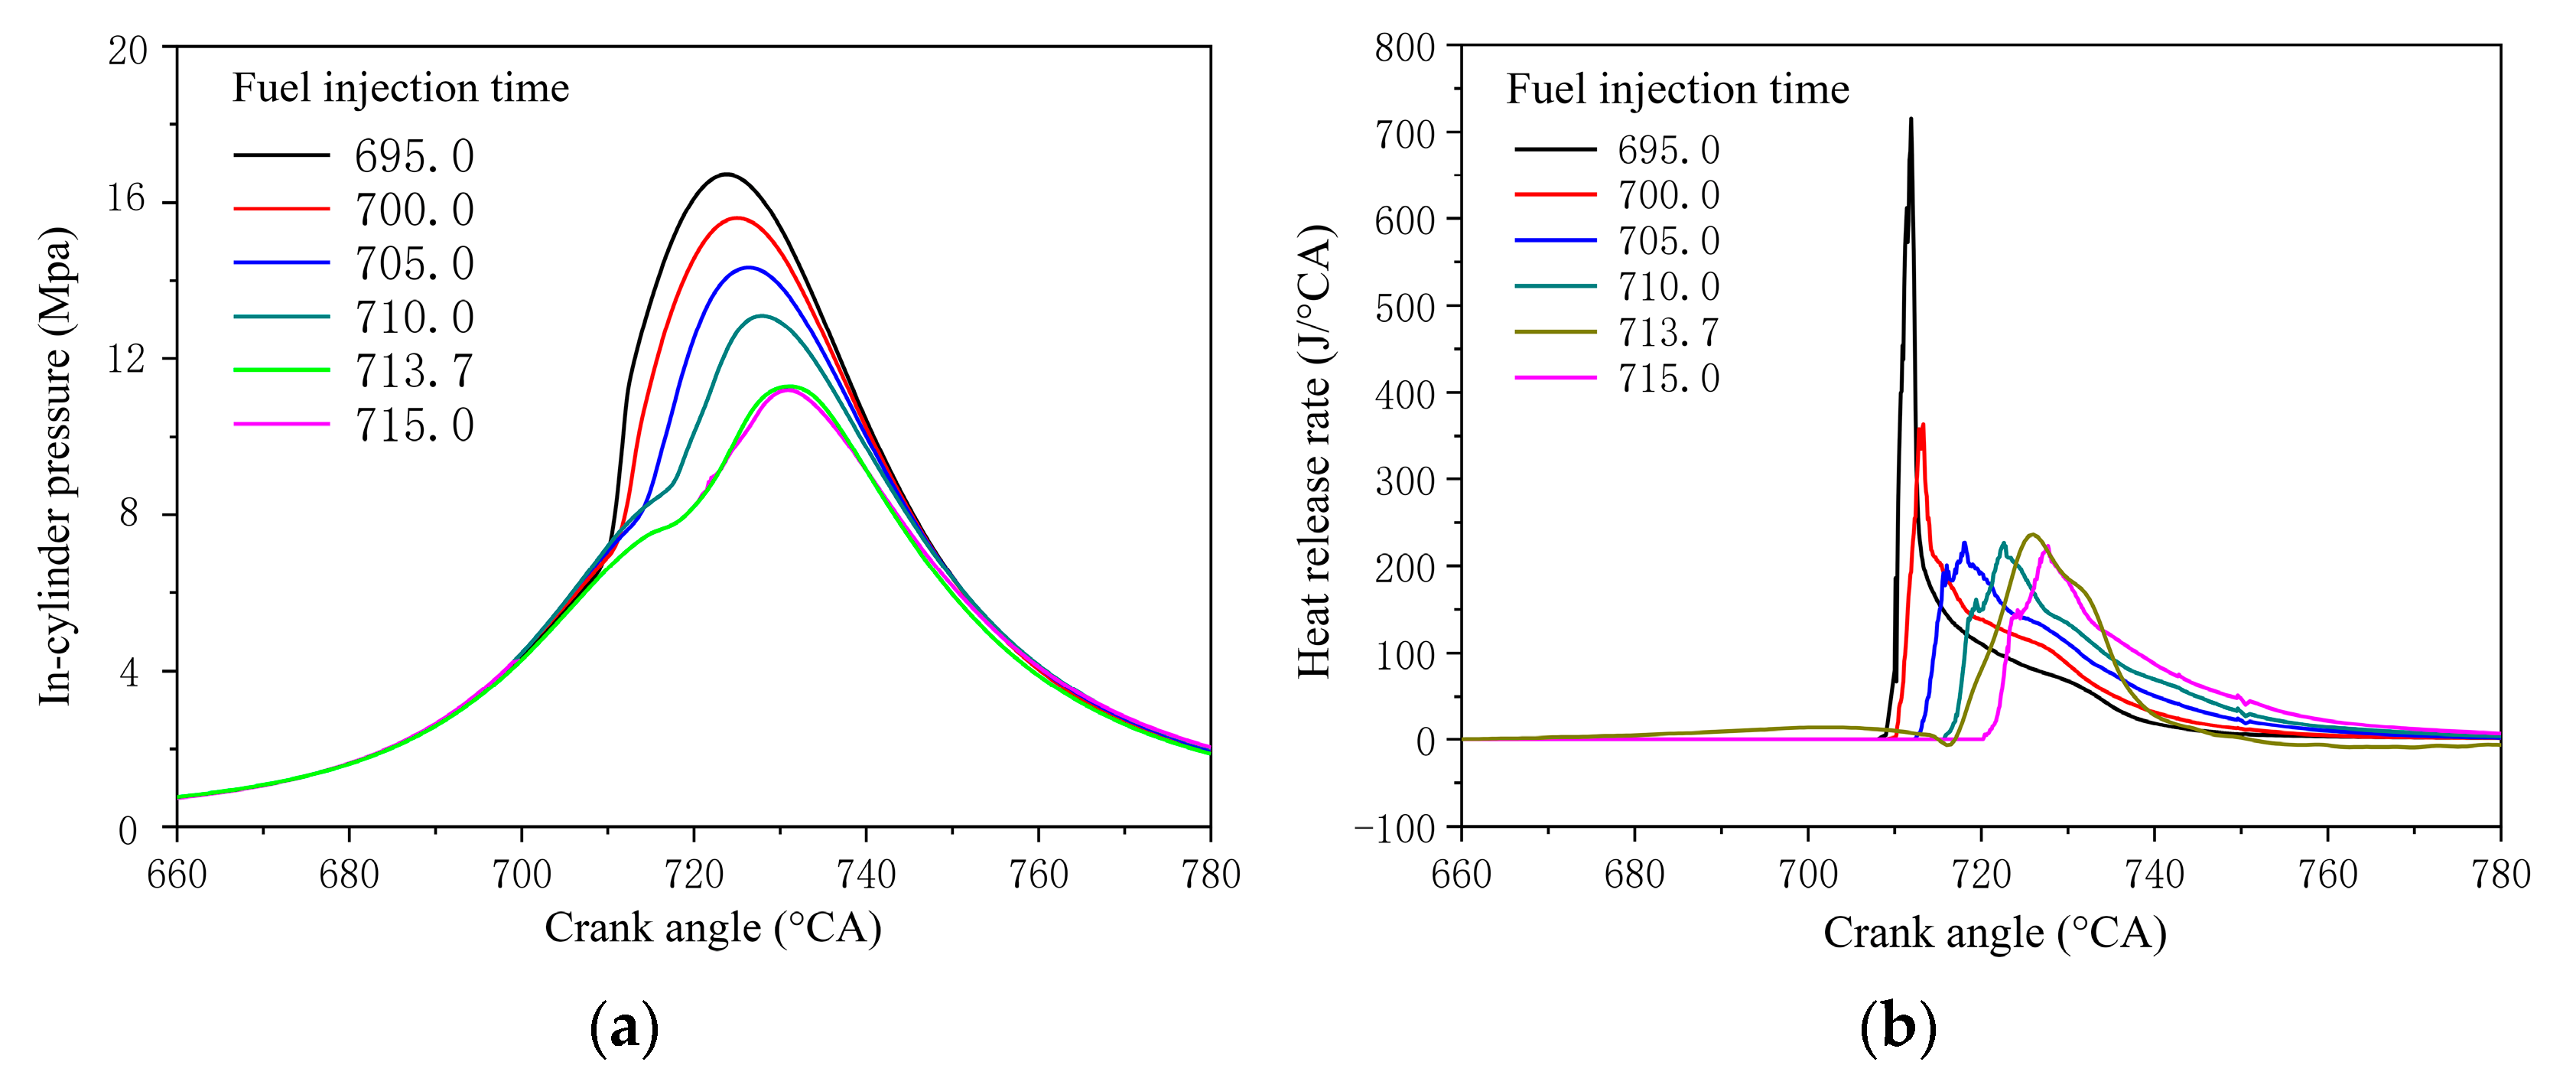
4.2. Effects of the Injection Timing on Engine Performance

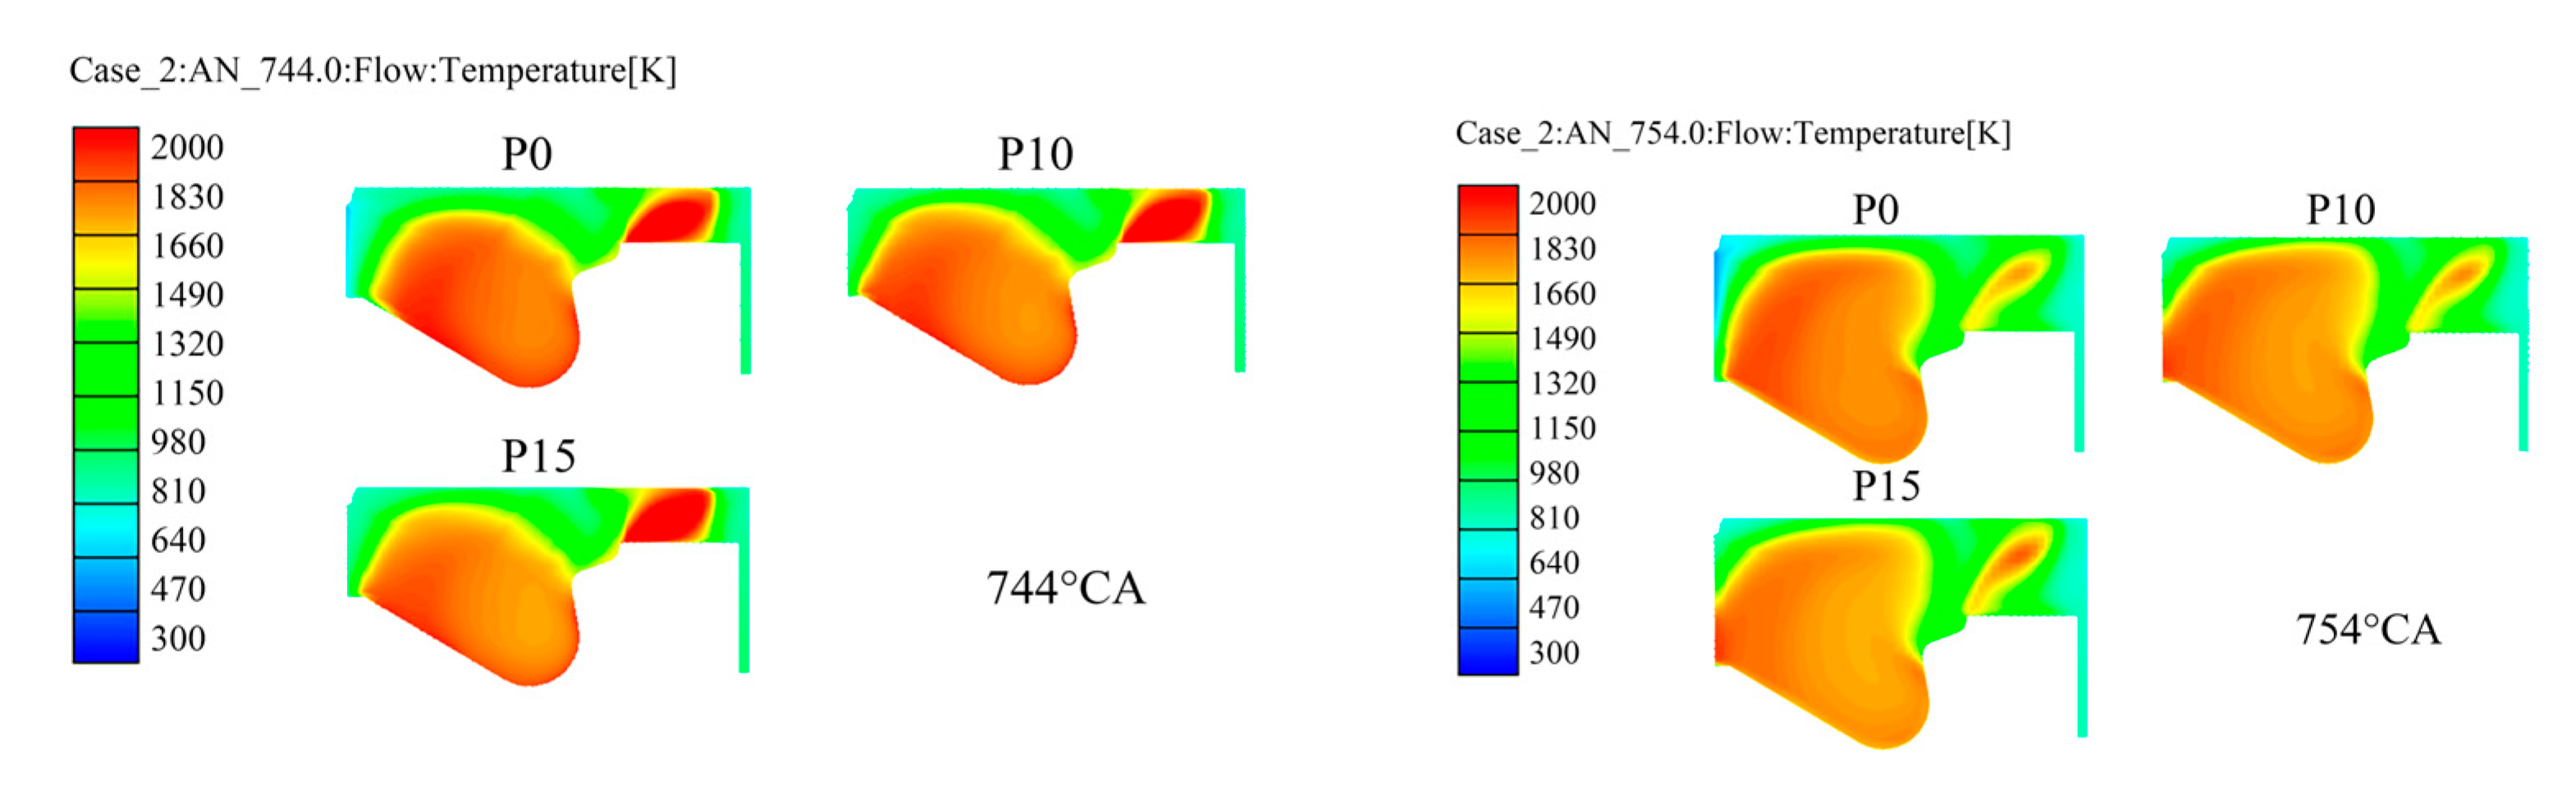
4.2.1. Combustion Characteristics

The influence of the injection timing on the average in-cylinder pressure and heat release rate when burning P15 are shown in Figure 13. The comparison of the spray development process for various injection timings is shown in Figure 14. For the injection timing at 696 °CA, 702 °CA, 708 °CA, and 714 °CA, each set of five figures corresponds to the spray development pattern in the interval of 20 crank angle degrees after the start of injection. As can be observed from Figure 13, the crank angle of the peak in-cylinder pressure advances as the fuel injection timing advances, which means the combustion phase advances. When the injection timing advances from 715 °CA to 695 °CA, the crank angle corresponding to the peak cylinder pressure advances from 730.9 °CA to 723.7 °CA. The peak heat release rate increases by 221.9% when the injection timing is at 695 °CA compared with that at 715 °CA, while the crank angle corresponding to the peak heat release rate advances from 728 °CA to 712 °CA. In the process of injection timing advancing from 715 °CA to 705 °CA, the peak heat release rate does not change much, while in the process of injection timing advancing from 705 °CA to 695 °CA, the peak heat release rate increases sharply. As can be seen from the slope of the heat release rate curve, the slope increases with the advance of the injection time, which means that the combustion process is accelerated. The reasons accounting for the changes above are as follows: the advance in the injection time will make the ignition delay period longer, and Figure 14 shows that when the injection timing is at 696 °CA, the longer ignition delay period makes the spray evaporate more quickly and the fuel droplets consumed more quickly. By contrast, the fuel in the form of a liquid bundle occupies a considerable amount of time when the injection timing is at 714 °CA, so it can be concluded that the evaporation of fuel rises comparatively and increases the volume of the mixture with the advance in injection timing, which results in more efficient and rapid combustion. However, the dramatic increase in peak heat release rate and heat release velocity caused by premature injection timing can cause the engine to run rough, thus deteriorating performance.

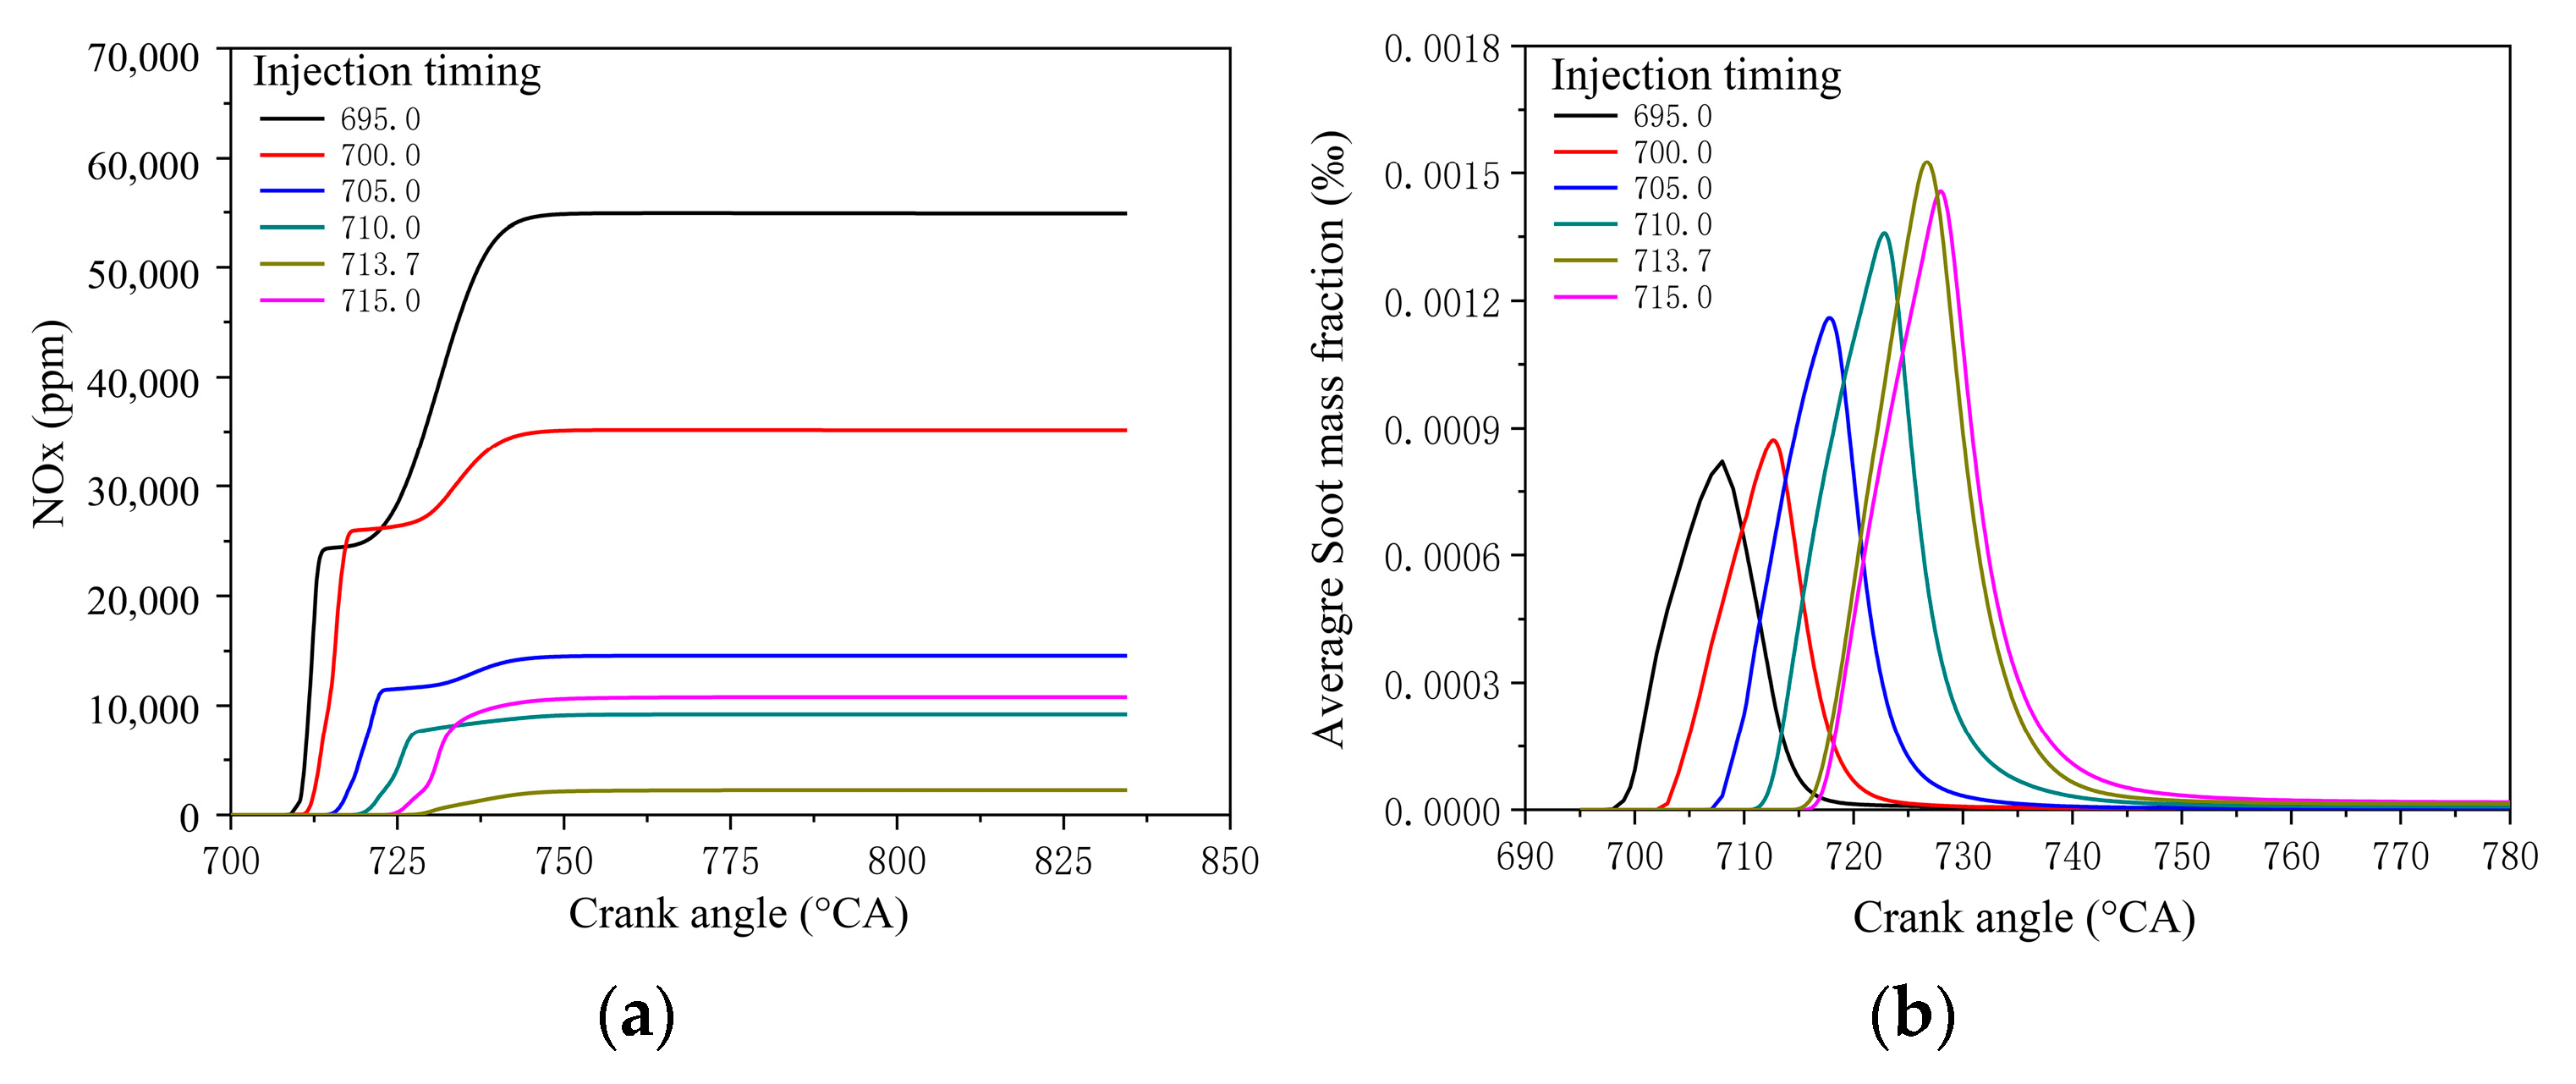
4.2.2. NOx and Soot Emission Characteristics

Figure 15 shows the trend of in-cylinder NO and soot mole fraction with the crank angle at different injection timings. Figure 16 shows the influence of injection timing on the average in-cylinder temperature. From Figure 15a, it can be found that the in-cylinder NO mole fraction is very low at the beginning of fuel injection, and it can be observed from Figure 16 that as the oxidation process proceeds, the area near the perimeter of the spreading flame forms a high-temperature environment, which is favorable for NO production. This period is also the time when the oxygen content inside the cylinder is relatively high. The longer the fuel and mixture remain in this zone, the higher the NOx concentration will be. The in-cylinder temperature constantly drops with injection timing delays, and the NOx emission follows suit. To be more specific, the peak in-cylinder temperature drops 16.8% when the injection timing delays from 695 °CA to 713.7 °CA. However, the in-cylinder temperature and NOx emission both marginally increase when the injection timing is delayed to 715 °CA, with the NOx emission being at its lowest for the injection timing at 713.7 °CA. Figure 15b illustrates that the peak soot mole fraction decreases significantly as the injection timing is advanced. However, the injection timing corresponding to the peak mole fraction is 713.7 °CA, indicating that the injection timing close to 713.7 °CA is most beneficial for the generation of soot precursors.
Figure 17 illustrates the NOx and soot emission characteristics at different fuel injection timings, and soot emission characteristics refer to the soot mole fraction at the moment of exhaust valve opening. The mole concentration of NOx is lowest near the injection timing at 713.7 °CA, and the mole concentration of soot is lowest near the injection timing at 700 °CA. The mole concentration of soot increases significantly with the delayed injection timing. When the fuel injection timing is 713.7 °CA, the corresponding actual soot emission is already very low. As can be seen in the shaded area of Figure 17, the engine emission performance is optimal when the injection timing is between 710 °CA and 715 °CA. In summary, when the blending ratio of PODE is around 15% and the injection timing is between 710 °CA and 715 °CA, the emissions are within the optimal range.

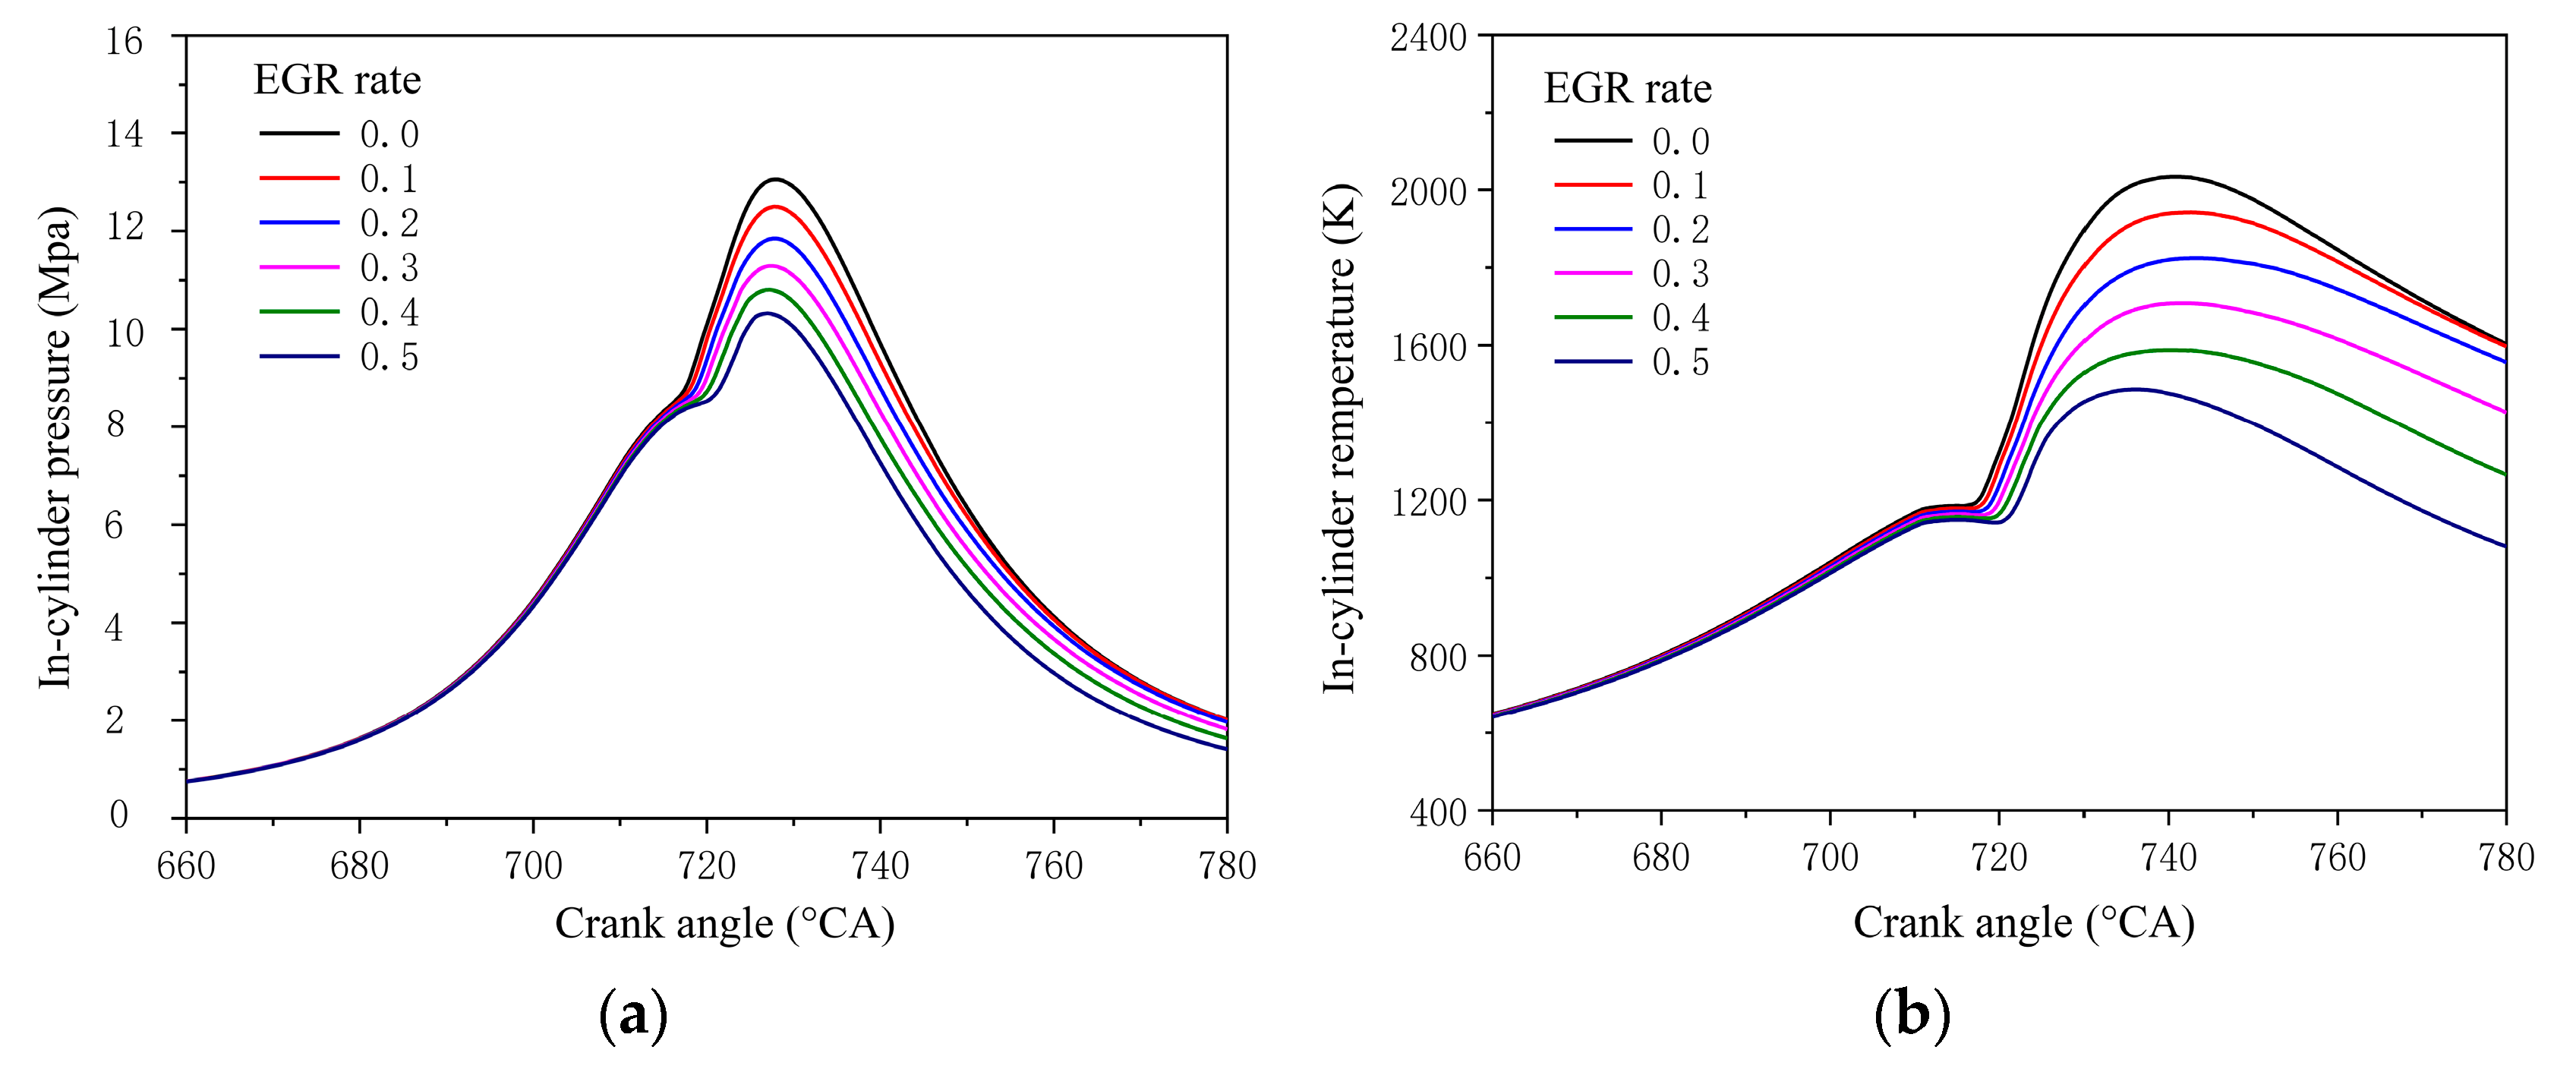
4.3. Effects of the EGR Rate on Engine Performance

4.3.1. Combustion Characteristics

Figure 18 shows the average in-cylinder pressure and average in-cylinder temperature under different EGR rates. It can be seen that as the EGR rate increases from 0.0 to 0.5, the maximum in-cylinder pressure decreases by 20.8%, and the in-cylinder temperature decreases by 27.1%. Although increasing the EGR rate can effectively reduce the in-cylinder temperature and control NOx emission, an excessive EGR rate will deteriorate the engine combustion process and reduce the power. Therefore, the EGR rate needs to be controlled according to the requirements of the engine operating conditions within a reasonable range.

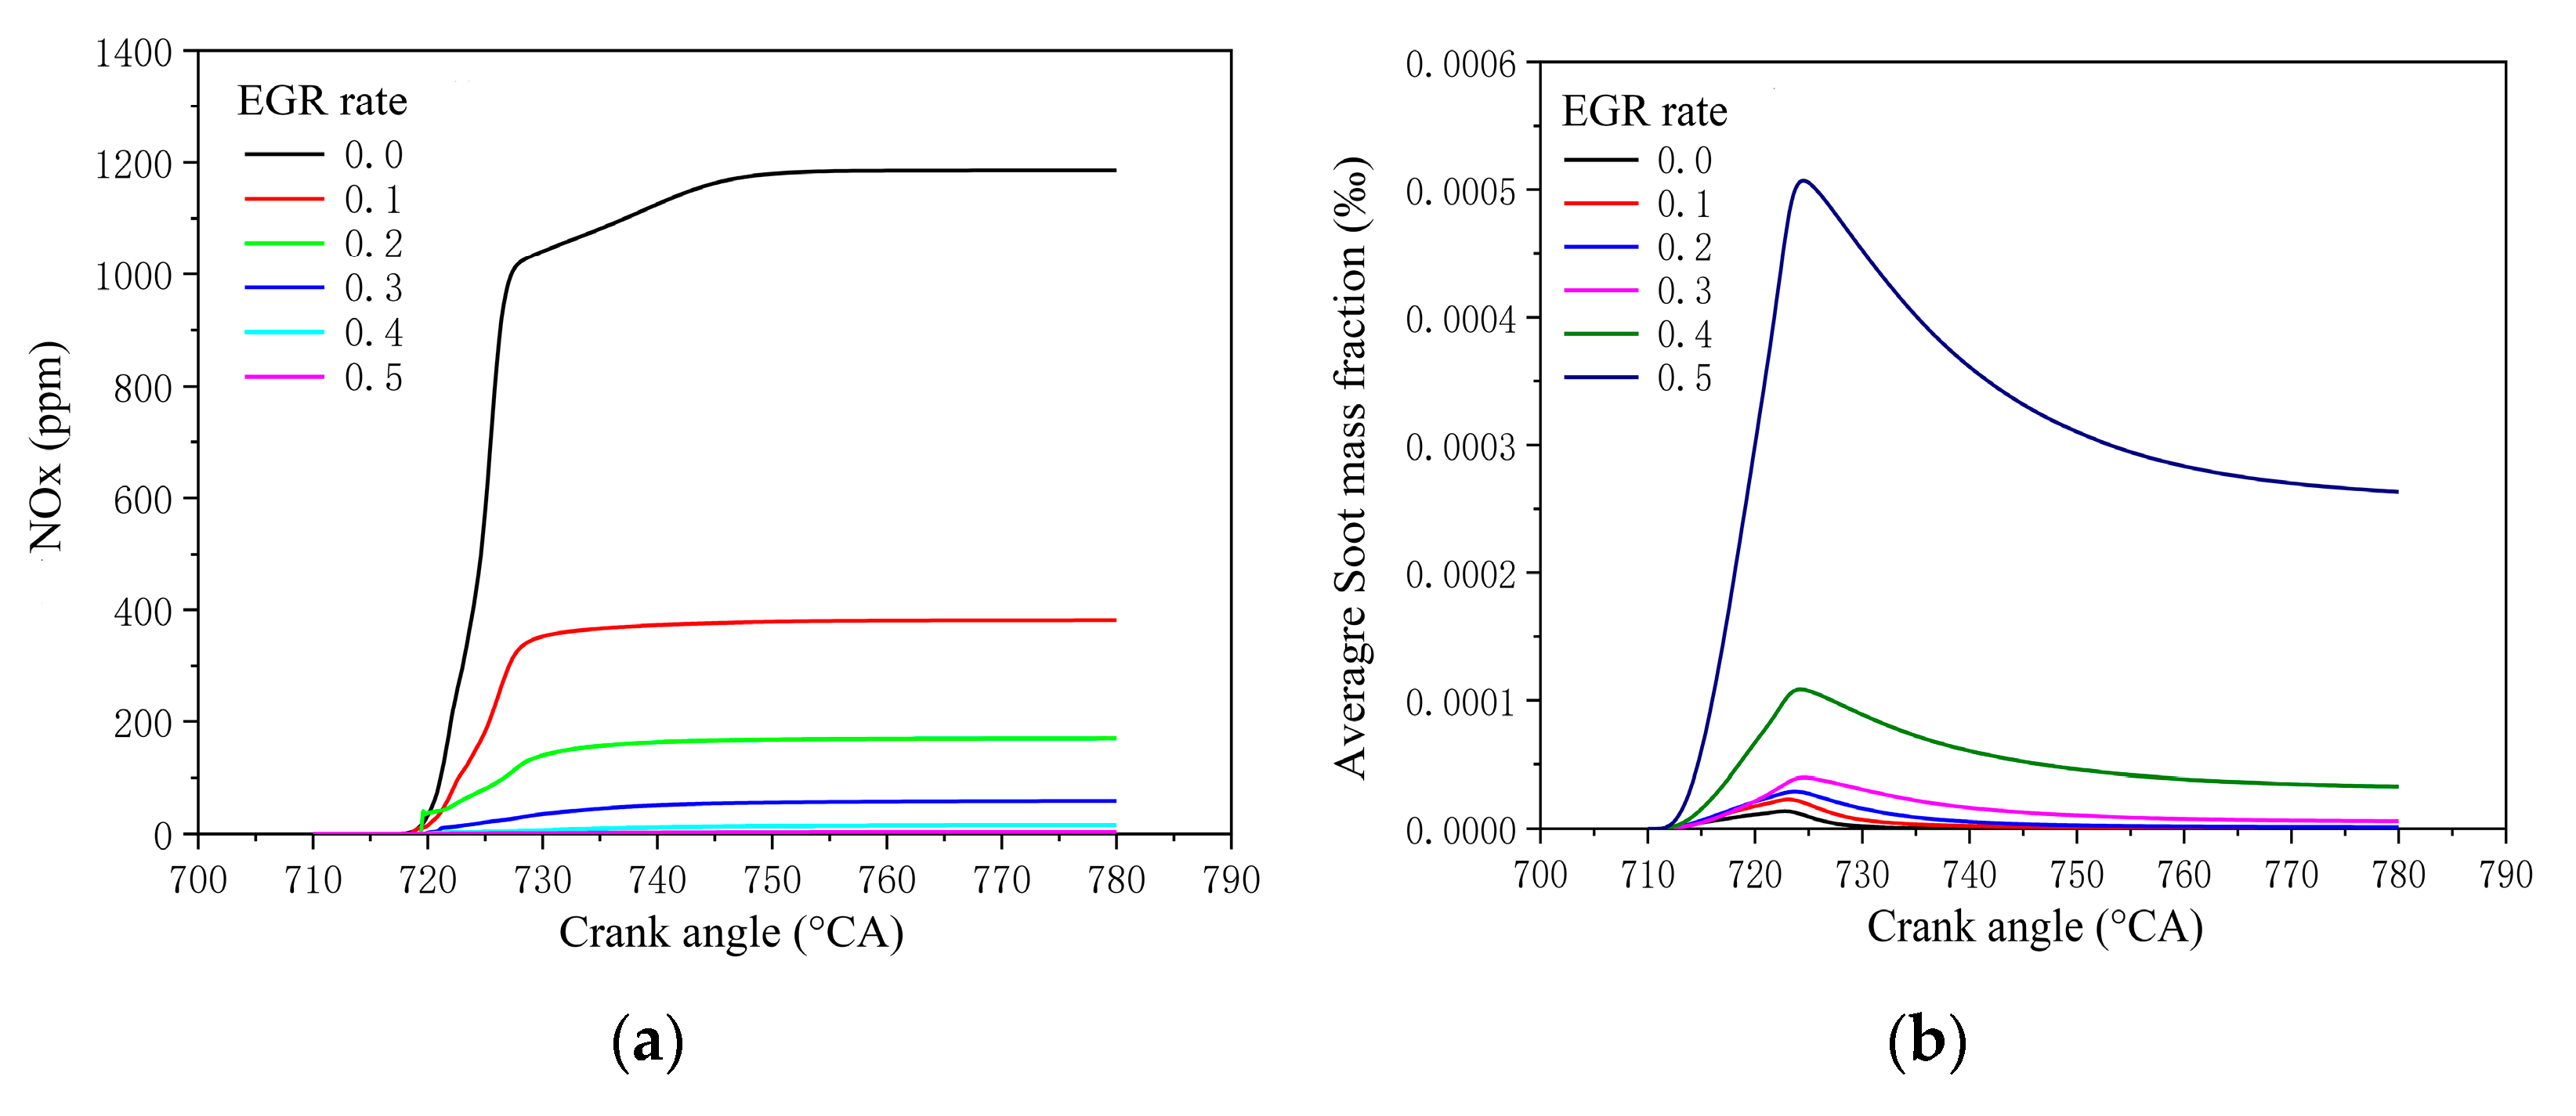
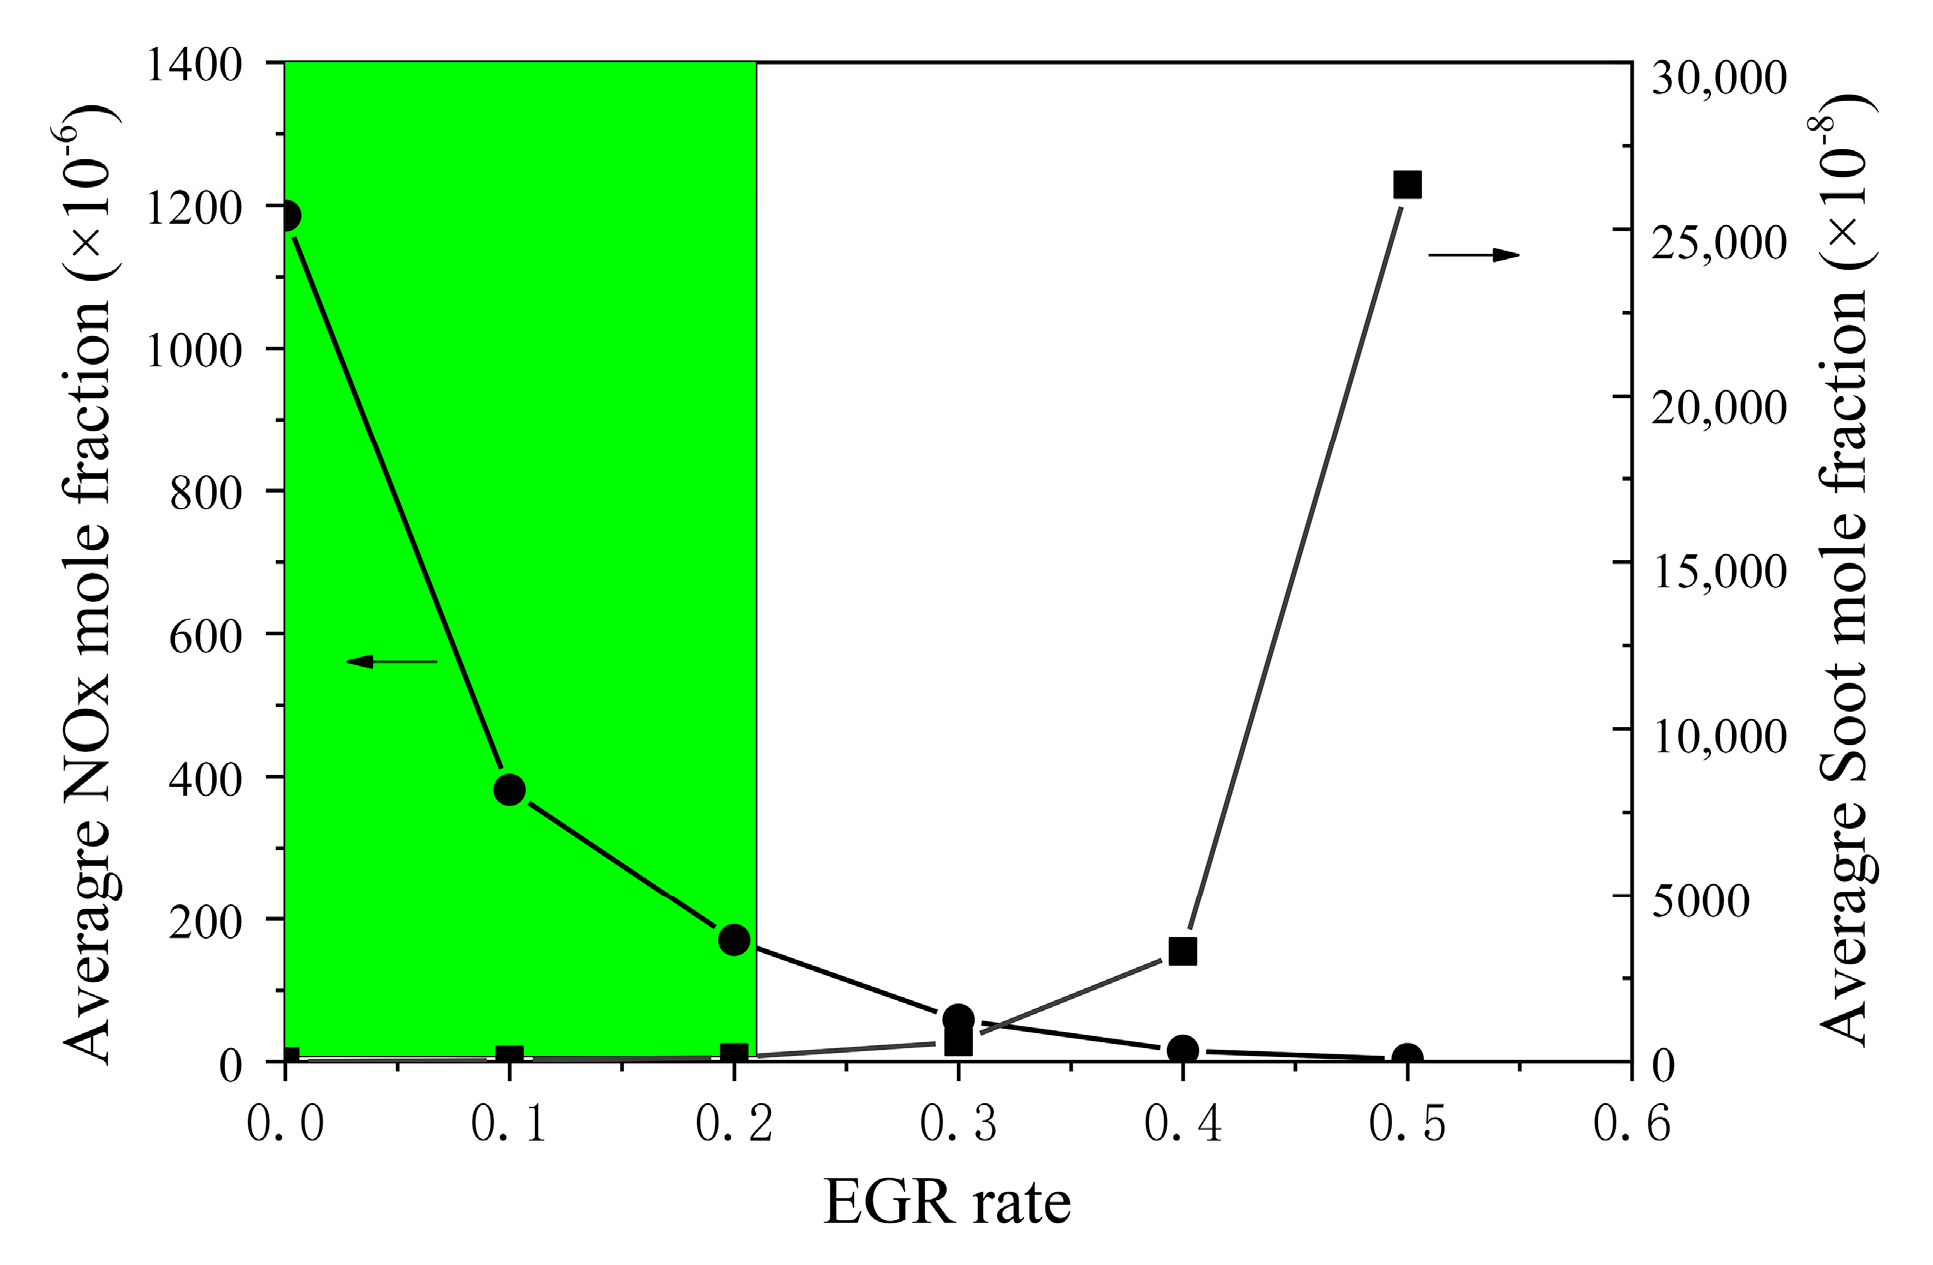
4.3.2. NOx and Soot Emission Characteristics

Figure 19a,b show the variation in the average mole fraction of NO and soot in the cylinder with the crank angle, respectively, and similarly, soot emission refers to the soot mole fraction at the moment of exhaust valve opening. It can be clearly seen that NOx emission decreases significantly when the EGR rate increases, but soot emission increases slightly at the beginning and then increases substantially. Figure 20 shows the emission characteristics of NOx and soot under different EGR rates. Excessive EGR rates significantly reduce NOx emissions, but also result in higher soot emissions and a deteriorated combustion process. In short, an EGR rate in the range of 0.0 to 0.2 has a better comprehensive emission performance, according to a consideration of both NOx and soot emissions.

5. Conclusions

In this study, experiments and three-dimensional simulations using a novel cavitation model are conducted to investigate the influence of the blending ratios of diesel and PODE, the injection strategy, and EGR rate on the combustion and emissions characteristics. The spray model used in this paper considers the influence of fuel properties on the spray characteristics. The numerical results show that the numerical model can predict the combustion process and emissions with acceptable accuracy. The numerical model created in this paper can accurately compute the change in in-cylinder pressure when burning various PODE/diesel blends, and can properly predict NOx emission by comparison with actual test data.
(1) The self-restoring oxygen properties of PODE can efficiently minimize soot emissions while improving combustion. However, it can also raise in-cylinder temperatures and increase NOx emissions.
(2) With the increase in blending ratio, soot emissions do not vary much at low loads, but decrease significantly at high loads. Under high-load conditions, with the increase in blending ratio, the property of self-restoring oxygen, the increase in oxidation activity of PODE/diesel blends, and the improvement of atomization effect help to reduce soot emissions.
(3) With the advance of injection timing, the peak in-cylinder pressure and peak heat release rate increase. This is mainly because an earlier injection timing causes a longer ignition delay, which can improve fuel evaporation, and the increased volume of the mixture results in more rapid combustion. Meanwhile, with the delay of injection timing, the soot emissions increase, but the NOx emissions decrease initially and then increase when the injection timing is delayed to 710 °CA. The numerical simulation shows that when the blending ratio of PODE is around 15% and the injection timing is between 710 °CA and 715 °CA, the emissions performances are optimal.
(4) The in-cylinder combustion and emission characteristics are significantly influenced by the EGR rate. When the EGR rate increases, the maximum in-cylinder pressure and temperature decrease significantly, which helps to reduce NOx emissions. However, an excessive EGR rate will result in higher soot emissions and a deteriorated combustion process. Therefore, an EGR rate in the range of 0.0 to 0.2 has a better comprehensive emission performance.
The optimized injection time and EGR rate provides an important reference value for developing and improving the PODE engine. This numerical model can be used in the future to optimize the key parameters of the PODE engine under different usage scenarios and operating conditions.

Author Contributions

Conceptualization, Y.W. and S.L.; Formal analysis, Y.W.; Investigation, C.Z. and S.L.; Data curation, C.Z., Y.Z. and D.H.; Writing—original draft, Y.W.; Writing—review & editing, Z.Z.; Funding acquisition, Y.W. All authors have read and agreed to the published version of the manuscript.

Funding

This research was funded by the National Natural Science Foundation of China (Grant No. 52176128) and the Shaanxi Provincial Key R&D Program (Grant No. 2019ZDLGY15-10).

Institutional Review Board Statement

Not applicable.

Informed Consent Statement

Not applicable.

Data Availability Statement

Not applicable.

Conflicts of Interest

The authors declare no conflict of interest.

References

  1. Kober, T.; Schiffer, H.W.; Densing, M.; Panos, E. Global energy perspectives to 2060—WEC’s World Energy Scenarios 2019. Energy Strategy Rev. 2020, 31, 100523. [Google Scholar] [CrossRef]
  2. Olabi, A.G.; Maizak, D.; Wilberforce, T. Review of the regulations and techniques to eliminate toxic emissions from diesel engine cars. Sci. Total. Environ. 2020, 748, 141249. [Google Scholar] [CrossRef]
  3. Barro, C.; Parravicini, M.; Boulouchos, K.; Liati, A. Neat polyoxymethylene dimethyl ether in a diesel engine; part 2: Exhaust emission analysis. Fuel 2018, 234, 1414–1421. [Google Scholar] [CrossRef]
  4. Arcoumanis, C.; Bae, C.; Crookes, R.; Kinoshita, E. The potential of di-methyl ether (DME) as an alternative fuel for compression-ignition engines: A review. Fuel 2008, 87, 1014–1030. [Google Scholar] [CrossRef]
  5. Duraisamy, G.; Rangasamy, M.; Govindan, N. A comparative study on methanol/diesel and methanol/PODE dual fuel RCCI combustion in an automotive diesel engine. Renew. Energy 2020, 145, 542–556. [Google Scholar] [CrossRef]
  6. Liu, H.; Ma, X.; Li, B.; Chen, L.; Wang, Z.; Wang, J. Combustion and emission characteristics of a direct injection diesel engine fueled with biodiesel and PODE/biodiesel fuel blends. Fuel 2017, 209, 62–68. [Google Scholar] [CrossRef]
  7. Liu, J.; Yang, J.; Sun, P.; Gao, W.; Yang, C.; Fang, J. Compound combustion and pollutant emissions characteristics of a common-rail engine with ethanol homogeneous charge and polyoxymethylene dimethyl ethers injection. Appl. Energy 2019, 239, 1154–1162. [Google Scholar] [CrossRef]
  8. Liu, H.; Wang, Z.; Li, Y.; Zheng, Y.; He, T.; Wang, J. Recent progress in the application in compression ignition engines and the synthesis technologies of polyoxymethylene dimethyl ethers. Appl. Energy 2019, 233–234, 599–611. [Google Scholar] [CrossRef]
  9. Liu, J.; Wang, L.; Wang, P.; Sun, P.; Liu, H.; Meng, Z.; Zhang, L.; Ma, H. An overview of polyoxymethylene dimethyl ethers as alternative fuel for compression ignition engines. Fuel 2022, 318, 123582. [Google Scholar] [CrossRef]
  10. Baranowski, C.J.; Bahmanpour, A.M.; Kröcher, O. Catalytic synthesis of polyoxymethylene dimethyl ethers (OME): A review. Appl. Catal. B Environ. 2017, 217, 407–420. [Google Scholar] [CrossRef]
  11. Liu, H.; Wang, Z.; Wang, J.; He, X.; Zheng, Y.; Tang, Q.; Wang, J. Performance, combustion and emission characteristics of a diesel engine fueled with polyoxymethylene dimethyl ethers (PODE3-4)/diesel blends. Energy 2015, 88, 793–800. [Google Scholar] [CrossRef]
  12. Liu, J.; Wang, H.; Li, Y.; Zheng, Z.; Xue, Z.; Shang, H.; Yao, M. Effects of diesel/PODE (polyoxymethylene dimethyl ethers) blends on combustion and emission characteristics in a heavy duty diesel engine. Fuel 2016, 177, 206–216. [Google Scholar] [CrossRef]
  13. Mario, M.; Renata, P.; Leonardo, P.; Salvatore, F. Emission Performance of Neat and Blended Polyoxymethylene Dimethyl Ethers in an Old Light-Duty Diesel Car; SAE International: Warrendale, PA, USA, 2013. [Google Scholar]
  14. Renata, P.; Nicola Del, G.; Mario, M.; Chiara, G.; Carlo, B.; Leonardo, P. Combustion Behaviour and Emission Performance of Neat and Blended Polyoxymethylene Dimethyl Ethers in a Light-Duty Diesel Engine; SAE International: Warrendale, PA, USA, 2012. [Google Scholar]
  15. Lumpp, B.; Rothe, D.; Pastötter, C.; Lämmermann, R.; Jacob, E. Oxymethylene ethers as diesel fuel additives of the future. MTZ Worldw. Emagazine 2011, 72, 34–38. [Google Scholar] [CrossRef]
  16. Chen, H.; Su, X.; Li, J.; Zhong, X. Effects of gasoline and polyoxymethylene dimethyl ethers blending in diesel on the combustion and emission of a common rail diesel engine. Energy 2019, 171, 981–999. [Google Scholar] [CrossRef]
  17. Liu, J.; Sun, P.; Huang, H.; Meng, J.; Yao, X. Experimental investigation on performance, combustion and emission characteristics of a common-rail diesel engine fueled with polyoxymethylene dimethyl ethers-diesel blends. Appl. Energy 2017, 202, 527–536. [Google Scholar] [CrossRef]
  18. Liu, H.; Wang, X.; Wu, Y.; Zhang, X.; Jin, C.; Zheng, Z. Effect of diesel/PODE/ethanol blends on combustion and emissions of a heavy duty diesel engine. Fuel 2019, 257, 116064. [Google Scholar] [CrossRef]
  19. Wang, T.; Liu, J.; Sun, P.; Ji, Q.; Gao, W.; Yang, C. Influence of injection parameters on combustion, gaseous emissions and particle size distribution of a CRDI diesel engine operating with PODE/diesel blends. Fuel 2020, 281, 118733. [Google Scholar] [CrossRef]
  20. Zhang, Z.; Liu, X.; Liu, H.; Wu, Y.; Zaman, M.; Geng, Z.; Jin, C.; Zheng, Z.; Yue, Z.; Yao, M. Effect of soybean oil/PODE/ethanol blends on combustion and emissions on a heavy-duty diesel engine. Fuel 2021, 288, 119625. [Google Scholar] [CrossRef]
  21. Barro, C.; Parravicini, M.; Boulouchos, K. Neat polyoxymethylene dimethyl ether in a diesel engine; part 1: Detailed combustion analysis. Fuel 2019, 256, 115892. [Google Scholar] [CrossRef]
  22. LeBlanc, S.; Sandhu, N.; Yu, X.; Han, X.; Wang, M.; Tjong, J.; Zheng, M. An Investigation Into OME3 on a High Compression Ratio Engine. In Proceedings of the Internal Combustion Engine Division Fall Technical Conference, American Society of Mechanical Engineers, Virtual, Online, 4–6 November 2020; Volume 84034. [Google Scholar]
  23. Li, D.; Liu, S.; Wei, Y.; Liang, R.; Tang, Y. Numerical investigation on transient internal cavitating flow and spray characteristics in a single-hole diesel injector nozzle: A 3D method for cavitation-induced primary break-up. Fuel 2018, 233, 778–795. [Google Scholar] [CrossRef]
  24. Lambert, J.H. Photometria Sive de Mensura et Gradibus Luminis. Sumptibus Vidvae; Nabu Press: Charleston, SC, USA, 1760. [Google Scholar]
  25. Li, D.; Gao, Y.; Liu, S.; Ma, Z.; Wei, Y. Effect of polyoxymethylene dimethyl ethers addition on spray and atomization characteristics using a common rail diesel injection system. Fuel 2016, 186, 235–247. [Google Scholar] [CrossRef]
  26. Launder, B.; Sharma, B.I. Application of the energy-dissipation model of flow near a spinning disc. Lett. Heat Mass Transfer 1974, 1, 131–138. [Google Scholar] [CrossRef]
  27. Liu, A.B.; Mather, D.; Reitz, R.D. Modeling the Effects of Drop Drag and Breakup on Fuel Sprays. SAE Trans. 1993, 102, 83–95. [Google Scholar]
  28. Naber, J.D.; Reitz, R.D. Modeling Engine Spray/Wall Impingement. SAE Trans. 1988, 97, 118–140. [Google Scholar]
  29. Pinchon, P. Three Dimensional Modelling of Combustion in a Prechamber Diesel Engine. SAE Trans. 1989, 98, 1202–1223. [Google Scholar]
  30. Colin, O.; Benkenida, A. The 3-Zones Extended Coherent Flame Model (Ecfm3z) for Computing Premixed/Diffusion Combustion. Oil Gas Sci. Technol. 2006, 59, 593–609. [Google Scholar] [CrossRef]
  31. Zeldvich, Y.B. The oxidation of nitrogen in combustion and explosions. J. Acta Physicochim. 1946, 21, 577. [Google Scholar]
  32. Tuovinen, H. Application of Flamelet Chemistry Model to Vitiated Methane-Air Diffusion Flames; Lund University: Lund, Sweden, 1992. [Google Scholar]
  33. Gao, W.; Liu, J.; Sun, P.; Wang, T.; Chen, L.; Wang, B.; Kang, T.; Liu, S.; Shi, K. Numerical simulation on NO and soot formation process of a diesel engine with polyoxymethylene dimethyl ethers-diesel blend fuel. Energy Sources Part A RecoveryUtil. Environ. Eff. 2020, 1–16. [Google Scholar] [CrossRef]
  34. Liu, J.; Liu, Z.; Wang, L.; Wang, P.; Sun, P.; Ma, H.; Wu, P. Effects of PODE/diesel blends on particulate matter emission and particle oxidation characteristics of a common-rail diesel engine. Fuel Process. Technol. 2021, 212, 106634. [Google Scholar] [CrossRef]
  35. Tian, J.; Cai, Y.; Shi, Y.; Cui, Y.; Fan, R. Effect of Polyoxymethylene Dimethyl Ethers/Diesel Blends on Fuel Properties and Particulate Matter Oxidation Activity of A Light-Duty Diesel Engine. Int. J. Automot. Technol. 2019, 20, 277–288. [Google Scholar] [CrossRef]
Figure 1. Engine Layout.
Applsci 12 12556 g001
Figure 2. Grid diagram of eight-hole injector nozzle.
Applsci 12 12556 g002
Figure 3. Variation in spray tip penetration distance with time.
Applsci 12 12556 g003
Figure 4. Comparison between simulation and experimental results of spray shape.
Applsci 12 12556 g004
Figure 5. Mesh model of the combustion chamber.
Applsci 12 12556 g005
Figure 6. Comparison of simulation and experiment results of in-cylinder pressure with different PODE blending ratios.
Applsci 12 12556 g006
Figure 7. NOx emission characteristics of different PODE/diesel blends under different loads.
Applsci 12 12556 g007
Figure 8. Variation in temperature field in the cylinder of fuel with different PODE blending ratio.
Applsci 12 12556 g008
Figure 9. Variation in the average mass concentration of particles in the cylinder with different PODE blending ratios.
Applsci 12 12556 g009
Figure 10. Soot emission characteristics of different PODE/diesel blends under different loads.
Applsci 12 12556 g010
Figure 11. In-cylinder soot mass fraction distribution when burning P15.
Applsci 12 12556 g011aApplsci 12 12556 g011b
Figure 12. Comparison of gas phase volume fractions of different fuels in the range of 0.6~1.0 for the cross-section at 0.2 mm from the nozzle inlet.
Applsci 12 12556 g012
Figure 13. Average in-cylinder pressure and heat release rate. (a) In-cylinder pressure. (b) Heat release rate.
Applsci 12 12556 g013
Figure 14. Spray development process with different fuel injection timings.
Applsci 12 12556 g014aApplsci 12 12556 g014b
Figure 15. Trend of the average mole fraction of NO and soot in the cylinder with the crank angle. (a) NO mole fraction. (b) Soot mole fraction.
Applsci 12 12556 g015
Figure 16. In-cylinder temperature.
Applsci 12 12556 g016
Figure 17. Emission characteristics of NOx and soot at different injection timings.
Applsci 12 12556 g017
Figure 18. Average in-cylinder pressure and average in-cylinder temperature. (a) In-cylinder pressure. (b) In-cylinder temperature.
Applsci 12 12556 g018
Figure 19. Variation in the average mole fraction of NO and soot in the cylinder with the crank angle. (a) NO mole fraction. (b) Soot mole fraction.
Applsci 12 12556 g019
Figure 20. Emission characteristics of NOx and soot under different EGR rates.
Applsci 12 12556 g020
Table 1. Properties of components in PODE with n ranging from 1 to 5.
ComponentMelting Point (°C)Boiling Point (°C)Cetane NumberDensity
(g/mL@25 °C)
Viscosity
(MPa s@25 °C)
Low Calorific Value (MJ/kg)Oxygen Content (wt%)
PODE1−10542300.860.5822.442.1
PODE2−69.7105630.980.6420.645.3
PODE3−42.5156671.031.0519.447.1
PODE4−9.8202761071.7518.748.2
PODE518.3242901.112.2418.148.5
Table 2. Engine specification.
ItemsSpecification
ModelYC6G270-30
Typesix-cylinder, w type
Bore × Stroke (mm × mm)112 × 132
Compression ratio17.5
Displacement (L)7.8
Fuel injector modelCRIN-138 Eight-hole fuel injector
Connection Rod (mm)210.82
IVO/IVC (℃A)13.5 BTDC/38.5 ABDC
EVO/EVC (℃A)56.5 BBDC/11.5 ATDC
Rated power/kW @ rpm199 @ 2200
Maximum torque/Nm @ rpm1080 @ (1400–1600)
Table 3. Properties of diesel and diesel/PODE blends.
FuelP0P10P15
Density @ 293 K (kg/m3)850872883
Viscosity @ 293 K (MPa s)4.733.373.18
Surface tension (MN/m)23.8524.6224.79
Cetane number50.152.253.3
Calorific value (kJ/kg)42,90041,02039,950
Table 4. Summary of models used in the combustion calculation process.
Mathematical Physics ModelType
Turbulence modelstandard k-ε [26]
Atomization model3D Coupling method [23]
Secondary crushing modelWave [27]
Bump wall modelWalljet0 [28]
Spontaneous combustion modelAuto-Ignition [29]
Combustion modelECFM-3Z [30]
NOx emission modelExtended Zeldovich [31]
Soot emission modelLund Flamelet Model [32]
Table 5. Detailed fuel-injection-related parameters for high-load conditions at 1400 rpm.
ParameterValue
Engine Speed (rpm)1400
BMEP (MPa)1.1
FuelP0P10P15
Injection quantity (mg/cycle)492.62512.79525.57
Injection start point (°CA)713.9713.8713.7
Injection duration (°CA)11.611.912.4
Single-hole injection quantity (mg/cycle)10.2610.6810.95
Table 6. Comparison of NOx emission simulation and test results for different PODE/diesel blends.
NOx Emission Mole Fraction (×10−6)P0P10P15
Test results191821892200
Simulation results195422702308
Error value1.84%3.57%4.68%
Publisher’s Note: MDPI stays neutral with regard to jurisdictional claims in published maps and institutional affiliations.

