Article

Numerical Investigation of a Novel Bottom-Up Assisted Pressure Drive Process in Oil Sands Reservoirs with Shale Barriers

1
Key Laboratory of Unconventional Oil & Gas Development, China University of Petroleum (East China), Ministry of Education, Qingdao 266580, China
2
School of Petroleum Engineering, China University of Petroleum (East China), Qingdao 266580, China
3
BitCan Geosciences & Engineering Inc., Calgary, AB T2A 2L5, Canada
*
Author to whom correspondence should be addressed.
Appl. Sci. 2022, 12(22), 11666; https://doi.org/10.3390/app122211666
Submission received: 31 October 2022 / Revised: 14 November 2022 / Accepted: 14 November 2022 / Published: 17 November 2022
(This article belongs to the Section Applied Industrial Technologies)

Abstract

:
Steam-assisted gravity drainage (SAGD) is widely applied to recover bitumen and heavy oil resources. Reservoir heterogeneity, especially the presence of shale barriers, continues to challenge the performance of SAGD. A novel enhanced oil recovery process, bottom-up assisted pressure drive, is proposed to improve the oil production in the reservoirs with shale barriers. In this work, numerical simulation is applied to investigate the feasibility of a bottom-up assisted pressure drive process. A reservoir model with typical oil sand reservoir properties is developed considering shale barriers. The performance of bottom-up assisted pressure drive and SAGD is compared under the same reservoir conditions, including steam chamber development, oil production rate, cumulative oil production, and the pressure difference between injector and production. The inherent mechanisms associated with the bottom-up assisted pressure drive are also well understood and confirmed. In the bottom-up assisted pressure drive, a flat steam chamber is developed from the bottom of the reservoir in the early stage of the process and grows upward with the injection of steam. The large volume of the steam chamber and the huge contact area between steam and bitumen contribute to a high oil production rate. The peak oil production rate in the bottom-up assisted pressure drive is approximately three times that in the SAGD process. The cumulative oil production in the bottom-up assisted pressure drive is 20% higher than that in the SAGD process. The effect of shale barriers on bottom-up assisted pressure drive is less, indicating one advantage of this novel process over SAGD in oil sands reservoirs with shale barriers. The pressure difference in the bottom-up assisted pressure drive is greater than that in the SAGD process. The pressure drive is another mechanism for improving oil production. The calculated net present value (NPV) in the bottom-up assisted pressure drive process is 27% higher than that in the SAGD process. This is mainly attributed to the high oil production rate in the early stage of the process and high cumulative oil production. The simulation study in this work provides technical support for the future field applications of this novel recovery process.

1. Introduction

Steam-assisted gravity drainage (SAGD) is widely applied to recover bitumen and heavy oil resources [1,2]. In a typical SAGD configuration, a pair of horizontal wells are positioned near the bottom of a reservoir. The steam is injected through the upper horizontal well, while heated oil and condensed water are produced through the lower production well [3]. With the continuous injection of the steam, the steam chamber grows vertically and then laterally. Uniform development of the steam chamber is crucial to SAGD performance. The economics of a SAGD project is closely related to the geological parameters, such as reservoir thickness, vertical permeability, oil saturation, and porosity [4,5,6]. Increasing the reservoir heterogeneity continues to challenge the application of SAGD technology in bitumen or heavy oil formations. Shale barriers are one of the common heterogeneous features in oil sand reservoirs [7,8,9,10,11] and are reported in various SAGD projects [12,13,14,15]. These shale barriers usually consist of alternate pairs of sand and mudstone [16,17], resulting in low permeability [18]. Therefore, the presence of shale barriers in oil sand reservoirs tends to impede the development of steam chambers and adversely affects SAGD performance [19].
A considerable number of studies have been conducted to understand the impact of shale barriers on SAGD performance. Because of the limited information regarding shale barriers in reservoirs, extensive numerical studies have been performed considering shale locations and shale characteristics. Shin and Choe (2009) generated various shale barriers in a two-dimensional simulation model. They examined the sizes and the vertical locations of the shale barriers [20]. The shale barriers were either positioned above the injection or between the injector and the producer. It was found that the vertical distance of shale barriers was essential to affect SAGD production. Zhang et al. (2021) established a numerical model containing shale barriers to evaluate the SAGD process, including steam chamber evolution, production evaluation, and economic evaluation. In real reservoirs, the information on shale barriers is usually unknown. Ma et al. (2018) integrated artificial intelligence and production data to interpret shale characteristics [21]. Similarly, Kumar and Hassanzadeh (2021) applied machine learning to investigate the impact of random shale barriers [22].
Except for numerical investigation, experimental efforts have also been made to understand the effects of shale layers on SAGD performance. Yang and Butler (1992) were among the first to design physical experiments considering reservoir heterogeneity [23]. They provided an initial understanding of the effects of shale barriers on SAGD performance. In recent years, researchers have extended the previous work and considered multiple shale barriers in the physical experimental model. Huang et al. (2019) experimentally investigated the steam chamber and production characteristics of SAGD, considering multiple barrier layers [24,25]. Multiple impermeable and parallel shale barriers were considered in the physical sand pack model. Different flow characteristics were identified with variations in shale location and length. Similarly, Wei et al. (2022) performed multiple experiments to study the effect of different distributed interlayers on SAGD performance. Steam chamber development was well illustrated based on the temperature data measured by thermocouples [26]. They provided guidance to place wells to minimize the effects of shale barriers on SAGD performance.
Although previous researchers investigated the effects of shale layers on SAGD performance [16,24,26], limited effective strategies have been provided to improve the production performance in reservoirs with multiple shale layers. Li et al. (2011) investigated the potential injection strategies to reduce the impact of the shale barrier on the SAGD process. They suggested that multicomponent solvent injection could improve oil production with a lower cumulative energy/oil ratio in the reservoir with shale barrier issues [27]. Kim et al. proposed undulating shale breaking with SAGD, in which undulating drilling is applied to break the shale [19]. In this method, extra injectors are required to facilitate thermal communication. This would increase the operation and economic difficulties. In recent years, multilateral wells have been proposed as a potential technique to lower the negative effect of shale barriers and improve steam sweep efficiency [12,28]. Drilling the multilateral well would increase the operating costs of the process. Yuan et al. (2015) proposed bottom-up assisted pressure drive as a novel technique to recover heavy oil or oil sand resources. With the combination of gravity drainage and pressure drive, bottom-up assisted pressure drive has the potential to improve oil production in reservoirs with shale barriers [29]. Compared to the aforementioned strategies, bottom-up assisted pressure drive utilizes conventional horizontal wells. Extra drilling or completion is not required, and the operating strategies are similar to that in the SAGD process. The potential advantages of this novel technique attract great industrial interest. A detailed investigation is required to further understand the inherent mechanisms and evaluate the feasibility of the bottom-up assisted pressure drive process.
In this work, the bottom-up assisted pressure drive process is numerically evaluated as a novel technique to develop oil sand reservoirs with shale barriers. Typical mechanisms of the bottom-up assisted pressure drive process are illustrated in detail. A numerical model considering multiple shale barriers is developed to simulate the bottom-up assisted pressure drive process. Based on the numerical simulation results, a comprehensive comparison between bottom-up assisted pressure drive and SAGD processes is performed, including steam chamber development, oil production, cumulative steam oil ratio, and net present value (NPV). The advantages and feasibility of the bottom-up assisted pressure drive process are well addressed.

2. Bottom-Up Assisted Pressure Drive Mechanism

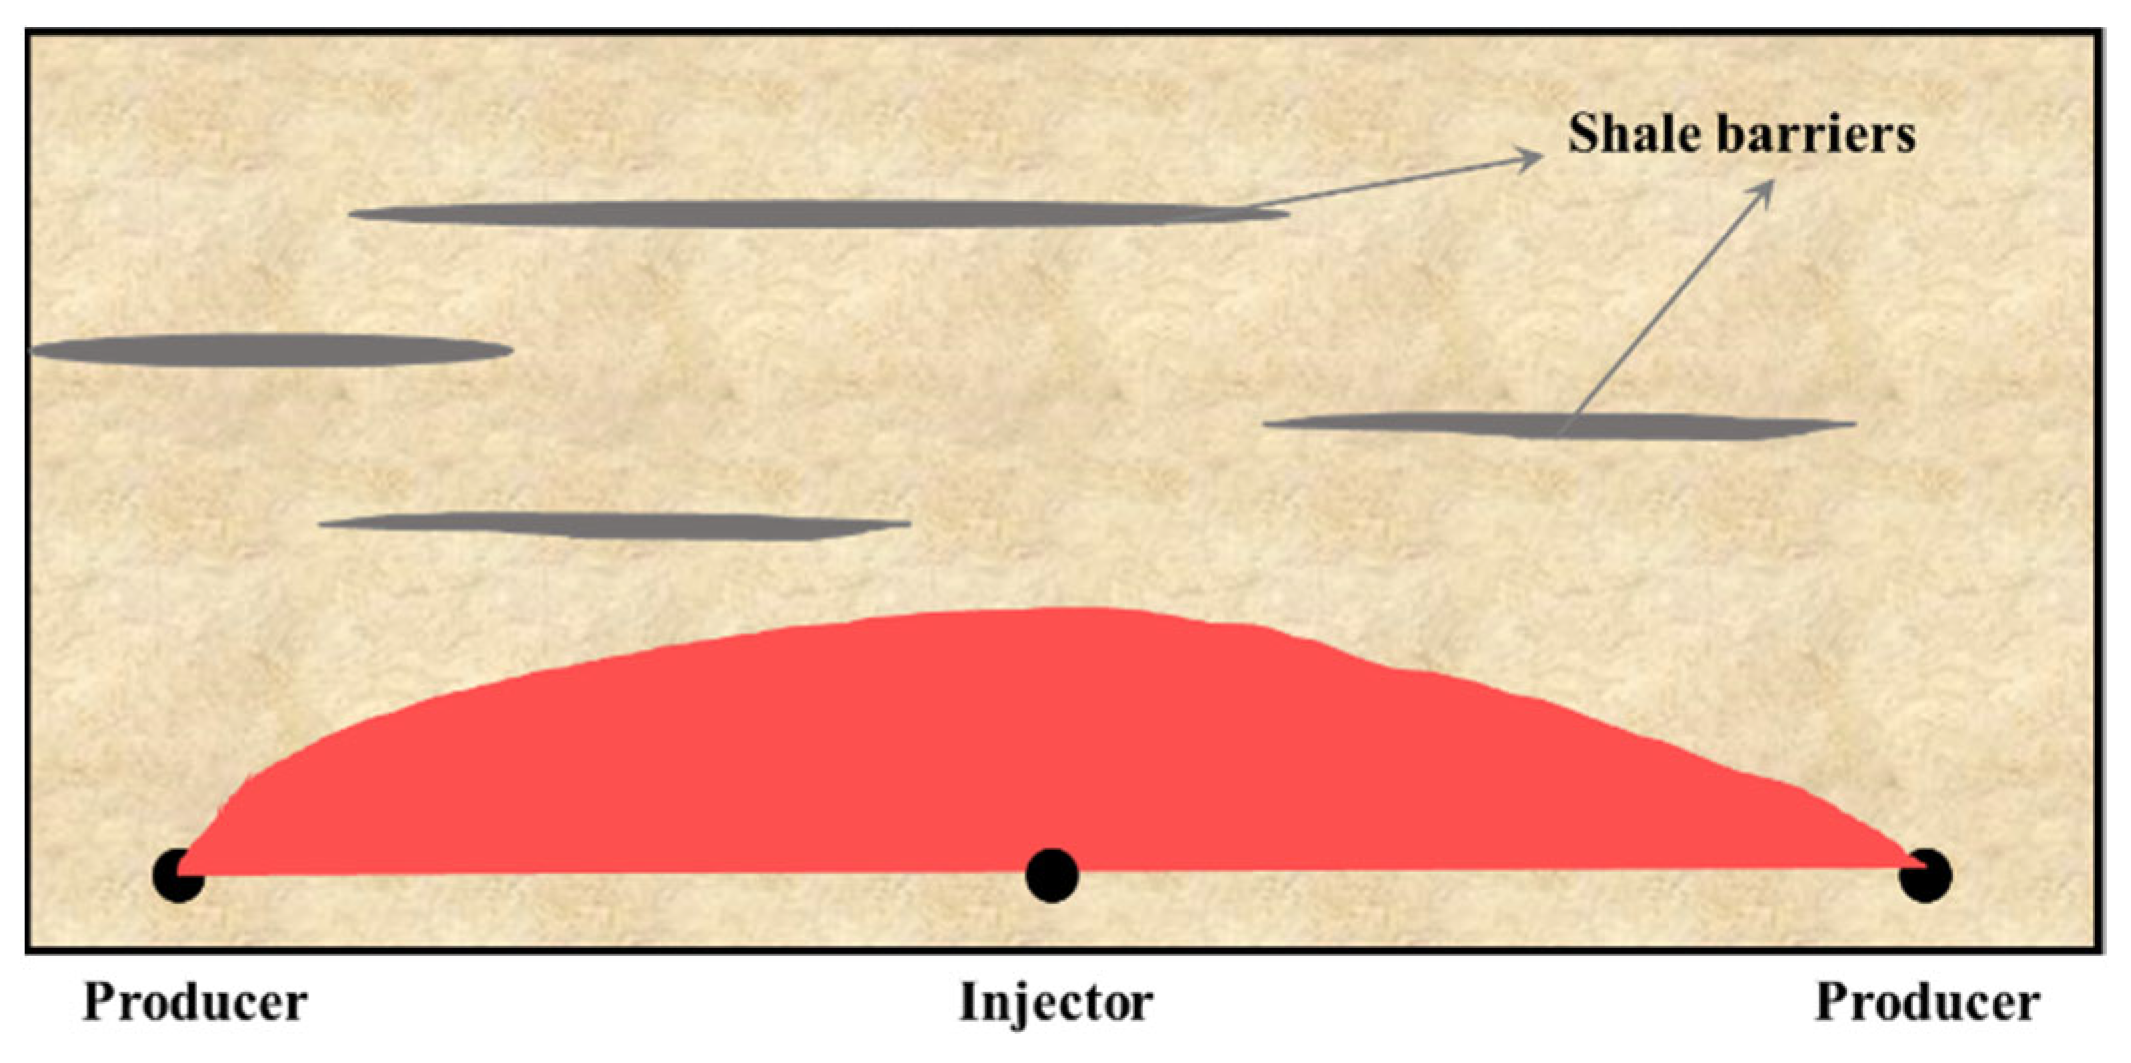
2.1. Process Description

A schematic of the bottom-up assisted pressure drive is presented in Figure 1. In this process, a group of horizontal wells are positioned near the bottom of the reservoir. Injectors and producers are placed alternatively. The distance between the injector and the producer can be varied based on the reservoir conditions. Before the steam injection, a high mobility zone is generated to build the communication between the injector and producer (Fan et al., 2017; Sun et al., 2021). Subsequently, steam injection is initiated. The operating strategies are similar to those in the SAGD process. High-quality steam (steam quality higher than 95%) is introduced in the reservoir. Different from the SAGD process, a flat steam chamber is developed in the bottom-up assisted pressure drive process. With the combination of gravity drainage and pressure drive, condensed water and heated oil are produced through the producer.
By applying the bottom-up assisted pressure drive, a few main advantages over the conventional SAGD process are expected. As shown in Figure 1, a flat steam chamber is developed from the bottom in the early stage of the process. Because of the long distance between the injector and producer, a relatively large contact area between the steam and crude oil is established, leading to high oil production. Furthermore, the pressure drive is the main driving force in the bottom-up assisted pressure drive process. Due to the large distance between the injector and the producer, a relatively large pressure difference may be applied. Compared with the gravity force in the SAGD process, the pressure drive is more energetic, further improving oil production. The aforementioned features associated with the bottom-up assisted pressure drive process exhibit great potential in reservoirs with shale barriers, thin formation, or reservoirs with top water. In this study, the authors focus on the application of bottom-up assisted pressure drive in reservoirs with shale barriers.

2.2. Dilation (Start-Up)

An effective start-up is essential for the following production stage. Dilation start-up technology utilizes a short period of high-pressure fluid injection to establish a high porosity and high permeability dilation zone connecting the injector and producer. A similar technique is applied in the SAGD start-up process to vertically and uniformly connect the injector and producer [30].
Since 2013, a geomechanical dilation mechanism, termed as fast and uniform SAGD start-up enhancement (FUSE), has been applied successfully as a technique to reduce the start-up time and enhance thermal conformance along the horizontal well and thus eventually increase the initial oil production. FUSE technology is based on a geomechanical dilation mechanism. By utilizing a short period of high-pressure water injection, the FUSE process creates a high porosity dilation zone vertically connecting a SAGD well pair. Meanwhile, the FUSE process can also overcome the inherent geological heterogeneities along the well length. The newly formed high porosity zones serve as a preferred conduit for the initially injected steam to travel through. Therefore, the more efficient convective heat transport mechanism becomes active between the SAGD well pair allowing for earlier inter-well communication. Another benefit is its ability to break through the mud/shale stingers near the SAGD wells. Therefore, uniform dilation and consequently uniform communication along the horizontal well length is achieved. Since 2013, FUSE technology has been applied to more than 60 SAGD well pairs, and good results have been achieved. Significant experience has been gained in site execution [31].
The geomechanical dilation mechanism can alter rock structure by creating new pore spaces and enhancing permeability in the reservoir. Dilation creates the preferred conduits for steam to travel through and distribute in the reservoir, contacting the heavy oil in large volumes.

3. Numerical Analysis

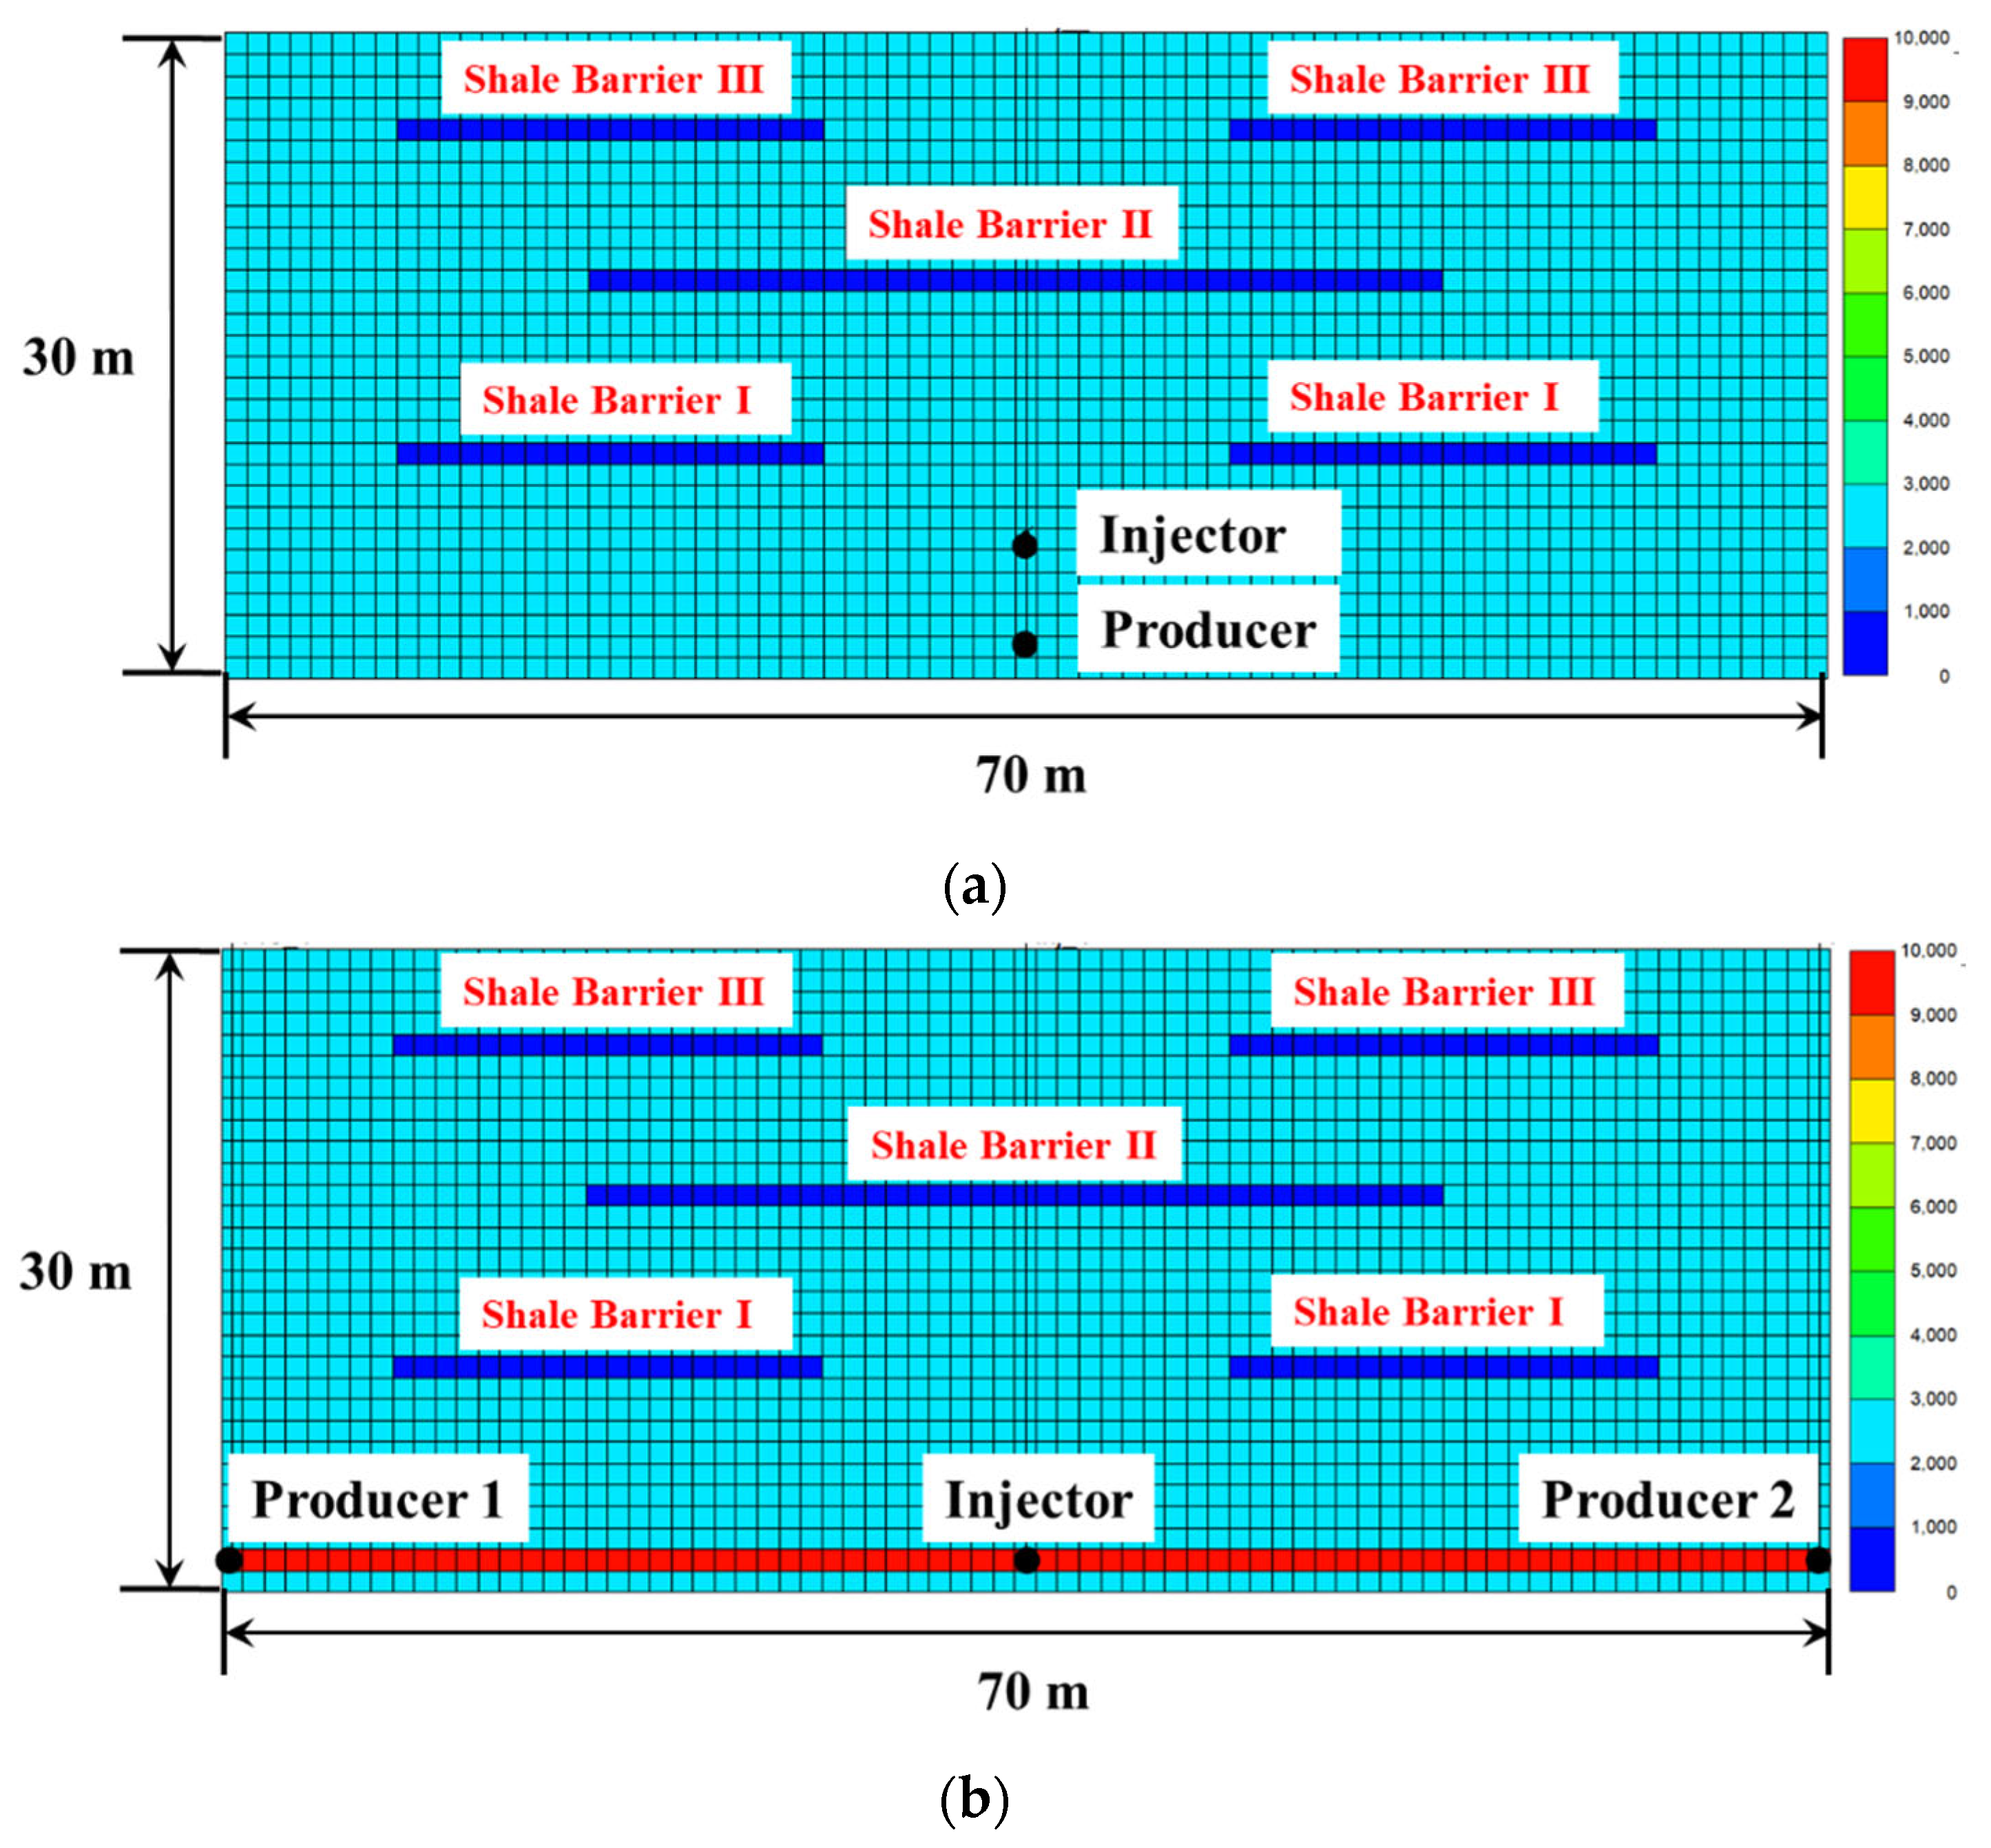
3.1. Numerical Model

In this section, numerical simulation is performed to investigate the bottom-up assisted pressure drive process. As shale barriers are widely present in oil sand reservoirs, a numerical simulation model with multiple shale layers is developed. The simulation model is built with a commercial simulator (CMG STARS, Version 2019, Computer Modeling Group Ltd.). A two-dimensional Cartesian reservoir model is built to represent a typical oil sand formation. The width and thickness of the numerical model are 75 m and 30 m, respectively. A typical grid size of 1 m × 1 m is used in the numerical model. There are 75 grid blocks in the x-direction and 30 grid blocks in the vertical direction. Typical Athabasca oil sand reservoir properties are used in this work, as presented in Table 1 [32,33]. Bitumen from the Athabasca region is used in this work, and its properties are listed in Table 2 [34]. The bitumen viscosity as a function of temperature is depicted in Figure 2. In this work, bitumen is treated as a pseudo-component. This work provides a preliminary evaluation of bottom-up assisted pressure drive. The same bitumen properties are used to compare the performance between bottom-up assisted pressure drive and SAGD processes. It should be noted that bitumen properties are complex [35,36]. More detailed compositional analysis will be performed in future work. Relative permeability curves derived from an underground test facility (UTF) are used in this work [5,32].
In this work, both SAGD and bottom-up assisted pressure drive processes are simulated. The typical horizontal wells are included in both processes, and the horizontal well length is 800 m. In the SAGD process, a pair of horizontal wells consisting of an injection well and a production well are included in the model, and the vertical distance between the injector and producer is 5 m. In the bottom-up assisted pressure drive process, the injector and producer are positioned near the bottom of the reservoir at the same depth. The horizontal distance between the injector and the producer is 37 m. In order to be comparable with the simulation results of the SAGD process, one injector and two half-producers are included in the simulation model of the bottom-up assisted pressure drive. The well fractions of these two producers are set as 0.5 in the simulation. In this way, the number of wells in both processes is equivalent. The same well constraints are set in both processes, in which the injection pressure is 2300 kPa, and the steam rate in the production well is set as 10 m3/day. This is the same as those in the literature [33].
In the numerical model, multiple shale barriers are also considered. The properties of the shale barriers are listed in Table 3, which is the same as that in the literature [37,38]. Although shale barriers are complex in real reservoirs, a simplified representation of shale configuration is applied in the simulation. The schematic of the grid systems for the two processes is presented in Figure 3 with respect to the well locations and shale barrier distributions. In order to simulate the dilated zone, a one-meter thickness dilated zone is set at the bottom of the formation connecting the injector and producer. The permeability and porosity of this dilated zone are 10 Darcy and 0.5, respectively (as shown in Figure 3b). As the high-pressure water injection is applied to facilitate the stimulation, a considerable amount of water is retained in the dilated zone. Therefore, it is reasonable to set the water saturation as 0.6 in this zone.

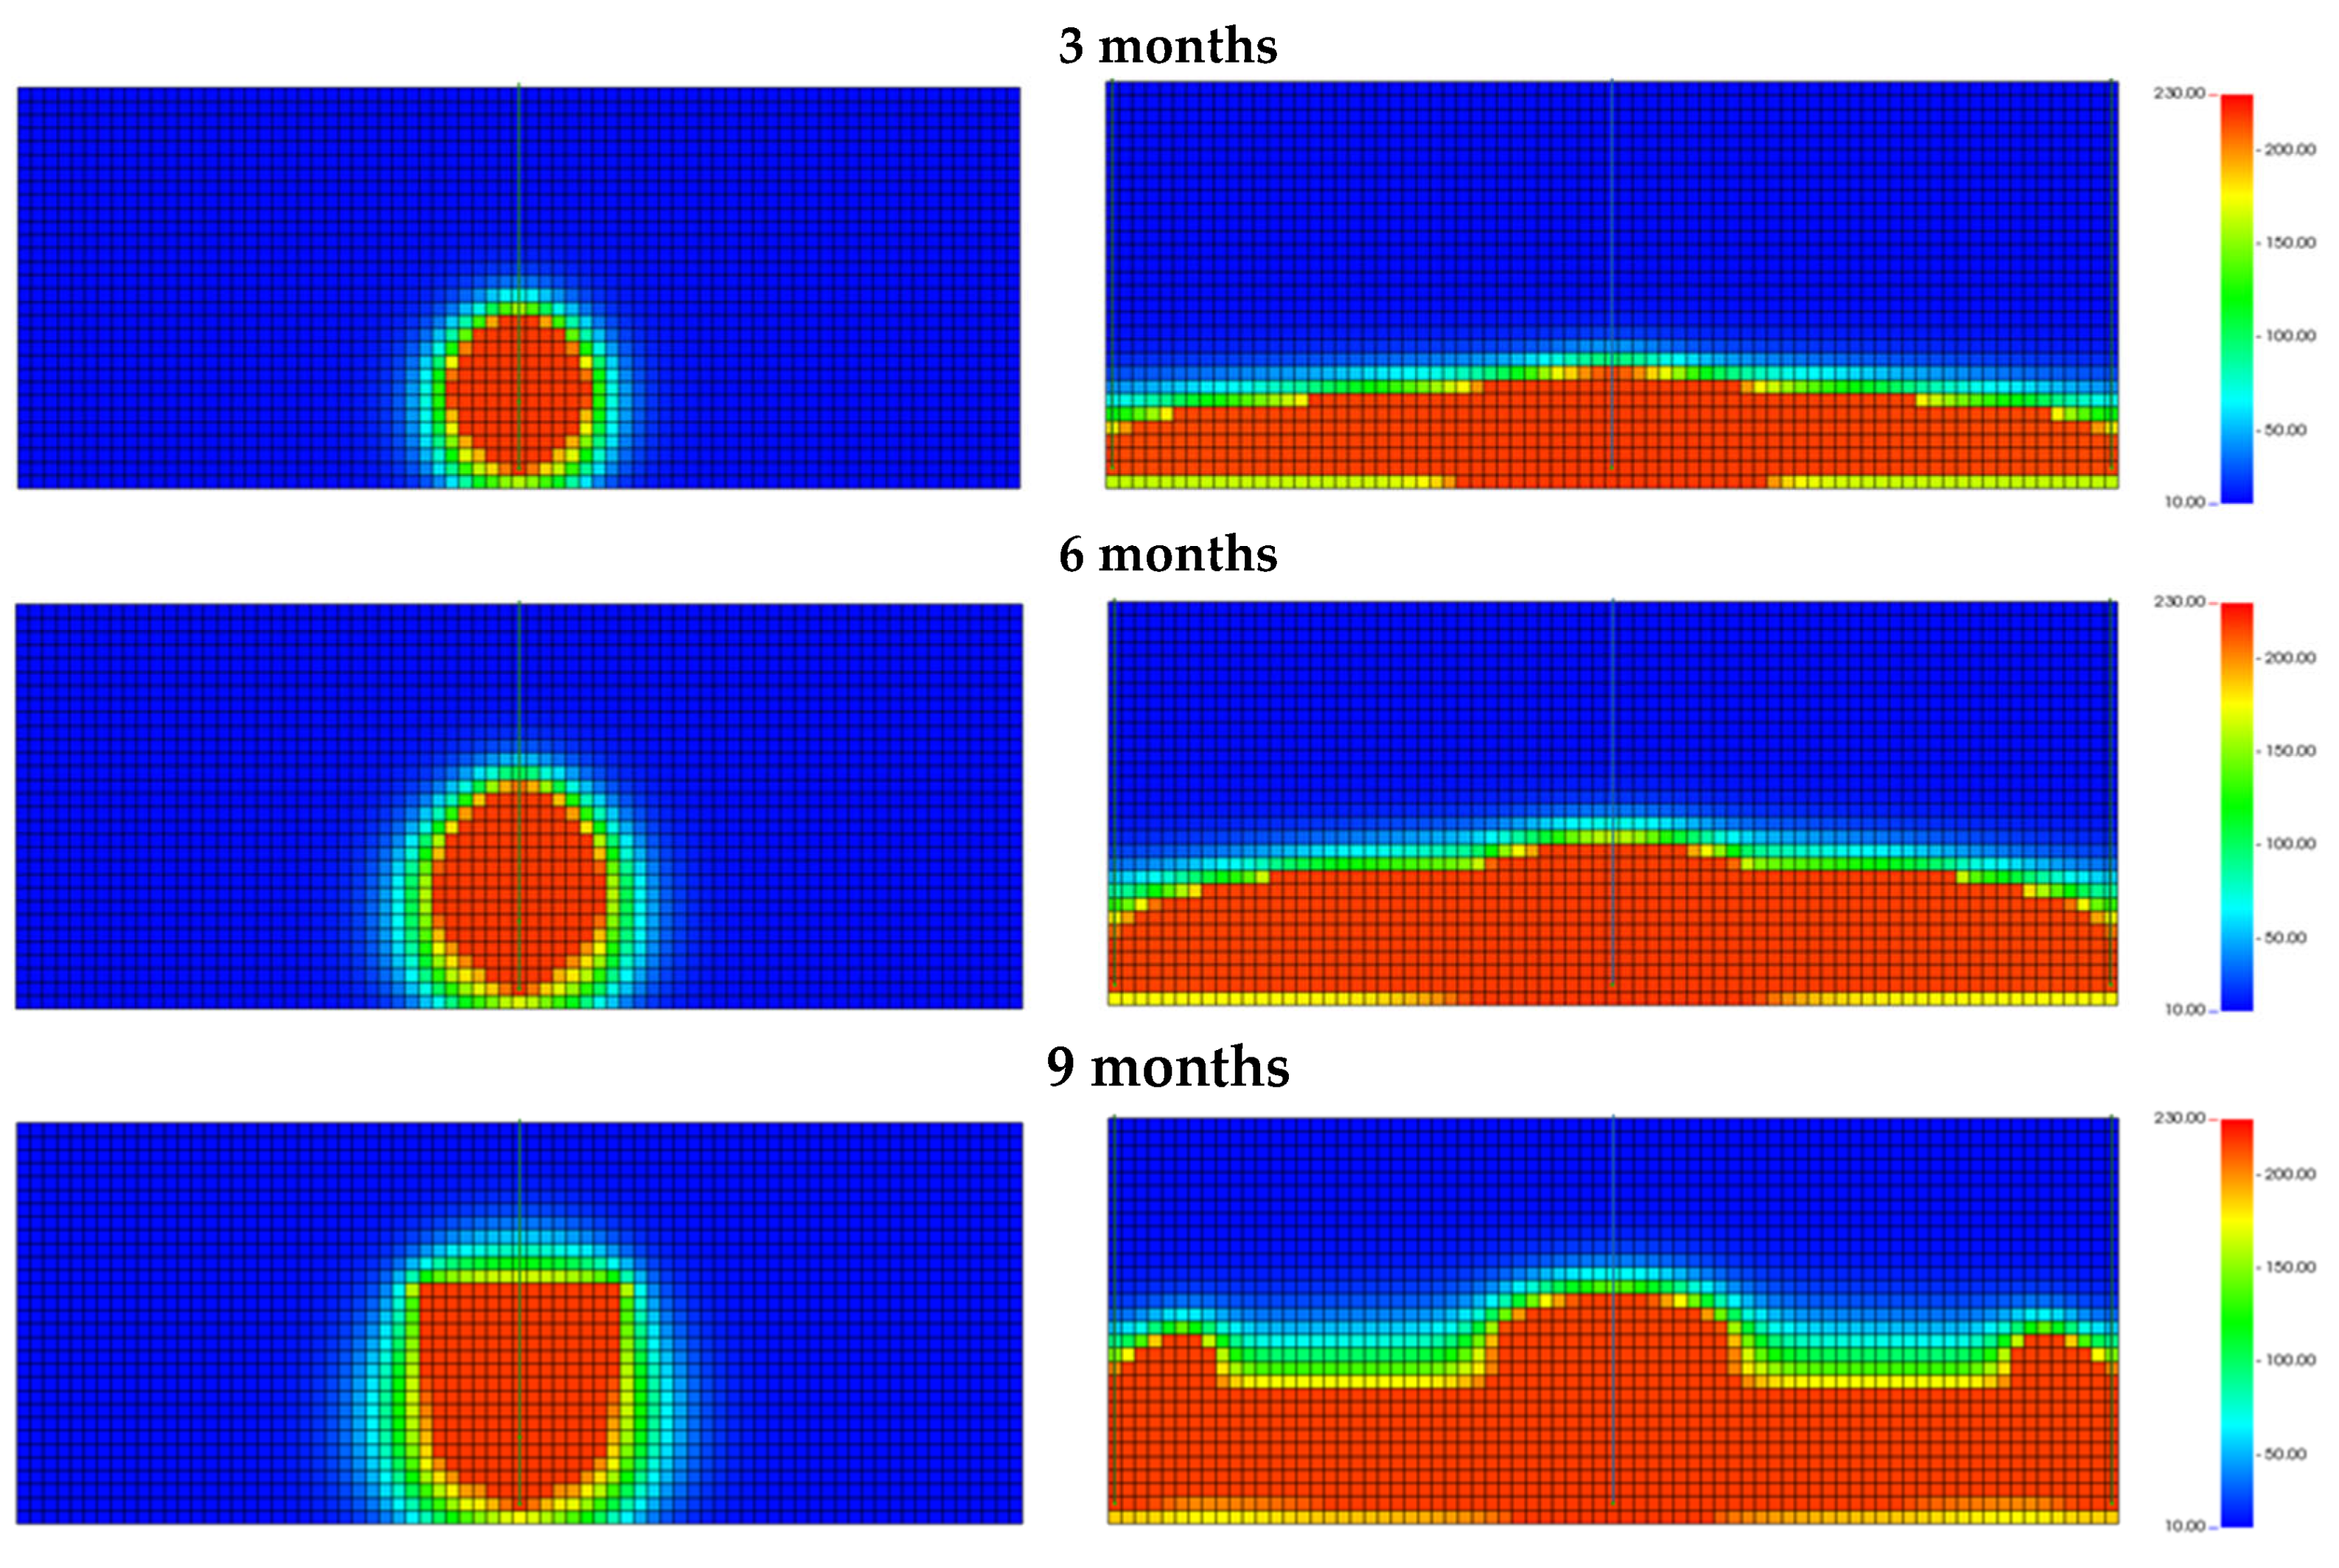
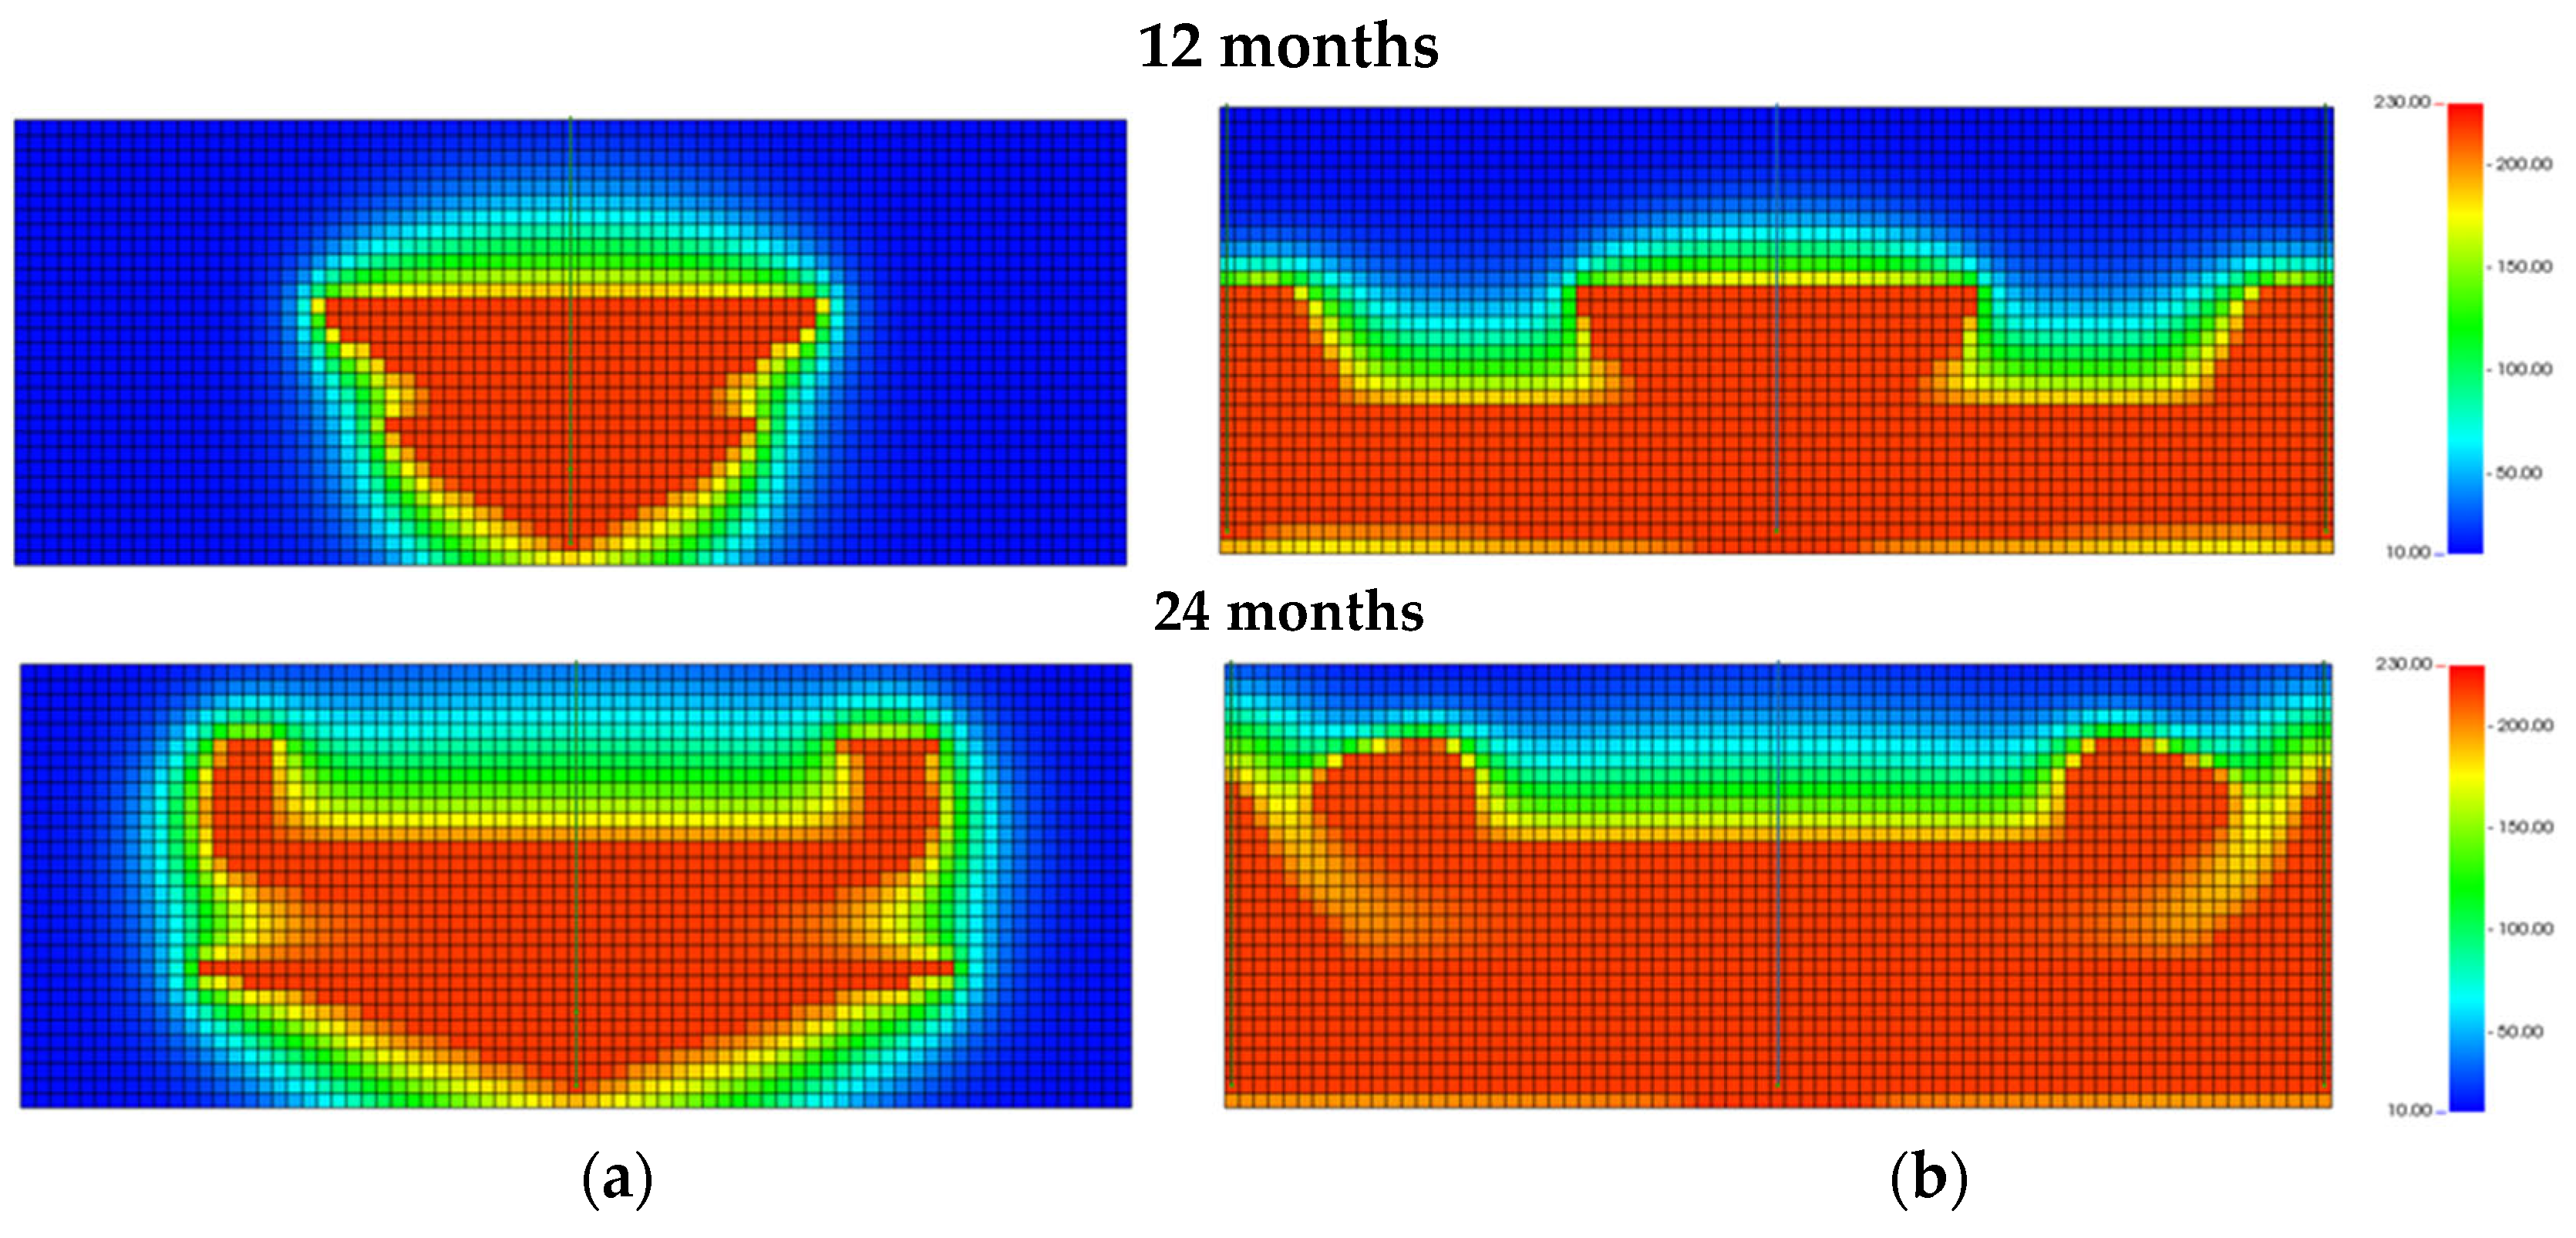
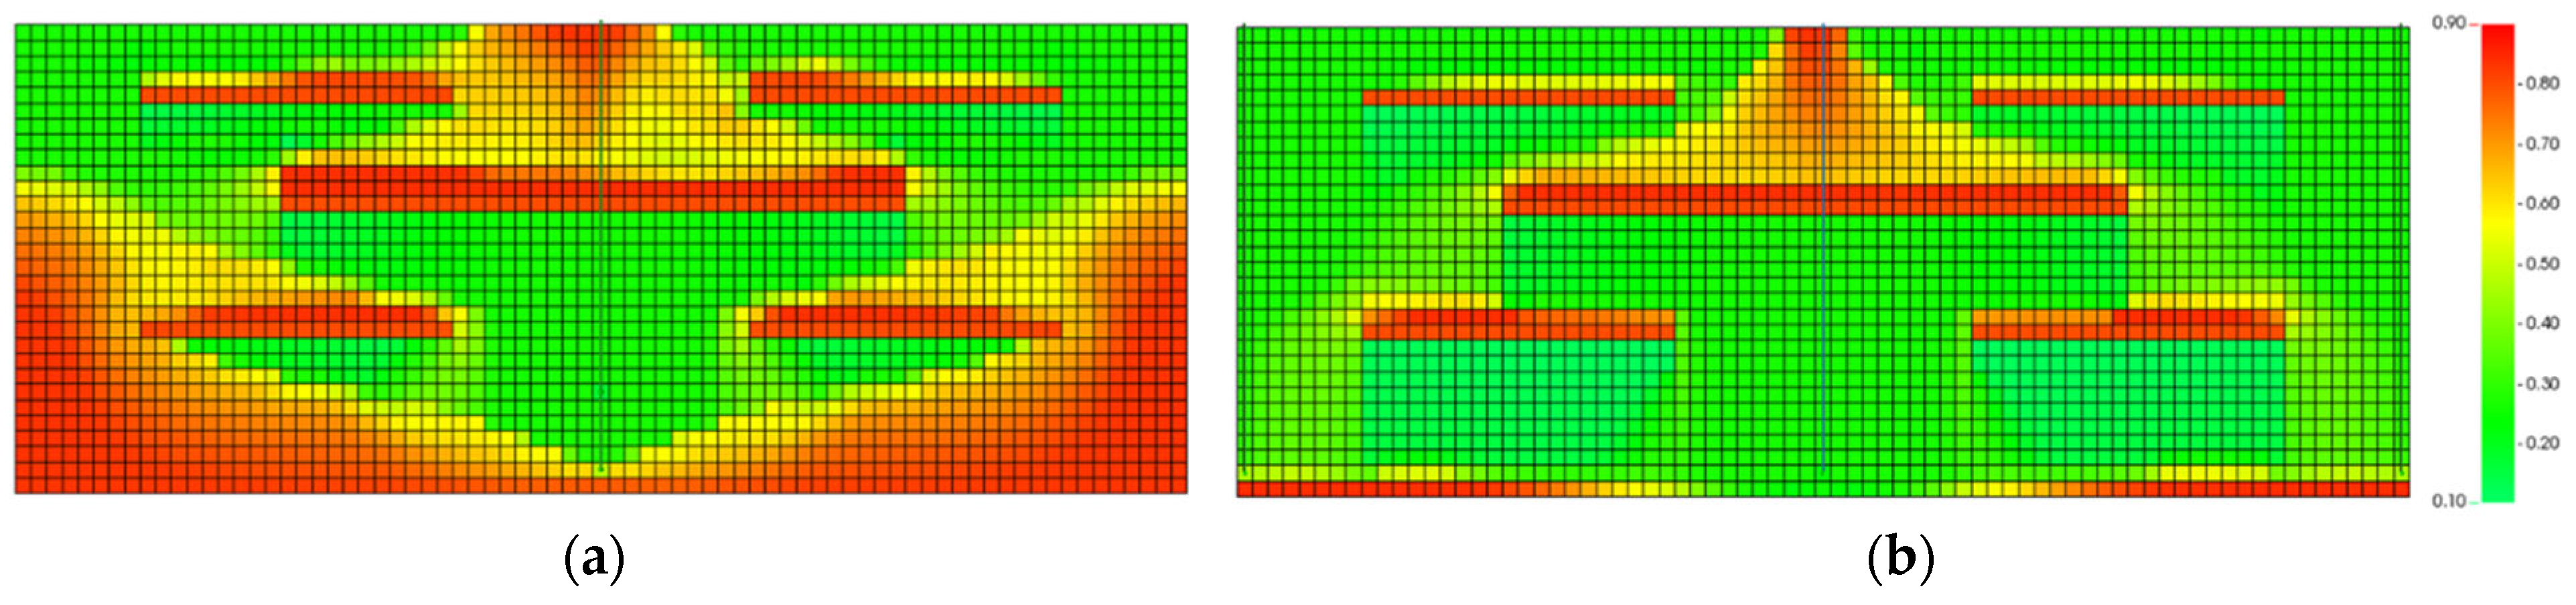
3.2. Steam Chamber Development

Figure 4 compares the steam chamber development between the SAGD process (Figure 4a) and the bottom-up assisted pressure drive process (Figure 4b) in typical oil sand reservoirs with multiple shale barriers. It is obvious that the steam chamber characteristics determined in the two processes are taken at different times of operation.
In the first 6 months of SAGD operation, the steam chamber grows upwards, which is similar to typical steam chamber development. This is the reason that the existence of shale barrier Ⅰ does not affect the steam chamber. As the steam chamber grows vertically, shale barrier Ⅱ behaves like the boundary, and then the steam chamber grows laterally at 9 months of operation. Meanwhile, the impact of shale barrier Ⅰ on steam chamber development takes into effect, as seen at 12 months of operation. In the typical SAGD process, once the steam encounters shale barriers, steam changes its migration due to the properties of shale (low permeability and low thermal conductivity). Therefore, the oil above the shale barrier cannot be effectively heated and drained by gravity. The observed characteristics of steam chamber development are the same as those investigated in the literature [8,16,38].
Steam chamber development characteristics in the bottom-up assisted pressure drive process are depicted in Figure 4b. With the initiation of the steam injection, a steam chamber connecting the injector and producer is first developed (as seen in the steam chamber at 3 months of operation). With the continuous injection of the steam, the steam chamber moves from the bottom upwards with relatively flat horizontal front (as seen in the steam chamber at 6 months of operation). Compared to the steam chamber volume in the early stage of operation (i.e., 3 months and 6 months of operation), it is obvious that the steam chamber in the bottom-up assisted pressure drive process is much greater than that in the SAGD process. Meanwhile, the large contact area between steam and oil contributes to high oil production. Steam chamber development is affected by shale barrier Ⅰ at 9 months of operation and shale barrier Ⅱ at 12 months of operation. Because of the low permeability of shale barriers, the steam chamber grows laterally. Together with the pressure drive between the injector and producer, the oil above the shale barriers can be displaced efficiently, as shown at 24 months of operation. Different from the SAGD process, the pressure difference between the injector and producer of the bottom-up assisted pressure drive process is greater due to the long distance between the injector and producer. Therefore, the pressure drive provides another driving force. This feature is beneficial for oil production, especially in reservoirs with shale barriers. In the bottom-up assisted pressure drive process, although the presence of shale barriers affects the steam chamber development, the oil above the shale barriers moves to the production well by the force of the pressure drive. In addition, there is an amount of oil in the middle of two well pairs. This region is hardly swept by the steam chamber in the SAGD process (i.e., 24 months of SAGD). The infill well is usually drilled to recover these resources. By applying the bottom-up assisted pressure drive process, the oil in this region is effectively recovered, avoiding the infill well (as seen at 24 months of bottom-up assisted pressure drive).

3.3. Oil Production Profile

Figure 5 compares the oil production rate and cumulative oil production between bottom-up assisted pressure drive and SAGD processes. In order to be comparable between the two simulation models, the oil rate in the bottom-up assisted pressure drive process is the total oil production of producer 1 and producer 2 (as shown in Figure 3b), while the oil rate in the SAGD process is directly obtained from the producer (as shown in Figure 3a). This is a very critical point that must be clarified.
An obvious difference is observed in the oil production curves. The peak oil rate in the bottom-up assisted pressure drive is approximately 600 m3/day, which is three times that in the SAGD process (i.e., 200 m3/day). In addition, the peak rate in the SAGD process is observed after 1500 days of operation due to the presence of shale barriers. The timing of the peak rate in the bottom-up assisted pressure drive is 180 days of the operation. The timing of the peak rate is of great importance in the economic evaluation, which will be discussed in the following section.
As shown in Figure 5a, the oil production rate obtained from the bottom-up assisted pressure drive at the early stage is much greater than in the SAGD process. This observation is consistent with the steam chamber development discussed in the previous section. The high production rate is mainly attributed to the homogeneous reservoir properties near the bottom of the formation. The effect of shale barriers on oil production has not started. Once the steam chamber encounters shale barriers (shale barriers Ⅰ and Ⅱ), oil production reduces significantly. Oil production begins to decline after 1200 days of operation.
Oil production in the early stage is greatly affected by the height of the shale barrier in the SAGD process. In the bottom-up process, the presence of the shale barrier seldom affects oil production in the early stage. Because of the effect of shale barriers, the oil production curve in the SAGD process (as shown in Figure 5a) is also different from the typical type curve, which includes ramp-up, plateau, and depletion. A short ramp-up process exists, and the plateau is prolonged. The peak oil rate is not observed in the early stage due to the presence of shale barriers. The peak rate is postponed to 1600 days.
The cumulative oil production is compared in Figure 5b. The cumulative oil production in the bottom-up assisted pressure drive is 20% higher than in the SAGD process. This is mainly attributed to two aspects. In the typical SAGD process, the region between two well pairs is not swept by steam (as seen in Figure 6a). In the field application, the infill well is usually introduced to recover the oil in this region. The producer in the bottom-up assisted pressure drive process is located in the infill well location. Therefore, the oil near the bottom of the formation can be recovered effectively and efficiently without drilling extra infill wells. In addition, by comparing the oil saturation of the two processes, it is obvious that considerable oil is still trapped above the shale barriers in the SAGD process. This oil cannot be effectively drained by gravity because shale barriers have low permeability and low heat conductivity. Although there is a small amount of oil trapped above the shale barriers in the bottom-up assisted pressure drive process, most of the oil is migrated to the producers by the force of the pressure drive. This reveals two advantages of bottom-up assisted pressure drive over the SAGD process.

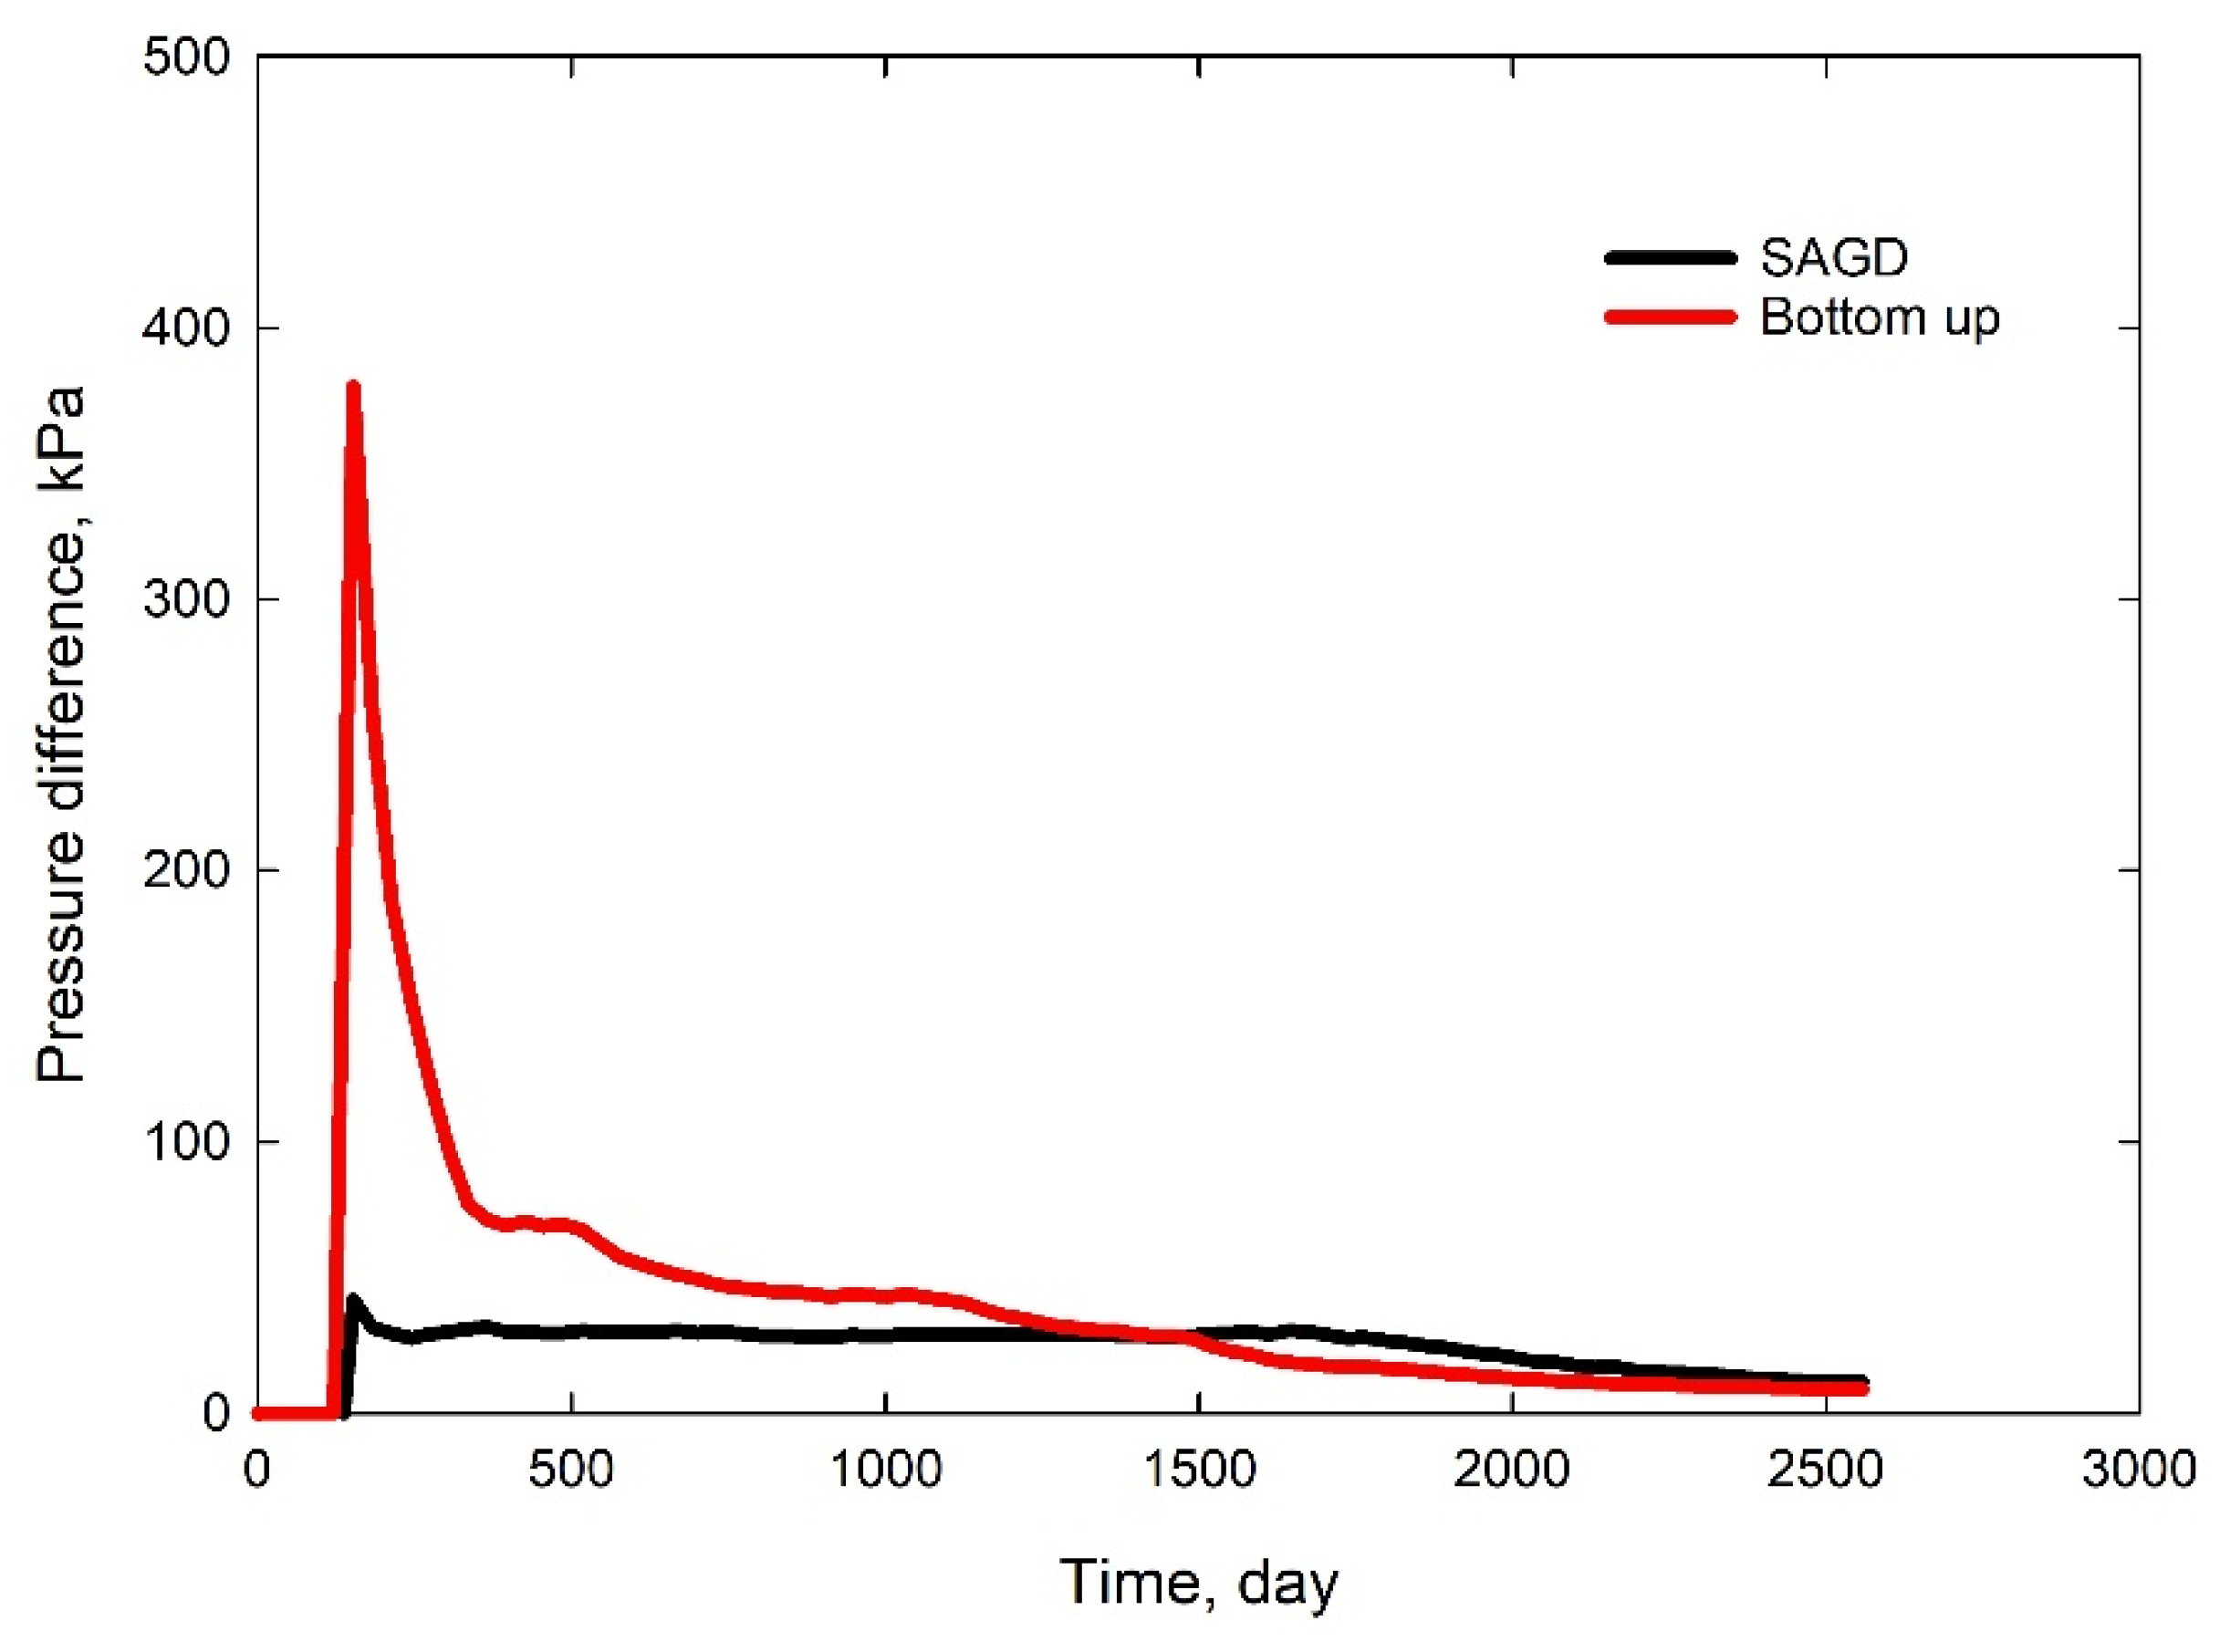
3.4. Pressure Difference

The injection pressure in both processes is set to 2300 kPa. In the production well, two well constraints are applied, namely the minimum pressure of 1300 kPa and the maximum steam production of 10 m3/day. In reality, the steam production rate is the dominant well constraint, and the production well pressure varies. The pressure difference is the difference between actual injection pressure and actual production pressure. The pressure difference between the injector and producer of the two processes is plotted in Figure 7.
In the typical SAGD process, a relatively small pressure difference is retained between the injector and producer to avoid steam production. The pressure difference between the injector and producer in the SAGD process is only 30~50 kPa. As seen in Figure 7, the pressure difference is kept almost constant at approximately 30 kPa during the whole process. The main driving force in the SAGD process is gravity. However, the pressure difference in the bottom-up pressure drive varies significantly. At the start of the process, the pressure difference is up to 380 kPa. Such a large pressure difference is capable of displacing the oil between the injector and the producer. This is the reason that high oil production is observed in the first year of the process, as seen in Figure 5a. With the establishment of the steam chamber, the pressure difference is reduced to 70 kPa, and the oil production is reduced correspondingly. With continuous steam injection, the steam chamber encounters shale barriers. Although oil production in both processes is restricted by shale barriers, oil production in the bottom-up assisted pressure drive is still higher than that in the SAGD process between 350 and 1300 days. This is because the pressure difference of the bottom-up assisted pressure drive during this period is also higher. The pressure difference behaves as a driving force to displace the oil above the shale barriers. The pressure difference of the bottom-up assisted pressure drive process continues to decrease and is lower than that in the SAGD process at approximately 1300 days. Interestingly, the oil production rate is also below oil production in SAGD at this time. This observation confirms that the pressure drive is another driving mechanism in the bottom-up assisted pressure drive. Meanwhile, this indicates that bottom-up assisted pressure drive is able to improve oil production in oil sands reservoirs with multiple shale barriers.

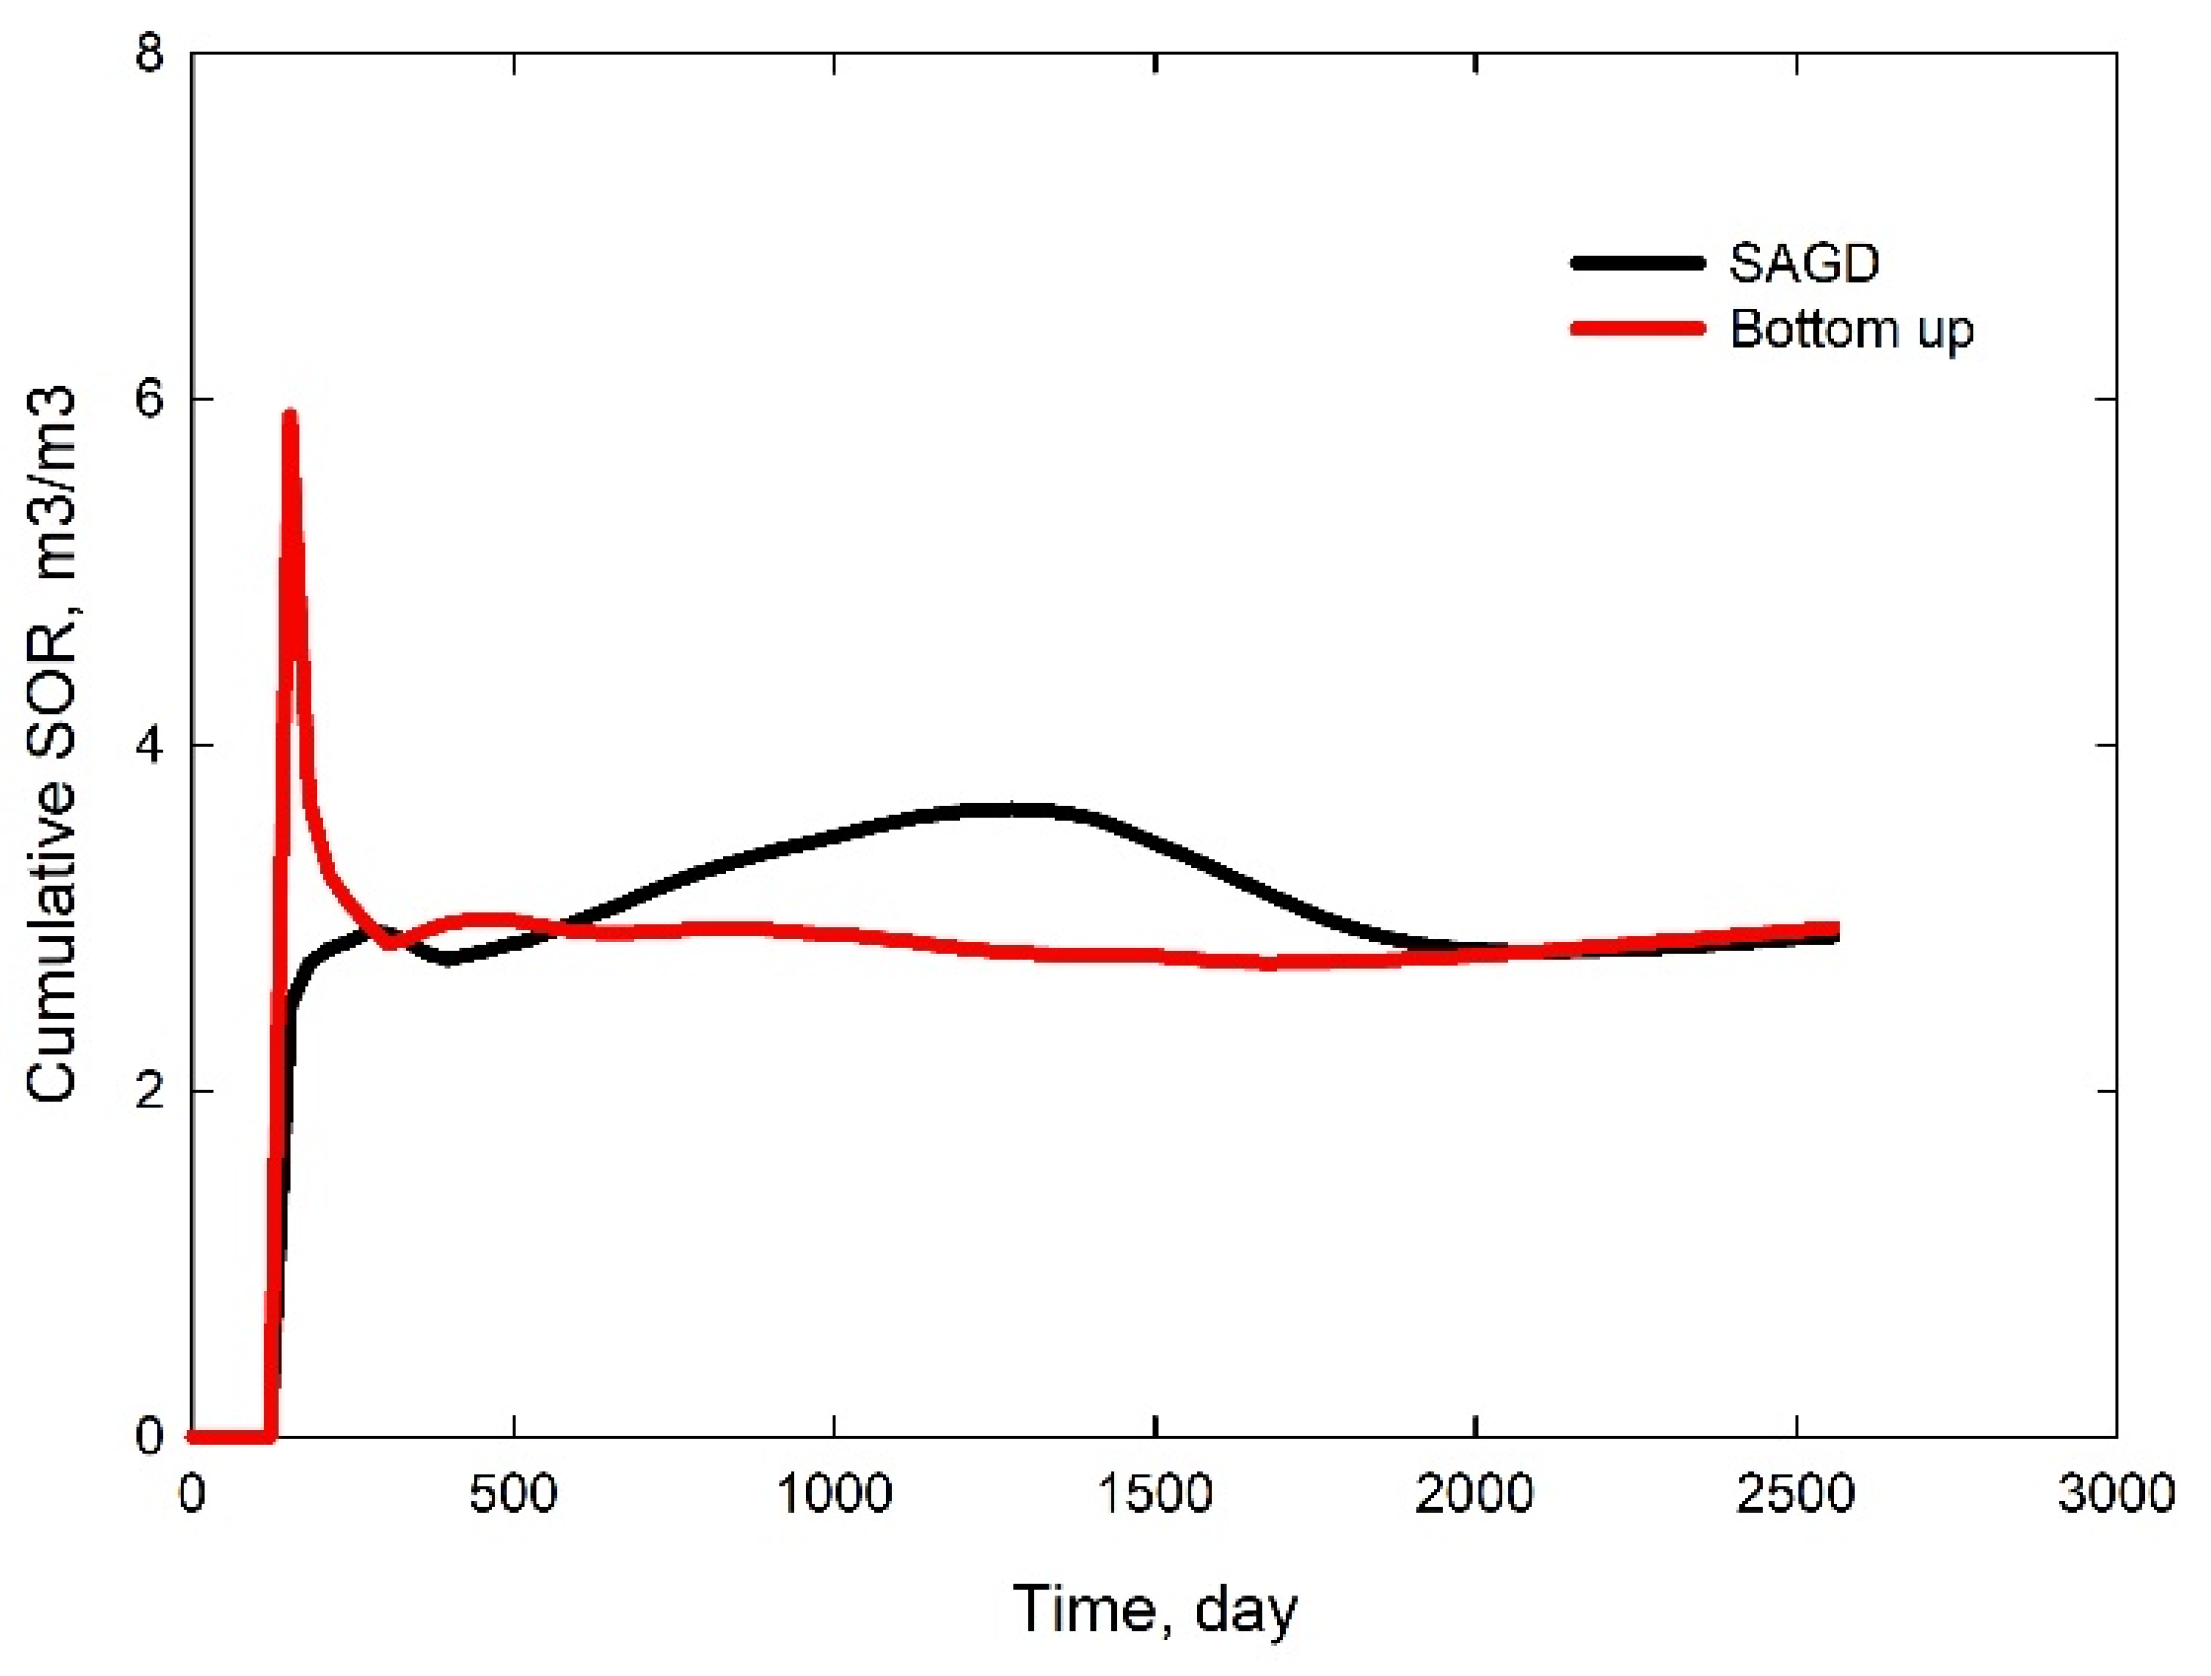
3.5. Cumulative Steam Oil Ratio

The cumulative steam oil ratio (cSOR) is widely used as an indicator to evaluate SAGD performance [5]. Figure 8 shows the cSOR obtained from the SAGD and bottom-up assisted pressure drive processes. At the initiation of the bottom-up assisted pressure drive, a huge amount of steam is required to establish communication between the injector and producer, resulting in a high SOR. With the development of the steam chamber, high oil production is achieved, and the cSOR is reduced to around 2.7. For the SAGD process, the cSOR is up to 3.7 due to the presence of shale barriers. For most periods of operation, the cSOR in the bottom-up assisted pressure drive is lower than in the SAGD process. The bottom-up assisted pressure drive exhibits another advantage of improving cSOR.

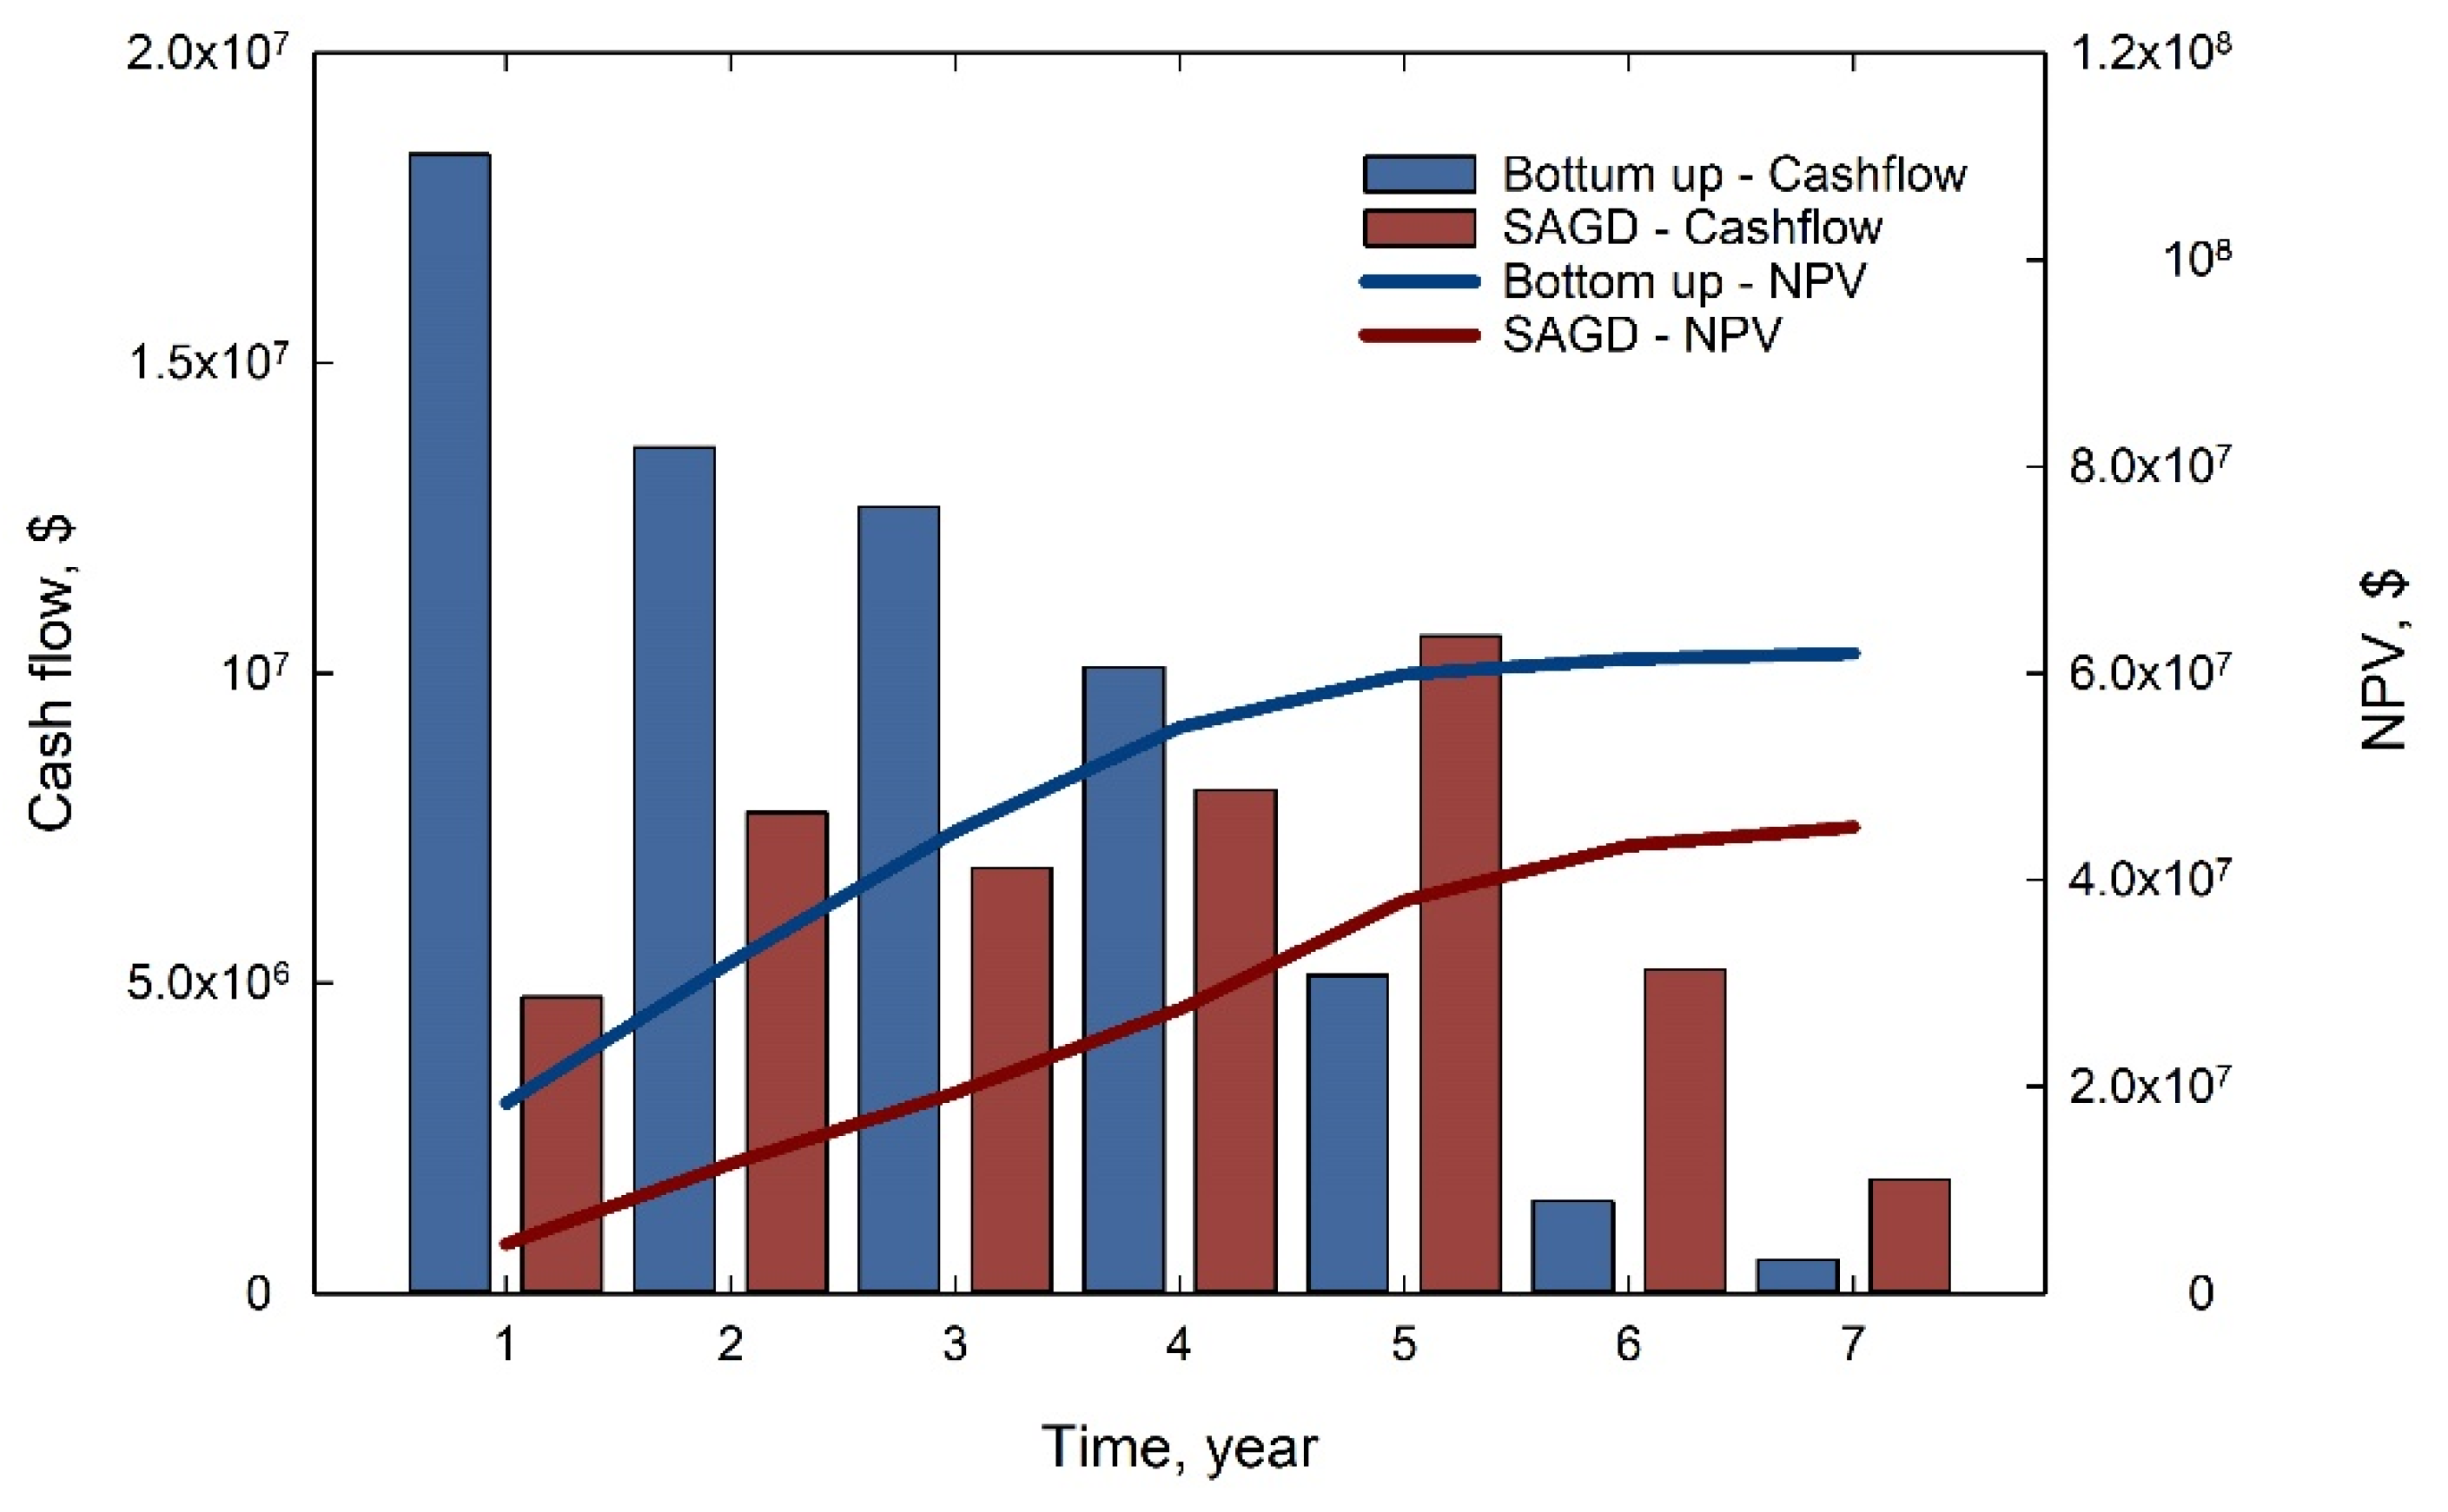
4. Economic Evaluation

Economic viability is of great importance when investing in a project. Net present value (NPV) is introduced as an economic indicator to evaluate the SAGD and bottom-up assisted pressure drive processes. NPV is defined below [39].
NPV = t = 0 n C t 1 + r t ,
where r is the discount rate, t is the number of time periods (years in this study), and n is the total number of time periods (years in this study). Ct is the project cash flow at a given year of t, which equals the total income minus total cost. It can be estimated using the equation below.
Ct = (bitumen volume × bitumen price) − (steam volume × steam cost) − (drilling and completion costs).
The steam generation cost is USD 6/bbl, and the bitumen price is assumed to be USD 36/bbl at a discount rate of 10% per year. The bitumen price was set at 60% of the discount on the West Texas Intermediate (WTI), which is assumed to be USD 60/bbl in the economic analysis. The drilling and completion cost is approximately USD 1.5 MM [19,40]. It should be noted that the NPV calculation in this study considers the major revenue and costs associated with one injector and one producer in operation. The facilities investment is not considered because only one well pair is considered in this work [19]. The purpose of NPV calculation is to compare the economic feasibility of the two processes. The relevant parameters to calculate the NPV are summarized in Table 4. The project cash flow and variations of NPV as a function of time are presented in Figure 9. The cash flow in the first year of the bottom-up assisted pressure drive process is the greatest because of high oil production. In the first four years, the cash flow calculated from bottom-up assisted pressure drive is higher than that obtained from SAGD. The cash flows of SAGD exceed from the fifth year when the oil production rate peaks. By the end of the projects, the NPV values calculated from bottom-up assisted pressure drive are higher than the NPV values calculated from the SAGD process. Although cumulative oil production in the bottom-up assisted pressure drive is 20% higher than that in the SAGD process, the NPV of bottom-up assisted pressure drive is 27% higher than that in the SAGD process. This is mainly attributed to high oil production in the early stage of the process.

5. Conclusions

In this work, a numerical investigation was performed to evaluate the bottom-up assisted pressure drive process for bitumen resources. Underlying mechanisms were examined using the simulation model with similar properties to the typical Athabasca reservoir, considering shale barriers.
In the bottom-up assisted pressure drive, a flat steam chamber was developed from the bottom of the reservoir in the early stage of the process and grew upward with the injection of steam. The large volume of the steam chamber and the huge contact area between the steam and bitumen contributed to a high oil production rate. The presence of shale barriers affected steam chamber development negatively in both processes. The effect of shale barriers on bottom-up assisted pressure drive was less, indicating one advantage of this novel process over SAGD in oil sand reservoirs with shale barriers. The peak oil production rate in the bottom-up assisted pressure drive (i.e., around 600 m3/day) was approximately three times that in the SAGD process (i.e., around 200 m3/day). The timing of the peak rate in the bottom-up assisted pressure drive was not affected, while the timing of the peak rate in the SAGD process was postponed to 1600 days.
The cumulative oil production in the bottom-up assisted pressure drive was 20% higher than that in the SAGD process. The oil near the bottom of the formation can be recovered efficiently without drilling extra infill wells in the bottom-up assisted pressure drive. In addition, oil trapped above the shale barriers can be effectively displaced in the novel bottom-up assisted pressure drive process.
The pressure difference in the bottom-up assisted pressure drive varied between 100 kPa and 30 kPa, which was greater than that in the SAGD process (approximately 30 kPa). The pressure drive is another mechanism for improving oil production. The calculated NPV in the bottom-up assisted pressure drive process was 27% higher than in the SAGD process. This was mainly attributed to the high oil production rate in the early stage of the process and high cumulative oil production. The inherent mechanisms associated with the bottom-up assisted pressure drive make it suitable for the development of oil sand reservoirs with shale barriers. The simulation studies in this work provide technical support for future field applications. It is recommended to perform physical laboratory experiments to further validate the mechanism obtained from simulation studies. In addition, field pilot tests are still required before implementing the commercial application of the bottom-up assisted pressure drive process.

Author Contributions

Writing—original draft, M.Y., S.W.; Writing—review and editing, Q.F., Y.Y. All authors have read and agreed to the published version of the manuscript.

Funding

This research was funded by China Post-doctoral Science Foundation (2022M713466) and Independent Innovation Scientific Research Project (Science and Engineering) of China University of Petroleum (East China) (27RA2102010).

Institutional Review Board Statement

Not applicable.

Informed Consent Statement

Not applicable.

Data Availability Statement

Data sharing is not applicable to this article.

Conflicts of Interest

The authors declare no conflict of interest.

References

  1. Yang, M.; Chai, M.; Yu, X.; Wang, S.; Feng, Q.; Chen, Z. Insights into in-situ upgrading of bitumen in the hybrid of steam and combustion process: From experimental analysis aspects. J. Pet. Sci. Eng. 2022, 217, 110894. [Google Scholar] [CrossRef]
  2. Chai, M.; Yang, M.; Chen, Z. Systematical study on dimethyl ether as a renewable solvent for warm VAPEX and its significant implications for the heavy oil industry. Fuel 2022, 312, 122911. [Google Scholar] [CrossRef]
  3. Butler, R.M. Steam Assisted Gravity Drainage. In Thermal Recovery of Oil and Bitumen; Prentice Hall: Hoboken, NJ, USA, 1991. [Google Scholar]
  4. Giacchetta, G.; Leporini, M.; Marchetti, B. Economic and environmental analysis of a Steam Assisted Gravity Drainage (SAGD) facility for oil recovery from Canadian oil sands. Appl. Energy 2015, 142, 1–9. [Google Scholar] [CrossRef]
  5. Yang, M.; Chai, M.; Qi, R.; Chen, Z.; Zhang, L.; Yu, X. Dimethyl Ether as a Novel Solvent for Bitumen Recovery: Mechanisms of Improved Mass Transfer and Energy Efficiency. SPE J. 2022, 27, 1321–1340. [Google Scholar] [CrossRef]
  6. Al-Bahlani, A.M.; Babadagli, T. SAGD laboratory experimental and numerical simulation studies: A review of current status and future issues. J. Pet. Sci. Eng. 2009, 68, 135–150. [Google Scholar] [CrossRef]
  7. Ma, Z.; Leung, J.Y. Integration of data-driven modeling techniques for lean zone and shale barrier characterization in SAGD reservoirs. J. Pet. Sci. Eng. 2019, 176, 716–734. [Google Scholar] [CrossRef]
  8. Zheng, J.; Leung, J.Y.; Sawatzky, R.P.; Alvarez, J.M. A cluster-based approach for visualizing and categorizing the impacts of shale barrier configurations on SAGD production. J. Pet. Sci. Eng. 2021, 203, 108664. [Google Scholar] [CrossRef]
  9. Kim, M.; Shin, H. Machine learning-based prediction of the shale barrier size and spatial location using key features of SAGD production curves. J. Pet. Sci. Eng. 2020, 191, 107205. [Google Scholar] [CrossRef]
  10. Venkatramani, A.V.; Okuno, R. Mechanistic simulation study of expanding-solvent steam-assisted gravity drainage under reservoir heterogeneity. J. Pet. Sci. Eng. 2018, 169, 146–156. [Google Scholar] [CrossRef]
  11. Dang, T.Q.C.; Chen, Z.; Nguyen, T.B.N.; Bae, W.; Mai, C.L. Numerical simulation of SAGD recovery process in presence of shale barriers, thief zones, and fracture system. Pet. Sci. Technol. 2013, 31, 1454–1470. [Google Scholar] [CrossRef]
  12. Li, R.; Fu, J.; Munoz, R.; McLennan, R.; Li, Z.; Chen, Z. Study of novel steam assisted gravity drainage multilateral wells with dynamic gridding. J. Pet. Sci. Eng. 2022, 216, 110789. [Google Scholar] [CrossRef]
  13. Chen, S.; Seib, B.; Ben-Zvi, A.; Robinson, T. Christina lake early rise rate solvent aided process pilot. In Proceedings of the SPE Canada Heavy Oil Technical Conference, CHOC 2018, Calgary, AB, Canada, 13–14 March 2018. [Google Scholar] [CrossRef]
  14. Pooladi-Darvish, M.; Mattar, L. SAGD operations in the presence of overlying gas cap and water layer—Effect of shale layers. J. Can. Pet. Technol. 2002, 41, 40–50. [Google Scholar] [CrossRef]
  15. Wu, Y.; Li, X.; Jiang, Y.; Wang, H.; He, W. Reservoir simulation of shale barrier failure in heterogeneous SAGD reservoirs: A case study. In Proceedings of the SPE Reservoir Characterisation and Simulation Conference and Exhibition, RCSC 2013: New Approaches in Characterisation and Modelling of Complex Reservoirs, Abu Dhabi, United Arab Emirates, 15–18 September 2013; pp. 52–65. [Google Scholar]
  16. Kumar, A.; Hassanzadeh, H. Impact of shale barriers on performance of SAGD and ES-SAGD—A review. Fuel 2021, 289, 119850. [Google Scholar] [CrossRef]
  17. Gao, Y.; Ren, Z.; Chen, M.; Jiang, H.; Ding, S. Coupled geomechanical-thermal simulation for oil sand reservoirs with shale barriers under hot water injection in vertical well-assisted SAGD wells. J. Pet. Sci. Eng. 2022, 208, 109644. [Google Scholar] [CrossRef]
  18. Kumar, A.; Hassanzadeh, H. Bitumen Recovery Performance of SAGD and Butane- and Hexane-Aided SAGD in the Presence of Shale Barriers. ACS Omega 2022, 7, 20280–20290. [Google Scholar] [CrossRef] [PubMed]
  19. Kim, M.; Shin, H. Numerical simulation of undulating shale breaking with steam-assisted gravity drainage (UB-SAGD) for the oil sands reservoir with a shale barrier. J. Pet. Sci. Eng. 2020, 195, 107604. [Google Scholar] [CrossRef]
  20. Shin, H.; Choe, J. Shale barrier effects on the SAGD performance. In Proceedings of the SPE/EAGE Reservoir Characterization and Simulation Conference 2009—Overcoming Modeling Challenges to Optimize Recovery, Abu Dhabi, United Arab Emirates, 19–21 October 2009; Volume 1, pp. 203–212. [Google Scholar] [CrossRef]
  21. Ma, Z.; Leung, J.Y.; Zanon, S. Integration of artificial intelligence and production data analysis for shale heterogeneity characterization in steam-assisted gravity-drainage reservoirs. J. Pet. Sci. Eng. 2018, 163, 139–155. [Google Scholar] [CrossRef]
  22. Kumar, A.; Hassanzadeh, H. A qualitative study of the impact of random shale barriers on SAGD performance using data analytics and machine learning. J. Pet. Sci. Eng. 2021, 205, 108950. [Google Scholar] [CrossRef]
  23. Yang, G.; Butler, R.M. Effects Of Reservoir Heterogeneities On Heavy Oil Recovery By Steam-Assisted Gravity Drainage. J. Can. Pet. Technol. 1992, 31. [Google Scholar] [CrossRef]
  24. Huang, S.; Yang, L.; Xia, Y.; Du, M.; Yang, Y. An experimental and numerical study of a steam chamber and production characteristics of SAGD considering multiple barrier layers. J. Pet. Sci. Eng. 2019, 180, 716–726. [Google Scholar] [CrossRef]
  25. Shijun, H.; Hao, X.; Shaolei, W.; Chenghui, H.; Yang, Y. Physical simulation of the interlayer effect on SAGD production in mackay river oil sands. Fuel 2016, 183, 373–385. [Google Scholar] [CrossRef]
  26. Wei, S.; Duan, Y.; Wei, M.; Ren, K.; Lu, C.; Zhan, J.; Tang, Y. Experimental study on the effect of different distributed interlayer on SAGD performance. J. Pet. Sci. Eng. 2022, 209, 109827. [Google Scholar] [CrossRef]
  27. Li, W.; Mamora, D.D.; Li, Y.; Qui, F. Numerical investigation of potential injection strategies to reduce shale barrier impacts on SAGD process. J. Can. Pet. Technol. 2011, 50, 57–64. [Google Scholar] [CrossRef]
  28. Dong, X.; Wang, J.; Liu, H.; Zeng, D.; Zhang, Q. Experimental investigation on the recovery performance and steam chamber expansion of multi-lateral well SAGD process. J. Pet. Sci. Eng. 2022, 214, 110597. [Google Scholar] [CrossRef]
  29. Yuan, Y.; Dong, M. Bottom-Up Gravity-Assisted Pressure Drive. U.S. Patent US20170130572, 4 February 2020. [Google Scholar]
  30. Sun, X.; Xu, B.; Qian, G.; Li, B. The application of geomechanical SAGD dilation startup in a Xinjiang oil field heavy-oil reservoir. J. Pet. Sci. Eng. 2021, 196, 107670. [Google Scholar] [CrossRef]
  31. Fan, Y.; Sun, X.; Mai, X.; Xu, B.; Dong, M.; Yuan, Y. In-Situ catalytic aquathermolysis combined with geomechanical dilation to enhance thermal heavy-Oil production. In Proceedings of the SPE Canada Heavy Oil Technical Conference, Calgary, AB, Canada, 15–16 February 2017; pp. 496–509. [Google Scholar] [CrossRef]
  32. Rabiei Faradonbeh, M.; Hassanzadeh, H.; Harding, T. Numerical simulations of bitumen recovery using solvent and water assisted electrical heating. Fuel 2016, 186, 68–81. [Google Scholar] [CrossRef]
  33. Yang, M.; Harding, T.G.; Chen, Z. Field-Scale Modeling of Hybrid Steam and In-Situ-Combustion Recovery Process in Oil-Sands Reservoirs Using Dynamic Gridding. SPE Reserv. Eval. Eng. 2020, 23, 311–325. [Google Scholar] [CrossRef]
  34. Haddadnia, A.; Azinfar, B.; Zirrahi, M.; Hassanzadeh, H.; Abedi, J. Thermophysical properties of dimethyl ether/Athabasca bitumen system. Can. J. Chem. Eng. 2018, 96, 597–604. [Google Scholar] [CrossRef]
  35. Smyshlyaeva, K.I.; Rudko, V.A.; Kuzmin, K.A.; Povarov, V.G. Asphaltene genesis influence on the low-sulfur residual marine fuel sedimentation stability. Fuel 2022, 328, 125291. [Google Scholar] [CrossRef]
  36. Shishkova, I.; Stratiev, D.; Kolev, I.V.; Nenov, S.; Nedanovski, D.; Atanassov, K.; Ivanov, V.; Ribagin, S. Challenges in Petroleum Characterization—A Review. Energies 2022, 15, 7765. [Google Scholar] [CrossRef]
  37. Wang, C.; Leung, J.Y. Characterizing the effects of lean zones and shale distribution in steam-assisted-gravity-drainage recovery performance. SPE Reserv. Eval. Eng. 2015, 18, 329–345. [Google Scholar] [CrossRef]
  38. Zhang, L.; Li, J.; Sun, L.; Yang, F. An influence mechanism of shale barrier on heavy oil recovery using SAGD based on theoretical and numerical analysis. Energy 2021, 216, 119099. [Google Scholar] [CrossRef]
  39. Frenette, C.T.; Saeedi, M.; Henke, J.L. Integrated economic model for evaluation and optimization of cyclic-steam-Stimulation projects. SPE Econ. Manag. 2016, 8, 11–22. [Google Scholar] [CrossRef]
  40. Keshavarz, M. Analytical Modeling of Steam Injection and Steam-Solvent Co-Injection for Bitumen and Heavy Oil Recovery with Parallel Horizontal Wells. Ph.D. Thesis, University of Calgary, Calgary, AB, Canada, 2019. [Google Scholar]
Figure 1. Schematic of the bottom-up assisted pressure drive process with respect to the well locations, steam chamber characteristics, and shale barriers distribution.
Applsci 12 11666 g001
Figure 2. Bitumen viscosity as a function of temperature indicating that bitumen viscosity decreases significantly with the increase in temperature.
Applsci 12 11666 g002
Figure 3. Schematic of the grid systems in (a) the SAGD process and (b) the bottom-up assisted SAGD process with respect to the well locations and shale barriers distribution.
Applsci 12 11666 g003
Figure 4. Comparison of steam chamber development between (a) SAGD processes and (b) bottom-up assisted pressure drive at different times of operation.
Applsci 12 11666 g004aApplsci 12 11666 g004b
Figure 5. Comparison of (a) oil production rate and (b) cumulative oil production between bottom-up assisted pressure drive and SAGD processes indicating that bottom-up assisted pressure drive improves oil production.
Applsci 12 11666 g005
Figure 6. Comparison of oil saturation at the end of the (a) SAGD process and (b) bottom-up assisted pressure drive process indicating that bottom-up assisted pressure drive decreases residual oil.
Applsci 12 11666 g006
Figure 7. Pressure difference between injector and producer in bottom-up pressure drive and SAGD processes indicating the large pressure difference in the bottom-up assisted pressure drive.
Applsci 12 11666 g007
Figure 8. Comparison of cumulative steam oil ratio between SAGD and bottom-up assisted pressure drive processes indicating the bottom-up assisted pressure drive improves the energy efficiency.
Applsci 12 11666 g008
Figure 9. Comparison of cash flow and NPV results between SAGD and bottom-up assisted pressure drive processes indicating the bottom-up assisted pressure improves the economics.
Applsci 12 11666 g009
Table 1. Reservoir properties in the simulation model.
ParametersUnitValue
Porosity-0.3
Horizontal permeability mD5000
Vertical permeabilitymD1000
Formation depthm280
Initial temperature°C12
Reference pressurekPa1300
Initial water saturation-0.17
Initial oil saturation-0.83
Rock heat capacitykJ/(m3·C)1200
Rock thermal conductivitykJ/(m·d·C)650
Over/underburden heat capacitykJ/(m3·C)2370
Over/underburden thermal conductivitykJ/(m·d·C)202
Table 2. Basic properties of bitumen.
ComponentMolecular Weight
g/mol
Critical Temperature
°C
Critical Pressure
kPa
Acentric Factor
Bitumen540.00746.9310221.1700
Table 3. Properties of shale barriers in the numerical model.
PropertiesUnitValue
Horizontal permeabilitymD10−3
Vertical permeabilitymD10−4
Porosity-0.08
Table 4. The relevant parameters for the NPV calculation.
ParametersValues
Discount rate10%
Bitumen price USD 36/bbl
Crude oil price of West Texas IntermediateUSD 60/bbl
Steam operating costUSD 6/m3 steam (CWE)
Drilling and completion costUSD 1,500,000/well pair
Publisher’s Note: MDPI stays neutral with regard to jurisdictional claims in published maps and institutional affiliations.

