Abstract
Poorly maintained roads can cause lethal automobile accidents in various ways. Thus, detecting and reporting damaged parts of roads is one of the most crucial road maintenance tasks, and it is vital to identify the type and severity of the damage to help fix it as soon as possible. Several researchers have used computer vision and detection algorithms to detect and classify road damages, including cracking, distortion, and disintegration. Providing automatic road damage detection methods can help municipalities save time and effort and speed up maintenance operations. This study proposes a method to classify road damage and its severity based on CNN and trained on a newly curated dataset collected from Saudi roads. Hence, this study also presents a dataset with labeled classes, which are cracks, potholes, depressions, and shoving. The dataset was collected in collaboration with maintenance employees in the municipality of Rabigh Governorate using a smartphone device and reviewed by experts. In addition, several deep learning algorithms were implemented and evaluated using the proposed dataset. The study found that the proposed custom CNN (RoadNet) has higher accuracy than pre-trained models.
1. Introduction
Infrastructure is a significant element of society and a large part of the daily lives of many individuals. Roads are one of the most important national facilities in the Kingdom of Saudi Arabia. They are used every day by thousands and millions of people to commute; their safety is critical. These facilities require maintenance and successive repairs so that damage does not cause further losses and harm the national economy as the facility becomes in need of complete replacement. Damaged roads and potholes pose a risk to drivers and can cause accidents. It costs vast amounts of money for the damage it causes to vehicles and is responsible for a large part of highway deaths [1]. Road maintenance is critical to a country’s socio-economic development and the smooth continuation of day-to-day operations. It is critical to specify the type of damage and its location to assist in fixing it as soon as possible. In the Kingdom of Saudi Arabia, road damage and asphalt defects are detected using modern laser technology devices [2]. The use of these devices is often expensive. Moreover, the visual inspection is performed periodically, and the process is time-consuming, expensive, prone to errors, and does not provide top-level observability of the situation. It is safer and faster to report road damage using smartphone images.
Roads deteriorate gradually, particularly as a result of moisture and traffic. Water can deteriorate the road exterior, roadbed, and shoulder and can also damage the physical structures of the road. Traffic also causes road deterioration through the loss of surface material and the deformation of the road surface by vehicle tires, resulting in the road base becoming exposed and leading to ruts, potholes, and grooves [3]. There is an urgent demand and need for more efficient, advanced, and less costly methods. Therefore, it is necessary to take advantage of modern technologies and advanced methods in artificial intelligence to recognize road problems and estimate their impact by developing practical algorithms to detect and classify damage automatically. This can help municipalities repair defects promptly to prevent accidents and ensure the safety of road users. This research aims to develop an appropriate algorithm for developing a road vision system that can detect and classify road damage in an efficient and fast way.
The research contributions are as follows:
- Create a new dataset that contains road damage images in the Kingdom of Saudi Arabia. The dataset contains six types of road damage and their severity by capturing images using a smartphone. The dataset contains a wide variety of weather and lighting conditions. In addition, the images were taken from various angles.
- The newly created dataset was annotated and reviewed with the help of civil engineers with more than ten years of experience to comment on the dataset and make it reliable and error-free.
- Implement an appropriate classification algorithm for Saudi Arabia’s roads that is able to detect and classify road damage efficiently and quickly.
- Implement and evaluate several deep learning algorithms using the proposed dataset, including VGG-16, AlexNet, and ResNet-34.
- Evaluate the performance of the proposed method and compare the results with state-of-art algorithms and previous works.
2. Related Work
During the last few years, many datasets of road damages were released and made publicly available; some of these datasets are being used extensively by other researchers, such as the RDD2018 dataset released by Maeda et al. [4], which contained around 9000 images of eight types of road damage in Japan. The RDD2020 by Arya et al. [5] included around 26,000 images of eight classes of damage collected from the roads of India, Japan, and the Czech Republic. In general, road damage datasets can be divided into two types based on their uses. Detection datasets that are used primarily for binary classification such as the AigleRN dataset collected from France by Amhaz et al. [6], CFD collected from China released by Shi et al. [7], Temple University dataset collected from the United States by Zhang et al. [8], Denish Technological Institute dataset collected from Denmark by Silva et al. [9], and METU gathered from Turkey released by Özgenel [10]. The other type is the classification datasets which usually contain more than two positive classes, such as the Taiwan and Japan datasets released by Chen et al. [11], the Czech and Slovak datasets released by Mraz et al. [12], and many others.
Machine learning (ML) algorithms have been used for more than two decades to detect road damage, such as the work completed by Hoang et al. [13], Song et al. [14], and Hoang et al. [15]. Numerous studies have been proposed to detect potholes and cracks using edge detection and image thresholding, for instance, Otsu et al. [16], Ayenu-Prah et al. [17], and Koch et al. [18]. Many studies developed methods to detect cracks utilizing random structured forests, e.g., Shi et al. [7], and an unsupervised method based on Otsu’s thresholds and photo-metric information, e.g., Akagic et al. [19]. The ML methods used to detect potholes detection included unsupervised fuzzy c-means clustering and morphological reconstruction, e.g., Ouma et al. [20], and Support Vector Machine (SVM), e.g., Marques et al. [21]. Furthermore, Ahmadi et al. [22] and Cubero-Fernandez et al. [23] implemented several ML classification methods to classify four types of road damage, including K-nearest neighbors (KNN), Bagged Trees, SVM, and Decision Tree.
In recent years, deep learning (DL) has been widely used to detect road damage, for instance, Biçici et al. [24], Stricker et al. [25], and Zhang et al. [26]. These algorithms and techniques are being used now in self-driving cars to avoid obstacles and ensure road safety while driving. Most research uses detection tasks that only discover the damage. In many studies presented by Zhang et al. [8], Silva and Lucena [9], Rao et al. [27], and Fan et al. [28], several Convolutional Neural Network (CNN) models were presented to detect cracks in road images. Despite the good results that were achieved, the detection method only determines the presence of the damage; still, it does not classify its type. As a result, in recent studies, classification methods based on DL algorithms have been used on input images to classify them into various types of damage that can assist municipalities in accurately identifying and classifying damage. For instance, Ebenezer et al. [29] and Elghaish et al. [30] presented a method to detect four types of damage to the road using several CNN models.
Despite the good results that were achieved in the previous studies, the method detects only four types of road damage. However, a number of methods were developed to classifiy more than six types of road damage using different techniques. Maeda et al. [31] and Mraz et al. [12] proposed a method for road damage detection and classification based on Convolutional Neural Networks (CNNs). The model was trained using the SSD MobileNet and SSD Inception V2 frameworks. Singh et al. [32], Vishwakarma et al. [33], Kortmann et al. [34] and Wang et al. [35] proposed an automatic road damage detection and classification based on Convolutional Neural Network (CNN) using an R-CNN model. In the last two years, some studies have used advanced algorithms such as a single stage that uses a single CNN, such as YOLO, to predict the class and location of damage directly: for instance, Doshi and Yilmaz [36], Alfarrarjeh et al. [37], Jeong [38], Hegde et al. [39], Pena-Caballero [40] and Al-Shaghouri [41].
Although many studies have proposed approaches to automate the detection of road damages, several problems remain, and there is still room for more improvement. New methods could be proposed to classify more types of road damage more precisely, especially those present in the Kingdom of Saudi Arabia, whose nature of damage may differ from other countries from which the available datasets were collected in terms of geography and climate. Table 1 summarizes the studies conducted to detect and classify road damage using ML and DL methods, and as shown, the most used ML method was SVM. CNN was the most commonly used for DL.

Table 1.
Summary of ML and DL methods.
3. Dataset
This section presents our Saudi Arabia dataset (SARD-2022) for the proposed work to detect and classify road damage, which is followed by a detailed description of it.
3.1. Study Area
This study was conducted on the roads of the Kingdom of Saudi Arabia, and since there is no convenient dataset available, it was collected and compiled by the authors. Road images for the proposed study were selected from the municipality of the Rabigh region in Saudi Arabia. Rabigh is located on the eastern coast of the Red Sea in the Tihama region of western Saudi Arabia. It is one of the governorates of Makkah Al-Mukarramah. It has an area of about 14,000 km² and an inhabited population of almost 93 thousand [42] and is considered one of the most important historical, religious, and economic cities. Rabigh city has 13 major neighborhoods; in our work, we focus on five major neighborhoods, which are: Al Murjaniyah District, Al-Safa District, Al-Marwa District, Al-Nozha District, and AlNaseem District. Road selection and data collection time were made based on road accessibility, weather conditions, and traffic volume.
3.2. Data Collection
Road images were compiled in collaboration with maintenance employees in the municipality of Rabigh Governorate using a smartphone device, as shown in Figure 1. The images were saved in JPG format with different resolutions and were resized to 650 × 650 to obtain square images and maintain uniformity in the dataset. Furthermore, it can be noted that the proposed data majorly captures the images of flexible (asphalt) pavements. A total of 400 images were collected between January and March 2022 under varying weather and lighting conditions, including sunny, overcast, light rain, and sunset. In addition, the images were taken from various angles. However, only 242 images were found suitable for the study. The remaining images were either blurred or did not cover the required road damage categories or significant road portions, and they were discarded.
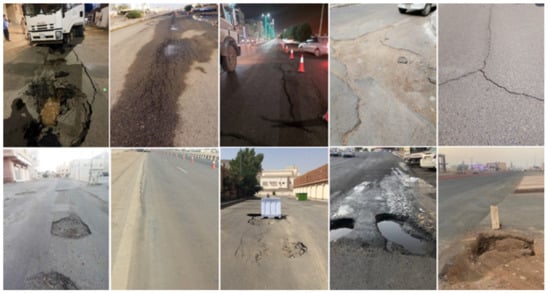
Figure 1.
Saudi Arabia Road Damage Dataset Sample.
3.3. Damage Classification
Saudi Arabia’s Ministry of Municipal and Rural Affairs [43] recognizes 19 different types of surface deterioration divided into three major categories: (cracking), deformation, and disintegration. The type and cost of maintenance are determined by the type of pavement damage, distress type, and intensity (low, medium, and high). However, the standards for evaluating road pavement damage types and conditions are not the same across the cities and vary significantly. Since the aim of this study is to consider the perspective of monitoring road conditions in cities, we have used three major categories of damage and determined the damage severity for each type. The classes include three types of cracks, which are longitudinal and transverse cracks, alligator cracks, and edge cracks. It also contains two types of distortion: shoving and depression, and one type of disintegration: potholes, as shown in Table 2 and Table 3. In addition, there are other categories of road damage, such as rutting and raveling; however, it is difficult to distinguish them in the images from the other types of images mentioned before, so they were excluded.
Table 2.
Damage Categories.
Table 3.
Damage Severity.
3.4. Data Annotation
Annotating data is a critical component of the success of several machine learning projects. In this work, the annotation is completed manually by hiring civil engineers with more than ten years of experience to comment on the dataset and make it reliable, error-free, and publishable in the research community. Annotation took considerable time because the dataset had to be first reviewed to ensure that all the images were valid, free from defects, and named correctly. The annotation was carried out in two phases. In the first phase, the engineers sorted the images and chose the appropriate categories, excluding the unclear images; there were six different damage categories. Then, the second engineer classified these damages according to their severity: high intensity or low intensity. The images were stored in folders and saved on Google Drive to make it easier to reach and use.
3.5. Data Statistics
Figure 2 shows the statistics for the Saudi Arabia road datasets. It can be noted that the number of instances for various damage classes in datasets is unbalanced. As a result, image augmentation techniques were used to create a balanced representation that can be used to train deep learning models.
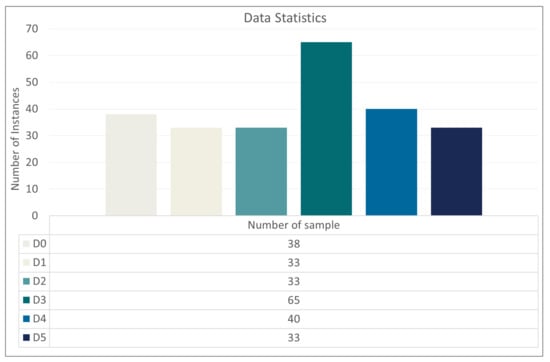
Figure 2.
Statistics about the total of damage cases inside the underlying datasets.
4. Methodology
The proposed classification model consisted of five main stages: data collection, data preprocessing and augmentation, implementation of different CNN models, and experiment and evaluation, as shown in Figure 3. The damages were classified according to their types and severity using transfer learning, pre-training models, and the proposed self-designed CNN model. Finally, this work evaluates and analyzes the obtained results using the state-of-the-art performance metrics; the results are presented in Section 6.
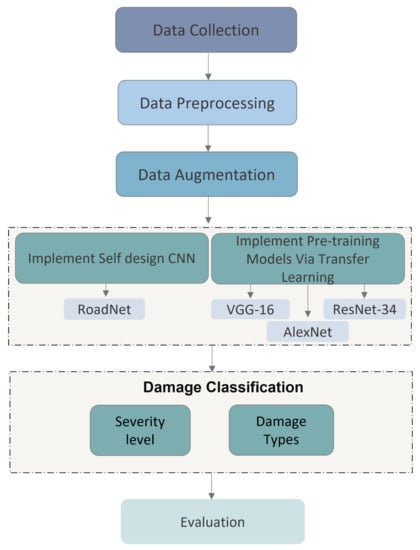
Figure 3.
Steps of our proposed method.
4.1. Data Preprocessing
The essential step in any computer vision (CV) system is image preprocessing [44,45]. The first step was changing the size of all the images to 650 × 650 to obtain square images and maintain uniformity in the dataset. Then, the input images were resized to fit the input size of several models. The input of RoadNet, which was self-designed, was resized to 256 × 256 pixels. In AlexNet, the input resolution was resized to 227 × 227 pixels, while ResNet34 and VGG-16 input images were resized to 224 × 224 pixels.
4.2. Data Augmentation
Deep networks require a large amount of training data to perform well. Image augmentation is typically required to build a robust image classifier with very little training data [46]. Image augmentation creates training images artificially using various processing methods or a combination of them, such as rotation, noise, translation, flips, and blur [47]. The original dataset included 242 images. After applying the augmentation techniques, it was divided into two sets; the first set contained 80% of the images and was used for training, and the second set contained 20% of the images and was used for testing. In this work, we used four different types of augmentation techniques to create new images, including rotation, flipping, zooming, and brightness. Image rotation is one of the most widely used augmentation techniques. This technique can be applied to increase the size of the dataset by generating multiple images rotated at different angles ranging from 0 to 360 degrees. As for image flipping, it can be thought of as an extension of rotation. It enables us to flip the image in both the left–right and up–down directions. Image brightness is another popular image augmentation technique that is essential when training the model because it enables the model to identify images in different lighting levels, either darker or lighter. In terms of zooming techniques, the image is randomly zoomed either in or out within a range of [1-value, 1+value]. In our work, we used rotation by 23 degrees, horizontal flip by 0.5, zoom by [0.5], and brightness at [0.5, 1.5]. As illustrated in Figure 4, these techniques were applied to each image to obtain a new training and testing sample.
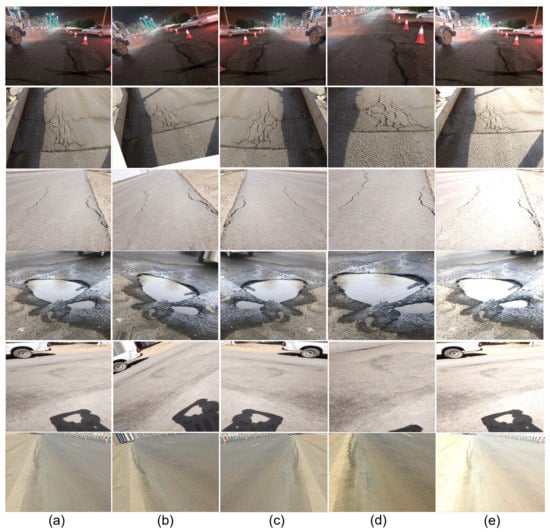
Figure 4.
Example of augmented images: (a) original image, (b) rotation 23 degrees, (c) horizontal flip, (d) zoom [0.5], and (e) brightness [0.5, 1.5].
4.3. Splitting Data
Data splitting is an essential element of data science, particularly for creating accurate models based on machine learning to avoid overfitting. Typically, the data are divided into two or more subsets. With a two-part split, one part is used to evaluate or test the models and the other is used to train the models. Thus, a dataset correctly distributed in training and test sets is needed to assess the performance of a deep neural network model impartially. In our proposed work, the data were divided using the standard rate of 80:20, where 80% of the dataset was used for training and 20% was used for evaluation using a split-folders package. As a result, the model output was measured based on 20% of the data that was not used during training or seen by the model before to ensure that the analysis will be equitable. We relied on 80% of the training dataset because our dataset is small, and a large amount of data is required to adequately train deep neural network models.
4.4. Transfer Learning
Transfer learning is the reuse of a pre-trained model on a new problem. It is currently very popular in deep neural networks that require huge amounts of data and computational power [48,49,50]. It is an effective approach to reduce training time by fine-tuning a deep learning model that has previously been trained for a similar purpose. The general idea is to use the knowledge a model has learned from a task with many labeled training data in a new task that does not have much data, as illustrated in Figure 5. To overcome the training time and size of data, we applied the concept of transfer learning to three different pre-trained CNN models. These models included AlexNet, designed by Alex Krizhevsky in collaboration with Ilya Sutskever and Geoffrey Hinton [51], VGG16, introduced by Simonyan and Zisserman [52], and ResNet34, proposed by researchers at Microsoft Research [53]. In our proposed work, we unfroze the last layers of these pre-trained models and trained them again on our dataset after freezing all their initial layers.
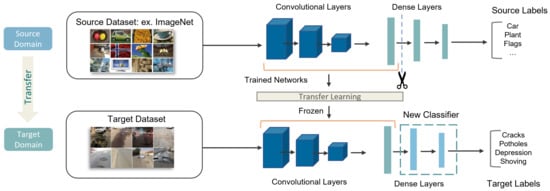
Figure 5.
Schematic representation of our transfer learning models.
4.5. Self-Design CNN (RoadNet)
This section describes the architecture of the proposed CNN used to detect road damage. The model consists of six layers: two convolution layers followed by a pooling layer, two fully connected layers, and a ReLU layer. Several filters were used for each convolution layer for various sorts of feature extraction. To reduce the over-fitting problem, dropout was presented as a regularization in our model in both max-pooling and fully connected layers. The input images were resized to 256 × 256 × 3. The training process was speeded up by selecting a batch size of 32 and using a learning rate of 0.0001. Two deep layers were defined; the first layer has an input channel of one, with a kernel of 5 × 5, a stride of one, and padding of two. After convolution, the image measure was decreased, and the value of padding was set to zero to maintain the same size. The ReLU function was used as the activation layer in this model because it is difficult to saturate and has an acceptable gradient in comparison to other activation functions. The max-pooling layer used a kernel and stride value of two. In the second convolution layer, the size of the input is 32, the size of the output is 64, the kernel size is 5 by 5, the size of stride is one, and the size of padding is two. In addition, ReLU and max pooling are the same in both layers. A dropout layer was added to solve and reduce the fit problem. Two fully connected layers were added in the end for the connection of all neurons. An SGD optimizer with momentum = 0.9 was utilized to update weights. It updates learning rates for various parameters in an automatic way. Figure 6 displays the structure of our CNN model.
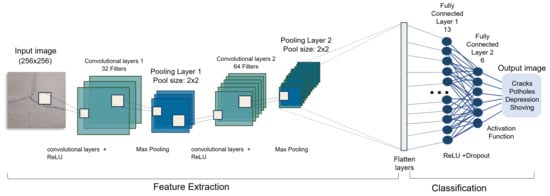
Figure 6.
Architecture of RoadNet.
4.6. Model Design
Four different models were used in this work: self-designed CNN (RoadNet), Alexnet, VGG-16, and ResNet-34. Our models were trained through augmentation from the original dataset by using four augmentation techniques mentioned in Section 4.2. After applying the augmentation techniques, the total dataset of 5758 images is divided into 4800 training images and 1200 test images, as shown in Table 4. We have employed the transfer learning approach to deal with the training time and limited data. Furthermore, the upper layers and the fully connected (FC) layers inserted at the end of the pre-trained models were frozen and trained again using our proposed dataset to obtain the desired results. In contrast, the upper layers’ weights remained constant. Twenty epochs, an SGD optimizer with momentum 0.9, and the ReLu activation function were used to train our model. The SGD optimizer is a stochastic optimization technique. The hyper-parameter values are shown in Table 5.
Table 4.
Our dataset before and after augmentation techniques.
Table 5.
Hyper-parameters setting.
5. Experimental Setup
The experiments were carried out using Python and PyTorch library with Google Colaboratory (Colab) on a PC with an AMD Ryzen 5 3500U 2.10 GHz CPU with Radeon Engineering, Vega Mobile GFX, and 8 GB of RAM, running Windows 10 64-bit. The dataset was divided into 80% for training and 20% for validation using the split-folders package.
Evaluation Measures
For the experiments evaluated, we used several metrics to evaluate the models’ performance. The formulae are defined as follows:
where TP, FN, TN, and FP represent the true positive prediction, false negative prediction, true negative prediction, and false positive prediction, respectively, as shown in Equations (1)–(6).
6. Results and Discussion
This experiment was performed using the SARD-2022 dataset proposed in this study by us. The damage types include longitudinal and transverse cracks, alligator cracks, edge cracks, potholes, depressions, and shoving. We first classify the types of damage into six classes and then classify them according to their severity into two classes: high damage (D_high) or low damage (D_low). Table 6 demonstrates the performance of the four models in classifying six classes of damage. Multiple deep learning models were implemented to evaluate their performance and determine which best fits the dataset and is the most effective and efficient at classifying six types of road damage. These models included RoadNet, AlexNet, ResNet 34, and VGG-16. It could be seen that the RoadNet model outperforms with the highest performance on test images at 98.6% accuracy, because it has less computational complexity and less parameters than the other models. The accuracy of AlexNet is 98.5%, but it has a higher computational complexity and more parameters compared to RoadNet. Meanwhile, the lowest accuracy of 80% was achieved by the ResNet34 model.
Table 6.
Comparison between RoadNet, AlexNet, VGG-16, and ResNet-34 to classify road damage based on six different types of surface damage using our dataset.
We further evaluate using different types of damage to detect their severity as high or low. Table 7 demonstrates the performance of the four models to classify six classes of damage according to their severity. In this experiment, there was a slight decrease in accuracy in all models due to the fact that each damage was categorized into two categories (D_high and D_low), and the total number of categories entered in the training process became 12 categories. The RoadNet achieved higher accuracy than other models. An increase in the accuracy of ResNet34 has also been observed of 81% from the previous experiment. In all these experiments, it was noticed that the VGG-16 network takes a lot of time in the training process, also followed by AlexNet, while the network of ResNet34 was fast but did not achieve good results. It has been discovered that VGG-16 has the most parameters, indicating that it has a higher computational complexity than pre-training models. The RoadNet model has fewer parameters and a shorter training time when compared to other models. It also outperformed the other pre-trained models in terms of accuracy.
Table 7.
Comparison between RoadNet, AlexNet, VGG-16, and ResNet-34 to classify road damage severity based on six different types of surface damage using our dataset.
Comparison with Previous Works
Many studies have been conducted to detect and classify road damage using machine learning (ML) and deep learning (DL), but because most of these methods used different datasets and evaluation measurements, comparing the results objectively is difficult. The results of the previous work are shown in Table 8. In Zhang et al. [8], they presented a Deep Convolutional Neural Network (ConvNet) to detect cracks in the road. The ConvNet consists of two convolutional layers and two fully connected layers. The dataset consists of 500 pavement images with and without cracks at a resolution of 3264 × 2448. The images were collected using a smartphone at the USA’s Temple University campus. The results achieved a precision of 0.86%, a recall of 0.92%, and an F1 score of 0.89%. Our approach achieved a better accuracy of 0.99%, a recall of 0.99%, and an F1 score of 0.99% with two convolutional layers followed by two fully connected layers, with six different damage classes classified. Silva and Lucena [9] applied a crack detection model dependent on a convolutional neural network (CNN). The model was trained using the VGG16 framework and a dataset collected from the Danish Technological Institute Dataset. It achieved an accuracy of 92.27%; as for our VGG-16 model, it achieved a better accuracy of 95.1%. Rao et al. [27] presented several convolutional neural network (CNN) classification models to detect the crack image. The dataset consists of 2173 pavement images with and without cracks at a resolution of 256 × 256. The result of the AlexNet model achieved 94% accuracy and 88% precision. Our model AlexNet achieved a better accuracy of 98.4% and a precision of 0.99%.
Table 8.
Comparison with previous works.
7. Conclusions and Future Work
This work aims to contribute positively by assisting the Ministry of Transport, especially the municipalities in the Kingdom of Saudi Arabia, use modern technologies such as artificial intelligence by developing an efficient automated system that can detect road damage. A method for classifying road damage based on deep learning algorithms was proposed and trained with four CNN models on a reliable Saudi dataset. Based on the size of the obtained dataset, the transfer learning approach was used with three pre-trained models to solve the problem of data volume and training time. Customized FC layers were defined and associated with the pre-trained models to perform classification. Five classification evaluation metrics, were used to evaluate the methods. The results of classifying six types of damage show that RoadNet obtained the highest accuracy at 98.6%, followed by AlexNet at 98.4%, VGG-16 at 95.1%, and Resnet-34 at 80%. According to the severity of the damage, RoadNet achieved a better accuracy of 97% than other pre-trained models. One current limitation of our models is that they are calibrated using a relatively limited dataset. The performance of the models will be improved by having more data available to cover all types of potential damage. In future work, the proposed dataset will be improved by adding more images from other regions of the Kingdom of Saudi Arabia and using the dash-cam and smartphones. It is hoped that collaboration with research groups and municipalities in Saudi Arabia will lead to a much more extensive database for a more accurate predictive model. There will also be work to develop and improve our model to aid the surveillance cameras (CCTV) on roads in detecting damages in real time and informing the responsible authorities of the location and type of damage to improve decision making. Future work also includes using validation methods such as k-fold cross-validation to estimate the models’ performance and evade bias and over-fitting during the training process.
Author Contributions
All authors have contributed equally to this work. All authors have read and agreed to the published version of the manuscript.
Funding
The authors would like to thank the Deanship of Scientific Research at Umm Al-Qura University for supporting this work by Grant Code: (20UQU0067DSR).
Institutional Review Board Statement
Not applicable.
Informed Consent Statement
Not applicable.
Data Availability Statement
Not applicable.
Acknowledgments
The authors would like to thank the municipality of Rabigh Governorate, Saudi Arabia, especially Eng. Fahad bin Saud, Head of Projects and Studies Department at Municipality of Rabigh Governorate and Eng. Mostafa Magdy for providing their expertise.
Conflicts of Interest
The authors declare no conflict of interest.
References
- Khan, K.; Zaidi, S.B.; Ali, A. Evaluating the nature of distractive driving factors towards road traffic accident. Civ. Eng. J. 2020, 6, 1555–1580. [Google Scholar] [CrossRef]
- Ministry of Transport and Logistic Services. Road Maintenance. Available online: https://mot.gov.sa/en/Roads/Pages/RoadsMaintenance.aspx (accessed on 15 September 2022).
- Department of Local Infrastructure Development and Agricultural Roads (DoLIDAR). Road Maintenance Groups (RMG). Available online: https://www.ilo.org/dyn/asist/docs/F1259778069/rmg.pdf (accessed on 1 March 2016).
- Maeda, H.; Sekimoto, Y.; Seto, T.; Kashiyama, T.; Omata, H. Road damage detection and classification using deep neural networks with smartphone images. Comput.-Aided Civ. Infrastruct. Eng. 2018, 33, 1127–1141. [Google Scholar] [CrossRef]
- Arya, D.; Maeda, H.; Ghosh, S.K.; Toshniwal, D.; Sekimoto, Y. RDD2020: An annotated image dataset for automatic road damage detection using deep learning. Data Brief 2021, 36, 107133. [Google Scholar] [CrossRef] [PubMed]
- Amhaz, R.; Chambon, S.; Idier, J.; Baltazart, V. Automatic crack detection on two-dimensional pavement images: An algorithm based on minimal path selection. IEEE Trans. Intell. Transp. Syst. 2016, 17, 2718–2729. [Google Scholar] [CrossRef]
- Shi, Y.; Cui, L.; Qi, Z.; Meng, F.; Chen, Z. Automatic road crack detection using random structured forests. IEEE Trans. Intell. Transp. Syst. 2016, 17, 3434–3445. [Google Scholar] [CrossRef]
- Zhang, L.; Yang, F.; Zhang, Y.D.; Zhu, Y.J. Road crack detection using deep convolutional neural network. In Proceedings of the 2016 IEEE International Conference on Image Processing (ICIP), Phoenix, AZ, USA, 25–28 September 2016; pp. 3708–3712. [Google Scholar]
- Silva, W.R.L.D.; Lucena, D.S.D. Concrete cracks detection based on deep learning image classification. Multidiscip. Digit. Publ. Inst. Proc. 2018, 2, 489. [Google Scholar]
- Özgenel, Ç.F. Concrete Cracks Detection Based on Deep Learning Image Classification. Proceedings 2018, 2, 489. [Google Scholar] [CrossRef]
- Chen, D.R.; Chiu, W.M. Deep-Learning-Based Road Crack Detection Frameworks for Dashcam-captured Images under Different Illumination Conditions. Available online: https://europepmc.org/article/ppr/ppr369116 (accessed on 15 September 2022).
- Mraz AM, A.; Sekimoto YS, Y.; Kashiyama TK, T.; Maeda HM, H. Development of the Localized Road Damage Detection Model Using Deep Neural Network. In Proceedings of the 2020 3rd International Conference on Sensors, Signal and Image Processing, Virtual, 9–11 October 2020; pp. 1–6. [Google Scholar]
- Hoang, N.D.; Nguyen, Q.L.; Tien Bui, D. Image processing–based classification of asphalt pavement cracks using support vector machine optimized by artificial bee colony. J. Comput. Civ. Eng. 2018, 32, 04018037. [Google Scholar] [CrossRef]
- Song, H.; Baek, K.; Byun, Y. Pothole detection using machine learning. Adv. Sci. Technol. 2018, 150, 151–155. [Google Scholar] [CrossRef]
- Hoang, N.D. An artificial intelligence method for asphalt pavement pothole detection using least squares support vector machine and neural network with steerable filter-based feature extraction. Adv. Civ. Eng. 2018, 2018, 7419058. [Google Scholar] [CrossRef]
- Otsu, N. A threshold selection method from gray-level histograms. IEEE Trans. Syst. Man, Cybern. 1979, 9, 62–66. [Google Scholar] [CrossRef]
- Ayenu-Prah, A.; Attoh-Okine, N. Evaluating pavement cracks with bidimensional empirical mode decomposition. Eurasip J. Adv. Signal Process. 2008, 2008, 1–7. [Google Scholar] [CrossRef]
- Koch, C.; Brilakis, I. Pothole detection in asphalt pavement images. Adv. Eng. Inform. 2011, 25, 507–515. [Google Scholar] [CrossRef]
- Akagic, A.; Buza, E.; Omanovic, S.; Karabegovic, A. Pavement crack detection using Otsu thresholding for image segmentation. In Proceedings of the 2018 41st International Convention on Information and Communication Technology, Electronics and Microelectronics (MIPRO), Opatija, Croatia, 21–25 May 2018; pp. 1092–1097. [Google Scholar]
- Ouma, Y.O.; Hahn, M. Pothole detection on asphalt pavements from 2D-colour pothole images using fuzzy c-means clustering and morphological reconstruction. Autom. Constr. 2017, 83, 196–211. [Google Scholar] [CrossRef]
- Marques, A.; Correia, P.L.; Automatic road pavement crack detection using SVM. Lisbon, Portugal: Dissertation for the Master of Science Degree in Electrical and Computer Engineering at Instituto Superior Técnico. Available online: https://api.semanticscholar.org/CorpusID:111379079 (accessed on 10 February 2022).
- Ahmadi, A.; Khalesi, S.; Golroo, A. An integrated machine learning model for automatic road crack detection and classification in urban areas. Int. J. Pavement Eng. 2022, 23, 3536–3552. [Google Scholar] [CrossRef]
- Cubero-Fernandez, A.; Rodriguez-Lozano, F.; Villatoro, R.; Olivares, J.; Palomares, J.M. Efficient pavement crack detection and classification. EURASIP J. Image Video Process. 2017, 2017, 39. [Google Scholar] [CrossRef]
- Biçici, S.; Zeybek, M. An approach for the automated extraction of road surface distress from a UAV-derived point cloud. Autom. Constr. 2021, 122, 103475. [Google Scholar] [CrossRef]
- Stricker, R.; Eisenbach, M.; Sesselmann, M.; Debes, K.; Gross, H.M. Improving visual road condition assessment by extensive experiments on the extended gaps dataset. In Proceedings of the 2019 International Joint Conference on Neural Networks (IJCNN), Budapest, Hungary, 14–19 July 2019; pp. 1–8. [Google Scholar]
- Zhang, A.; Wang, K.C.; Li, B.; Yang, E.; Dai, X.; Peng, Y.; Fei, Y.; Liu, Y.; Li, J.Q.; Chen, C. Automated pixel-level pavement crack detection on 3D asphalt surfaces using a deep-learning network. Comput.-Aided Civ. Infrastruct. Eng. 2017, 32, 805–819. [Google Scholar] [CrossRef]
- Rao, A.S.; Nguyen, T.; Palaniswami, M.; Ngo, T. Vision-based automated crack detection using convolutional neural networks for condition assessment of infrastructure. Struct. Health Monit. 2021, 20, 2124–2142. [Google Scholar] [CrossRef]
- Fan, R.; Bocus, M.J.; Zhu, Y.; Jiao, J.; Wang, L.; Ma, F.; Cheng, S.; Liu, M. Road crack detection using deep convolutional neural network and adaptive thresholding. In Proceedings of the 2019 IEEE Intelligent Vehicles Symposium (IV), Paris, France, 9–12 June 2019; pp. 474–479. [Google Scholar]
- Shamila Ebenezer, A.; Deepa Kanmani, S.; Sheela, V.; Ramalakshmi, K.; Chandran, V.; Sumithra, M.; Elakkiya, B.; Murugesan, B. Identification of Civil Infrastructure Damage Using Ensemble Transfer Learning Model. Adv. Civ. Eng. 2021, 2021, 5589688. [Google Scholar] [CrossRef]
- Elghaish, F.; Talebi, S.; Abdellatef, E.; Matarneh, S.T.; Hosseini, M.R.; Wu, S.; Mayouf, M.; Hajirasouli, A.; Nguyen, T.-Q. Developing a new deep learning CNN model to detect and classify highway cracks. J. Eng. Des. Technol. 2021, 20, 993–1014. [Google Scholar] [CrossRef]
- Maeda, H.; Sekimoto, Y.; Seto, T.; Kashiyama, T.; Omata, H. Road damage detection using deep neural networks with images captured through a smartphone. arXiv 2018, arXiv:1801.09454. [Google Scholar]
- Singh, J.; Shekhar, S. Road damage detection and classification in smartphone captured images using mask r-cnn. arXiv 2018, arXiv:1811.04535. [Google Scholar]
- Vishwakarma, R.; Vennelakanti, R. Cnn model & tuning for global road damage detection. In Proceedings of the 2020 IEEE International Conference on Big Data (Big Data), Atlanta, GA, USA, 10–13 December 2020; pp. 5609–5615. [Google Scholar]
- Kortmann, F.; Talits, K.; Fassmeyer, P.; Warnecke, A.; Meier, N.; Heger, J.; Drews, P.; Funk, B. Detecting various road damage types in global countries utilizing faster r-cnn. In Proceedings of the 2020 IEEE International Conference on Big Data (Big Data), Atlanta, GA, USA, 10–13 December 2020; pp. 5563–5571. [Google Scholar]
- Wang, W.; Wu, B.; Yang, S.; Wang, Z. Road damage detection and classification with Faster R-CNN. In Proceedings of the 2018 IEEE International Conference on Big Data (Big Data), Seattle, WA, USA, 10–13 December 2018; pp. 5220–5223. [Google Scholar]
- Doshi, K.; Yilmaz, Y. Road damage detection using deep ensemble learning. In Proceedings of the 2020 IEEE International Conference on Big Data (Big Data), Atlanta, GA, USA, 10–13 December 2020; pp. 5540–5544. [Google Scholar]
- Alfarrarjeh, A.; Trivedi, D.; Kim, S.H.; Shahabi, C. A deep learning approach for road damage detection from smartphone images. In Proceedings of the 2018 IEEE International Conference on Big Data (Big Data), Seattle, WA, USA, 10–13 December 2018; pp. 5201–5204. [Google Scholar]
- Jeong, D. Road damage detection using yolo with smartphone images. In Proceedings of the 2020 IEEE International Conference on Big Data (Big Data), Atlanta, GA, USA, 10–13 December 2020; pp. 5559–5562. [Google Scholar]
- Hegde, V.; Trivedi, D.; Alfarrarjeh, A.; Deepak, A.; Kim, S.H.; Shahabi, C. Yet another deep learning approach for road damage detection using ensemble learning. In Proceedings of the 2020 IEEE International Conference on Big Data (Big Data), Atlanta, GA, USA, 10–13 December 2020; pp. 5553–5558. [Google Scholar]
- Pena-Caballero, C.; Kim, D.; Gonzalez, A.; Castellanos, O.; Cantu, A.; Ho, J. Real-time road hazard information system. Infrastructures 2020, 5, 75. [Google Scholar] [CrossRef]
- Shaghouri, A.A.; Alkhatib, R.; Berjaoui, S. Real-Time Pothole Detection Using Deep Learning. arXiv 2021, arXiv:2107.06356. [Google Scholar]
- Authority, Q.S. The General Census of Population and Housing, and Establishment, April 2010. Available online: https://www.stats.gov.sa/en/13 (accessed on 11 May 2022).
- Ministry of Municipal and Rural Affairs. Evaluation Guide for Road Paving Layers and Facilities (2019), PDF. Available online: https://www.scribd.com/document/475078318/ (accessed on 11 May 2022).
- Cunha, B.S.D. Development of Computer Vision Based Models for Automated Crack Detection. Master’s Thesis, Universidade Federal de Pernambuco, Recife, Brazil, 2020. [Google Scholar]
- Ma, N.; Fan, J.; Wang, W.; Wu, J.; Jiang, Y.; Xie, L.; Fan, R. Computer vision for road imaging and pothole detection: A state-of-the-art review of systems and algorithms. arXiv 2022, arXiv:2204.13590. [Google Scholar]
- Shorten, C.; Khoshgoftaar, T.M. A survey on image data augmentation for deep learning. J. Big Data 2019, 6, 1–48. [Google Scholar] [CrossRef]
- Taylor, L.; Nitschke, G. Improving deep learning with generic data augmentation. In Proceedings of the 2018 IEEE Symposium Series on Computational Intelligence (SSCI), Bangalore, India, 18–21 November 2018; pp. 1542–1547. [Google Scholar]
- Marcelino, P. Transfer learning from pre-trained models. Towards Data Sci. 2018, 10, 23. [Google Scholar]
- Feng, C.; Zhang, H.; Wang, S.; Li, Y.; Wang, H.; Yan, F. Structural damage detection using deep convolutional neural network and transfer learning. Ksce J. Civ. Eng. 2019, 23, 4493–4502. [Google Scholar] [CrossRef]
- Nie, M.; Wang, K. Pavement distress detection based on transfer learning. In Proceedings of the 2018 5th International Conference on Systems and Informatics (ICSAI), Nanjing, China, 10–12 November 2018; pp. 435–439. [Google Scholar]
- Krizhevsky, A.; Sutskever, I.; Hinton, G.E. Imagenet classification with deep convolutional neural networks. Adv. Neural Inf. Process. Syst. 2012, 25, 89–90. [Google Scholar] [CrossRef]
- Simonyan, K.; Zisserman, A. Very deep convolutional networks for large-scale image recognition. arXiv 2014, arXiv:1409.1556. [Google Scholar]
- He, K.; Zhang, X.; Ren, S.; Sun, J. Deep residual learning for image recognition. In Proceedings of the IEEE Conference on Computer Vision and Pattern Recognition, Las Vegas, NV, USA, 27–30 June 2016; pp. 770–778. [Google Scholar]
Publisher’s Note: MDPI stays neutral with regard to jurisdictional claims in published maps and institutional affiliations. |
© 2022 by the authors. Licensee MDPI, Basel, Switzerland. This article is an open access article distributed under the terms and conditions of the Creative Commons Attribution (CC BY) license (https://creativecommons.org/licenses/by/4.0/).