1. Introduction
With the rapid development of China’s economy and aviation technology, China has been adding new airports and planning new routes in recent years. According to the International Air Transport Association (IATA), the total civil passenger traffic within China will surpass that of the United States around 2025, becoming the world’s largest aviation market [
1]. The resulting contradiction between the rapid growth of air traffic flow and the inadequate development of air traffic management system capacity is becoming more and more serious, which brings enormous pressure and burden to the work of controllers. As the main participant and implementer in the air traffic management process, the controller’s work status is the main reason for determining whether the air traffic control (ATC) system can operate smoothly or not. The controller workload, as an important factor affecting the controller’s work status, is of great significance to maintaining a reasonable and stable operation of the ATC system, whether its evaluation method is scientific or not. Therefore, this paper intends to study the interrelationship between controllers and aircraft to provide support for controller workload evaluation.
In terms of controller workload evaluation, experts from various countries have conducted a lot of research, mainly including subjective and objective evaluation methods. Stein E. was the first to propose the Air Traffic Workload Input Technique (ATWIT) based on the control interface in 1985 [
2], Hart proposed the National Aeronautics and Space Administration-task load index (NASA-TLX) in 1988 [
3], and British scientists proposed the “DORATASK” method based on controlled work time [
4]. With the maturity of related technology, the research on objective evaluation methods is also developing and improving. Zhao used principal component analysis to analyze the change pattern of electrocardiogram (ECG) signals with working time and concluded that two ECG indicators, RR mean and SDNN, can evaluate the fatigue state [
5]. In 2020, Wang Lili and Chen Fenglan proposed a method to evaluate the workload using EEG signals [
6]. Friedrichs F. used eye-movement recognition to make a recognition assessment of the controller workload [
7]. However, the subjective methods mentioned above have the problems of excessive subjectivity and timeliness, and the objective methods can interfere with the normal work of controllers because of their need to wear measurement equipment.
From a cognitive point of view, controllers, as the core of the air traffic system, need to understand the airspace and its situational evolution, including aircraft position and other information, with the help of equipment, and make adjustments in case of unexpected situations. This is also the main cause of the controller’s workload. Therefore, Delahaye proposed a controller workload evaluation system constructed from four indicators, such as traffic density, convergence, dispersion, and sensitivity, by analyzing information such as aircraft position and heading in the airspace [
8,
9].
In fact, the essence of the evolutionary development of the air traffic system belongs to the evolution and development of complex relationships between various elements of the system, led by aircraft, and each other. The complex network theory is able to describe the complex system abstractly and emphasize the topological characteristics of the system, which enables the system essentially to be understood. Therefore, the introduction of complex network theory is expected to be able to analyze and understand the system from its essence and make an effective assessment of the air situation and controller workload. Therefore, Laudeman et al. of the American Board of Aeronautical Radio were the first to introduce complex network theory into the field of air traffic control, using the relevant metrics in complex network theory as indicators for evaluating the measurement of control difficulty and controller workload [
10]. Zhang Jin et al. were the first to use complex network theory in the field of ATC, and constructed a complex network model for the problem of airspace complexity evaluation [
11]. Then, Wang Hongyong chose to use the looming effect between aircraft for the description of the airspace complexity problem [
12,
13,
14,
15]. Yuan Xiao discussed the relationship between controller brain workload and air traffic dynamic complexity [
16]. Minggong Wu performed the evaluation of air traffic complexity by constructing a flight state network and used it to evaluate flight safety and quality accordingly [
17,
18]. Kexin Bi proposed to construct a complex network using the velocity barrier method to explain the air traffic complexity, performed conflict identification and detection, and proposed a resolution strategy based on the optimal dominating set [
19,
20]. Since the above studies mainly carry out the construction and analysis of network models from the two-dimensional level, which is partially different from the real situation, they cannot effectively analyze the relationship between the effects of different altitude layers. Therefore, this paper proposes the application of the velocity barrier method from a three-dimensional perspective, combining the aircraft position, velocity and heading information as well as the flight protection zone information to be satisfied during flight for the construction of a single-layer flight conflict complex network.
However, in practice, a completely independent single-layer complex network is almost non-existent. The vast majority of systems are formed by several or even more networks coupled and interdependent on each other, and ATC systems are no exception. The concept of interdependent networks was first introduced by Buldyrev in 2010, which considered that each layer of the network has the same number of nodes and only one-to-one correspondence [
21]. Subsequently, Parshani modified this restriction by proposing that only a random number of nodes in each layer of the network are one-to-one interdependent on nodes in another layer of the network [
22]. Finally, the basic theory of interdependent networks was finally refined by Shao, who proposed that nodes in a certain layer of the network form connected edges with nodes between other networks according to a certain probability [
23]. Xinglong Wang was the first to introduce the theory of interdependent networks in the field of civil aviation and constructed the interdependent networks using airports, control sectors and flight paths [
24,
25]. Ang Li constructed a control–flight state interdependent network and analyzed the network characteristics and evolution process [
26,
27].
Based on the analysis of the above-mentioned studies, it can be found that, as a part of modern ATC system, controllers are responsible for the control of aircraft in their control sectors, and at the same time there are control work handover relationships with the surrounding controllers and their control sectors. The control network with controllers as nodes and the flight conflict network with aircraft as nodes satisfy the conditions for the construction of interdependent networks. At the same time, the relevant indexes of the complex network can make a reasonable prediction and assessment of the air situation and make a prediction and assessment of the controller workload. Therefore, this paper constructs an interdependent network model by combining the control network and the flight conflict network, and analyzes and studies the indicators of the network on this basis to make a reasonable prediction and assessment of the controller workload.
2. Interdependent Network Construction
Interdependent networks, as a type of complex network, have multiple layers of inter-network interdependence within them. This interdependence can be reflected in the real world in terms of physical dependencies, information exchange, etc.
In the actual operation of the ATC system, the pilots of the aircraft in the air can communicate with each other by radio, and there may be conflicts between aircraft in close proximity. For controllers, they have the absolute control of aircraft, and aircraft pilots need to strictly comply with the controller’s commands to ensure the safety of flight. Moreover, when the aircraft exceeds its control range, the controller needs to transfer the control right to the controller in the adjacent control sector. Therefore, we can build a flight conflict network and a control network according to the flight situation and control situation in the air. The two constructed networks are dependent on each other, and the nodes and edges of the two networks are constructed under different conditions. Therefore, the two networks can be coupled and form an interdependent network.
In order to clarify the research methodology, the network model is simplified and assumed accordingly here.
- (1)
The flight conflict network model is a complex network model constructed using the speed barrier method. The network constructed is not specified or specific to a flight field or control phase, and is universal in nature. The conflicts identified and discussed in the network are derived from potential conflicts.
- (2)
In the actual operation, the size, shape and height of the sector have less influence on the controller’s workload and the transfer of control rights. Therefore, a square area is used for the delineation of sectors in this paper.
2.1. Flight Conflict Network
The flight conflict network in this paper is constructed with aircraft as the network nodes and the relationship between aircraft as the connected edges. The existence of connected edges between the nodes in the network proves that the aircraft represented by the nodes have direct conflict relationships, which will affect the network if not handled in time. Since the conflict relationship is undifferentiated for aircraft, the flight conflict network is an undirected network. In ICAO document 8168, the communication response range between aircraft is defined as 14 n mile, which is about 26 km. Therefore, the following requirements need to be satisfied when constructing the connected edges of the flight conflict network in this paper.
(1) The positions of the aircraft corresponding to the nodes are in proximity in space, as shown in
Figure 1. Aircraft constitute a communication relationship when their distance from each other is less than 26 km.
(2) Secondary determination of nodes with communication relations. The nodes are judged by the speed barrier method. Since aircraft need to maintain a certain relative interval between each other during operation, an ellipsoidal flight protection zone is constructed for aircraft. The length of the long axis a and short axis b of the flight protection zone is 10 km, and the length z of the polar radius c is 0.3 km, as shown in
Figure 2, with reference to the aircraft-related intervals.
As shown in
Figure 3, the flight of two aircraft can be considered as aircraft A at rest and aircraft B flying along the direction of relative motion V. If the direction of relative motion of the aircraft points in the flight protection zone, then when the aircraft maintains the current heading and speed unchanged and the controller does not deploy, eventually the two aircraft will have a conflict. In this case, it is determined that the nodes corresponding to the aircraft constitute a connected edge.
In
Figure 3, VA denotes the direction of velocity of aircraft A; VB denotes the direction of velocity of aircraft B; and V denotes aircraft A and B and the direction of velocity.
The set edge power is related to the predicted conflict time existing between the nodes corresponding to the aerials, and the shorter the predicted conflict time, the more urgent the conflict is proved to be, and the larger the edge power is. Equation (1) is used to calculate the edge weight.
where
denotes the connected edge weight of node
i and node
j.
is the shortest distance between aircraft B in the direction of velocity
V and the intersection C of the flight protection zone of aircraft A;
V is the relative velocity of the aircraft.
In the process of control command, if the aircraft in the control sector shows a convergence, then the controller needs to be highly vigilant to make effective control of the aircraft, which will also lead to higher pressure on the controller. On the contrary, if the aircraft shows a discrete attitude, then the controller’s pressure will be less. Therefore, in this paper, the control difficulty of controllers by using node intensity response in the flight conflict network. Equation (2) is used to calculate the node intensity.
where
denotes the node intensity of node
i, and
is the set of nodes that form a connected edge with node
i.
As shown in
Figure 4, there are six aircraft nodes in the flight conflict network, among which the No. 2 and No. 3 aircraft nodes are in conflict.
2.2. Control Network
In the process of control command, the control sector is the smallest control unit, and only the transfer of control rights exists between neighboring sectors. Therefore, the control network is constructed by using control sectors as nodes and control right handover relations as connected edges. Since the transfer of control rights is mutual, and there is no other influence between adjacent sectors due to the transfer of control rights, the whole control network is a non-directional and powerless network. The control sectors and the control network are shown in
Figure 5.
2.3. Control–Flight Conflict Interdependent Network
According to the logical relationship between the flight conflict network and the control network in the actual operation, the control–flight conflict interdependent network is constructed as follows: let
and
correspond to the flight conflict network and the control network, respectively, then the set of the multi-layer network is
, and the set of dependency edges is
. As shown in
Figure 6.
In the actual operation process, the controller is responsible for the control command of the aircraft in the sector, and also for the transfer of control to the aircraft in the adjacent sector and the monitoring task. For the controller, the process of transferring control is usually about 2 min before the aircraft in the adjacent sector enters the sector, and the controller needs to communicate with the aircraft to prepare for the transfer of control. Therefore, the construction of the dependent edge is that the control nodes in the control network are connected to the aircraft nodes in the sector. It is also connected to the nodes of the aircraft in the adjacent sector that are eligible for the transfer of control and to the nodes of the aircraft in the adjacent sector that are in conflict with the nodes of the aircraft in this sector, forming the dependent edge. There is no specific regulation on the communication before the transfer of control rights in ATC. Therefore, in this paper, it is set that when an aircraft is flying to this sector at 600 km/h, the controller needs to communicate 2 min in advance. In other words, the aircraft has to communicate about 20 km before arriving at the sector boundary, and make arrangements for possible conflicts.
Therefore, the control node and the adjacent sector aircraft node form a dependent edge when the following conditions are met.
- (1):
The aircraft node’s heading points to the control sector corresponding to the control node.
- (2):
The distance of the aircraft node from the sector boundary is less than 20 km.
The weights of the dependent edges are also different because of the different tasks and the attributes of the aircraft itself. In the actual control command process, for the controller to command the conflicting aircraft requires more effort than commanding the non-conflicting aircraft; control command of aircraft within the sector will also require more effort than monitoring the aircraft in the adjacent sector. Therefore, in this paper, the node intensity is treated as the edge power of the dependent edge. Equation (3) is used for calculating the edge power of the dependent edge.
where
denotes the edge right of the contiguous edge between the control node
and the aircraft node
.
In this case, it is important to note that the control node is not only connected to the aircraft nodes in its control sector, but also to the aircraft nodes that are about to enter its control sector. The latter node can be judged by the two conditions given in the above section.
3. Simulation Analysis of Interdependent Networks
In this paper, in the simulated airspace of 300 km × 300 km × 10 km, 180 aircraft are generated as nodes in MATLAB software according to 20 aircraft per sector, and a total of 9 control sectors with the range of 100 km × 100 km × 10 km are constructed in accordance with the requirements in the Civil Aviation Administration of China (CAAC)’s “Reference Study Materials on Fatigue Management for Civil Aviation Controllers”. Considering the actual flight operation, the speed of the aircraft is set: the instantaneous speed is 800 km/h and the heading is 0–360°. To simulate the situation in general airspace, the distribution of aircraft positions is set to follow a uniform distribution. The flight conflict network is modeled for this airspace, and the modeling results are shown in
Figure 7.
The adjacency matrix of the interdependent network is used to describe the adjacency and edge rights of the interdependent network according to the rules for setting the adjacency and edge rights of the intra-layer and inter-layer networks in the interdependent network.
- (1)
Adjacency matrix of the flight conflict network.
The adjacency matrix is a 180 × 180 matrix, which represents the edge rights between two aircraft nodes.
- (2)
Adjacency matrix of the control network.
The adjacency matrix is a 9 × 9 matrix, which represents the continuous edge relationship between the control sectors. If there is a control handover relationship, then ; conversely, .
- (3)
Adjacency matrix of the interdependent network.
The matrix a is a 189 × 189 matrix that represents the weights of the dependent edges of the interdependent network. The 180 × 180 matrix at the top left is the weighted adjacency matrix of the aircraft network, the 9 × 9 matrix at the bottom right is the adjacency matrix of the control network, and the matrices at the bottom left and top right are transposed matrices of each other, both of which indicate the weights of the connected edges between the layers of the interdependent network.
Node Characterization
As an important tool for analyzing and studying networks, selecting appropriate network characteristic indicators is of great significance for rational analysis of networks. To facilitate a reasonable analysis to quantify the nature of interdependent networks, this paper selects the degree of nodes, node intensity, and weighted clustering coefficients of the network to analyze interdependent networks.
- (1)
Degree.
In the interdependent network, the degree of a node is defined as the number of connected edges of the node in the network. Since the interdependent network consists of two layers, the degree of a node includes the inner degree and the outer degree, where the inner degree is the number of connected edges with the node in the same layer of the network, and the outer degree is the number of connected edges with the nodes in the interlayer network. Equation (4) is used to calculate the degree
ki of node
i through the adjacency matrix.
where
denotes the inner degree of node
i,
denotes the outer degree of node
i,
denotes the set of nodes in the flight conflict network,
denotes the set of nodes in the control network, and
denotes the value in row
i and column
j of the adjacency matrix.
The higher the degree value of a node, the more it is associated with more aircraft nodes and control nodes in the network, and the greater the degree of its influence on the network. The degree values of each node in the interdependent network are shown in
Figure 8.
As shown in
Figure 8, the node degree values of the control nodes are generally much higher than those of the aircraft nodes, which is because controllers need to control all aircraft in their controlled airspace, while pilots, whose main job is to fly the aircraft, only need to have connections with controllers and aircraft that have potential conflicts with themselves. Among the control nodes, node 188 has a higher number of adjacent sectors than node 185, but because it has the highest number of aircraft in its control airspace and the most potential conflicts, its airspace complexity is the highest, its degree value is the highest, and the controller’s workload is the highest.
- (2)
Node intensity.
The node intensity
of a node is the result of weighting the sum of node degree values, which can reflect the number of nodes and their connected nodes in the network, as well as the close relationship between nodes and their connected nodes, and can more clearly describe the importance of nodes in the network. Equation (5) is used to calculate the node intensity
of node
i.
where
denotes the edge power of node
i and node
j, and
N denotes the total number of nodes in the interdependent network.
The node intensity of each node in the interdependent network is shown in
Figure 9.
As shown in
Figure 9, nodes 3, 28, 58 and 150, and other nodes in the aircraft node node intensity are higher, indicating that the air situation near the node is more complex, and its control node 188 node intensity is also higher, indicating that controllers need to devote more energy to airspace control and conflict deployment, and if their workload is greater, then, at this time, the work strategy should be promptly adjusted and arranged to increase controllers to maintain airspace safety and reduce controller workload.
- (3)
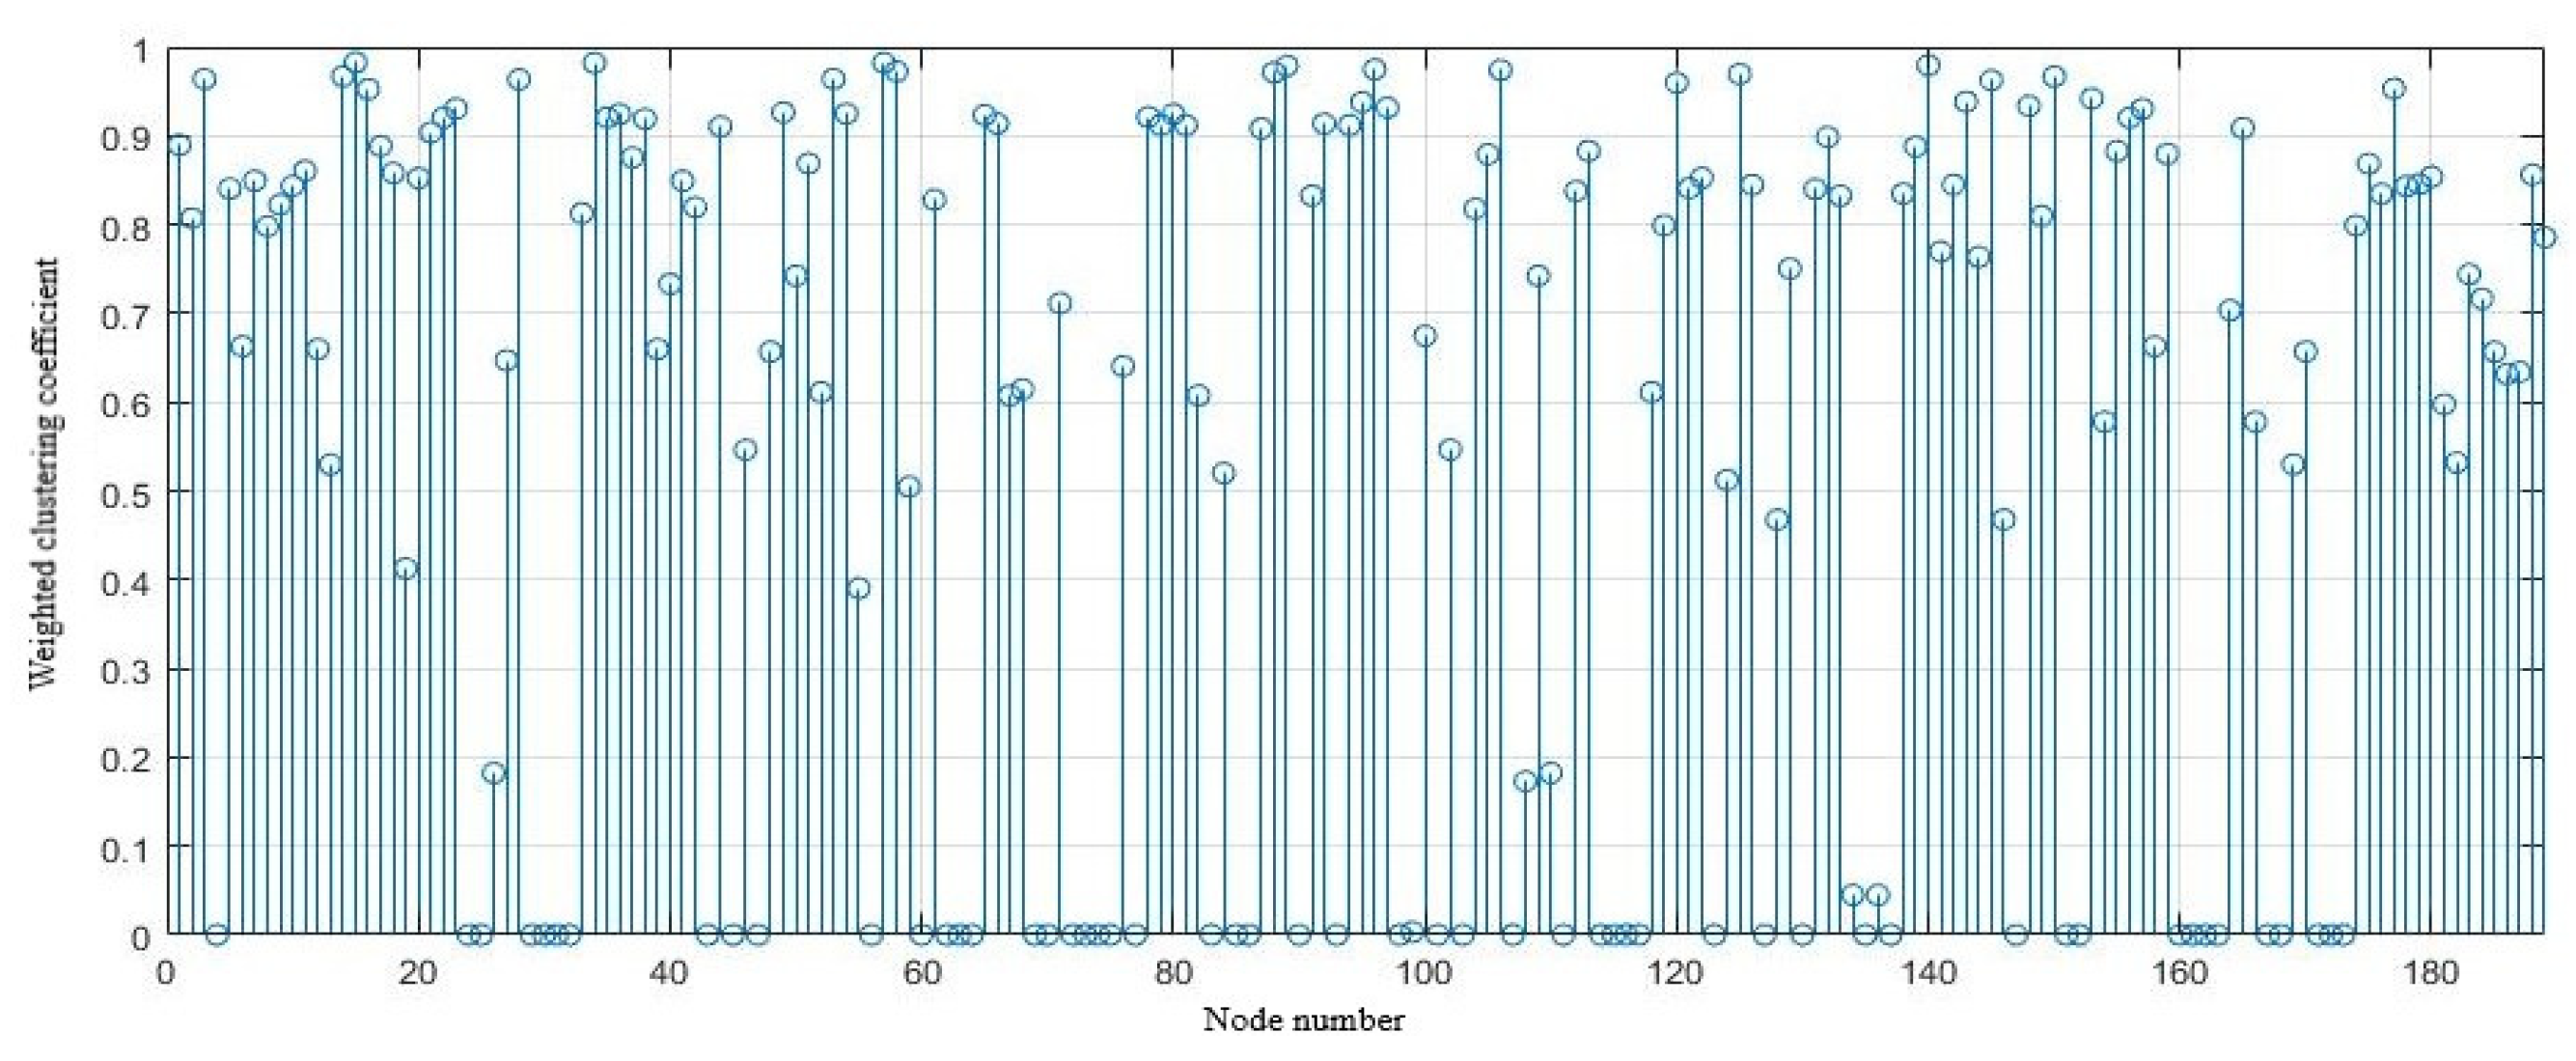
Weighted clustering coefficient.
The clustering coefficient is used as an indicator to judge the degree of aggregation of nodes in the network and is the ratio of the actual number of connected edges between a node and all its neighboring nodes to the theoretical number of all connected edges, with the need to consider the edge weights between nodes. Equation 6 is used to calculate the clustering coefficient.
In the flight conflict network, the weighted clustering coefficient indicates the density of aircraft at the location of this aircraft node. While in the control network, it indicates the density of aircraft in the control sector and the adjacent control sectors where this control node is located. The calculated weighted clustering coefficients of each node are shown in
Figure 10.
As shown in
Figure 10, the aircraft nodes connected to the control node are generally distributed in multiple adjacent sectors, and there are more connected edges between the control node and the aircraft nodes. Therefore, the aircraft nodes are generally higher than the control nodes. Nodes such as No. 4 and No. 25 have a weighted clustering coefficient of zero. They are in a safe isolated state and there are no connected edges, which is consistent with
Figure 7, indicating that there is no potential conflict and the workload on the controllers has less impact.
4. Controller Workload Prediction and Assessment Method
Air traffic complexity is an accurate and clear description of the air traffic situation, an explanation of the control difficulty in the case of special situations in the airspace, and the ability to make a reasonable description of the controller’s subjective workload.
Analyzed from the point of view of the system structure, the microstructure between the nodes in the system determines the macrostructure and functions of the system. The microstructure between each aircraft node and the controller node in the sector determines the complexity of the overall network, and the position and velocity relationships between the aircraft nodes are the basic constituents of the microstructure [
12]. In previous studies, it was found that topological metrics such as node node intensity and the clustering coefficient can reflect the complexity of air traffic well [
18]. Therefore, the node node intensity and clustering coefficients of network topology metrics are chosen to reflect the looming effect between the aircraft posture controllability index, and to calculate the network complexity.
Among them, the looming effect between aircraft refers to the convergence posture of the aircraft, which is expressed by the relative proximity of the aircraft in time and space perspectives. In the interdependent network model constructed in this paper, the proximity effect is reflected by the values of the edge weights of the connected edges. Equation (7) is used for calculating the proximity effect.
where
is the looming effect;
is the shortest distance between aircraft B in the direction of velocity
V and the intersection C of the flight protection zone of aircraft A; and
is the relative velocity of the aircraft.
The situation controllability index reflects the ease of conflict situation deployment by controllers for aircraft speed, heading and altitude adjustment. In this paper, the weighted clustering coefficients in the model are chosen for expression. Equation (8) is used to calculate the situation controllability index.
Based on Equations (7) and (8), we can obtain Equation (9). Equation (9) is used for the calculation of the inter-aircraft complexity.
where
and
are the adjustment factors, which denote the influence weights of looming effect and posture controllability with complexity, respectively. For the convenience of calculation, the values of the adjustment factors are set as
and
.
Therefore, the calculation of the complexity of the system can be considered as the summation of the complexity between the two pairs of aircraft in the system. Equation (10) is used for calculating the complexity of the system.
where
N is the code of each different sector in the system,
n is the number of aircraft in the sector, and
is the overall complexity value of the sector.
According to the definition of the complexity value and the model of the interdependent network constructed in this paper, the complexity value of the nodes that do not satisfy the conditions of the connected edge construction in the model should be infinitely close to zero, which can be regarded as negligible. Therefore, in this model, the complexity value of the sector is the complexity of the conflicting nodes. Since the complexity can quantitatively reflect the air traffic situation in the sector, the controller workload can be evaluated by the complexity value of the sector. Equation (11) is used to calculate the controller workload.
where
is the controller workload,
n is the number of nodes in the control sector of the model that constitute conflicting edges,
i is the control node, and
p and
q are aircraft nodes.
5. Analysis and Validation
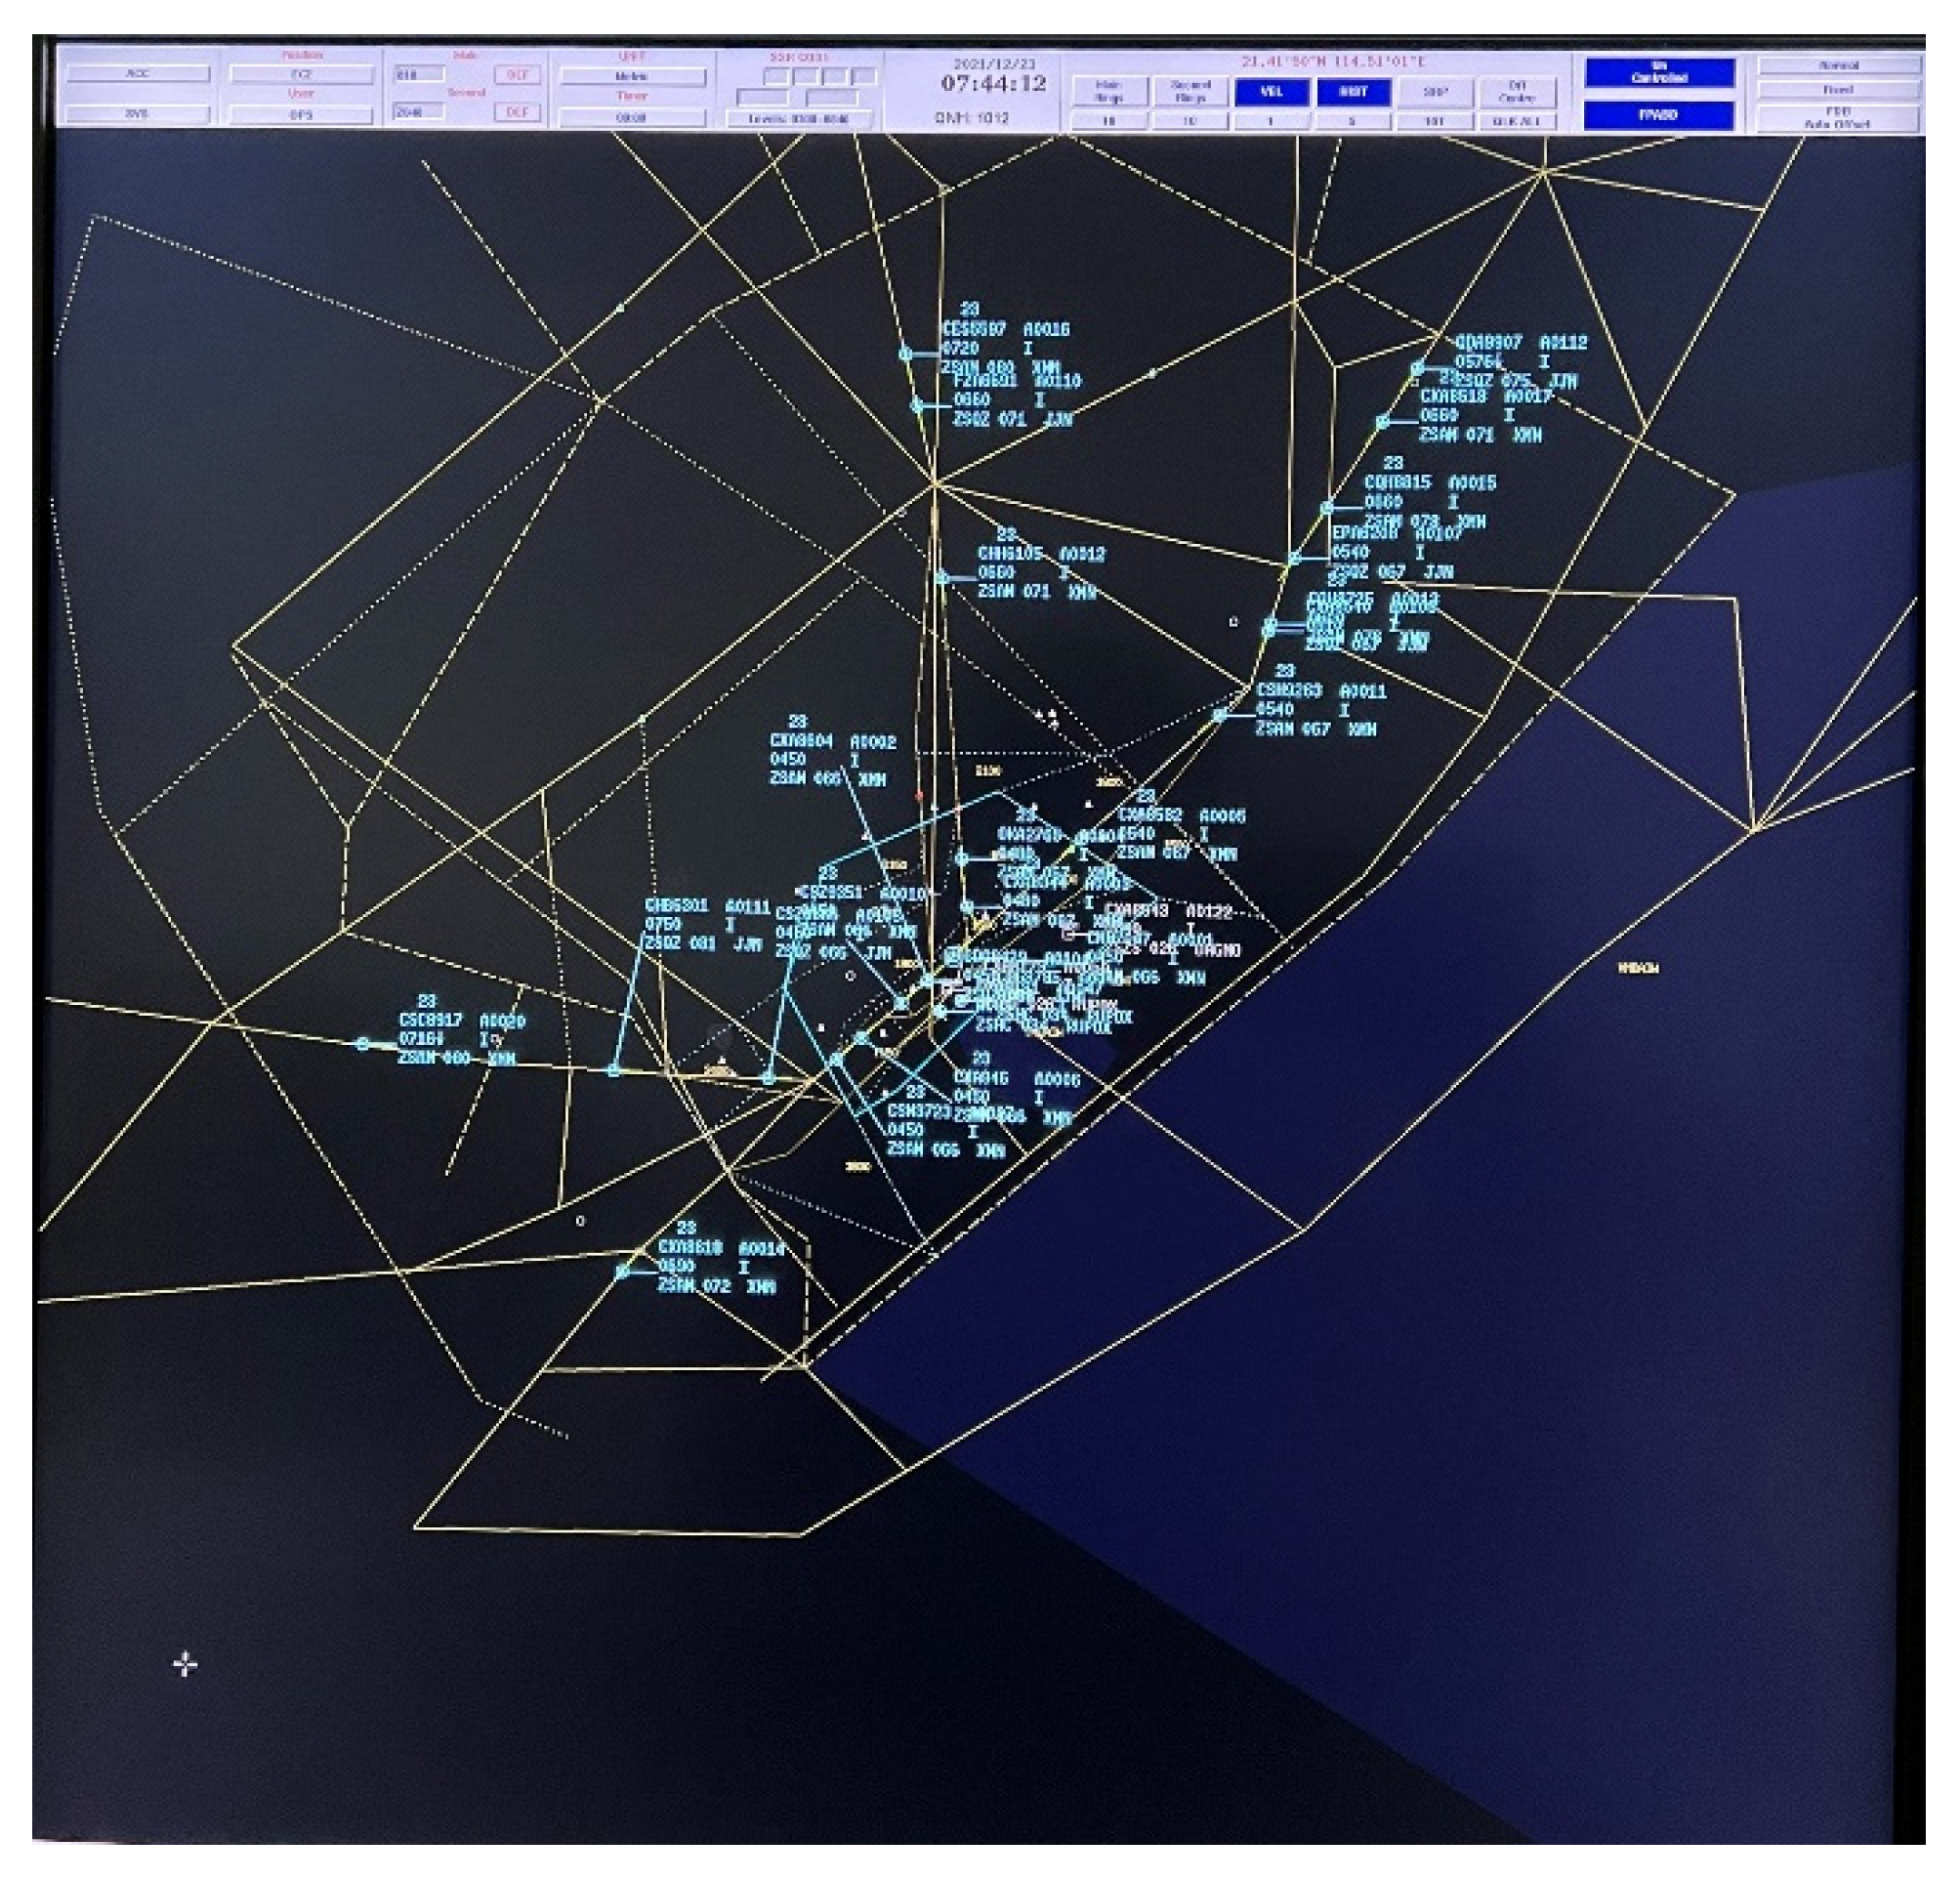
To verify the validity of the model and the reasonableness of the prediction and assessment method, data from Xiamen Gaoqi International Airport are selected for modeling analysis in this paper. Xiamen Gaoqi International Airport is located in Xiamen, Fujian Province, China, and is a Class 4E civil international airport. It plays an important role as a regional aviation hub on the southeast coast of China. In the year 2020, Gaoqi Airport accomplished 16,710,197 passengers, 278,336.4 tons of cargo and mail throughput, and 139,827 takeoffs and landings, all of which are among the top in China. In this paper, 10 moments of the busier approach sectors of Gaoqi Airport are intercepted for analysis and verification.
Figure 11 shows some of the radar records.
Through the analysis of the radar map, this paper selects the location of the tower at 21.40° N and 114.50° E as the origin of the coordinate system, and transforms the positions of the aircraft in the control sector at different times into the points in the coordinate system. In this paper, the positions of aircraft in the control sector are transformed into points in the coordinate system, the sectors are created, and the aircraft nodes are classified according to the actual operation of the sectors.
Since the control sector of Xiamen Gaoqi Airport is not a regular square, we need to make corrections to the model in the model construction part of the experiment to turn the assumed square sector into a realistic one.
First, we need to have a clear understanding of the actual sector structure, and have a clear understanding of the latitude and longitude coordinates of the vertices on the sector boundary. The results of this can be found in the relevant CAAC documents.
Then, we need to establish the coordinate system with the airport tower as the origin. At this point, based on the latitude and longitude coordinates of the tower, and the latitude and longitude coordinates of the sector, we can depict the sector and the aircraft in the coordinate system. The sector determined by this method is in accordance with the actual situation.
Finally, we translate the sector boundary into a formula based on the principle of “two points determine a line segment”. This formula is applied to the established coordinate system. This allows us to determine the sector of the model and the heading of the aircraft based on its current position.
With these steps, we can build a model for a non-square sector and then analyze the model.
As shown in
Figure 12, the control area of Xiamen ATC station is about 350 km long from east to west and 400 km long from north to south, with three approach sectors, sector 1 of which is responsible for the airspace within the range of flight altitude below 2400 m (inclusive), and sectors 2–4 are responsible for the airspace within the range of flight altitude 2400 (exclusive) to 5400 m (inclusive), and the coordinates of some nodes in the coordinate system are shown in
Table 1.
The interdependent network is constructed based on the obtained node coordinates, and the network diagram shown in
Figure 13 is obtained. The network indicators are analyzed to obtain the relevant network data.
Moreover, to verify the effectiveness of the method, after the control command of the corresponding period, the DORATASK method is used to evaluate the workload of controllers who have completed the handover shift.
As shown in
Figure 13, the top area in the figure is sector 2, the bottom left is sector 3 and the bottom right is sector 4. Sector 1 is the low-altitude level airspace corresponding to sectors 2, 3 and 4. Sector 1 is obscured in the figure by sectors 2, 3 and 4 in the high-altitude level. The nodes in the figure include all aircraft nodes in the 4 sectors.
The data lines of controller workloads obtained by the interdependent network are compared with the controller workloads derived from the Doratask method, as shown in
Table 2.
Figure 14 shows the trend of controller workload between different sectors at the same time.
After processing and analyzing the above data, the controller workload was obtained by using the workload prediction and evaluation method based on the interdependent network, and the controller workload results were obtained by using the Doratask method after completing the control command work match. It shows the correctness of the model. Since the conflicts identified by the interdependent network are derived based on the current heading and speed information of the aircraft. Potential conflicts may not be indicated in the Traffic Alert and Collision Avoidance System (T/CAS) at the current moment. Therefore, the method is able to make predictions about the controller workload. It is also found that the controller workload in sector 1 is more frequent than the average workload. Combined with the sector designation, the main reason is that sector 1 has a larger designation area. The above experiments prove that the controller workload can be predicted and evaluated effectively by constructing an interdependent network and using its characteristics. At the same time, it can reflect the information on flight conflict and complexity in the airspace and provide suggestions for airspace designation and controller scheduling.
6. Discussion
In response to the current controller workload evaluation methods’ commonly existing problems, such as the subjective evaluation method (Doratask), which is not time-sensitive and too subjective; and the objective evaluation method (EEG), in which the controllers need to wear a large amount of equipment, affecting the work of normal open formation, in this paper, we propose to reconstruct the air situation. We do this by using the dependency network, taking aircraft and controllers as nodes, potential conflict relationships between aircraft as connecting edges, and control relationships as dependency edges to establish the dependency network. Then, the evaluation of the controller workload is realized based on the air situation information and the characteristics of the dependency network. In this method, the dependent network is the base, and in the process of building the dependent network, we determine the connected edges between aircraft nodes based on the potential conflict relationship between aircraft. The velocity barrier method can achieve the early identification of potential conflicts between aircraft, and then achieve the early perception of the air situation. Based on this, we can ascertain the conflict that will occur in the future moment. On this basis, by analyzing the characteristics of the interdependent network and defining the looming effect and the situational controllability index, we obtain the evaluation method of the controller workload. Because this method is based on the dependency network model, and the model has certain predictive properties, this method enables the evaluation and prediction of controller workload. From the experimental results, the method of this paper is reasonable and effective.
It should be noted that the accurate reconstruction of sectors is the top priority in the establishment of the phase-dependent network model. In the initial assumption of this paper, the sector is simplified to a square. However, in the actual process, the sectors are usually irregular. At this point, in order to reconstruct the sectors better, it is necessary to have a clear understanding of the size and shape of the sectors. This requires an accurate evaluation of the individual points and edges of the sector, and the recording of the corresponding latitude and longitude. The coordinate system is established with the latitude and longitude of the tower location as the origin, and in this coordinate system, according to the relative position relationship between the sector and the tower in latitude and longitude, the accurate reconstruction of the sector can be realized. The resulting air situational analysis and controller workload evaluation are accurate.
In future research, we will focus on translating this method into practice and try to establish a corresponding system in civil aviation towers and conduct trial runs to provide help for a reasonable controller workload evaluation. In addition, this method can also be applied to the aspect of sector capacity evaluation.
7. Conclusions
This paper firstly constructs an interdependent network model based on the logical connection relationship between the flight conflict network and control network, and defines the connected edges and weights of intra-layer and inter-layer networks based on the air situation and the actual operation of the ATC system, and then analyzes the characteristics of the interdependent network. The experiments prove that the constructed interdependent network model can better reflect the actual situation of the ATC system, and a controller workload prediction and assessment method based on the control–flight conflict interdependent network is proposed. Through theoretical analysis and simulation experiments, the following conclusions can be drawn.
- (1)
The proposed controller workload prediction and assessment method based on control–flight conflict interdependent network makes use of the network characteristics of the interdependent network model to make a combination of qualitative and quantitative controller workload prediction and assessment methods, and expresses the prediction and assessment results with quantitative values, which are objective.
- (2)
The proposed controller workload prediction and assessment method based on control–flight conflict interdependent network uses the information of aircraft speed, position and heading to build an interdependent network model, and identifies the potential conflicts that may exist in the three-dimensional speed barrier method to identify the conflicts that controllers will face in the future, so that the controller’s workload can be predicted. This will improve the timeliness problem of the current method.
- (3)
The control–flight conflict interdependent network can visually reflect the conflict relationship and urgency between aircraft, and the information provided by the network is of high value, which can help controllers to efficiently and accurately identify the conflict situation in the airspace, help controllers to adjust the control strategy in time, and maintain the safe and stable operation of the ATC system.
- (4)
The study of network indicators for the interdependent network can reflect the role and influence of control nodes in the ATC system and can provide support for research on sector optimization and other aspects.


