A Decision Support System for Irrigation Management in Thailand: Case Study of Tak City Agricultural Production
Abstract
1. Introduction
2. Theoretical Framework
2.1. Indices and Parameters
2.2. Decision Variables
| (1) | ||
| for all m = {1, 2, …, 12}, i = {1, 2, …,N} | (2) | |
| for all z = {1, 2, …, M}, m = {1, 2, …, 12} | (3) | |
| for all m = {1, 2, …, 12} | (4) | |
| for all z = {1, 2, …, M} | (5) | |
| for all m = {1, 2, …, 12} | (6) | |
| for all i = {1, 2, …, N} | (7) | |
| for all i = {1, 2, …, N} | (8) |
3. Proposed Methodology
3.1. Case Study
3.2. Heuristics Algorithm in DSS
3.2.1. Solution Representation
3.2.2. Neighborhood
3.2.3. The SA Procedure and Parameters
| Algorithm 1. Simulated Annealing Algorithm Procedure |
| 1: Input: Iiter, T0, Tf, , K, 2: Output: Obj; 3: InitialSolution ← Generate randomly; 4: I ← 0; T ← T0; Fbest ← Obj (X), X ← InitialSolution; Xbest ← X; 5: Rt ← 1/3 for all t in {swap, reverse, insert}; 6: While T < Tf; 7: I ← 1; Nt ← 0 and Ot ← Ø for all t in {swap, reverse, insert}; W← 0; 8: While I ≤ Iiter; 9: r ← random (0,1); 10: If (r ≤ 0.5) then 11: Generate a new solution Y from X by random swap neighborhood; 12: Else 13: Generate a new solution Y from X by inserting neighborhood; 14: End if 15: Δ ← obj (Y) − obj (X); 16: If (Δ > 0) then X ← Y; 17: Else r ← random (0, 1); 18: If (r < exp(∆/KT)) then X ← Y; End if 19: End if 20: If (Obj(X) < Fbest) then Xbest ← X; Fbest ← Obj(X); End if 21: I ← I + 1; 22: End while 23: T = T; 24: End while |
4. Computational Results and Discussions
4.1. An Example of Crop Pattern Solution
4.2. Comparison between the Exact Solution and SA
4.3. Crop Pattern Scenarios
4.4. Managerial Implications
5. Conclusions and Future Research Directions
Author Contributions
Funding
Institutional Review Board Statement
Informed Consent Statement
Data Availability Statement
Acknowledgments
Conflicts of Interest
References
- Zecca, F. The Use of Internet of Things for the Sustainability of the Agricultural Sector: The Case of Climate Smart Agriculture. Int. J. Civ. Eng. Technol. 2019, 10, 494–501. [Google Scholar]
- Lampridi, M.G.; Sørensen, C.G.; Bochtis, D. Agricultural Sustainability: A Review of Concepts and Methods. Sustainability 2019, 11, 5120. [Google Scholar] [CrossRef]
- Haque, F.F.; Abdelgawad, A.; Yanambaka, V.P.; Yelamarthi, K. Crop Yield Prediction Using Deep Neural Network. In Proceedings of the 2020 IEEE 6th World Forum on Internet of Things (WF-IoT), New Orleans, LA, USA, 2–16 June 2020; pp. 1–4. [Google Scholar]
- Kouadio, L.; Deo, R.C.; Byrareddy, V.; Adamowski, J.F.; Mushtaq, S.; Phuong Nguyen, V. Artificial Intelligence Approach for the Prediction of Robusta Coffee Yield Using Soil Fertility Properties. Comput. Electron. Agric. 2018, 155, 324–338. [Google Scholar] [CrossRef]
- Pourmohammadali, B.; Hosseinifard, S.J.; Hassan Salehi, M.; Shirani, H.; Esfandiarpour Boroujeni, I. Effects of Soil Properties, Water Quality and Management Practices on Pistachio Yield in Rafsanjan Region, Southeast of Iran. Agric. Water Manag. 2019, 213, 894–902. [Google Scholar] [CrossRef]
- Arsenovic, M.; Karanovic, M.; Sladojevic, S.; Anderla, A.; Stefanovic, D. Solving Current Limitations of Deep Learning Based Approaches for Plant Disease Detection. Symmetry 2019, 11, 939. [Google Scholar] [CrossRef]
- Hernández, S.; López, J.L. Uncertainty Quantification for Plant Disease Detection Using Bayesian Deep Learning. Appl. Soft Comput. 2020, 96, 106597. [Google Scholar] [CrossRef]
- Darwish, A.; Ezzat, D.; Hassanien, A.E. An Optimized Model Based on Convolutional Neural Networks and Orthogonal Learning Particle Swarm Optimization Algorithm for Plant Diseases Diagnosis. Swarm Evol. Comput. 2020, 52, 100616. [Google Scholar] [CrossRef]
- Zhang, W.; Liu, H.; Wu, W.; Zhan, L.; Wei, J. Mapping Rice Paddy Based on Machine Learning with Sentinel-2 Multi-Temporal Data: Model Comparison and Transferability. Remote Sens. 2020, 12, 1620. [Google Scholar] [CrossRef]
- Nguyen Thanh Le, V.; Apopei, B.; Alameh, K. Effective Plant Discrimination Based on the Combination of Local Binary Pattern Operators and Multiclass Support Vector Machine Methods. Inf. Process. Agric. 2019, 6, 116–131. [Google Scholar] [CrossRef]
- Goldstein, A.; Fink, L.; Meitin, A.; Bohadana, S.; Lutenberg, O.; Ravid, G. Applying Machine Learning on Sensor Data for Irrigation Recommendations: Revealing the Agronomist’s Tacit Knowledge. Precis. Agric. 2018, 19, 421–444. [Google Scholar] [CrossRef]
- Gutiérrez, S.; Diago, M.P.; Fernández-Novales, J.; Tardaguila, J. Vineyard Water Status Assessment Using On-the-Go Thermal Imaging and Machine Learning. PLoS ONE 2018, 13, e0192037. [Google Scholar] [CrossRef] [PubMed]
- Taghizadeh-Mehrjardi, R.; Nabiollahi, K.; Rasoli, L.; Kerry, R.; Scholten, T. Land Suitability Assessment and Agricultural Production Sustainability Using Machine Learning Models. Agronomy 2020, 10, 573. [Google Scholar] [CrossRef]
- Ferrández-Pastor, F.J.; García-Chamizo, J.M.; Nieto-Hidalgo, M.; Mora-Pascual, J.; Mora-Martínez, J. Developing Ubiquitous Sensor Network Platform Using Internet of Things: Application in Precision Agriculture. Sensors 2016, 16, 1141. [Google Scholar] [CrossRef]
- Wolfert, S.; Ge, L.; Verdouw, C.; Bogaardt, M.J. Big Data in Smart Farming—A Review. Agric. Syst. 2017, 153, 69–80. [Google Scholar] [CrossRef]
- López-Riquelme, J.A.; Pavón-Pulido, N.; Navarro-Hellín, H.; Soto-Valles, F.; Torres-Sánchez, R. A Software Architecture Based on FIWARE Cloud for Precision Agriculture. Agric. Water Manag. 2017, 183, 123–135. [Google Scholar] [CrossRef]
- Udias, A.; Pastori, M.; Dondeynaz, C.; Carmona Moreno, C.; Ali, A.; Cattaneo, L.; Cano, J. A Decision Support Tool to Enhance Agricultural Growth in the Mékrou River Basin (West Africa). Comput. Electron. Agric. 2018, 154, 467–481. [Google Scholar] [CrossRef]
- Bazzani, G.M. An Integrated Decision Support System for Irrigation and Water Policy Design: DSIRR. Environ. Model. Softw. 2005, 20, 153–163. [Google Scholar] [CrossRef]
- Bonfante, A.; Monaco, E.; Manna, P.; De Mascellis, R.; Basile, A.; Buonanno, M.; Cantilena, G.; Esposito, A.; Tedeschi, A.; De Michele, C.; et al. LCIS DSS—An Irrigation Supporting System for Water Use Efficiency Improvement in Precision Agriculture: A Maize Case Study. Agric. Syst. 2019, 176, 102646. [Google Scholar] [CrossRef]
- Basso, B.; Cammarano, D.; Fiorentino, C.; Ritchie, J.T. Wheat Yield Response to Spatially Variable Nitrogen Fertilizer in Mediterranean Environment. Eur. J. Agron. 2013, 51, 65–70. [Google Scholar] [CrossRef]
- Li, F.Y.; Johnstone, P.R.; Pearson, A.; Fletcher, A.; Jamieson, P.D.; Brown, H.E.; Zyskowski, R.F. AmaizeN: A Decision Support System for Optimizing Nitrogen Management of Maize. NJAS Wageningen J. Life Sci. 2009, 57, 93–100. [Google Scholar] [CrossRef][Green Version]
- Nelson, R.A.; Holzworth, D.P.; Hammer, G.L.; Hayman, P.T. Infusing the Use of Seasonal Climate Forecasting into Crop Management Practice in North East Australia Using Discussion Support Software. Agric. Syst. 2002, 74, 393–414. [Google Scholar] [CrossRef]
- Han, E.; Ines, A.V.M.; Baethgen, W.E. Climate-Agriculture-Modeling and Decision Tool (CAMDT): A Software Framework for Climate Risk Management in Agriculture. Environ. Model. Softw. 2017, 95, 102–114. [Google Scholar] [CrossRef]
- Thorburn, P.J.; Jakku, E.; Webster, A.J.; Everingham, Y.L. Agricultural Decision Support Systems Facilitating Co-Learning: A Case Study on Environmental Impacts of Sugarcane Production. Int. J. Agric. Sustain. 2011, 9, 322–333. [Google Scholar] [CrossRef]
- Soltani, A.; Stoorvogel, J.J.; Veldkamp, A. Model Suitability to Assess Regional Potato Yield Patterns in Northern Ecuador. Eur. J. Agron. 2013, 48, 101–108. [Google Scholar] [CrossRef]
- National Economic and Social Development Council NESDC ECONOMIC REPORT Thai Economic Performance in Q1 and Outlook for 2019 Economic Outlook. 2019, 2019, 1–32. Available online: https://www.nesdc.go.th/nesdb_en/ewt_dl_link.php?nid=4379&filename=Macroeconomic_Planning (accessed on 20 October 2021).
- Ministry of Commerce. Major Exports of Thailand in Accordance with the Structure of World Exports. Available online: http://tradereport.moc.go.th/Report/ReportEng.aspx?Report=MenucomRecode&Option=5&Lang=Eng (accessed on 12 October 2021).
- Food and Agricultural Organization of United Nations. FAOSTAT: Thailand. Available online: http://www.fao.org/faostat/en/#country/216 (accessed on 10 October 2021).
- United Nations Thailand. Thai Agricultural Sector: From Problems to Solutions. Available online: https://thailand.un.org/en/103307-thai-agricultural-sector-problems-solutions (accessed on 10 October 2021).
- Climate-data.org. Climate Tak (Thailand). Available online: https://en.climate-data.org/asia/thailand/tak-province/tak-2939/#climate-graph (accessed on 10 October 2022).
- National Statistical Office. Agricultural Census; National Statistical Office: Bangkok, Thailand, 2013.
- Attavanich, W.; Chantarat, S.; Chenphuengpawn, J.; Mahasuweerachai, P.; Thampanishvong, K. Farms, Farmers and Farming: A Perspective through Data and Behavioral Insights. 2019. Available online: https://www.pier.or.th/files/dp/pier_dp_122.pdf (accessed on 21 January 2022).
- Allen, R.G.; Pereira, L.S.; Raes, D.; Smith, M. Crop Evapotranspiration—Guidelines for Computing Crop Water Requirements—FAO Irrigation and Drainage Paper 56; Food and Agriculture Organization of the United Nations: Rome, Italy, 1998.
- McNaughton, K.G.; Jarvis, P.G. Using the Penman-Monteith Equation Predictively. In Evapotranspiration from Plant Communities; Sharma, M.L., Ed.; Elsevier: Amsterdam, The Netherlands, 1984; Volume 13, pp. 263–278. ISBN 0166-2287. [Google Scholar]
- Thai Meteorological Department. Climatological Data for The Period 1981–2010. Available online: http://www.climate.tmd.go.th/content/article/75 (accessed on 8 October 2021).
- Ministry of Agricultural Economics Thailand. Tak City Agriculture Area in 2020. Available online: http://mis-app.oae.go.th/area/%E0%B8%A5%E0%B8%B8%E0%B9%88%E0%B8%A1%E0%B9%81%E0%B8%A1%E0%B9%88%E0%B8%99%E0%B9%89%E0%B8%B3/%E0%B9%81%E0%B8%A1%E0%B9%88%E0%B8%99%E0%B9%89%E0%B8%B3%E0%B8%A2%E0%B8%A1/%E0%B8%95%E0%B8%B2%E0%B8%81 (accessed on 20 July 2021).
- Maghfiroh, M.F.N.; Hanaoka, S. Multi-Period Evacuation Shelter Selection Considering Dynamic Hazards Assessment. Indones. J. Comput. Eng. Des. 2019, 1, 64. [Google Scholar] [CrossRef]
- Lukovac, V.; Pamučar, D.; Popović, M.; Đorović, B. Portfolio Model for Analyzing Human Resources: An Approach Based on Neuro-Fuzzy Modeling and the Simulated Annealing Algorithm. Expert Syst. Appl. 2017, 90, 318–331. [Google Scholar] [CrossRef]
- Haznedar, B.; Kalinli, A. Training ANFIS Structure Using Simulated Annealing Algorithm for Dynamic Systems Identification. Neurocomputing 2018, 302, 66–74. [Google Scholar] [CrossRef]
- Yu, V.F.; Jewpanya, P.; Redi, A.A.N.P.; Tsao, Y.-C. Adaptive Neighborhood Simulated Annealing for the Heterogeneous Fleet Vehicle Routing Problem with Multiple Cross-Docks. Comput. Oper. Res. 2021, 129, 105205. [Google Scholar] [CrossRef]
- Yu, V.F.; Jewpanya, P.; Redi, A.A.N.P. Open Vehicle Routing Problem with Cross-Docking. Comput. Ind. Eng. 2016, 94, 6–17. [Google Scholar] [CrossRef]
- Redi, A.A.N.P.; Jewpanya, P.; Kurniawan, A.C.; Persada, S.F.; Nadlifatin, R.; Dewi, O.A. A Simulated Annealing Algorithm for Solving Two-Echelon Vehicle Routing Problem with Locker Facilities. Algorithms 2020, 13, 218. [Google Scholar] [CrossRef]
- Reinaldi, M.; Redi, A.A.; Prakoso, D.F.; Widodo, A.W.; Wibisono, M.R.; Supranartha, A.; Liperda, R.I.; Nadlifatin, R.; Prasetyo, Y.T.; Sakti, S. Solving the Two Echelon Vehicle Routing Problem Using Simulated Annealing Algorithm Considering Drop Box Facilities and Emission Cost: A Case Study of Reverse Logistics Application in Indonesia. Algorithms 2021, 14, 259. [Google Scholar] [CrossRef]

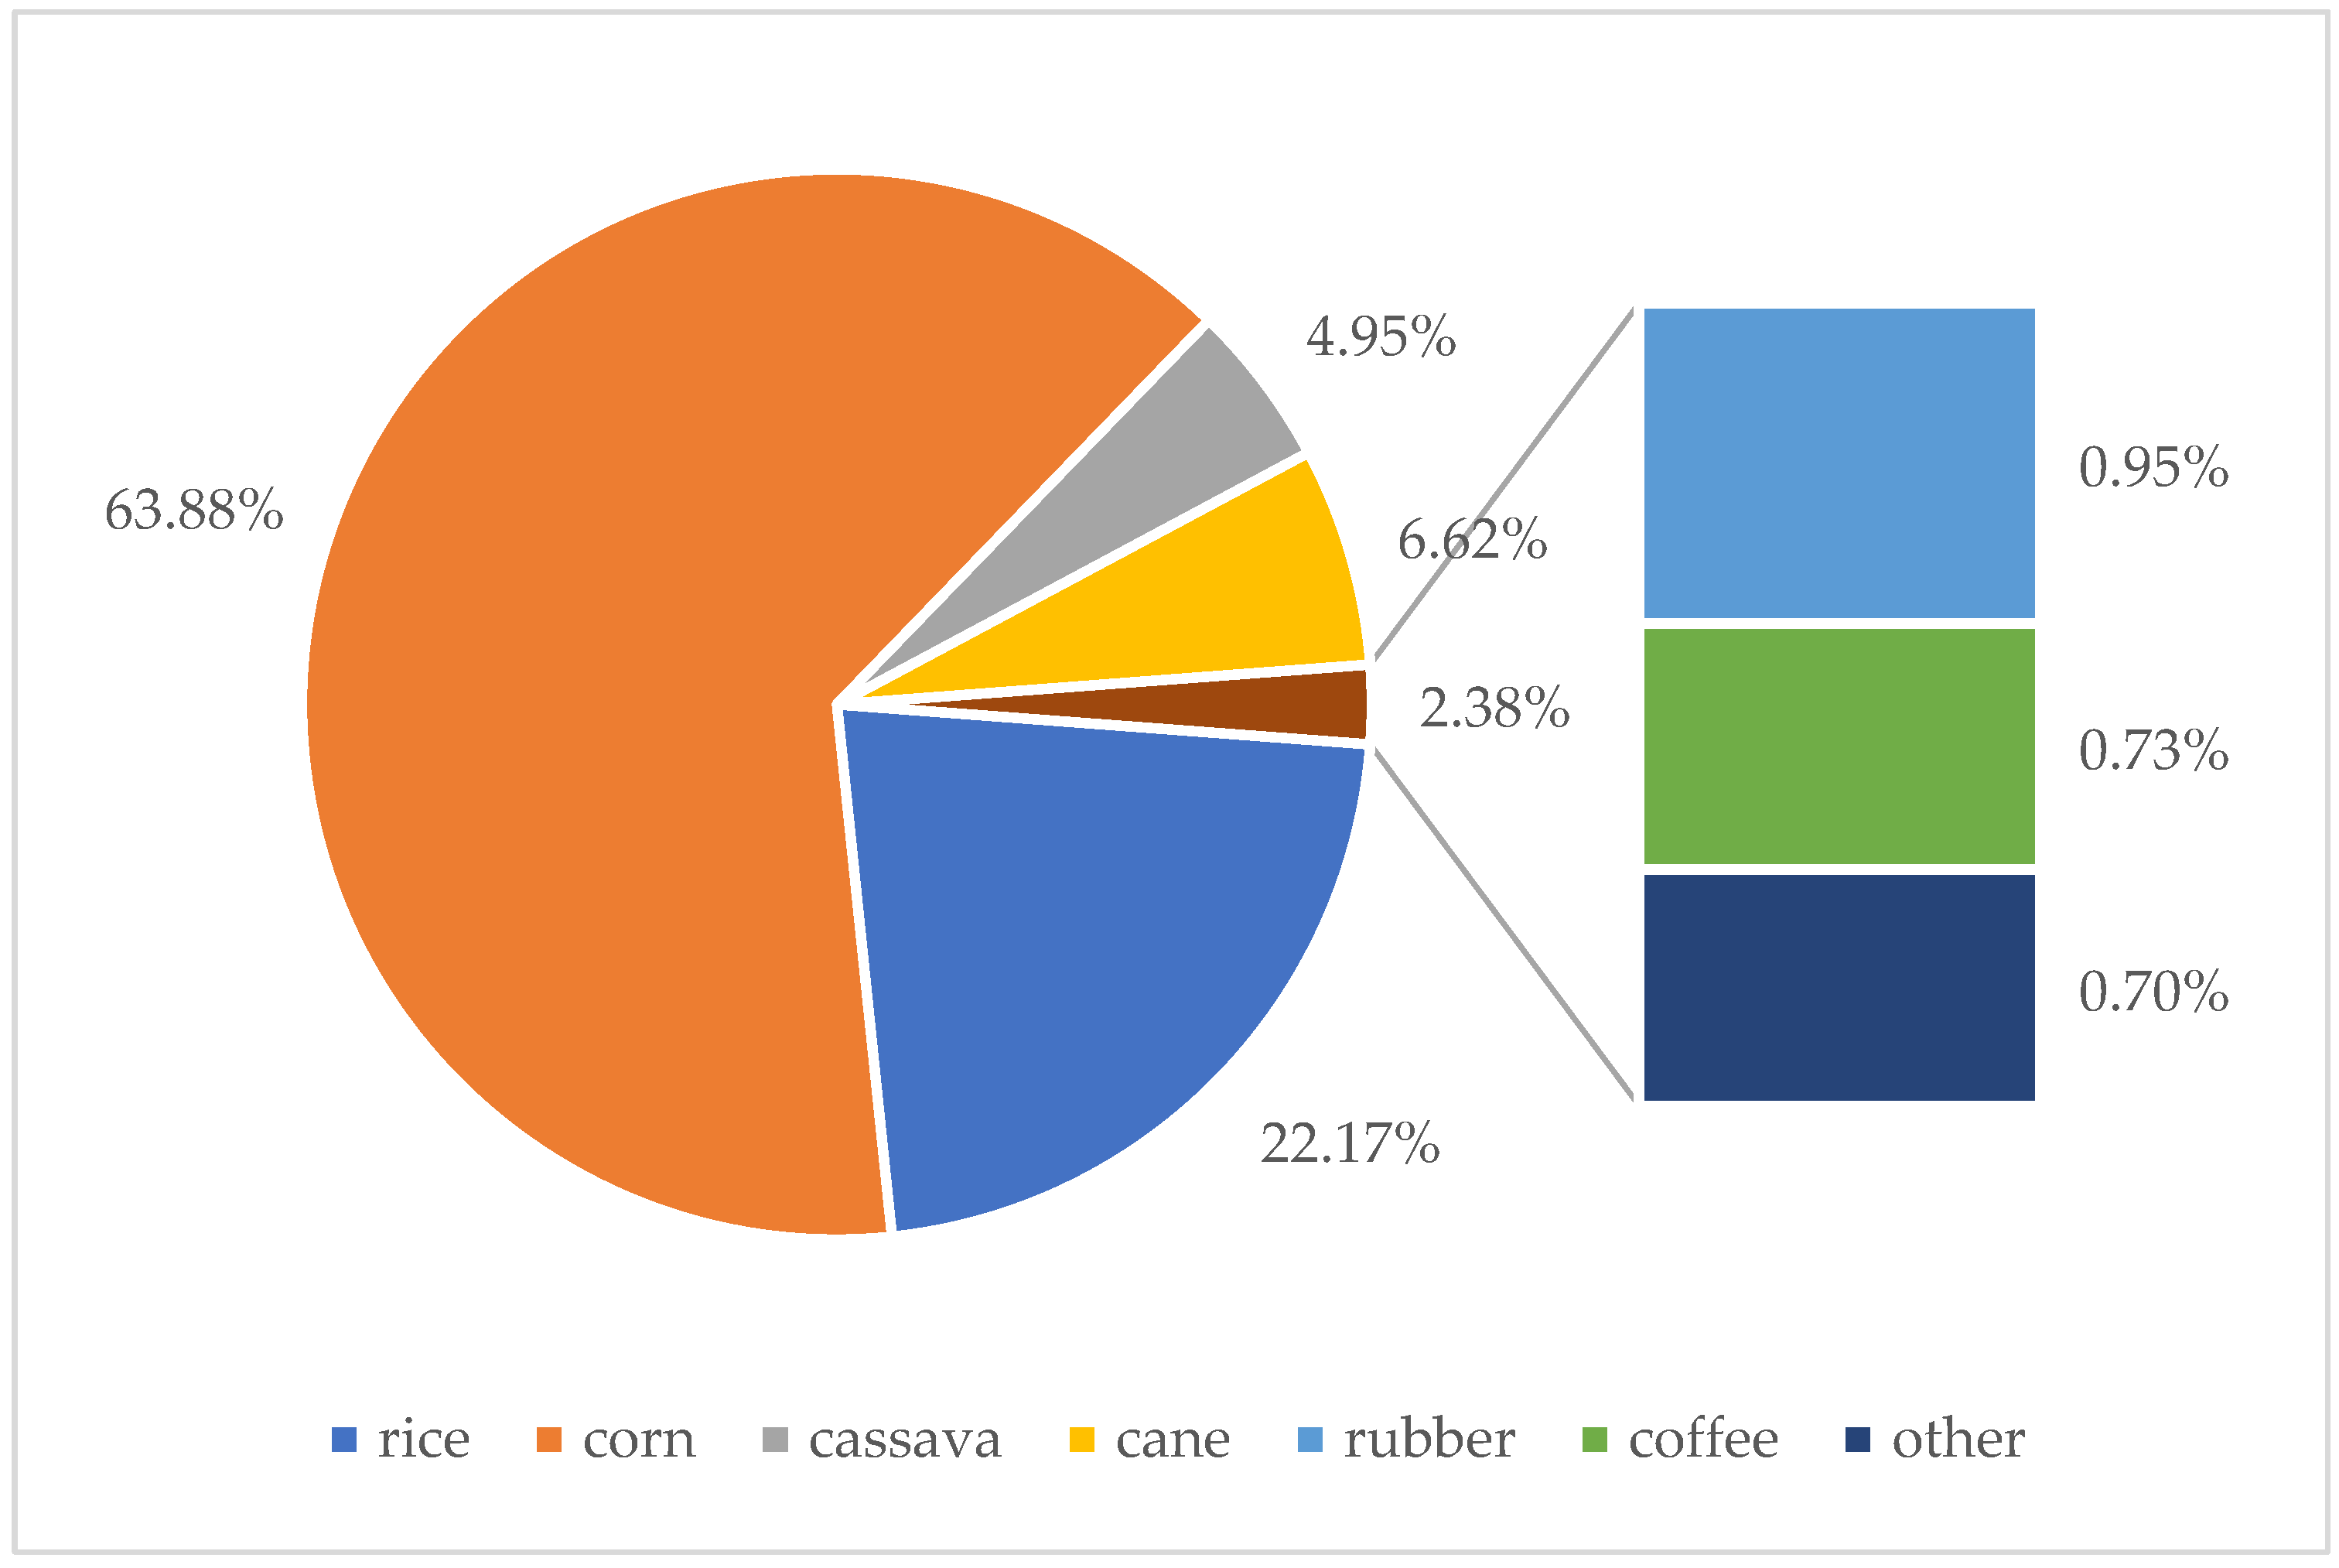
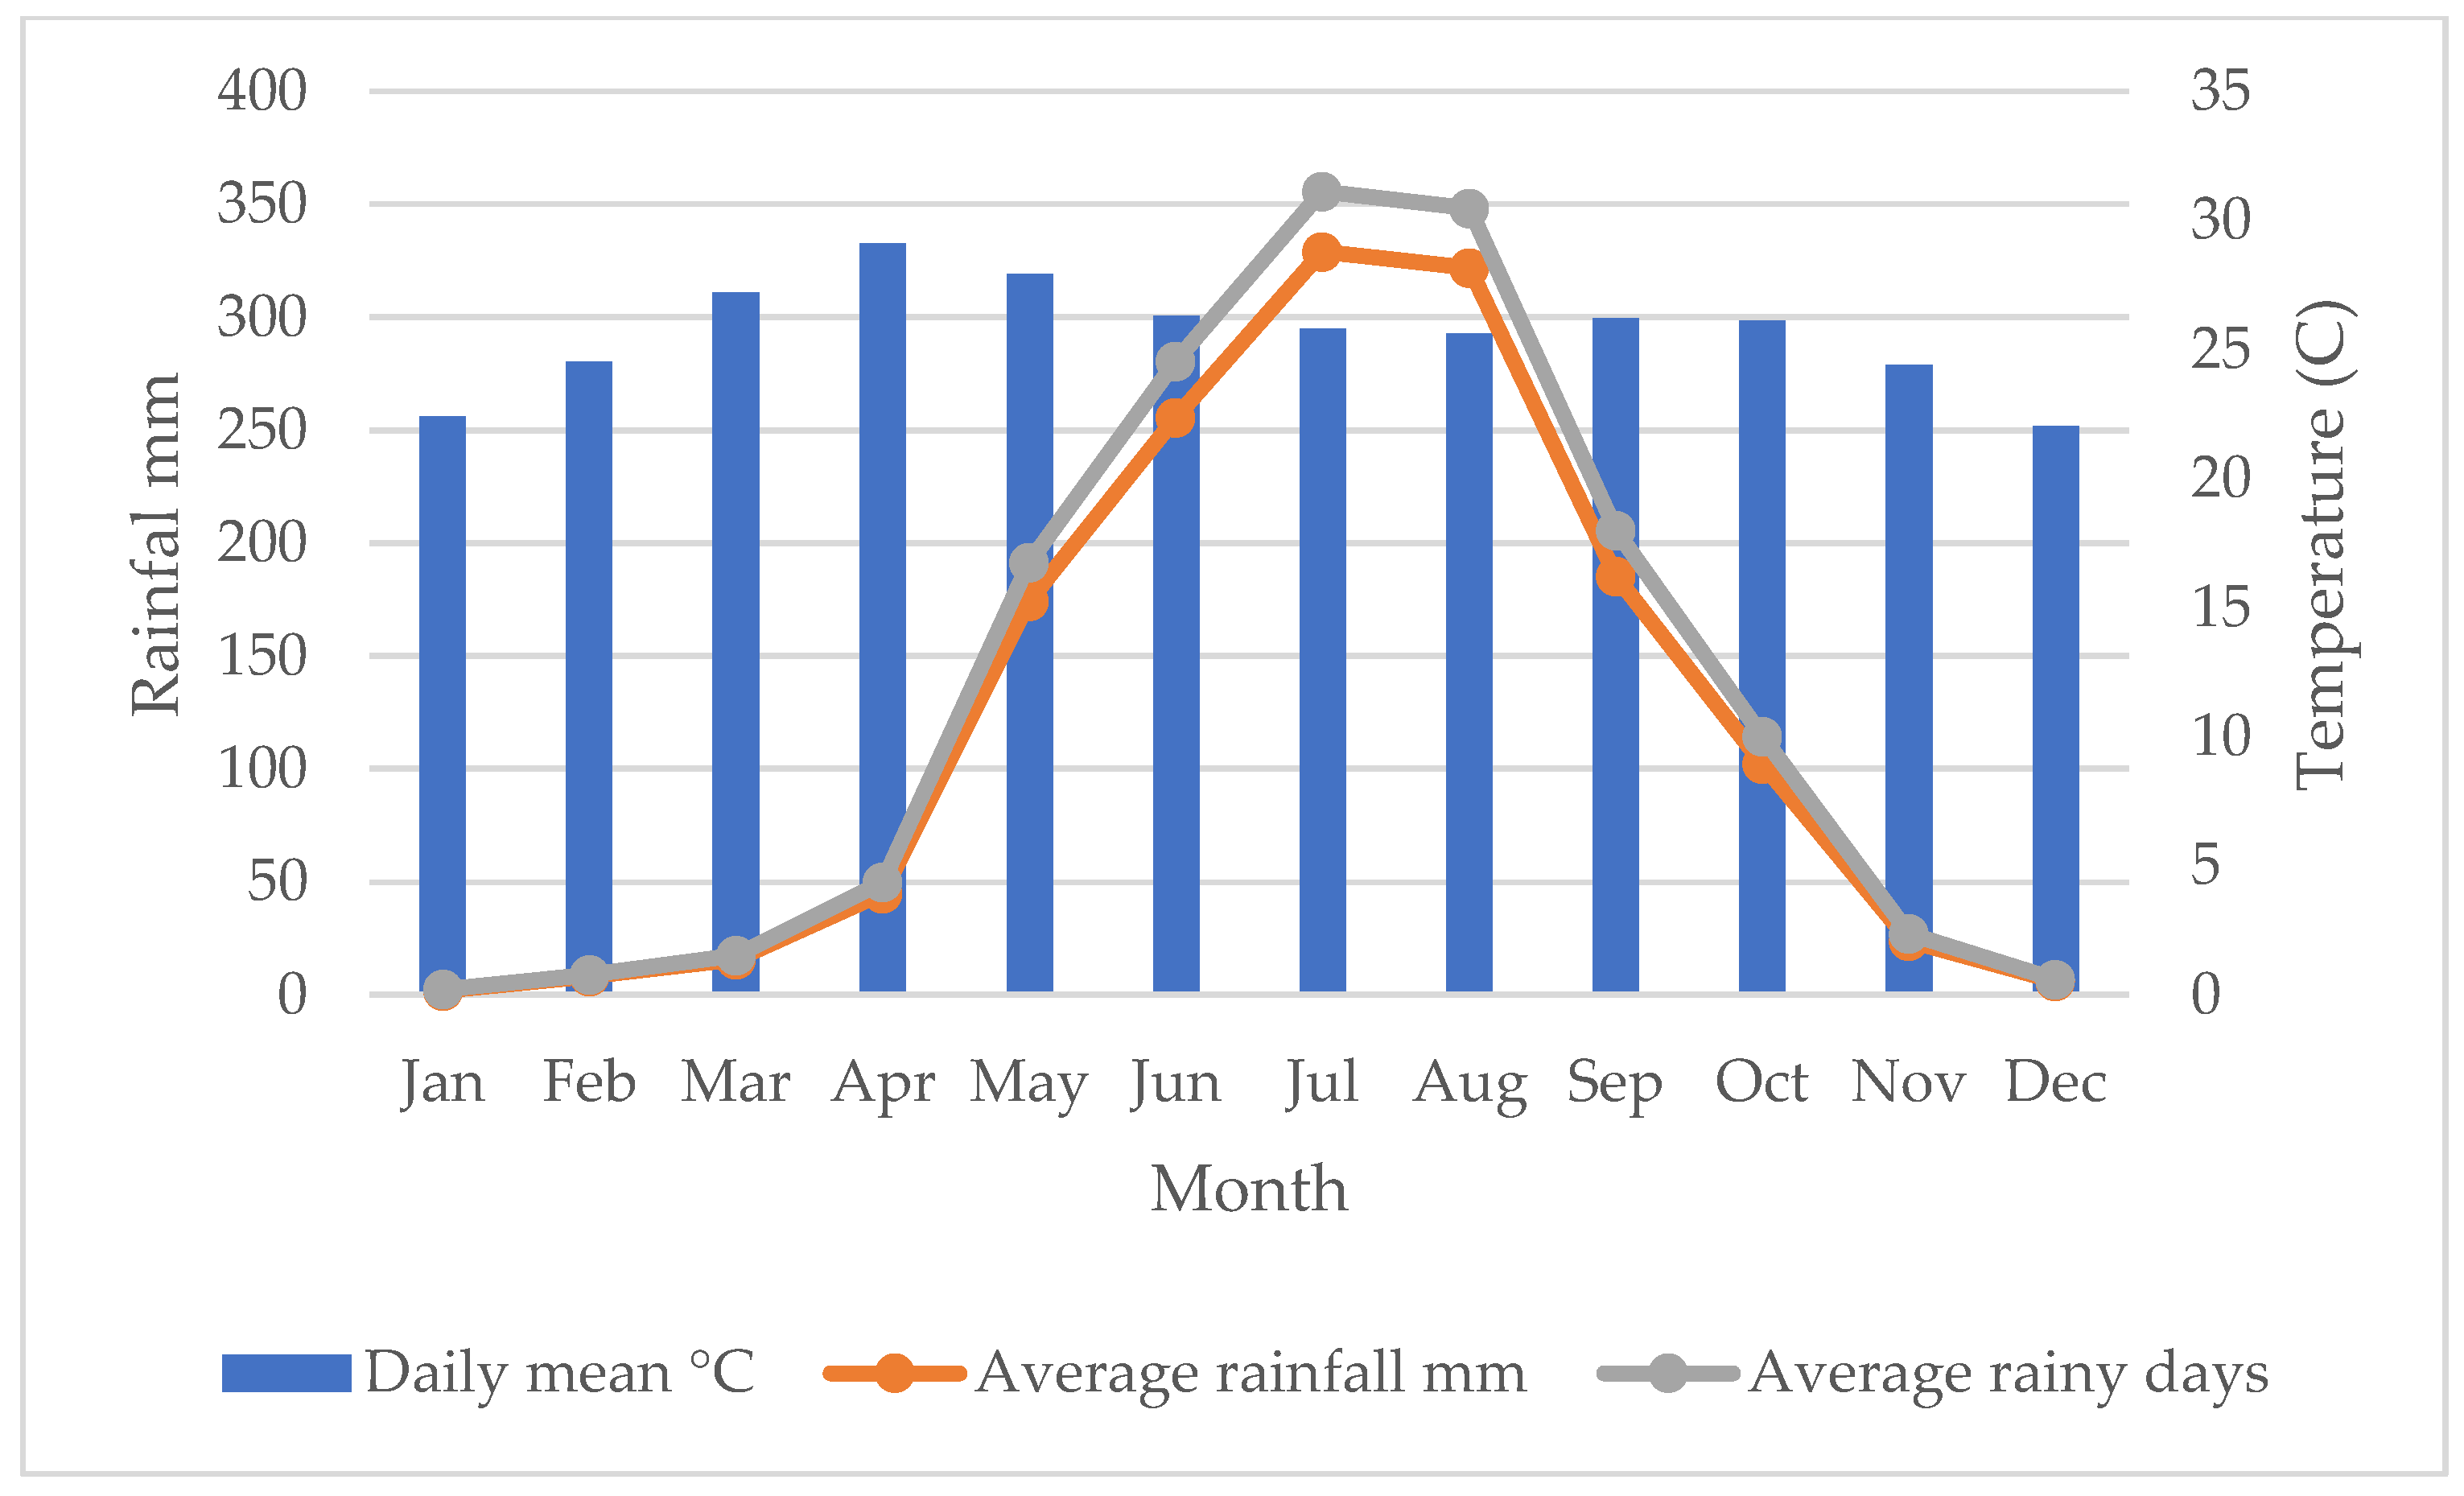
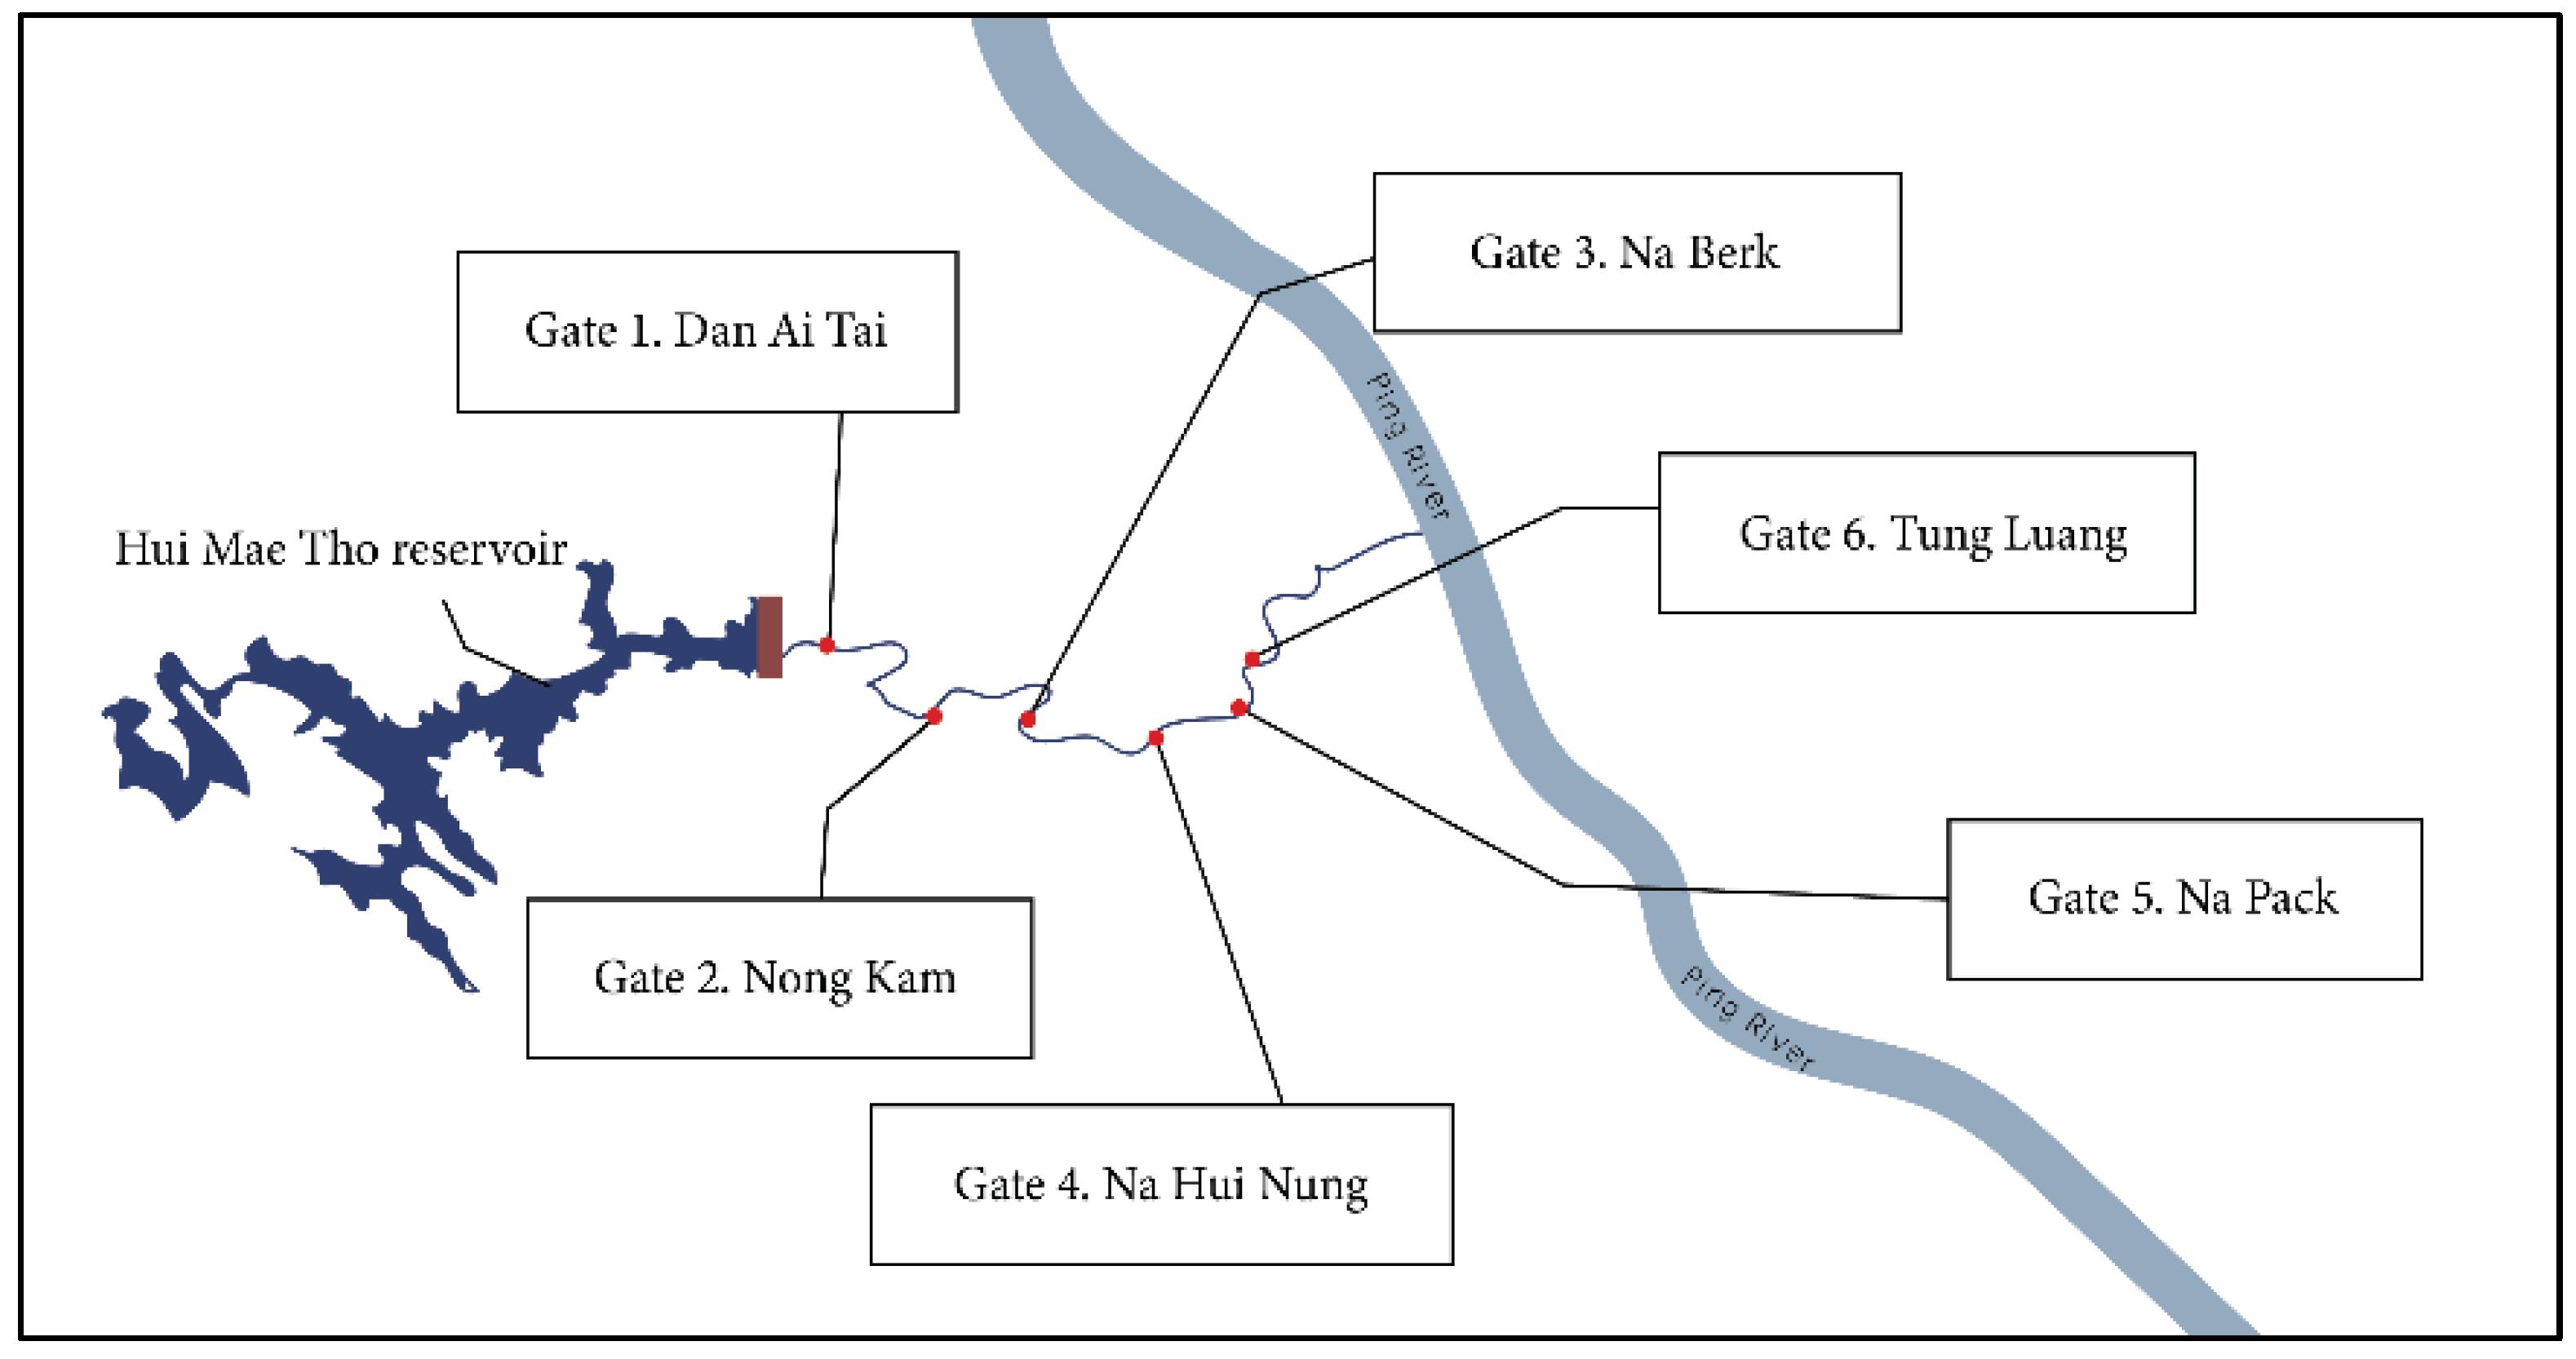

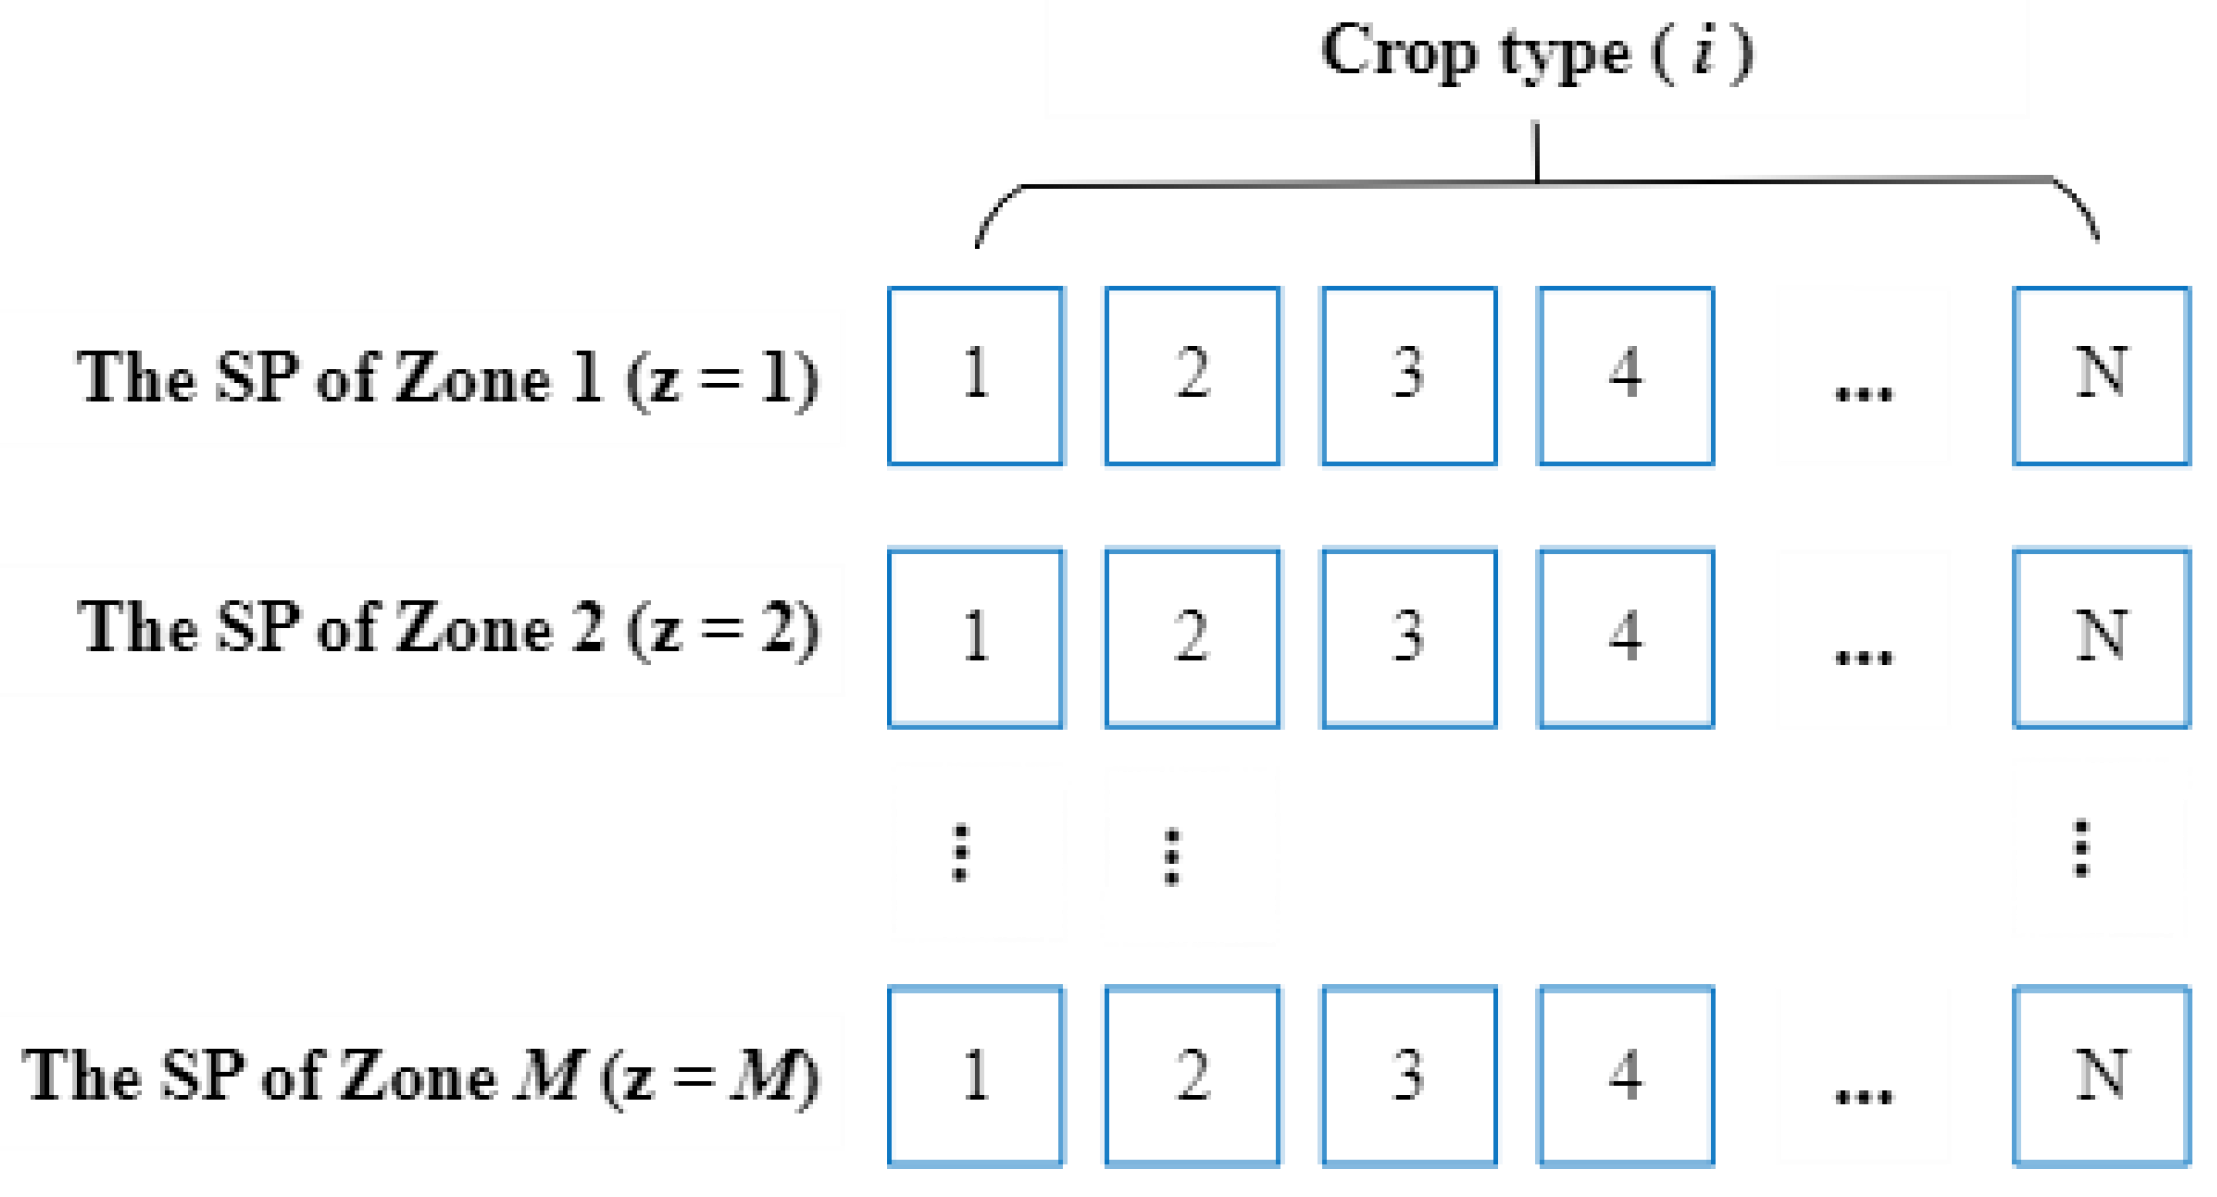
| Zone No. | Name | Irrigation Area (m2) |
|---|---|---|
| 1 | Dent Ai Tai | 1,705,600 |
| 2 | Nong Kam | 1,294,400 |
| 3 | Na Berk | 1,288,000 |
| 4 | Na Hui Nung | 3,083,200 |
| 5 | Na Pack | 275,200 |
| 6 | Tung Luang | 2,747,200 |
| Total | 10,393,600 |
| Crop Index | Crop Species and Variety Name | The Estimated Price of the Product (Baht/kg) | Fixed Cost and Estimated Cultivation (Baht/kg) | Estimated Product (Kg/rai) (1 rai = 1600 m2) | Annual Agricultural Cycle | Crop Coefficient (Kc) |
|---|---|---|---|---|---|---|
| 1 | Rice: Chai Nat A | 6.7 | 3.993 | 876 | 2 | 1.24 |
| 2 | Rice: Phitsanulok | 6.7 | 3.993 | 630 | 2 | 1.24 |
| 3 | Rice: RD49 | 6.7 | 3.993 | 733 | 2 | 1.24 |
| 4 | Rice: Hom Pathum | 8 | 3.993 | 750 | 2 | 1.24 |
| 5 | Rice: Jasmine105 | 8 | 3.993 | 750 | 1 | 1.24 |
| 6 | Rice: Suphan 90 | 6.7 | 3.993 | 600 | 2 | 1.24 |
| 7 | Corn: CP 999 | 8 | 1.606 | 750 | 2 | 1.19 |
| 8 | Corn: Sticky rice | 8 | 1.606 | 750 | 2 | 1.19 |
| 9 | Corn: CP 639 | 8 | 1.606 | 750 | 2 | 1.19 |
| 10 | Corn: CP 777 | 8 | 1.606 | 750 | 2 | 1.19 |
| 11 | Cassava: Rayong 5 | 2.8 | 0.135 | 3500 | 1 | 0.61 |
| 12 | Cassava: Kak Dum | 2.8 | 0.135 | 3500 | 1 | 0.61 |
| 13 | Cassava: Rayong 72 | 2.8 | 0.135 | 3500 | 1 | 0.61 |
| 14 | Cassava: Rayong 9 | 2.8 | 0.135 | 3500 | 1 | 0.61 |
| 15 | Cassava: Rayong 7 | 2.8 | 0.135 | 3500 | 1 | 0.61 |
| Crop Index | Mae Thor 2 (Den Ai Tai) | Ban Nong Khaem | Mae Thor 3 (Na Berk) | Mae Thor Ban Huay Nueng | Na Pae | Mae Thor Tung Luang |
|---|---|---|---|---|---|---|
| 1 | 25–100% | 25–100% | 25–100% | 25–100% | 25–100% | 25–100% |
| 2 | 10–100% | 10–100% | 10–100% | 10–100% | 10–100% | 10–100% |
| 3 | 10–100% | 10–100% | 10–100% | 10–100% | 10–100% | 10–100% |
| 4 | 10–100% | 10–100% | 10–100% | 10–100% | 10–100% | 10–100% |
| 5 | 10–100% | 10–100% | 10–100% | 10–100% | 10–100% | 10–100% |
| 6 | 0–100% | 0–100% | 0–100% | 0–100% | 0–100% | 0–100% |
| 7 | 0–100% | 0–100% | 0–100% | 0–100% | 0–100% | 0–100% |
| 8 | 0–100% | 0–100% | 0–100% | 0–100% | 0–100% | 0–100% |
| 9 | 0–100% | 0–100% | 0–100% | 0–100% | 0–100% | 0–100% |
| 10 | 0–100% | 0–100% | 0–100% | 0–100% | 0–100% | 0–100% |
| 11 | 0–100% | 0–100% | 0–100% | 0–100% | 0–100% | 0–100% |
| 12 | 0–100% | 0–100% | 0–100% | 0–100% | 0–100% | 0–100% |
| 13 | 0–100% | 0–100% | 0–100% | 0–100% | 0–100% | 0–100% |
| 14 | 0–100% | 0–100% | 0–100% | 0–100% | 0–100% | 0–100% |
| 15 | 0–100% | 0–100% | 0–100% | 0–100% | 0–100% | 0–100% |
| Crop Index | Mae Thor 2 (Den Ai Tai) | Ban Nong Khaem | Mae Thor 3 (Na Berk) | Mae Thor Ban Huay Nueng | Na Pae | Mae Thor Tung Luang | ||||||
|---|---|---|---|---|---|---|---|---|---|---|---|---|
| Area (m2) | % | Area (m2) | % | Area (m2) | % | Area (m2) | % | Area (m2) | % | Area (m2) | % | |
| 1 | 426,400 | 25% | 323,600 | 25% | 322,000 | 25% | 770,800 | 25% | 68,800 | 25% | 686,800 | 25% |
| 2 | 170,560 | 10% | 129,440 | 10% | 128,800 | 10% | 308,320 | 10% | 27,520 | 10% | 274,720 | 10% |
| 3 | 170,560 | 10% | 129,440 | 10% | 128,800 | 10% | 308,320 | 10% | 27,520 | 10% | 274,720 | 10% |
| 4 | 170,560 | 10% | 129,440 | 10% | 128,800 | 10% | 308,320 | 10% | 27,520 | 10% | 274,720 | 10% |
| 5 | 170,560 | 10% | 129,440 | 10% | 128,800 | 10% | 308,320 | 10% | 27,520 | 10% | 274,720 | 10% |
| 6 | 0 | 0% | 0 | 0% | 0 | 0% | 0 | 0% | 0 | 0% | 0 | 0% |
| 7 | 596,960 | 35% | 453,040 | 35% | 450,800 | 35% | 0 | 0% | 0 | 0% | 961,520 | 35% |
| 8 | 0 | 0% | 0 | 0% | 0 | 0% | 0 | 0% | 0 | 0% | 0 | 0% |
| 9 | 0 | 0% | 0 | 0% | 0 | 0% | 1,079,120 | 35% | 96,320 | 35% | 0 | 0% |
| 10 | 0 | 0% | 0 | 0% | 0 | 0% | 0 | 0% | 0 | 0% | 0 | 0% |
| 11 | 0 | 0% | 0 | 0% | 0 | 0% | 0 | 0% | 0 | 0% | 0 | 0% |
| 12 | 0 | 0% | 0 | 0% | 0 | 0% | 0 | 0% | 0 | 0% | 0 | 0% |
| 13 | 0 | 0% | 0 | 0% | 0 | 0% | 0 | 0% | 0 | 0% | 0 | 0% |
| 14 | 0 | 0% | 0 | 0% | 0 | 0% | 0 | 0% | 0 | 0% | 0 | 0% |
| 15 | 0 | 0% | 0 | 0% | 0 | 0% | 0 | 0% | 0 | 0% | 0 | 0% |
| Total | 1,705,600 | 100% | 1,294,400 | 100% | 1,288,000 | 100% | 3,083,200 | 100% | 275,200 | 100% | 2,747,200 | 100% |
| Month | Expected Water Amounts/Month (m3) | ||||||
|---|---|---|---|---|---|---|---|
| Mae Thor 2 (Den Ai Tai) | Ban Nong Khaem | Mae Thor 3 (Na Berk) | Mae Thor Ban Huay Nueng | Na Pae | Mae Thor Tung Luang | Total Water Amount | |
| 1 | 2,068,420 | 1,569,740 | 1,561,980 | 3,739,060 | 333,741 | 3,331,580 | 12,604,521 |
| 2 | 1,770,630 | 1,343,750 | 1,337,110 | 3,200,760 | 285,693 | 2,851,950 | 10,789,893 |
| 3 | 2,237,350 | 1,697,950 | 1,689,550 | 4,044,430 | 360,998 | 3,603,680 | 13,633,958 |
| 4 | 0 | 0 | 0 | 0 | 0 | 0 | 0 |
| 5 | 1,087,880 | 825,605 | 821,523 | 1,966,550 | 175,530 | 1,752,240 | 6,629,328 |
| 6 | 822,623 | 624,298 | 621,211 | 1,487,050 | 132,731 | 1,324,990 | 5,012,903 |
| 7 | 865,459 | 656,807 | 653,559 | 1,564,480 | 139,643 | 1,393,990 | 5,273,938 |
| 8 | 2,482,100 | 1,883,690 | 1,874,380 | 4,486,870 | 400,489 | 3,997,900 | 15,125,429 |
| 9 | 1,373,340 | 1,042,240 | 1,037,090 | 2,482,570 | 221,589 | 2,212,030 | 8,368,859 |
| 10 | 2,191,230 | 1,662,950 | 1,654,730 | 3,961,060 | 353,556 | 3,529,400 | 13,352,926 |
| 11 | 684,098 | 519,170 | 516,603 | 1,236,640 | 110,380 | 1,101,870 | 4,168,761 |
| 12 | 647,443 | 491,352 | 488,922 | 1,170,380 | 104,465 | 1,042,830 | 3,945,392 |
| No. | Name | AMPL | SA | ||
|---|---|---|---|---|---|
| Objective Solution | Solving Time (s) | Objective Solution | Solving Time (s) | ||
| 1 | DDS 1 | 42,110,600 | 1.48 | 42,110,600 | 6.43 |
| 2 | DDS 2 | 42,110,600 | 2.54 | 42,110,600 | 8.82 |
| 3 | DDS 3 | 46,406,900 | 1.48 | 46,406,900 | 3.22 |
| 4 | DDS 4 | 44,259,700 | 2.17 | 44,259,700 | 5.80 |
| 5 | DDS 5 | 62,036,500 | 1.30 | 62,036,500 | 9.90 |
| 6 | DDS 6 | 61,491,600 | 3.61 | 61,491,600 | 4.46 |
| 7 | DDS 7 | 56,962,100 | 1.40 | 56,962,100 | 3.21 |
| 8 | DDS 8 | 53,208,200 | 3.38 | 53,208,200 | 8.31 |
| 9 | DDS 9 | 41,886,000 | 3.30 | 41,886,000 | 5.31 |
| 10 | DDS 10 | 62,303,100 | 3.98 | 62,303,100 | 4.91 |
| 11 | DDS 11 | 55,529,500 | 1.95 | 55,529,500 | 8.77 |
| 12 | DDS 12 | 52,390,200 | 2.87 | 52,390,200 | 8.59 |
| 13 | DDS 13 | 55,637,200 | 3.88 | 55,637,200 | 4.14 |
| 14 | DDS 14 | 55,583,400 | 3.60 | 55,583,400 | 6.90 |
| 15 | DDS 15 | 61,937,800 | 1.27 | 61,937,800 | 8.19 |
| 16 | DDS 16 | 52,391,400 | 2.19 | 52,391,400 | 9.20 |
| 17 | DDS 17 | 55,294,900 | 1.66 | 55,294,900 | 9.12 |
| 18 | DDS 18 | 56,802,200 | 1.36 | 56,802,200 | 7.82 |
| 19 | DDS 19 | 55,529,500 | 2.91 | 55,529,500 | 8.93 |
| 20 | DDS 20 | 52,241,500 | 1.59 | 52,241,500 | 7.05 |
| Average | 2.40 | 6.95 | |||
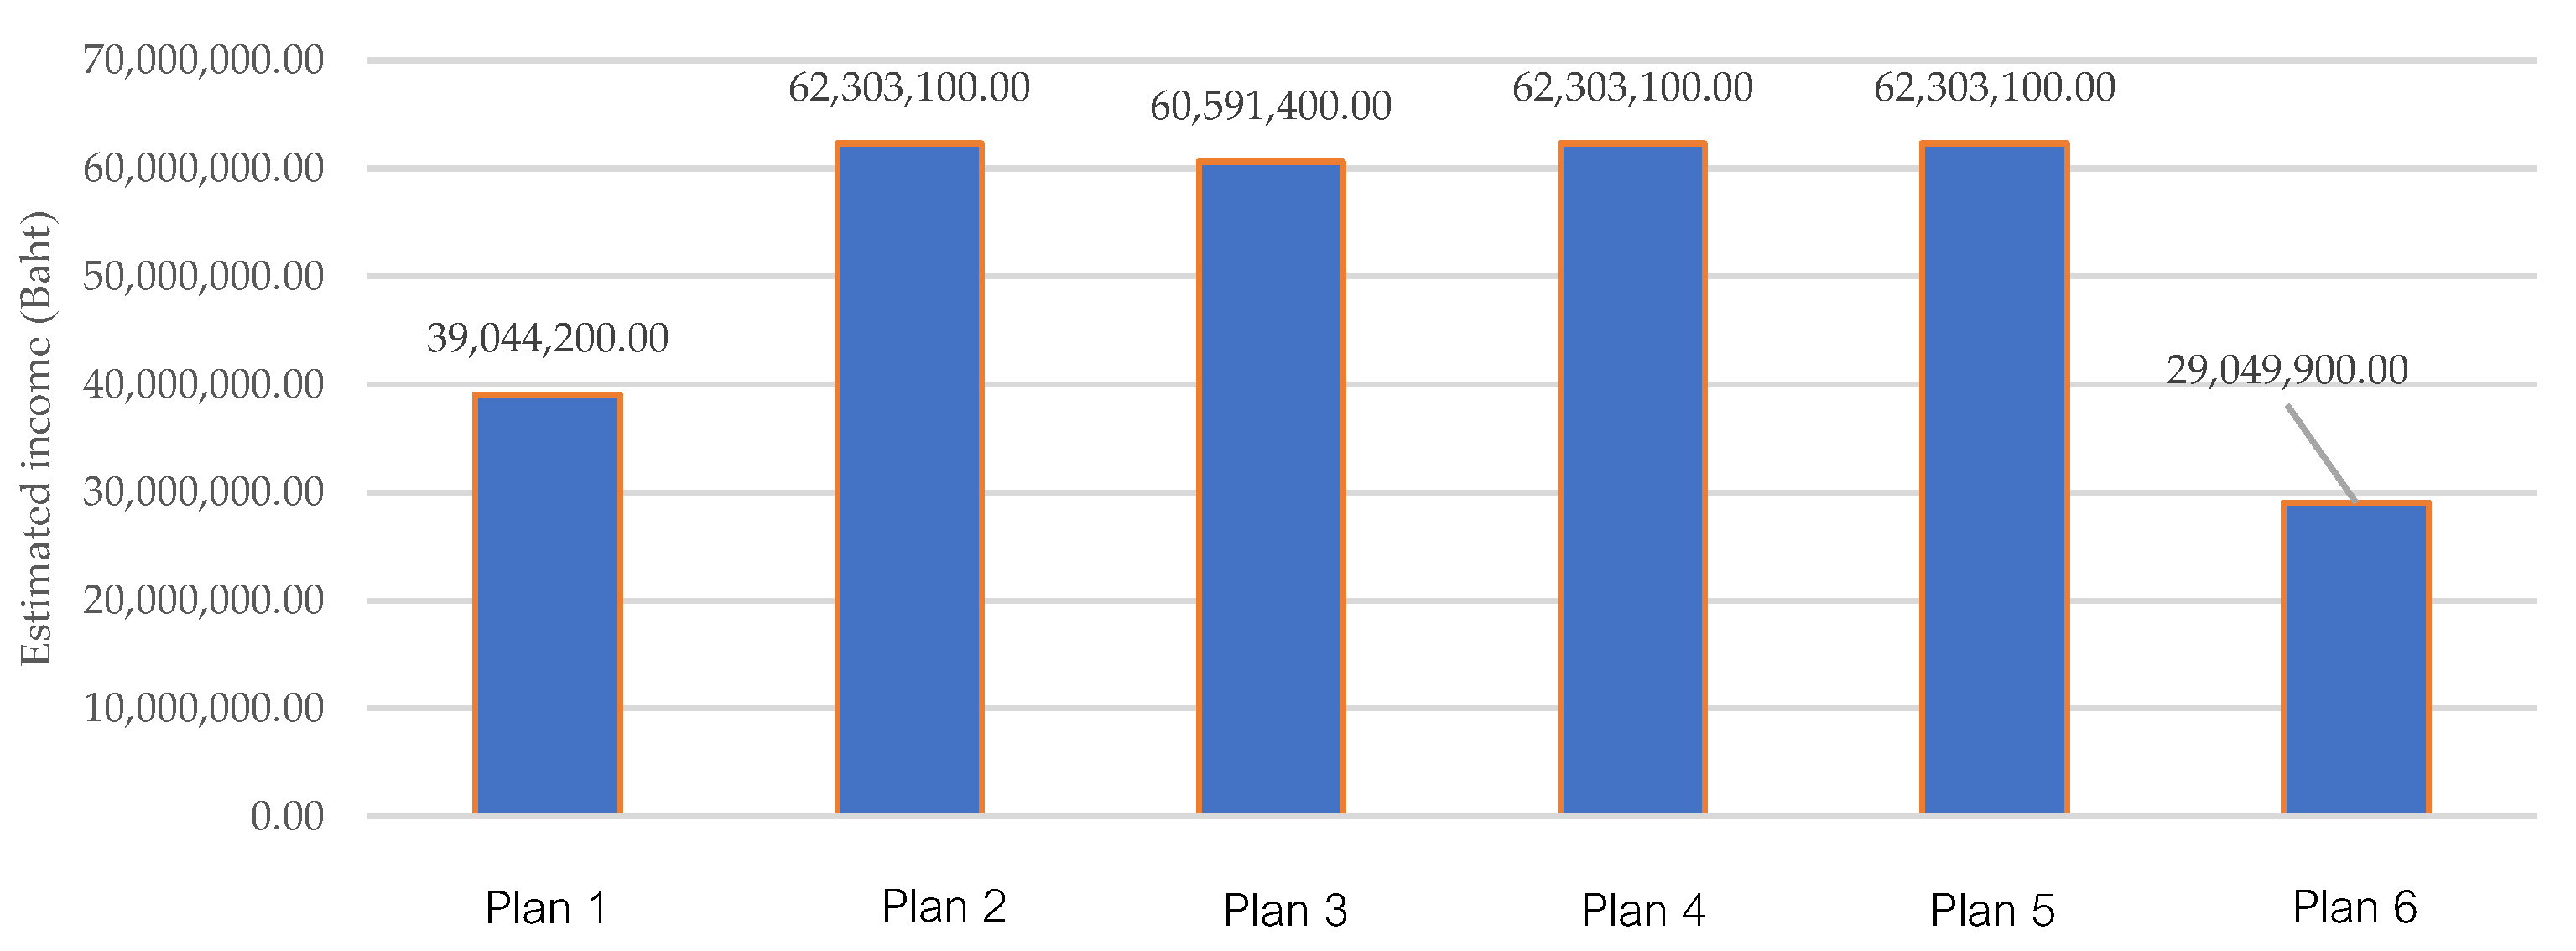
| Crop’s Species | Agricultural Area Limitation | ||||
|---|---|---|---|---|---|
| Plan 1 | Plan 2 | Plan 3 | Plan 4 | Plan 5 | |
| Rice | 0–100% | 0 | 0 | 0–25% | 0–100% |
| Corns | 0 | 0–100% | 0 | 0–25% | 0–100% |
| Cassava | 0 | 0 | 0–100% | 0–25% | 0–100% |
| Crop’s Species | Variety | Agricultural Area Limitation | |||||
|---|---|---|---|---|---|---|---|
| Zone 1 | Zone 2 | Zone 3 | Zone 4 | Zone 5 | Zone 6 | ||
| Rice | Chai Nat | 25–100% | 88–100% | 52–100% | 49–100% | 17–100% | 42–100% |
| Phitsanulok | 37–100% | 12–100% | 48–100% | 46–100% | 4–100% | 56–100% | |
| RD49 | 1–100% | 0 | 0 | 4–100% | 55–100% | 1–100% | |
| Hom Pathum | 3–100% | 0 | 0 | 1–100% | 3–100% | 0 | |
| Jasmine105 | 0 | 0 | 0 | 0 | 13–100% | 0 | |
| Suphan 90 | 0 | 0 | 0 | 0 | 0 | 0 | |
| Corns | CP 999 | 5–100% | 0 | 0 | 0 | 0 | 0 |
| CP 369 | 0 | 0 | 0 | 0 | 4–100% | 0 | |
| CP 777 | 1–100% | 0 | 0 | 0 | 0 | 0 | |
| Sticky rice | 7–100% | 0 | 0 | 0 | 4–100% | 0 | |
| Cassava | Rayong 5 | 12–100% | 0 | 0 | 0 | 0 | 2–100% |
| Kak Dum | 5–100% | 0 | 0 | 0 | 0 | 0 | |
| Rayong 72 | 1–100% | 0 | 0 | 0 | 0 | 0 | |
| Rayong 9 | 0 | 0 | 0 | 0 | 0 | 0 | |
| Rayong 7 | 3–100% | 0 | 0 | 0 | 0 | 0 | |
Publisher’s Note: MDPI stays neutral with regard to jurisdictional claims in published maps and institutional affiliations. |
© 2022 by the authors. Licensee MDPI, Basel, Switzerland. This article is an open access article distributed under the terms and conditions of the Creative Commons Attribution (CC BY) license (https://creativecommons.org/licenses/by/4.0/).
Share and Cite
Jewpanya, P.; German, J.D.; Nuangpirom, P.; Maghfiroh, M.F.N.; Redi, A.A.N.P. A Decision Support System for Irrigation Management in Thailand: Case Study of Tak City Agricultural Production. Appl. Sci. 2022, 12, 10508. https://doi.org/10.3390/app122010508
Jewpanya P, German JD, Nuangpirom P, Maghfiroh MFN, Redi AANP. A Decision Support System for Irrigation Management in Thailand: Case Study of Tak City Agricultural Production. Applied Sciences. 2022; 12(20):10508. https://doi.org/10.3390/app122010508
Chicago/Turabian StyleJewpanya, Parida, Josephine D. German, Pinit Nuangpirom, Meilinda Fitriani Nur Maghfiroh, and Anak Agung Ngurah Perwira Redi. 2022. "A Decision Support System for Irrigation Management in Thailand: Case Study of Tak City Agricultural Production" Applied Sciences 12, no. 20: 10508. https://doi.org/10.3390/app122010508
APA StyleJewpanya, P., German, J. D., Nuangpirom, P., Maghfiroh, M. F. N., & Redi, A. A. N. P. (2022). A Decision Support System for Irrigation Management in Thailand: Case Study of Tak City Agricultural Production. Applied Sciences, 12(20), 10508. https://doi.org/10.3390/app122010508


