Featured Application
The analytical method described in this article has a great value for its potential applications to the determination of duvelisib in its marketed capsules and plasma samples from patients with small lymphocytic lymphoma and relapsed or refractory chronic lymphocytic leukemia.
Abstract
Duvelisib (DUV) is a novel drug with a small molecular weight and characterized by dual phosphoinositide-3-kinase (PI3K)- and PI3K-inhibitory activity. The Food and Drug Administration (FDA) recently approved DUV for the management of small lymphocytic lymphoma (SLL) and relapsed or refractory chronic lymphocytic leukemia (CLL) in adult patients. In the current study, a microwell-based fluorimetric (MW-FLR) method was established for the quantitation of DUV in copiktra® capsules as well as plasma samples. The proposed MW-FLR method was carried out in a 96-microwell plate and involved measuring the native fluorescence of DUV by using a fluorescence plate reader at 405 nm after excitation at 340 nm. The preparation of plasma samples involved simple one-step protein precipitation prior to the analysis. The optimum conditions for the proposed method were established. Under these conditions, the fluorescence signals showed an excellent linear relationship with DUV concentrations in the sample solutions (r = 0.9995) in a concentration range of 25–800 ng/mL. The detection and quantification limits were 20.5 and 62.1 ng/mL, respectively. The method's accuracy and precision were acceptable as the recovery values were not less than 98.5% with low relative standard deviations (less than 6%). The presented MW-FLR method was adopted with truly good accuracy and precision to analyze copiktra capsules and DUV-spiked plasma samples. The method's results were found to be superior to those of reference methods. The MW-FLR method combined the advantages of the inherent high sensitivity of the fluorimetric measurement and the high analytical throughput of microwell-based methods. In addition, the method is characterized by the simplicity of the procedures and the green chemistry approach as it uses water as a solvent and low volumes of sample solutions. These advantages gave the method great value for the determination of DUV in quality control and/or clinical laboratories.
1. Introduction
A type of cancer called leukemia appears in the tissues that produce blood (e.g., bone marrow). Chronic lymphocytic leukemia (CLL), a hematologic malignancy, produces an excessive number of B-lymphocytes (immature lymphoid stem cells) [1]. Small lymphocytic lymphoma (SLL) and chronic lymphocytic leukemia (CLL) are two cancers that are similar enough to one another that their names are occasionally interchanged [1,2]. Chemotherapy with a variety of drugs (given as single or in combination) and immunotherapy are the standard treatments for CLL and SLL. These therapies include monoclonal antibodies, immunomodulatory-antiangiogenic drugs, nucleoside analogs, and alkylating agents. Although some of these regimens have median survival times of more than 10 years and overall response rates of less than 90%, eventually relapse happens with shorter survival times and response rates [3,4]. This demands the development of contemporary, secure, and safe medications with novel mechanisms of action. One of the important targets is the phosphoinositide 3-kinase (PI3K) enzyme which is a lipid kinase involved in intracellular signal transmission. There are four isoforms of the catalytic subunit of PI3K: α, β, δ, and γ [5,6]. Malignant cell proliferation and migration are blocked by the tumor microenvironment when both PI3K-δ and PI3K-γ are inhibited [7,8,9]. Moreover, both PI3K-δ and PI3K-γ suppression contribute to the death of tumor cells [10,11]. As a result, concurrent inhibition of PI3K-δ and PI3K-γ may enhance therapeutic results in patients with lymphoid malignancies [12]. The recognized involvement of PI3K-δ and PI3K-γ in hematologic malignancies has led to the present development of class-specific PI3K inhibitors for use as anticancer drugs [11]. Idelalisib is the first PI3K inhibitor that has been approved for the treatment of CLL (in combination with rituximab) and as a monotherapy for relapsed SLL and relapsed follicular lymphoma. Moreover, it was recommended by the FDA as first-line therapy for patients who were ineligible for chemoimmunotherapy and had CLL with a dismal prognosis and 17p deletions or TP53 mutations [12].
Duvelisib (DUV, also known as IPI-145) is a novel drug with a small molecular weight and possesses a dual PI3K-δ and PI3K-γ inhibitory action. Its chemical structure is depicted in Figure 1. DUV exhibits leukemia cell-specific antiproliferative action [13]. DUV was created by Verastem, Inc., Needham, MA, USA) and has recently (on 24 September 2018) received FDA approval for the treatment of adults with relapsed or refractory CLL or SLL [14] as well as accelerated approval for relapsed or refractory follicular lymphoma management [15]. This may be attributed to its high success response rate. DUV may also potentially diminish T-cell lymphoma [14,15]. DUV is sold under the brand name of Copiktra® (Verastem, Inc., Needham, MA, USA) and its dosage is 25 mg twice daily as oral capsules throughout a 28-day therapy cycle [14].
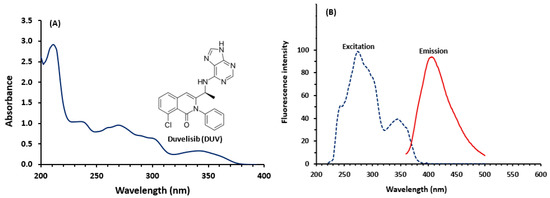
Figure 1.
Panel (A): the chemical structure of duvelisib (DUV) and its absorption spectrum. The concentration of DUV was 20 µg/mL in methanol. Panel (B): the fluorescence spectra (excitation and emission) of DUV. The concentration of DUV solution used for recording the spectra was 200 ng/mL in methanol.
The quality of the copiktra capsules and the assessment of plasma concentrations in patients during therapy dictates the efficacy and safety of DUV therapy. To ensure copiktra capsules with good quality and assess the plasma concentrations of DUV in the patients, a proper analytical method is required. The existing methods for the determination of DUV in its capsules and plasma samples are very limited [16,17,18,19,20,21]. Ch et al. [16] provided a description of an HPLC analysis utilizing a photodiode array detector to estimate and evaluate the stability of DUV in a combination made in a laboratory. In order to determine the amount of DUV in its capsules, Darwish et al. [17] established a microwell-based spectrophotometric method depending on the charge transfer reaction of DUV with chloranilic acid. Another HPLC approach with UV detection was reported by Siddesh et al. [18] for DUV quantification in rat plasma samples. Nevertheless, the method required a time-consuming liquid-liquid extraction step and had relatively low accuracy (about 88%). UPLC-MS/MS technique was developed by Nigade et al. [19] for the estimation of tissue-to-plasma distribution ratios of DUV and other basic compounds in mice. Even though, this method required lengthy run times and laborious sample pretreatment procedures to fully separate DUV from the other co-administered substances. For the purpose of evaluating DUV in beagle dogs, Shao et al. [20] created a new UPLC-MS/MS procedure with improved sensitivity and precision. Recently, the HPLC approach with fluorescence detection (HPLC-FD) for DUV quantification in plasma and its application to a pharmacokinetic investigation in rats were disclosed by our lab [21]. This review highlights that the existing methods are mostly chromatography and rely on extensive and expensive instruments. In addition, these methods have been developed for either copiktra capsules or plasma samples; none of them can be used for both. For these reasons, a new alternative simple technique with high throughput, and high sensitivity, which requires minimum sample pretreatment and is environmentally/health safe is urgently needed for the analysis of DUV in both copiktra capsules and plasma samples. Fluorimetry is widely used in both pharmaceutical and biomedical analysis. The wide applications of fluorimetry are because of its inherent simplicity, high sensitivity, and low analysis cost [22,23].
This work detailed, for the first time, the development and validation of an innovative microwell-based fluorimetric (MW-FLR) method for DUV quantitation in various samples including dosage form as well as plasma samples. The procedure of the proposed MW-FLR method was carried out in 96-microwell plates and involved measuring the native fluorescence of DUV by a fluorescence plate reader. The method involved no pretreatment for copiktra capsule samples and simple one-step protein precipitation for plasma samples prior to the analysis.
2. Experimental
2.1. Apparatus
Fluorimeter (FP-8200: JASCO Co., Ltd., Kyoto, Japan), with 1 cm quartz cells was used for the fluorimetric measurements. The slit width of both the excitation and emission monochromators was set at 5 nm. The Spectra Manager® software was used to convert all recorded spectra to ASCII format. Microplate fluorescence reader (FLx800: Bio-Tek Instruments Inc., Winooski, VT, USA) empowered by KC junior software, provided with the instrument. Microprocessor laboratory pH meter (BT-500: Boeco, Hamburg, Germany). Purelab Flex water purification system (ELGA Veolia Ltd., High Wycombe, UK).
2.2. Chemicals and Materials
Duvelisib (DUV) was purchased from LC Laboratories (Woburn, MA, USA); its purity was >99%. Copiktra® capsules (Verastem, Inc., Needham, MA, USA) labeled to contain 25 mg of DUV per capsule were obtained from a local market. 96-Microwell black-walled, clear-bottom was the product of Thermo Fisher Scientific (Waltham, MA, USA). Britton-Robinson buffer composed of 0.04 M boric acid, 0.04 M phosphoric acid, and 0.04 M acetic acid adjusted at pH range (2–12) by using 0.2 M sodium hydroxide. Sodium dodecyl sulfate and tween 20 were obtained from Sigma Chemical Co. (St. Louis, MO, USA). Cremophor-RH 40 and Cremophor-EL were purchased from BASF (Ludwigshafen, Germany). Finnpipette adjustable 8-channel pipette was obtained from Sigma Chemical Co. (St. Louis, MO, USA). Human plasma was obtained from the Blood Bank of King Khalid Hospital (King Saud University, Riyadh, Saudi Arabia) and was kept frozen at −20 °C until used in the analysis. All solvents were of spectroscopic grade (Merck, Darmstadt, Germany). All other chemicals used throughout the work were of analytical grade. Distilled-deionized water was obtained from the Purelab flex water purification system.
2.3. Preparation of Standard and Sample Solutions
2.3.1. Standard Solutions
To prepare a stock solution of DUV containing 1 mg/mL, a precisely weighed quantity (25 mg) of DUV was quantitatively placed into 25-mL calibrated flasks, dissolved in 1 mL of dimethyl sulfoxide (DMSO), and topped up with methanol. To produce a working solution of 1 µg/mL, the stock solution was then diluted with water.
2.3.2. Capsules Sample Solution
Ten capsules’ contents were taken, combined, and weighed. A portion of the capsules' contents equal to 25 mg of DUV was transferred to a 25 mL measuring flask, dissolved in 1 mL of DMSO, and the volume was finally diluted with methanol. The flasks were shaken and sonicated for 5 min to ensure complete dissolution of DUV. The flask content was filtered, and the first portion of the filtrate was rejected. The filtrate solution was diluted quantitatively with water and subjected to analysis by the proposed MW-FLR method.
2.3.3. Plasma Samples
To produce plasma samples with final DUV concentrations in the therapeutic range (471–3294 ng/mL), blank human plasma was spiked with the cited drug to prepare the calibration quality control samples. Equal amounts of methanol and plasma samples were combined, vortexed for 30 s, then centrifuged at 13,000 rpm for 10 min. The supernatants were aspirated and diluted with water to attain concentrations in the range of the proposed MW-FLR method (25–800 ng/mL). The obtained diluted samples were subjected to analysis by the proposed method.
2.4. Recommended Procedures of MW-FLR
96-microwell assay plates were filled with precisely measured aliquots (200 µL) of the standard, capsule, or plasma sample solution with various concentrations of DUV (25–800 ng/mL). The fluorescence of solutions was measured at 405 nm for emission and 340 nm for excitation.
3. Results and Discussion
3.1. Design and Strategy of Method Development
A previous study [21] confirmed that DUV has intense native fluorescence as expected from its chemical structure (Figure 1) because it contains strong fluorophoric moieties such as extended conjugations and rigid fused rings. Therefore, fluorimetry was considered in developing the method described in this study. The conventional fluorimetric methods have limited throughput because they are mostly carried out in a non-automated fashion [22,23]. These methods also consume large volumes of costly organic solvents, and more importantly, the analysts are exposed to the toxic effects of the organic solvents [24]. Recently, our laboratory successfully adapted a fluorescence plate reader in the development of a microwell-based fluorimetric method to measure the active drug content in pharmaceutical dosage form [25]. This method displayed high throughput and consumed minimum volumes of samples and organic solvents. For these reasons, the development of this methodology for DUV was considered in this study. In most cases, liquid-liquid and/or solid-phase extraction of analytes from plasma is required before fluorimetric analysis of plasma samples [26,27]. In fact, the several extraction steps lengthen the overall analysis process and reduce the method's accuracy. The successful development of fluorimetric methods for the accurate measurement of pharmaceuticals in plasma samples without extractive pre-treatment of the samples was disclosed in earlier publications [28,29]. In order to create the MW-FLR approach presented here, this non-extractive method was used.
3.2. Development of MW-FLR Method
3.2.1. Spectral Characteristics
The fluorescence spectra (excitation and emission) of DUV were recorded in methanol (Figure 1). The spectra showed that DUV has two excitation wavelengths (λex) at 275 nm and 340 nm and showed maximum emission (λem) at 405 nm. The initially achieved intensity of the native fluorescence of DUV was promising for the development of a fluorimetric method for its determination in both capsules and plasma samples. In the subsequent experiments, fluorescence intensities were measured at 405 nm after excitation at 275 nm.
3.2.2. Optimization of Method Variables
Effect of Solvent
The effect of solvent on the fluorescence of DUV was studied. These solvents were water, acetonitrile, dioxane, diethyl ether, chloroform, dichloromethane, dichloroethane, isopropanol, ethanol, and methanol. The highest and comparable fluorescence intensity was achieved with polar solvents (water, acetonitrile, isopropanol, ethanol, and methanol); however, lower fluorescence intensity was achieved with less/non-polar solvents (dioxane, diethyl ether, chloroform, dichloromethane, and dichloromethane); Figure 2. The varying effects of the solvents on the DUV’s fluorescence intensity were related to the varied potencies of the interactions between the solvents and the DUV. Furthermore, DUV molecules often have non-symmetric dipoles and exhibit varying rates of relaxation in various solvents. Furthermore, the intermolecular arrangement of the fluorophores in the excited state, and possible formation of hydrogen bonding may cause temporal effects on the fluorescence spectra of DUV [30]. Among the better solvents, water was selected as a solvent in all subsequent experiments because it is inexpensive and more importantly it is environmentally and health safety, which imposes a green approach property to the method.
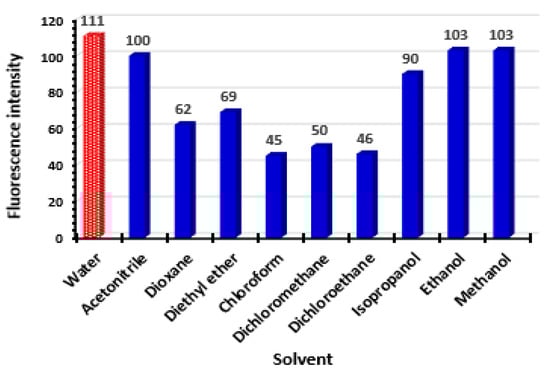
Figure 2.
Effect of solvent on the fluorescence intensity of DUV solution (200 ng/mL in methanol). Values are mean of 3 determinations.
Effect of Organized Surfactant Media
In fluorimetric analysis, it has been documented that adding an organized surfactant or macromolecule to the drug solution may increase its fluorescence intensity and accordingly enhance the method sensitivity [28]. Therefore, different surfactants of different categories and macromolecules were tested in the present study. These surfactants were anionic (sodium dodecyl sulphate: SDS), cationic (dodecyl dimethyl ammonium bromide: DDAB), non-ionic (cremophor-RH 40, cremophor-EL and tween-20) and macromolecule (carboxymethyl cellulose: CMC). The results (Figure 3) revealed that none of these media had an enhancement effect on the aqueous medium of DUV. Accordingly, adding an organized medium was ruled out from all the subsequent experiments.
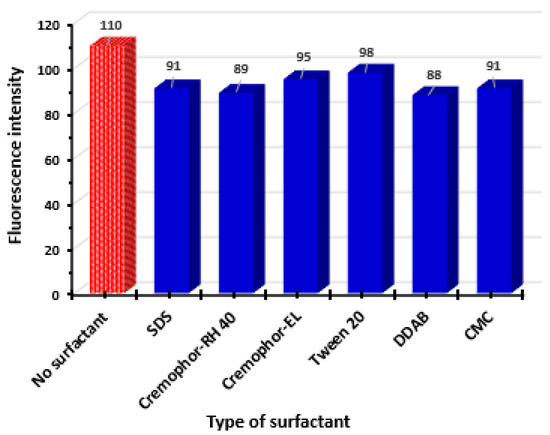
Figure 3.
Effect of type of surfactant on the fluorescence intensity of DUV solution (200 ng/mL in methanol). Values are mean of 3 determinations.
Effect of pH
The effect of pH on the fluorescence intensity of DUV was studied by adding Britton–Robinson buffer solution of different pH values (pH 2–12) to the solution and subsequently measuring the fluorescence. The results (Figure 4) indicated that the highly acidic (pH 2–3) and highly alkaline (pH 10–12) solutions had a quenching effect on the fluorescence intensity of the DUV solution. These effects were attributed to either protonation of the nitrogen atoms of the fluorophoric moiety in the DUV structure (Figure 1) at high acidic pH values or a possible degradative effect on the entire structure at high alkaline pH values. The fluorescence quenching effect due to the protonation of nitrogen atoms in acidic pH was due to the delocalization of electrons on the fluorophore and accordingly decrease their liability for excitation by the exciting light wavelength. Besides, the documented effect of pH on the inter- and intra-molecular interactions [31]. The highest fluorescence intensity was achieved at pH values in the range of 4–9. The achieved fluorescence intensities using a buffer solution (pH 4–9) were almost comparable to that achieved using a water DUV solution without buffer. Accordingly, all the subsequent experiments were carried out without adding a buffer solution to the DUV solution. This added advantages to the procedures such as less cost, eco-friendly, and health safe.
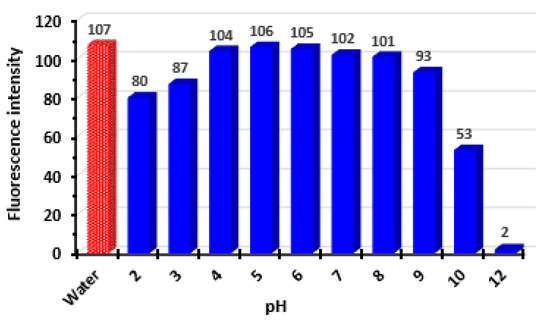
Figure 4.
Effect of pH on the fluorescence intensity of DUV solution (200 ng/mL in methanol). Values are mean of 3 determinations.
Effect of Sample Matrix
To assess the applicability of the proposed MW-FLR method for the accurate determination of DUV in both capsules and plasma samples, the effect of matrices on the accuracy of the method was studied. The potential interference from the matrix of capsules (inactive ingredients used for manufacturing) was studied. Microcrystalline cellulose, colloidal silicon dioxide, crospovidone, and magnesium stearate were mixed in various proportions with known amounts of DUV to produce the samples. After excitation at 275 nm, the fluorescence intensity of DUV was then measured at 405 nm. A satisfactory recovery% of 99.4 ± 2.4% was attained, showing that the excipients had no effect on the analysis accuracy. This was attributed to the fact that the proposed MW-FLR relies on the measurement of the native fluorescence of DUV; however, none of the inactive ingredients that can be co-extracted from copiktra capsules has native fluorescence.
The effect of the plasma matrix was also evaluated by analyzing blank DUV-free human plasma samples and plasma samples spiked with varying concentrations of DUV (100, 450, and 600 ng/mL). The fluorescence spectra of these samples were recorded, and recovery values were calculated for each case. It was found that the fluorescence emitted from blank plasma samples after excitation at 275 nm is overlapping the emission spectrum of DUV leading to interference and accordingly high recovery values (Figure 5, line 1). However, this interference was completely avoided when the sample was excited at 340 nm instead of 275 nm as evidenced by the fluorescence spectrum that showed negligible fluorescence at the emission maximum of DUV (Figure 5, line 2). Meanwhile, the fluorescence emitted from DUV-containing plasma samples after their excitation at 275 was increased with the DUV concentrations (Figure 5, lines 3, 4, and 5). Recovery values obtained from these samples were satisfactory (98.2–103.5%). Based on these results, fluorescence intensities were measured at 405 nm after excitation at 340 nm in all the subsequent validation experiments.
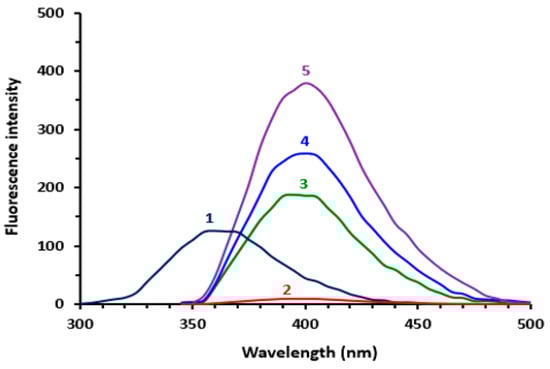
Figure 5.
The emission spectra of blank plasma sample (contains no DUV) after excitation at 275 nm (1), blank plasma sample (contains no DUV) after excitation at 340 nm (2), plasma sample spiked with DUV at concentrations of 100, 450 and 600 ng/mL (3, 4 and 5, respectively) after excitation at 340 nm.
3.3. Validation of MW-FLR Method
The MW-FLR method was validated for linearity, sensitivity, precision, accuracy and robustness according to ICH guidelines [32].
3.3.1. Linearity and Sensitivity
Under the optimum conditions of the method (Table 1), the calibration graph for the determination of DUV was generated by plotting the fluorescence intensity as a function of the corresponding DUV concentrations (Figure 6). The regression analysis for the results was conducted. The linear equation was Y = 0.5956X + 2.9481, where Y is the fluorescence intensity at 405 nm (after excitation at 340 nm) and X is the concentration of DUV in ng/mL in the range of 25–800 ng/mL. The correlation coefficient (r) was 0.9995. A summary of the statistical parameters is given in Table 2.

Table 1.
Optimization of MW-FLR method for determination of DUV.
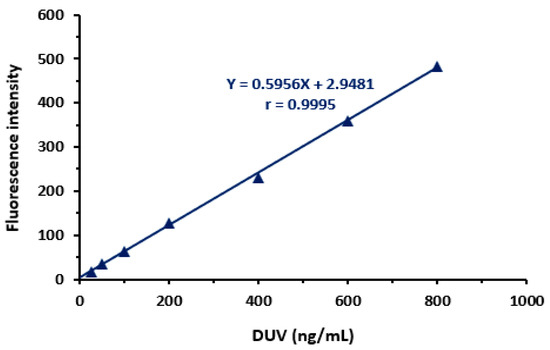
Figure 6.
Calibration curve for determination of DUV by the proposed MW-FLR method. Values of fluorescence intensity are mean of 3 determinations. Linear fitting equation and its correlation coefficient (r) is given on the calibration line.
Table 2.
Calibration statistical parameters for determination of DUV by the MW-FLR method.
The limit of detection (LOD) and limit of quantification (LOQ) of the MW-FLR method were calculated. LOD, defined as the minimum detectable DUV concentration, was calculated using the formula: 3.3 × Standard deviation (SD) of intercept/Slope. LOQ, defined as the DUV concentration that can be quantified with satisfactory accuracy and precision under the stated procedures of the MW-FLR method, was calculated using the formula: 10 × Standard deviation (SD) of intercept/Slope. LOD and LOQ values were 20.5 and 62 ng/mL, respectively. It is worth mentioning that the achieved sensitivity of the MW-FLR method is adequate for the determination of DUV in dosage form as well as in plasma samples. This assessment based on a study involving 207 patients receiving DUV at different doses ranging from 8 to 100 mg twice a day revealed that DUV is reaching its peak plasma concentration (Cmax) of 471 to 3294 ng/mL after 1 to 2 h from the administration time [33]. The Cmax values after a therapeutic DUV dose (25 mg) were found to be 1511 ng/mL, and systemic exposure ranged from 2001 to 19,059 ng/h/mL.
3.3.2. Precision and Accuracy
The precision of the proposed MW-FLR method was assessed for intra- (n = 6) and inter-assay (n = 9) precisions by analyzing nominated concentrations of DUV taken from copiktra capsules and spiked in human plasma samples (Table 3) and the relative standard deviation (RSD) percentages were calculated. It was found that the RSD values for intra-assay precision were in the ranges of 1.54–2.41 and 2.52–4.26% for analysis of DUV concentrations taken from copiktra capsules and spiked in plasma samples, respectively, where the RSD values for inter-assay precision were in the ranges of 1.53–2.82 and 2.45–4.68% for capsules and plasma, respectively. These findings supported the MW-FLR method's high precisions for DUV quantitation in both capsule and plasma samples. This high accuracy was attributed to the precision of the volumes’ dispensing into the microwells by 8-channel pipettes and the minimum experimental manipulations of the samples prior to measuring the fluorescence by the reader.
Table 3.
Precision and accuracy of the proposed MW-FLR method for determination of DUV in copiktra capsules and plasma samples.
The results of both intra- and inter-day accuracy (expressed as recovery, %) are given in Table 3. The intra-day recovery values were in the range of 98.5–103.2% (±1.1–2.4) and 97.5–104.2% (±3.5–5.4) for copiktra capsules and plasma samples, respectively. The inter-day recovery values were in the range of 98.8–101.2% (±1.4–2.8) and 98.4–104.1% (±3.1–5.6) for copiktra capsules and plasma samples, respectively. These good recovery values confirmed the accuracy of the proposed MW-FLR method for the determination of DUV in both copiktra capsules and plasma samples.
3.3.3. Robustness and Ruggedness
The robustness of the method is defined as its ability to maintain its analytical performance upon minor changes in its experimental conditions. The proposed MW-FLR method, involving direct measuring of the native fluorescence of DUV in an aqueous solution without any experimental conditions, is very simple and considered as a robust method.
Analyst-to-analyst and inter-day repeatability of the results were used to assess how robust the procedure was. The suggested MW-FLR approach is robust and reproducible, as evidenced by the RSD values for the analysis of capsules and plasma samples not exceeding 2.8 and 5.6%, respectively.
3.4. Comparison of the Proposed MW-FLR Method with Reference Methods
To compare the proposed MW-FLR with pre-validated reference methods, samples from copiktra capsules having varying DUV concentrations (100–800 ng/mL) and plasma samples spiked with the same concentrations of DUV were analyzed by the proposed MW-FLR method and reference methods. The reference methods were microwell-spectrophotometric assay (MW-SPA) [17] and HPLC with fluorescence detection (HPLC-FD) [21] for analysis of copiktra capsules and plasma samples, respectively. The values obtained by both MW-FLR, and reference methods were correlated very well with each other (Figure 7). The regression analysis of the results showed a good agreement between the results obtained by the two methods, as evident from the obtained good correlation coefficients (Figure 7). This indicated the validity of the proposed MW-FLR for the accurate determination of DUV in copiktra capsules and plasma samples.
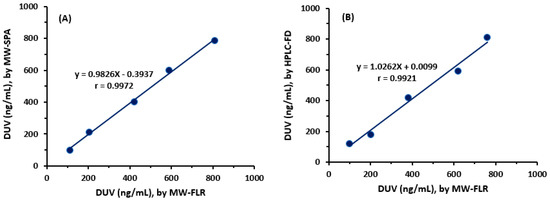
Figure 7.
Correlations between the nominated concentrations of DUV taken from copiktra capsules (A) and spiked in plasma samples (B) measured by the proposed MW-FLR method with those measured by reference methods. The reference methods were microwell-spectrophotometric assay (MW-SPA) and high-performance liquid chromatography with fluorescence detection (HPLC-FD) for measuring DUV concentrations in copiktra capsules and plasma samples, respectively.
4. Conclusions
This study describes, for the first time, the development and validation of a novel MW-FLR for the determination of DUV in its capsules and plasma samples. The method relied on measuring the native fluorescence of DUV in an aqueous solution. The proposed method offered many advantages such as the simplicity of the procedures, the use of low volumes of samples, short analysis time, high sensitivity, and selectivity. Also, the method did not involve any time-consuming liquid-liquid or solid-phase extraction procedures for the plasma samples or chemical derivatization prior to the analysis. Besides, the proposed method had high throughput which enabled the convenient processing of many samples in quality control and/or clinical laboratories. Furthermore, the method is characterized by its greenness because it uses water as a solvent.
Author Contributions
A.M.A.-H.: Investigation, Visualization, Data curation, Writing—review & editing, H.W.D.; Investigation, Data curation, Formal analysis, A.Y.S.; Investigation, Visualization, Data curation, N.Y.K.; Investigation, Writing—review & editing, R.A.-S.; Resources, Writing—review & editing, I.A.D.; Conceptualization, Methodology, Validation, Formal analysis, Resources, Writing—review & editing, Supervision. All authors have read and agreed to the published version of the manuscript.
Funding
This research was funded by the Researchers Supporting Project, King Saud University, Riyadh, Saudi Arabia, grant number RSP-2021/353.
Institutional Review Board Statement
The study was conducted in accordance with the Declaration of Helsinki, and approved by the Institutional Ethics Committee of King Saud University (protocol code KSU-SE-20-51 on 8 November 2020).
Informed Consent Statement
Not applicable
Data Availability Statement
All data are in the article
Acknowledgments
The authors extend their appreciation to the Researchers Supporting Project, King Saud University, Riyadh, Saudi Arabia for funding this work through grant No. RSP-2021/353.
Conflicts of Interest
The authors declare no conflict of interest.
References
- Canadian Cancer Society. Chronic Lymphocytic Leukemia. Ontario. 2019. Available online: http://www.cancer.ca/en/cancer-information/cancer-type/leukemia-chronic-lymphocytic-cll/chronic-lymphocytic-leukemia/?region=on (accessed on 24 September 2022).
- The American Chemical Society. Key Statistics for Chronic Lymphocytic Leukemia. Washington. 2019. Available online: https://www.cancer.org/cancer/chronic-lymphocytic-leukemia/about/key-statistics.html (accessed on 24 September 2022).
- Kotiah, S.D.; Chronic Lymphocytic Leukemia treatment Protocols. New York; 2019. Available online: https://emedicine.medscape.com/article/2005390-overview (accessed on 24 September 2022).
- Bello, C.; Zhang, L.; Naghashpour, M. Follicular lymphoma: Current management and future directions. Cancer Control 2012, 19, 187–195. [Google Scholar] [CrossRef] [PubMed]
- Clayton, E.; Bardi, G.; Bell, S.E.; Chantry, D.; Downes, C.P.; Gray, A.; Humphries, L.A.; Rawlings, D.; Reynolds, H.; Vigorito, E.; et al. A crucial role for the p110 delta subunit of phosphatidylinositol 3-kinase in B cell development and activation. J. Exp. Med. 2002, 96, 753–763. [Google Scholar] [CrossRef] [PubMed]
- Fung-Leung, W.P. Phosphoinositide 3-kinase delta (PI3Kδ) in leukocyte signaling and function. Cell Signal. 2011, 23, 603–608. [Google Scholar] [CrossRef] [PubMed]
- Peluso, M.; Faia, K.; Winkler, D.; Patel, N.; Brophy, E.; White, K.; Douglas, M.; Stern, H.M.; Palombella, V.; McGovern, K.; et al. Duvelisib (IPI-145) inhibits malignant B-cell proliferation and disrupts signaling from the tumor microenvironment through mechanisms that are dependent on PI3K-δ and PI3K-γ. Blood 2014, 124, 328. [Google Scholar] [CrossRef]
- Hoellenriegel, J.; Meadows, S.A.; Sivina, M.; Wierda, W.G.; Kantarjian, H.; Keating, M.J.; Giese, N.; O’Brien, S.; Yu, A.; Miller, L.L.; et al. The phosphoinositide 30-kinase delta inhibitor, CAL-101, inhibits B-cell receptor signaling and chemokine networks in chronic lymphocytic leukemia. Blood 2011, 118, 3603–3612. [Google Scholar] [CrossRef] [PubMed]
- Okkenhaug, K.; Bilancio, A.; Farjot, G.; Priddle, H.; Sancho, S.; Peskett, E.; Pearce, W.; Meek, S.E.; Salpekar, A.; Waterfield, M.D.; et al. Impaired B and T cell antigen receptor signaling in p110 delta PI 3-kinase mutant mice. Science 2002, 297, 1031–1034. [Google Scholar] [CrossRef]
- Vanhaesebroeck, B.; Guillermet-Guibert, J.; Graupera, M.; Bilanges, B. The emerging mechanisms of isoform-specific PI3K signalling. Nat. Rev. Mol. Cell Biol. 2010, 11, 329–341. [Google Scholar] [CrossRef]
- Faia, K.; White, K.; Proctor, J.; Murphy, E.; Proctor, J.; Pink, M.; Kosmider, N.; McGovern, K.; Kutok, J. The phosphoinositide-3 kinase (PI3K)-δ,γ inhibitor, duvelisib shows preclinical synergy with multiple targeted therapies in hematologic malignancies. PLoS ONE 2018, 13, 1–14. [Google Scholar] [CrossRef]
- Qingshan, Y.; Prexy, M.; Terry, N.; Christophe, Q.; Varsha, G. Idelalisib: First-in-class PI3K delta inhibitor for the treatment of chronic lymphocytic leukemia, small lymphocytic leukemia, and follicular lymphoma. Clin. Cancer Res. 2015, 21, 1537–1542. [Google Scholar]
- Balakrishnan, K.; Peluso, M.; Fu, M.; Rosin, N.Y.; Burger, J.A.; Wierda, W.G.; Keating, M.J.; Faia, K.; O’Brien, S.; Kutok, J.L.; et al. The phosphoinositide-3-kinase (PI3K)-delta and gamma inhibitor, IPI-145 (Duvelisib), overcomes signals from the PI3K/AKT/S6 pathway and promotes apoptosis in CLL. Leukemia 2015, 29, 1811–1822. [Google Scholar] [CrossRef]
- U.S. Food & Drug Administration (FDA). Duvelisib (Copiktra®, Verastem, Inc.) for Adult Patients with Relapsed or Refractory Chronic Lymphocytic Leukemia (CLL) or Small Lymphocytic Lymphoma (SLL). Maryland. 2018. Available online: https://www.fda.gov/Drugs/InformationOnDrugs/ApprovedDrugs/ucm621503.htm (accessed on 24 September 2022).
- Leah, L. Duvelisib Granted Priority Review for R/R CLL/SLL and FL. Cancer Network. 2018. Available online: https://www.cancernetwork.com/view/duvelisib-granted-priority-review-rr-cllsll-and-fl (accessed on 24 September 2022).
- Srujani, C.H.; Annapurna, P.; Nataraj, K.S.; Krishna Manjari Pawar, A. Analytical quality by design approach in RP-HPLC method development and validation for the estimation of duvelisib. Asian J. Pharm. Clin. Res. 2021, 14, 99–108. [Google Scholar]
- Darwish, I.A.; Almehizia, A.A.; Sayed, A.Y.; Khalil, N.Y.; Alzoman, N.Z.; Darwish, H.W. Synthesis, spectroscopic and computational studies on hydrogen bonded charge transfer complex of duvelisib with chloranilic acid: Application to development of novel 96-microwell spectrophotometric assay. Spectrochim. Acta A 2022, 264, 120287. [Google Scholar] [CrossRef] [PubMed]
- Siddesh, A.; Sriram, D.; Zakkula, A.; Kumar, R.; Dittakavi, S.; Zainuddin, M.; Trivedi, R.K.; Mullangi, R. Validated HPLC-UV method for simultaneous quantification of phosphatidylinositol 3-kinase inhibitors, copanlisib, duvelisib and idelalisib, in rat plasma: Application to a pharmacokinetic study in rats. Biomed. Chromtogr. 2020, 35, e5015. [Google Scholar] [CrossRef] [PubMed]
- Nigade, P.B.; Gundu, J.; Pai, K.S.; Nemmani, K.V.S. Prediction of tissue-to-plasma ratios of basic compounds in mice. Eur. J. Drug Metab. Pharmacokinet. 2017, 42, 835–847. [Google Scholar] [CrossRef] [PubMed]
- Shao, Y.; Xie, S.; Zhu, H.; Du, X.; Xu, R. Development of a novel and quick LCMS/MS method for the pharmacokinetic analysis of duvelisib in beagle dogs. J. Pharm. Biomed. Anal. 2020, 187, 113355. [Google Scholar] [CrossRef]
- Sayed, A.Y.; Khalil, N.Y.; Almomen, A.; Alzoman, N.Z.; Almehizia, A.A.; Darwish, I.A. A highly sensitive nonextraction-assisted HPLC method with fluorescence detection for quantification of duvelisib in plasma samples and its application to pharmacokinetic study in rats. Drug Des. Dev. Ther. 2021, 15, 2667–2677. [Google Scholar] [CrossRef]
- Bose, A.; Thomas, I.; Kavitha, G.; Abraham, E. Fluorescence spectroscopy and its applications: A Review. Int. J. Adv. Pharm. Res. 2018, 8, 1–8. [Google Scholar]
- Ali, M.F.B.; Atia, N.N. Sensitive spectrofluorimetric methods for determination of sitagliptin phosphate, dipeptidyl peptidase-4 inhibitor, in pharmaceutical tablets and spiked human urine. Curr. Pharm. Anal. 2018, 14, 483–490. [Google Scholar]
- Syamittra, B.; Parasuraman, S.; Yeng, W.Y.; Ping, W.Y.; Thujithra, J.; Kumar, J.; Dhanaraj, S.A. A Review on adverse health effects of laboratory volatile solvents. Int. J. Clin. Ther. Diagn. 2014, 2, 59–63. [Google Scholar]
- Khalil, N.Y.; Darwish, I.A.; Alanazi, M.; Hamidaddin, M.A. Development of 96-microwell plate assay with fluorescence reader and HPLC method with fluorescence detection for high-throughput analysis of linifanib in its bulk and dosage forms. Curr. Pharm. Anal. 2021, 17, 1–8. [Google Scholar] [CrossRef]
- Trivedi, J.; Variya, B.; Gandhi, H.; Rathod, S.P. Spectrofluorimetric method for estimation of curcumin in rat blood plasma: Development and validation. J. Appl. Spectrosc. 2016, 82, 980–984. [Google Scholar] [CrossRef]
- Abdel-Gawad, S.A.; Alamri, M.A. Solid-phase extraction and validated spectrofluorimetric quantification of pamidronate in human plasma. Trop. J. Pharm. Res. 2020, 19, 2651–2657. [Google Scholar] [CrossRef]
- Darwish, H.W.; Bakheit, A.H.; Darwish, I.A. Enhanced spectrofluorimetric determination of the multitargeted tyrosine kinase inhibitor, crizotinib, in human plasma via micelle-mediated approach. Trop. J. Pharm. Res. 2016, 15, 2209–2217. [Google Scholar] [CrossRef]
- Ibrahim, F.A.; El-Brashy, A.M.; El-Awady, M.I.; Abdallah, N.A. Development of a validated spectrofluorimetric method for assay of sotalol hydrochloride in tablets and human plasma: Application for stability-indicating studies. Open Chem. 2019, 17, 64–74. [Google Scholar] [CrossRef]
- Skoog, D.A.; West, D.M.; Holler, F.J.; Crouch, S.R. Fundamentals of Analytical Chemistry, 9th ed.; Brooks/Cole Cengage Learning: Boston, MA, USA, 2014. [Google Scholar]
- Groeneveld, M.; Catalán, N.; Einarsdottir, K.; Bravo, A.G.; Kothawala, D.N. The influence of pH on dissolved organic matter fluorescence in inland waters. Anal. Methods 2022, 14, 1351–1360. [Google Scholar] [CrossRef]
- ICH. International Council for Harmonisation of Technical Requirements for Pharmaceuticals for Human Use, ICH Harmonised Guideline, Validation of Analytical Procedure: Q2(R2); ICH: Geneva, Switzerland, 2022. [Google Scholar]
- Flinn, I.W.; O’Brien, S.; Kahl, B.; Patel, M.; Oki, Y.; Foss, F.F.; Porcu, P.; Jones, J.; Burger, J.A.; Jain, N.; et al. Duvelisib, a novel oral dual inhibitor of PI3K-δ,γ, is clinically active in advanced hematologic malignancies. Blood 2018, 131, 877–887. [Google Scholar] [CrossRef]
Publisher’s Note: MDPI stays neutral with regard to jurisdictional claims in published maps and institutional affiliations. |
© 2022 by the authors. Licensee MDPI, Basel, Switzerland. This article is an open access article distributed under the terms and conditions of the Creative Commons Attribution (CC BY) license (https://creativecommons.org/licenses/by/4.0/).