Abstract
The hand-transmitted vibration generated by extravehicular activity (EVA) power tools has an important impact on the health of astronauts and the efficient completion of maintenance tasks when astronauts use EVA power tools for on-orbit maintenance. Based on the hand-transmitted vibration zero-gravity simulation test platform to measure the vibration response of the EVA power tool to human hands. Given the influence of the length of the operating rod and the number of non-detaching fastening devices on daily vibration exposure when astronauts wear extravehicular spacesuit gloves, a second-order polynomial model and a quadratic cumulative nonlinear model of daily vibration exposure are established. The experimental results show that the second-order polynomial model is more explanatory and predictive of the test data in the scope of the test. The R-values of the palm and opisthenar prediction model are 0.9930 and 0.9940 respectively, and the RMSEs are m/s2 and m/s2. The quadratic cumulative nonlinear model can accurately predict the vibration exposure of the hand outside the scope of the test. This study can provide theoretical reference and data support for the prediction of vibration exposure generated by astronauts using the EVA power tools during on-orbit maintenance.
1. Introduction
Hand-transmitted vibration refers to the mechanical vibration or shock directly acting on or transmitted to the human arm when using handheld vibration tools or contacting vibrating workpieces in production. When astronauts carry out extravehicular activities, the hand-transmitted vibration of EVA power tools can easily cause astronauts to feel uncomfortable or even tired [1]. Coupled with the joint actions of many factors, such as low orbit zero-gravity [2], thermal circulation [3,4], extravehicular spacesuit [5,6,7], and so on, the muscle movement ability and fine operation ability of astronauts are decreased in varying degrees, which will threaten the health of astronauts and affect the successful implementation of maintenance missions. At present, it is difficult to simulate and verify the measurement conditions of hand-transmitted vibration of EVA power tools. Based on the hand-transmitted vibration test, the theoretical prediction model research is carried out to accurately obtain the vibration exposure of EVA power tools. It is of great significance to guide the frequency of manned on-orbit maintenance missions and to predict the maximum workload of astronauts [8,9].
At present, the research on the prediction model of hand-transmitted vibration of many scholars is focused on the biomechanical model, mostly based on the simplified physical model to establish the dynamic equation of hand-transmitted vibration for parameter identification to predict the vibration transmissibility or acceleration magnitude. Dong et al. [10,11,12,13] studied the four-degree-of-freedom model and five-degree-of-freedom model of the arm system based on two-point coupling, which are used to predict the vibration power absorption (VPA) and distribution of the arm substructure. Sabu et al. [14] used the curved arm six-degree-of-freedom model to predict the vibration transmissibility of bare hands, air bladder gloves, and gel-filled gloves. Adewusi et al. [15] estimated VPAs using biomechanical models of the hand-arm system derived from both the driving-point mechanical impedance and distributed vibration transmissibility. Chadefaux et al. [16] proposed a seven-degree-of-freedom model of the foot-ankle system to predict the dynamic response of the vibration transmitted to the foot in a specific frequency range. At the same time, some scholars use the method of establishing a finite element model of the arm system to study hand-transmitted vibration. Wang et al. [17] proposed a hybrid hand-arm finite element model considering bone, soft tissue, and connective tissue to predict the vibration of the forklift steering wheel to the hand when different grasping forces are applied. Wu et al. [18] developed a hybrid finger model based on the traditional finite element model, multi-body musculoskeletal model, and lumped parameter model to predict the local vibration behavior of fingers. Wu et al. [19] developed a hybrid finite element hand-gripping model that combines the features of conventional finite element models and multi-body dynamic models to simulate hand-gripping on a cylindrical handle with covering materials of different softness levels. In the actual operation of power tools, vibration exposure, as a physical quantity that can more directly reflect the impact of hand-transmitted vibration on human health, has not been reported at present.
On-orbit replacement unit (ORU) is a modular component applied to the space station or large and medium-sized spacecraft in orbit. When ORU reaches its design life or fails, astronauts mainly use EVA power tools to replace it in orbit, to complete the update and maintenance of spacecraft components. Aiming at the on-orbit maintenance method of the Chinese space station, which is mainly based on the on-orbit replacement of the ORU and supplemented by the internal maintenance of the ORU. Beijing Institute of Spacecraft Environment Engineering has developed a pistol power tool (PPT). At the same time, to meet the refined maintenance requirements of different working conditions, various configurations and lengths of operating rods have been developed based on the PPT tool. The detection of the hand-transmitted vibration exposure of the PPT tool requires a ground simulation test device, and the test process is complicated. To ensure that the vibration exposure generated by the PPT tool during the on-orbit maintenance process meets the requirements and ensures the safety of the astronauts during the actual on-orbit maintenance. By developing a hand-transmitted vibration prediction model based on different operating rod lengths and the number of operating non-detaching fastening devices to replace the test measurement, it has important theoretical significance for predicting the vibration exposure generated by the PPT tool. In this paper, the measurement and evaluation method of hand-transmitted vibration in ISO 5349:2001 is used, and the total vibration value and daily vibration exposure are used as evaluation indicators. A hand-transmitted vibration zero-gravity simulation test platform is built, and the hand-transmitted vibration prediction model of the PPT tool is established by nonlinear fitting and polynomial fitting.
2. Hand-Transmitted Vibration Test
2.1. Test Equipment and Procedures
A hand-transmitted vibration zero-gravity simulation test platform is built, which is integrated by the PPT on-orbit ground simulator and the vibration testing device, including a gravity balancer, a support group frame, non-detaching fastening devices (which is a kind of anti-drift screw especially suitable for on-orbit maintenance), an extravehicular spacesuit glove, triaxial accelerometers, a multi-channel data collector and so on. The M5 non-detaching fastening devices are installed on the support group frame to simulate the on-orbit maintenance state, and the PPT tool simulates the on-orbit zero-gravity state through the gravity balancer. According to the requirements of on-orbit maintenance, the operating rod is divided into three lengths: 200 mm, 300 mm, and 400 mm. Three subjects successively use the PPT tool equipped with various lengths of operation rods to tighten and loosen the non-detaching fastening devices, while wearing the extravehicular spacesuit glove. Three subjects carry out tests under six working conditions, each of which included 70 groups of tests, as shown in Table 1. At the end of each test, the subjects take a 30-min break before continuing with the next set of tests.

Table 1.
Six working conditions of the test.
2.2. Biomechanical Coordinate System
The biomechanical coordinate system for vibration measurement refers to ISO 5349-1:2001 (mechanical vibration–measurement and evaluation of human exposure to hand-transmitted vibration—Part 1: general requirements), which includes the location and orientation of the biomechanical coordinate system, the installation, and use of sensors, and the recommended weighting factor, etc. The origin is defined as the distal end of the third metacarpal bone, and the longitudinal axis of the third metacarpal bone is the -axis, which points to the distal end of the fingers of the unfold palm. The -axis crosses the origin, parallels the axis of the PPT tool handle, and points to the thumb direction. The -axis is defined as perpendicular to the palm through the origin, from the hand to the handle direction.
2.3. Vibration Measurement
In the course of the test, the indoor temperature is kept at 20∼25 °C and the humidity is controlled at 40∼60%. The test is carried out under atmospheric pressure. The right hands of the subjects wear extravehicular spacesuit gloves and grasp the tool handle. The palm of the glove is attached to the side of the handle, and the sensor is closely attached to the palm and opisthenar inside the glove. In addition, ensure that the three measurement directions of each sensor correspond to the -axis, -axis, and -axis corresponding to the biodynamic coordinate system one by one. The forearm of the right hand is parallel to the direction of the operating rod, the elbow has no contact with the body, and the angle of the forearm and upper arm is controlled between 90°∼120°, as shown in Figure 1. The subjects press the switch of the tool to rotate the operating rod to complete the corresponding tightening and loosening operations. To reduce the influence of operating posture and environmental changes, the tests of each working condition are completed continuously at one time.
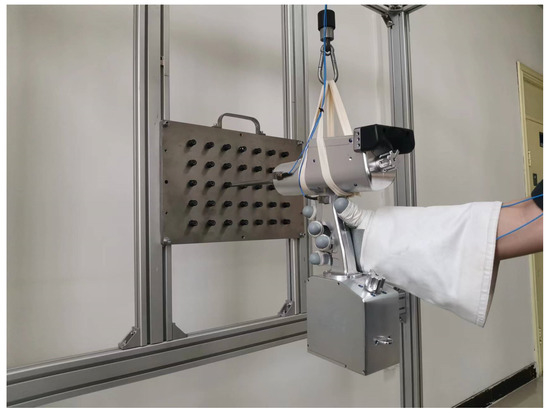
Figure 1.
Use the PPT tool to tighten and loosen the non-detaching fastening devices on the hand-transmitted vibration zero-gravity simulation test platform.
2.4. Data Acquisition
PCB356A16 three-axis accelerometers (produced by PCB Piezotronics, Inc., Depew, NY, USA) are used to obtain the 1/3 octave frequency–unweighted acceleration value of the tool, palm, and opisthenar in the range of 1∼ 1250 Hz on the -axis, -axis, and -axis. The acceleration signals are transmitted to the SCADAS XS data acquisition system (produced by SIEMENS AG, Munich, Germany) and filtered by the weighted method recommended in ISO 5349-1:2001. Then the test data are imported into the computer for data analysis and processing.
3. Test Results
3.1. Influence of the Type of Operating Rod on the Vibration Total Value
The amplitude of acceleration is used to characterize the vibration intensity produced by the PPT tool. Because the response of human hand-transmitted vibration varies greatly in different frequency ranges, the frequency-weighted rms acceleration values are used to describe the human body’s perception of vibration intensity. Its calculation is shown in Equation (1):
where is the frequency-weighted rms single-axis acceleration value (m/s2); and is the weighting factor for the i-th one-third-octave band ( comes from in Appendix A of ISO 5349-1:2001); is the rms acceleration measured in the i-th one-third-octave band (m/s2).
The total vibration of the measuring point on the -axis, -axis, and -axis is expressed by the vibration total value. Its calculation is shown in Equation (2):
where is the vibration total value of frequency-weighted rms acceleration (m/s2); , , and are the frequency-weighted rms single-axis acceleration values in the three axes, respectively (m/s2).
The vibration of the PPT tool comes from the motor and the reducer assembly. On the one hand, the vibration is transmitted from the operating rod to the maintenance equipment. On the other hand, it is transmitted to the handle through the shell, which produces forced vibration to the arm system. The relationship between the length of the operating rod and the vibration total value generated by hand-transmitted vibration is shown in Figure 2. The average vibration total value of tightening and loosening at the opisthenar is greater than that at the palm. Moreover, the maximum m/s2 is produced at the opisthenar using the 300 mm operating rod.
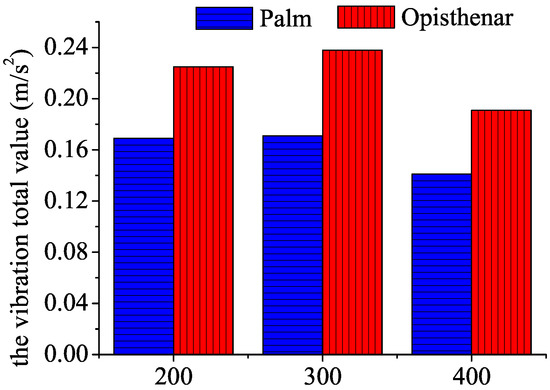
Figure 2.
Comparison of the vibration total value generated by different types of operating rods.
3.2. Influence of the Type of Operating Rod on the Vibration Exposure
The amount of vibration exposure is the comprehensive effect of the vibration total value and exposure time. The daily vibration exposure is used to compare the vibration exposure at different durations, and the composite state is used to express the whole process of tightening and loosening. Assuming that the non-detaching fastening device is tightened and loosened for t and s times respectively, the daily vibration exposure in the composite state is shown in Equation (3):
where is the vibration total value for the c-th operation (m/s2); and is the reference time 28,800 s; and is the duration of the c-th operation (s).
The relationship between the length of the operating rod and the vibration exposure caused by hand-transmitted vibration is shown in Figure 3. The maximum m/s2 of daily vibration exposure in the composite state is generated at the opisthenar using the 300 mm operating rod. The average time of 200 mm, 300 mm, and 400 mm operating rod in the composite state is s, s, and s, respectively. Under the condition of little difference in exposure time, the greater the vibration total value will lead to greater vibration exposure. So the subjects using the 300 mm operating rod bear 2.20% and 25.03% more daily vibration exposure than the 200 mm and 400 mm operating rod, respectively.
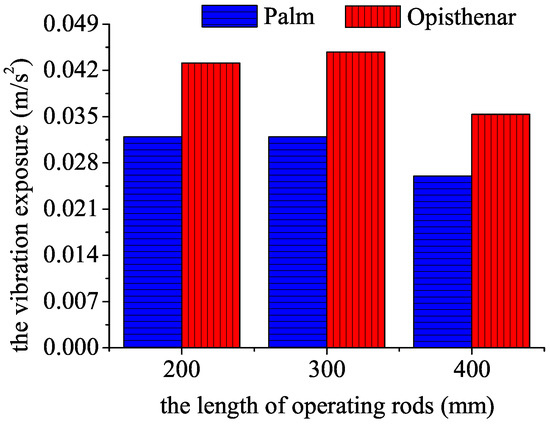
Figure 3.
Comparison of the vibration exposure generated by different types of operating rods.
4. Hand-Transmitted Vibration Prediction Model
4.1. Prediction Model Establishment
The vibration exposure time of the subjects operating the PPT tool increased with the increase in the number of the non-detaching fastening device. Taking the 300 mm operating rod as an example, after drawing the scatter diagram of the test data, it is found that the vibration exposure increases monotonously with the number of the non-detaching fastening device, and the vibration exposure of the palm and opisthenar tends to increase gradually, as shown in Figure 4.
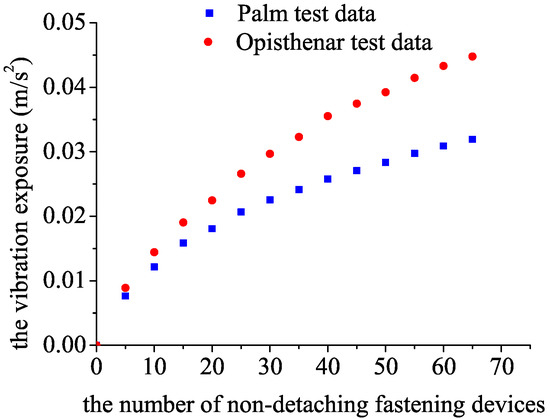
Figure 4.
Scatter plot of test data for the variation of the vibration exposure with the number of the non-detaching fastening device.
To predict the vibration exposure produced by different types of operating rods, the length of the operating rod and the number of the non-detaching fastening device are considered independent variables to characterize the vibration exposure. The test data are processed by nonlinear and polynomial fitting.
In the polynomial model, it is assumed that the influence of the length of the operating rod L and the number of the non-detaching fastening device n on the vibration exposure is nonlinear. The mathematical model is composed of three parts, the influence of constant term, the influence of the change of each variable, and the influence of the combination of each variable. Therefore, the polynomial full model can be expressed as Equation (4):
where is the predicted vibration exposure after the k-th operation (m/s2); and , , , are constant terms to be solved; and N, M are positive integers, representing the highest order of n and L in the combined variable , respectively; and is the cumulative number of the non-detaching fastening device after the k-th operation; is the length of the operating rod used in the k-th operation.
According to the maximum likelihood principle, data fitting is a process of minimizing the sum of squares of residuals. To obtain the optimal fitting condition, the objective function should be minimized. Its calculation is shown in Equation (5):
where K is the number of tests, and is the actual vibration exposure of the hand after the k-th operation.
Make the partial derivative of the objective function equal to zero, as shown in Equation (6):
The parameter matrix is expressed as Equation (7):
The constant coefficient matrix is expressed as Equation (8):
The relationship between the parameter matrix, the constant coefficient matrix, and the vibration exposure is shown in Equation (9):
The calculation of the constant coefficient matrix is shown in Equation (10):
When the highest order of the independent variable is greater than 5, the Runge phenomenon of the polynomial difference will occur when the polynomial is used for surface fitting, i.e., the error at the edge of the interpolation interval is large, so the ideal fitting effect cannot be achieved. Therefore, only is considered [20]. The coefficient of determination (R-square) and root mean square error (RMSE) are used as indicators to evaluate the goodness-of-fit, and the fitting results of the polynomial model of the opisthenar are shown in Table 2.

Table 2.
Goodness-of-fit for polynomial models of different orders.
The eigenvalue determination method is used to test the multicollinearity among the independent variables of the model. It is found that the maximum condition number is much higher than 100 when , and there is serious multicollinearity among the independent variables. The results show that the fitting accuracy of the complex model is very high, but the generalization performance becomes worse and the prediction effect decreases due to the over-fitting phenomenon of higher order. It is found that the model deviates from the real situation by drawing the images of each order with . Therefore, it is considered to establish a second-order polynomial model for .
In the nonlinear model, it is assumed that the influence of the length of the operating rod L and the number of the non-detaching fastening device n on the vibration exposure is equal and the combined influence of the independent variables is in a power form. The mathematical model consists of three parts, the influence of constant term, the influence of the change of each variable, and the influence of the combination of each variable. Therefore, the nonlinear full model can be expressed as Equation (11):
where , , , , , , and are the constant terms to be solved, and the cumulative term , where the maximum number of cumulative terms 5 indicates that the overdetermined problem condition that the number of parameters to be solved is less than the number of tests is satisfied.
Similarly, the constant coefficient matrix is obtained by minimizing , and the fitting results of the nonlinear model on the opisthenar are shown in Table 3.

Table 3.
Goodness-of-fit of nonlinear models with different cumulative terms.
According to the result of goodness-of-fit and the image of each cumulative term model, the quadratic cumulative nonlinear model is established by using .
The nonlinear and polynomial vibration exposure parametric equations can be expressed as Equations (12) and (13):
where and are the vibration exposure of the nonlinear model and the vibration exposure of the polynomial model, respectively.
The constant coefficients are shown in Table 4.

Table 4.
The parameters of the two models.
The coefficient of determination and root mean square error of the two models are shown in Table 5.

Table 5.
R-square and RMSE of two models.
The two models are drawn as shown in Figure 5. According to the goodness-of-fit, the second-order polynomial model is more consistent with the test results in the scope of the test (, , L and ), and has better interpretability for the test data. Vibration exposure can be accurately predicted for different operating rod lengths and the number of the non-detaching fastening device in the scope of the test. For example, the maximum vibration exposure of the palm and the opisthenar is 0.03322 m/s and 0.04574 m/s, respectively, which occurs when 70 non-detaching fastening devices are tightened and loosened using the 240 mm and 249 mm operating rods. After the second partial differential derivation of the polynomial model, there is a global maximum point at , , and , for the palm and opisthenar polynomial models, respectively. Since the extreme point is close to the scope of the test, although the second-order polynomial model can better explain the test data in the scope of the test, when the length of the operating rod and the number of the non-detaching fastening device exceed the scope of the test, the vibration exposure predicted by this model will decrease drastically.
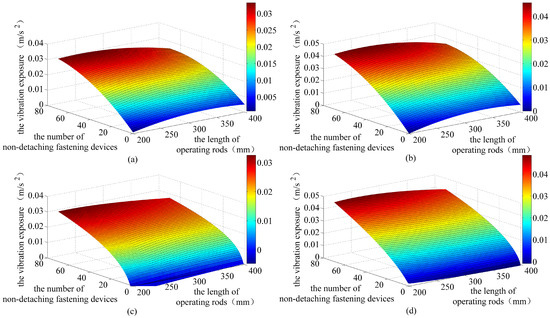
Figure 5.
Comparison of prediction models for the vibration exposure as a function of the length of the operating rod and the number of the non-detaching fastening device: (a) Palm polynomial model; (b) Opisthenar polynomial model; (c) Palm nonlinear model; (d) Opisthenar nonlinear model.
4.2. Test Verification
To verify the applicability of the quadratic cumulative nonlinear model outside the scope of the test, a verification test is completed for the following four working conditions. Condition 7 and Condition 8: 70 sets of tightening and loosening operations are performed using a PPT tool equipped with a 600 mm operating rod. Condition 9 and Condition 10: 120 sets of tightening and loosening operations are performed using a PPT tool equipped with a 400 mm operating rod.
Figure 6 shows 70 sets of vibration exposure test data and predicted values of the nonlinear model using a 600 mm operating rod. It can be seen that the palm nonlinear model is in good agreement with the test data (R-square = 0.9720), but the predictive ability of the opisthenar nonlinear model is not high (R-square = 0.8486). Before the cumulative operation of 55 non-detaching fastening devices, the vibration exposure predicted by this model is larger than the actual value.
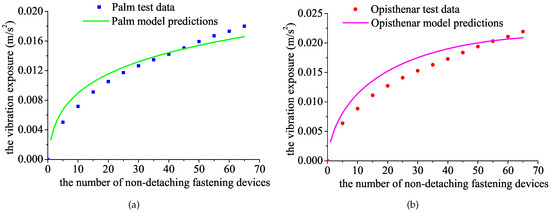
Figure 6.
Comparison between the test data of vibration exposure using the 600 mm operating rod and the results of the nonlinear prediction model: (a) Palm; (b) Opisthenar.
Figure 7 shows 120 sets of vibration exposure test data and predicted values of the nonlinear model using a 400 mm operating rod. It can be seen that the consistency between the palm nonlinear model and the test data is very high (R-square = 0.9988), but the prediction ability of the opisthenar nonlinear model is not high (R-square = 0.9496). After the cumulative operation of 35 non-detaching fastening devices, the vibration exposure predicted by this model is larger than the actual value.
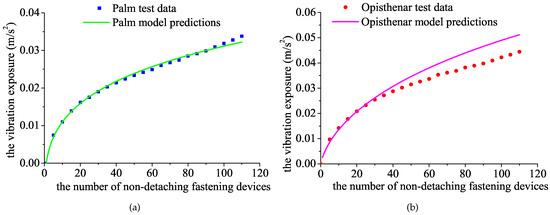
Figure 7.
Comparison between the test data of vibration exposure using the 400 mm operating rod and the results of the nonlinear prediction model: (a) Palm; (b) Opisthenar.
5. Discussion
5.1. Prediction Model Analysis
Both the polynomial and nonlinear models are fitted by the nonlinear least-square method. According to the goodness-of-fit results and the images of the prediction model, the second-order polynomial model can better explain the discrete test data. The prediction of other working conditions in the scope of the test is higher, and the vibration exposure can be predicted more accurately. However, due to the influence of the extreme point, the applicability of the model outside the scope of the test is poor. Although some high-order polynomial models can obtain better goodness-of-fit index in the scope of the test, the Runge phenomenon occurs when the high-order polynomial fitting is used, and it is difficult for high-order complex models to achieve ideal fitting results.
The quadratic cumulative nonlinear model has the best fitting results in different cumulative terms, and it can also predict the vibration exposure in the scope of the test, but compared with the above second-order polynomial model, its predictability and explanation are slightly worse. The test results show that outside the scope of the test, the nonlinear model has certain applicability for the prediction of vibration exposure. However, it should be noted that when the length of the operating rod and the number of the non-detaching fastening device further increase, the deviation of vibration exposure predicted by the model tends to increase.
5.2. Application of Prediction Model
The scope of the test used in this paper covers a variety of typical working conditions of on-orbit maintenance of the Chinese space station. When predicting the vibration exposure of the PPT tool, the vibration exposure is obtained by inputting the length of the operating rod and the number of the non-detaching fastening device. When astronauts use PPT tools to carry out a specific on-orbit maintenance mission, the astronauts will select the appropriate category from the serialized operating rods and operate a certain number of non-detaching fastening devices according to the requirements of the maintenance mission. Therefore, the length of the operating rod and the number of the non-detaching fastening device can be taken as the input of the model, and the second-order polynomial model or the quadratic cumulative nonlinear model can be selected according to the above operating conditions. the possible vibration exposure of the astronaut’s hand is calculated by the prediction model. According to the predicted vibration exposure, guide the maintenance mission procedures, work rhythm control, and work sequence planning of the astronauts.
The prediction model can also quickly predict the hand-transmitted vibration exposure produced by the PPT tool when the operating rod of other length specifications is equipped. Moreover, the theoretical model prediction is used to replace the complex ground simulation test to provide a more accurate vibration exposure prediction for the application of the new operating rod.
For the scheme iteration and optimal design of the new generation of handheld EVA power tools, the prediction model can provide a set of rapid prediction methods of hand-transmitted vibration exposure based on the comparison of existing test data. Moreover, it could provide some technical references for developing and using new tools.
6. Prospect
The PPT on-orbit ground simulator used in the test may cause some errors in the zero-gravity simulation and glove pressure difference simulation. The gravity balancer overcomes the gravity of the PPT tool in the direction of the -axis, but there is still rolling friction resistance in the horizontal direction. Compared with the smaller flexibility and larger stiffness of the pressurized spacesuit gloves, the unpressurized spacesuit gloves may weaken the vibration, and the measured results may be smaller than the actual vibration exposure. In the follow-up, the fine simulation of pressurized gloves on-orbit will be further optimized.
At present, there is a lack of research data on the maximum vibration exposure limits that astronauts can bear and the cumulative exposure limits of hand-transmitted vibration over a long-time span in the field of on-orbit maintenance, and the evaluation criteria and system of hand-transmitted vibration in orbit are not perfect. For the special operating conditions of astronauts during on-orbit maintenance, in addition to accurately predicting the vibration exposure, their exposure limits should also be re-evaluated to adapt to more stringent working conditions.
7. Conclusions
In this paper, the vibration exposure was used to characterize the harm of hand-transmitted vibration to astronauts, and the hand-transmitted vibration zero-gravity simulation test platform was built to effectively simulate the vibration response of the EVA power tool to astronauts’ hands. The prediction model of the hand-transmitted vibration was established by taking the length of the operating rod and the number of the non-detaching fastening device as variables.
The results show that the second-order polynomial model can accurately predict the vibration exposure in the scope of the test, but its predictability outside the scope of the test is poor; compared with the second-order polynomial model, the quadratic cumulative nonlinear model is slightly less predictive and explanatory to the vibration exposure in the scope of the test, but outside the scope of the test, the prediction of the model is better.
The two models can be used as hand-transmitted vibration prediction models for the PPT tool. On the one hand, it can be used to predict the hand-transmitted vibration exposure of the existing tool when performing on-orbit maintenance tasks. On the other hand, it can be used to estimate the hand-transmitted vibration exposure when the PPT tool is equipped with a new operating rod. It could provide technical means and data support for astronauts’ hand-transmitted vibration exposure prediction and risk assessment.
Author Contributions
Conceptualization, H.F. and Y.Y.; methodology, Y.C. and M.J.; software, Y.C. and Y.Y.; validation, H.F., Y.C. and Y.Y.; formal analysis, H.F. and M.J.; investigation, Y.Y.; resources, H.F.; data curation, Y.Y.; writing—original draft preparation, Y.C.; writing—review and editing, Y.C. and M.J.; visualization, Y.Y.; supervision, H.F.; project administration, H.F.; funding acquisition, H.F. All authors have read and agreed to the published version of the manuscript.
Funding
Project supported by the CAST Science Foundation for Distinguished Young Scholars of China (grant no. R-WY-JQRC-19).
Institutional Review Board Statement
Not applicable.
Informed Consent Statement
Not applicable.
Data Availability Statement
Not applicable.
Conflicts of Interest
The authors declared no potential conflict of interest with respect to the research, authorship, and/or publication of this article.
References
- Fu, H.; Jin, M.H.; Yu, Y.; Chen, Y.; Zheng, P. Experimental study on the response of hand-transmitted vibration from an EVA power tool. Machines 2022, 10, 307. [Google Scholar] [CrossRef]
- Fitts, R.H.; Riley, D.R.; Widrick, J.J. Physiology of a microgravity environment invited review: Microgravity and skeletal muscle. J. Appl. Physiol. 1985, 89, 823–839. [Google Scholar] [CrossRef] [PubMed]
- Loewenthal, S.; Allmon, C.; Reznik, C.; McFatter, J.; Davis, R.E. Space station solar array joint repair. Mater. Perform. Charact. 2015, 4, 200–208. [Google Scholar] [CrossRef]
- Shayler, D.J.; Harland, D.M. Enhancing Hubble’s Vision; Springer: Cham, Switzerland, 2016. [Google Scholar]
- O’Hara, J.; Briganti, M.; Cleland, J.; Winfield, D. Extravehicular Activities Limitations Study. Volume: Establishment of Physiological and Performance Criteria for EVA Gloves; NASA: Bethpage, NY, USA, 1988.
- Tian, Y.S.; Zhang, H.B.; Wang, L.; Ding, L.; Li, D.Y. Effects of EVA glove on hand dexterity at low temperature and low pressure. Appl. Ergon. 2018, 70, 98–103. [Google Scholar] [CrossRef] [PubMed]
- Abramov, I.P.; Pozdnyakov, S.S.; Severin, G.I.; Stoklitsky, A.Y. Main problems of the Russian Orlan-M space suit utilization for EVAs on the ISS. Acta Astronaut. 2001, 48, 265–273. [Google Scholar] [CrossRef]
- Hansen, C.; Cassidy, C. Mishap Investigation Board Summary of Extravehicular Activity 23: Lessons Learned from a Spacewalk Close Call. J. Space Saf. Eng. 2014, 1, 32–39. [Google Scholar] [CrossRef]
- Ade, C.J.; Broxterman, R.M.; Craig, J.C.; Schlup, S.J.; Wilcox, S.L.; Barstow, T.J. Relationship between simulated extravehicular activity tasks and measurements of physical performance. Respir. Physiol. Neurobiol. 2014, 203, 19–27. [Google Scholar] [CrossRef] [PubMed]
- Dong, R.G.; Welcome, D.E.; McDowell, T.W.; Wu, J.Z. Biodynamic response of human fingers in a power grip subjected to a random vibration. J. Biomech. Eng. 2004, 126, 447–457. [Google Scholar] [CrossRef] [PubMed]
- Dong, R.G.; Dong, J.H.; Wu, J.Z.; Rakheja, S. Modeling of biodynamic responses distributed at the fingers and the palm of the human hand-arm system. J. Biomech. 2007, 40, 2335–2340. [Google Scholar] [CrossRef]
- Dong, R.G.; Welcome, D.E.; McDowell, T.W.; Wu, J.Z. Methods for deriving a representative biodynamic response of the hand-arm system to vibration. J. Sound Vib. 2009, 325, 1047–1061. [Google Scholar] [CrossRef]
- Dong, R.G.; Welcome, D.E.; McDowell, T.W.; Wu, J.Z. Modeling of the biodynamic responses distributed at the fingers and palm of the hand in three orthogonal directions. J. Sound Vib. 2013, 332, 1125–1140. [Google Scholar] [CrossRef] [PubMed]
- Sabu, S.; Teja, K.V.S.R.; Mohan, S.; George, N.; Sivapirakasam, S.P. A biomechanical model to predict hand-arm vibration when using different vibration damping gloves. Mater. Today Proc. 2022, 56, 3527–3533. [Google Scholar] [CrossRef]
- Adewusi, S.; Rakheja, S.; Marcotte, P.; Thomas, M. Distributed vibration power absorption of the human hand-arm system in different postures coupled with vibrating handle and power tools. Int. J. Ind. Ergon. 2013, 43, 363–374. [Google Scholar] [CrossRef]
- Chadefaux, D.; Goggins, K.; Cazzaniga, C.; Marzaroli, P.; Marelli, S.; Katz, R.; Eger, T.; Tarabini, M. Development of a two-dimensional dynamic model of the foot-ankle system exposed to vibration. J. Biomech. 2020, 99, 109547. [Google Scholar] [CrossRef] [PubMed]
- Wang, Z.M.; Qiu, Y.; Zheng, X.; Hao, Z.Y.; Liu, C. Biomechanical models of the hand-arm system to predict the hand gripping forces and transmitted vibration. Int. J. Ind. Ergon. 2022, 88, 103258. [Google Scholar] [CrossRef]
- Wu, J.Z.; Welcome, D.E.; McDowell, T.W.; Xu, X.Y.S.; Dong, R.G. Modeling of the interaction between grip force and vibration transmissibility of a finger. Med. Eng. Phys. 2017, 45, 61–70. [Google Scholar] [CrossRef] [PubMed]
- Wu, J.Z.; Dong, R.G.; Warren, C.M.; Welcome, D.E.; McDowell, T.W. Analysis of the effects of surface stiffness on the contact interaction between a finger and a cylindrical handle using a three-dimensional hybrid model. Med. Eng. Phys. 2014, 36, 831–841. [Google Scholar] [CrossRef] [PubMed]
- Sergi, P.N.; De la Oliva, N.; del Valle, J.; Navarro, X.; Micera, S. Physically consistent scar tissue dynamics from scattered set of data: A novel computational approach to avoid the onset of the Runge phenomenon. Appl. Sci. 2021, 11, 8568. [Google Scholar] [CrossRef]
Publisher’s Note: MDPI stays neutral with regard to jurisdictional claims in published maps and institutional affiliations. |
© 2022 by the authors. Licensee MDPI, Basel, Switzerland. This article is an open access article distributed under the terms and conditions of the Creative Commons Attribution (CC BY) license (https://creativecommons.org/licenses/by/4.0/).