Article

Experimental and Numerical Investigations of Dynamic Failure Mechanisms of Underground Roadway Induced by Incident Stress Wave

1
Key Laboratory of Deep Coal Resource Mining, Ministry of Education, School of Mines, China University of Mining and Technology, Xuzhou 221116, China
2
Xuzhou Jinbo Safety and Technology Co., Ltd., Xuzhou 221116, China
3
Centre of Rockburst Prevention Research, Shandong Energy Group Co., Ltd., Jinan 250014, China
*
Author to whom correspondence should be addressed.
Appl. Sci. 2022, 12(20), 10350; https://doi.org/10.3390/app122010350
Submission received: 20 August 2022 / Revised: 11 October 2022 / Accepted: 12 October 2022 / Published: 14 October 2022
(This article belongs to the Special Issue Mining-Induced Tremors)

Abstract

:
The mechanisms of dynamic disasters around underground roadways/tunnels were examined by adopting split Hopkinson pressure bar (SHPB) laboratory tests to reproduce the failure process of the surrounding rock subjected to incident stress waves. On the basis of ensuring the consistency of numerical simulations with the experimental results, the failure mechanisms of the surrounding rock and spatiotemporal evolution of the hoop stress around the hole were studied by using a two-dimensional particle flow code (PFC2D). The results of the numerical simulation indicate that tensile stress and compressive stress concentrate along the horizontal and vertical directions around the hole, respectively, owing to the instantaneous incidence of compressive stress waves. The failure modes of surrounding rocks are significantly different when the hole is subjected to various intensities of incident stress waves. In addition, the stability of the surrounding rock of the hole is greatly affected by the amplitude and wavelength of the incident wave and the elastic modulus of the surrounding rock.

1. Introduction

Mining tremors are highly common dynamic phenomena in mining operations, which are essentially the release of locally accumulated elastic energy during rock fractures. The intensity of mining tremors is determined by the fracture scale, mechanical properties of the rock materials, stress conditions of the seismic source, fracture model, and many other factors [1,2]. Similar to earthquakes, strong tremors cause the violent shaking of ground buildings [3,4], the collapse of underground cavities, gas outbursts [5], and rockbursts [6]. In particular, at larger depths of mining operations, underground openings are under conditions of high geo-stress and the disturbance of strong mining tremor, which can easily cause surrounding-rock fracture, disintegration, and caving to the goaf; it can even induce dynamic disasters.
In recent decades, scholars have conducted a lot of research on the stress distribution and failure mechanism of underground roadways [7,8,9,10,11]. In 1898, Kirsch [8] obtained the analytical formula of the stress field around the circular cavity for the first time based on the assumption of the plane strain. In 1952, Karl [9] analyzed the influence of the hole shape on the stress concentration of the surrounding rock. Then, the stress field distribution of a non-circular roadway is obtained through the complex function method [12,13,14]. Martini et al. [15] studied the mechanism of the progressive failure of three-dimensional roadways, indicating that the surrounding rock of the roadway would fail in spalling when the tangential stress exceeds its compressive strength. From this research, it can be found that most of the studies on the stress concentration around the cavity mainly focus on the static and quasi-static conditions and rarely consider the impact of dynamic disturbances.
Mine tremors mainly radiate energy in the form of stress waves. When a stress wave arrives at underground openings, it transmits and bends along the hole and generates diffraction owing to the difference in wave impedance between the rock and air. This causes the stress at the edge of the hole to be significantly higher than that in other areas. Mitelman and Elmo [16] pointed out that when stress waves caused by an explosion reach the tunnel boundary, they will be reflected and converted into tensile stress waves, resulting in the failure of the surrounding rock (i.e., spall failure). Similarly, the literature [17,18,19,20] also focuses on the influence of rock tensile strength and stress wave incident strength on spalling. However, the spall failure is only a part of the reason for roadway failure induced by stress waves. As a whole structure, the stress distribution of the surrounding rock differs greatly in different regions of roadways under the disturbance of stress waves, rather than only tensile stress. Compression caused by stress wave incidence is also an important cause of hole failure [21,22,23]. Therefore, the stress evolution process of the whole structure of the hole generated by stress wave incidence has drawn attention. Pao and Mow [23] elaborated on the method for solving dynamic stress concentration, which lay the foundation for the following research in the field. Then, the dynamic stress distribution of the surrounding rock under more complex incident waves and irregular roadway shapes is studied through the indirect boundary integration equation method and the wave function expansion method [24,25,26,27,28]. However, these studies only focus on the stress change around the roadway at the moment of incident stress waves, ignoring the influence of the rock’s mechanical strength on the stability of the surrounding rock, and lack in-depth investigations into the failure process of the surrounding rock.
The particle flow code (PFC) has been widely used to study the mechanical properties and micro-failure mechanism of rocks. This method can simulate the mechanical behavior of crack formation, penetration, and macroscopic fracture of rocks under external force. In addition, it can continuously monitor the characteristics of stress concentration and transfer, energy conversion, displacement, and deformation during rock fractures. For example, Li et al. simulate the dynamic responses around an underground tunnel subjected to blasting load by the particle flow code (PFC) [29]. Castro-Filgueira et al. proposed a method for simulating the triaxial experiment of granite based on a flat joint contact model [30]. Xu et al. studied the effect of heating on the fracture behavior of cemented backfill through PFC [31]. In addition, the PFC is suitable for studying the mechanical properties of rocks under impact dynamic loads. Luo et al. established a split Hopkinson pressure bar (SHPB) numerical model using PFC to study crack generation, interaction, and energy conversion in the process of sandstone impact failure [32]. Yuan et al. established a model of blasting fracturing rock stratum using PFC and studied the influence of decoupling charge on the increase in crack growth in sandstone [33]. Thus, PFC numerical tests can be used to study the dynamic response characteristics of holes under stress waves.
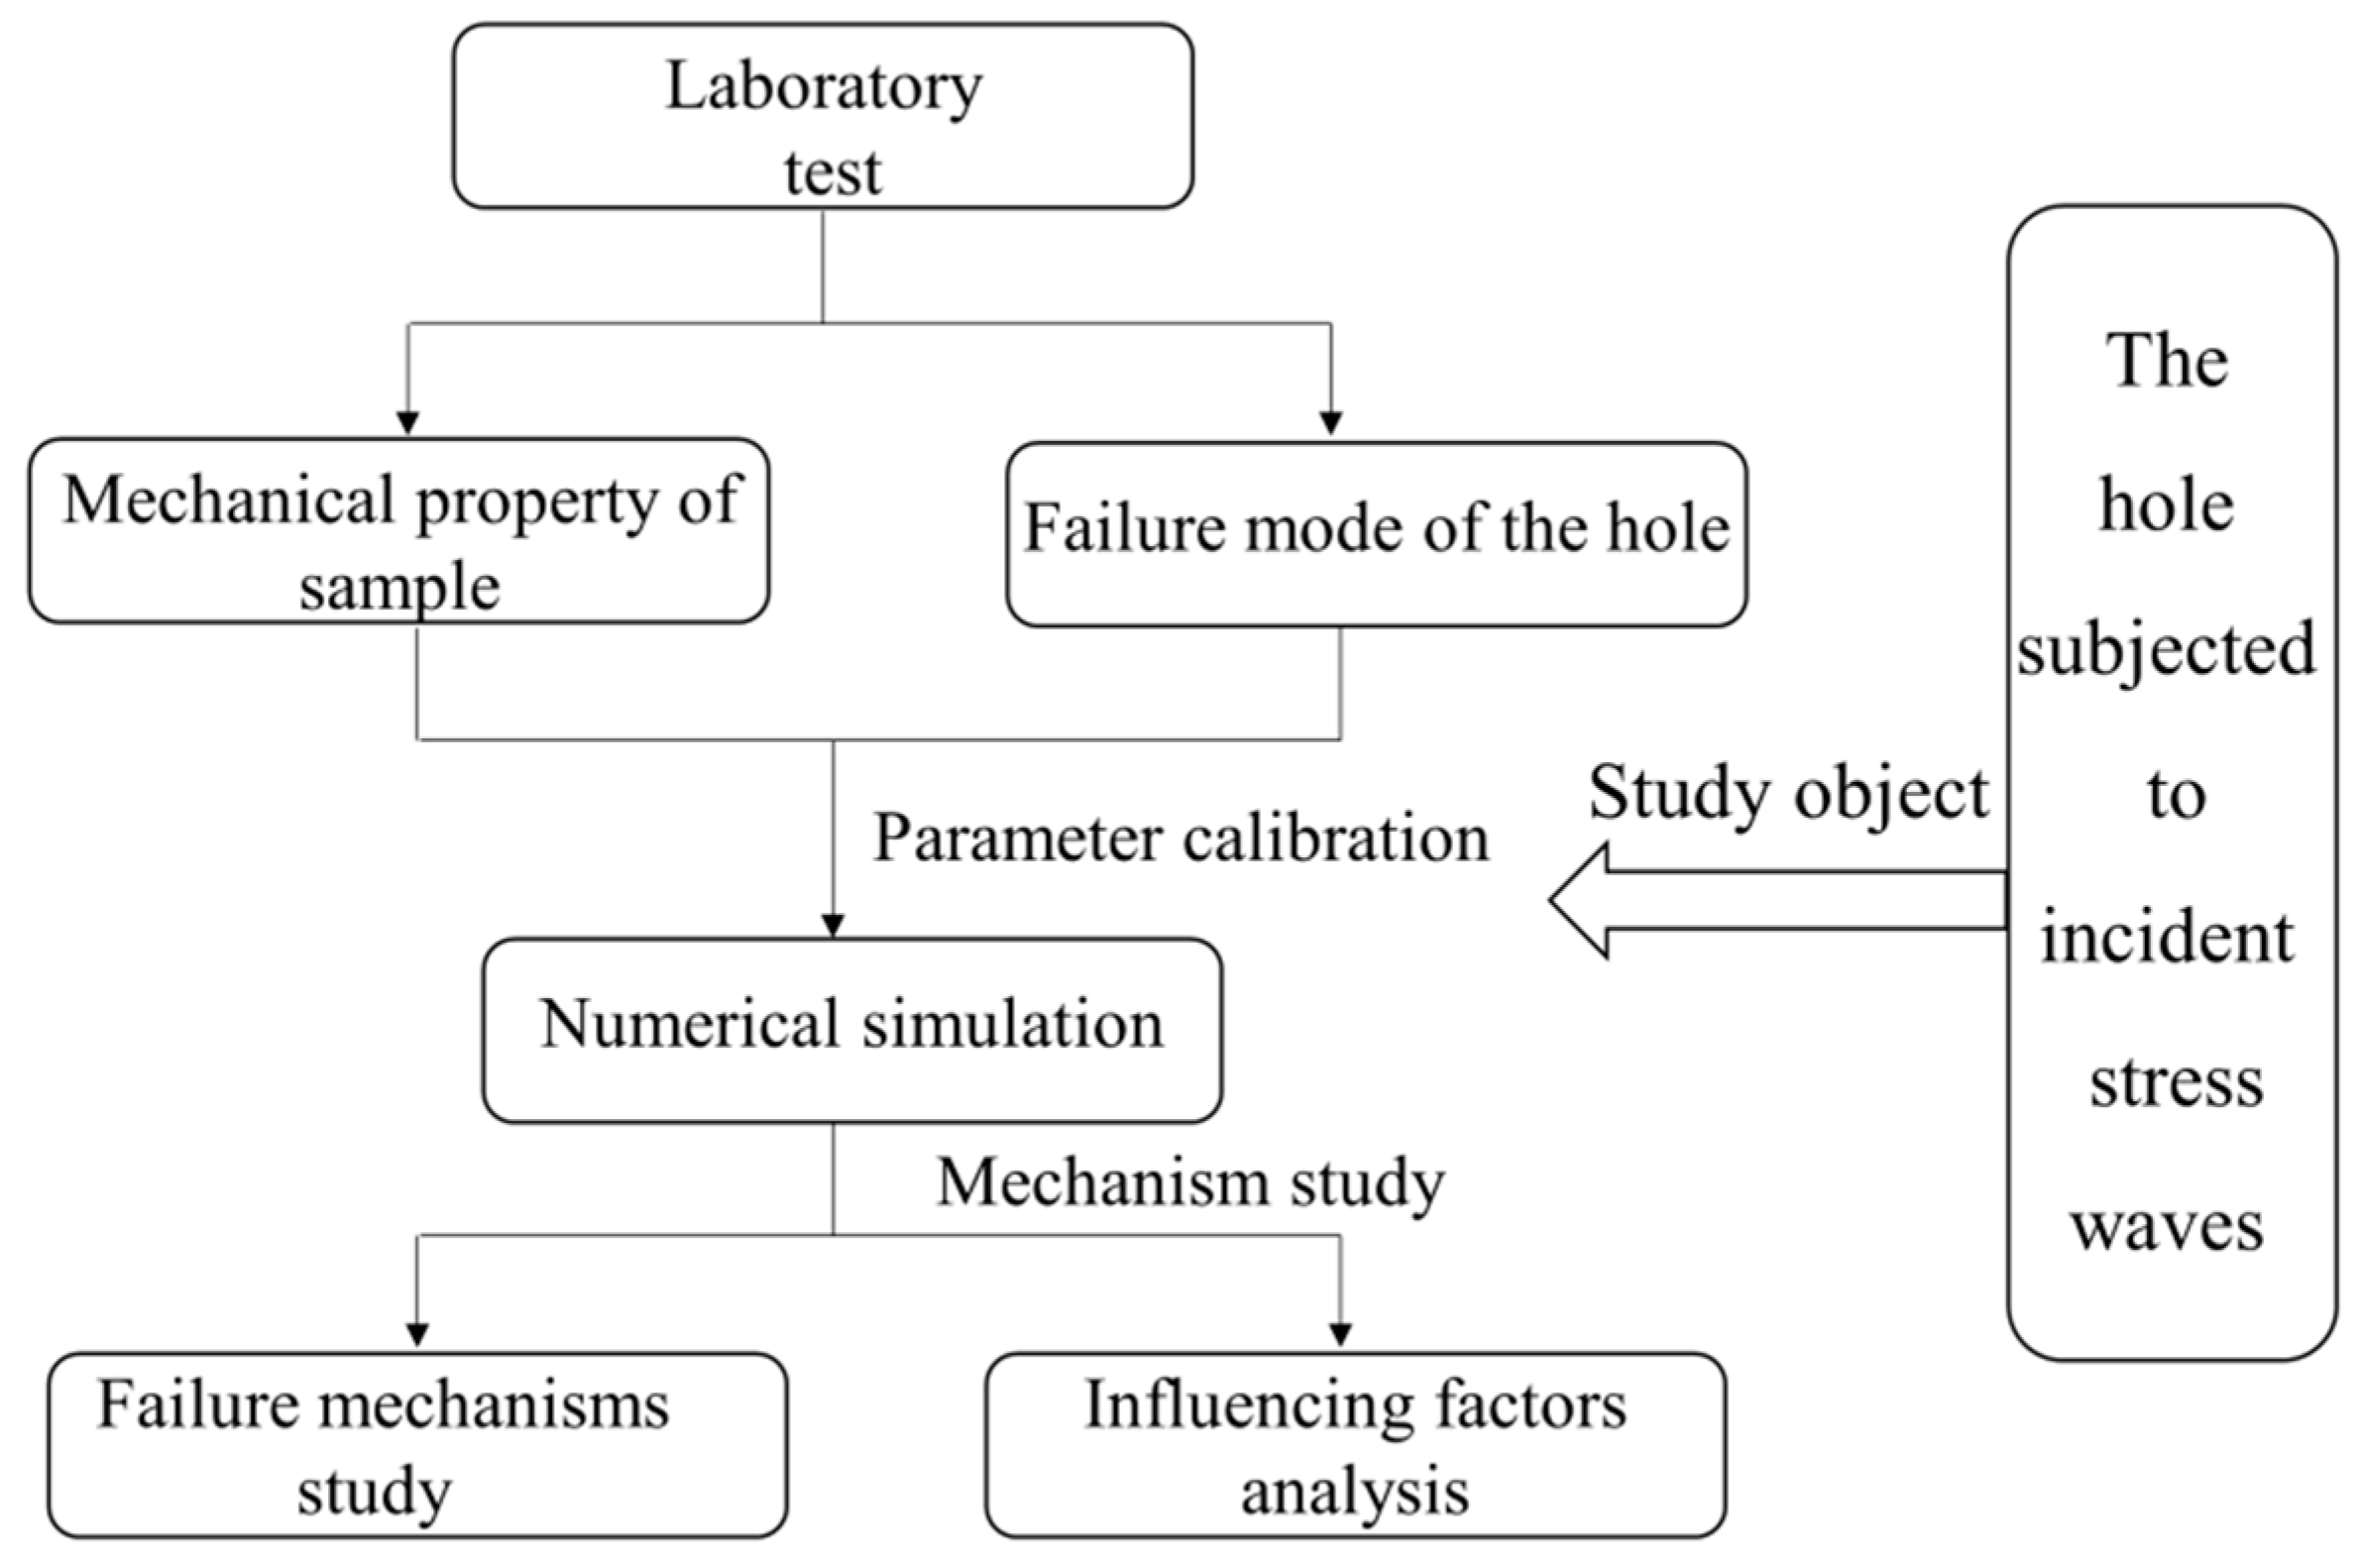
It can be seen from the above that there have been a lot of studies on the stress concentration of the hole. However, on the one hand, the current research mainly focuses on the fracture mechanism of roadways under the condition of static stress concentration, while the research on failures induced by dynamic disturbance is relatively few. On the other hand, the existing research on dynamic disturbance mainly focuses on dynamic stress evolution but lacks an in-depth discussion on the critical failure conditions of holes and the analysis of the difference between failure modes in different regions. In view of this, as the flowchart shows in 
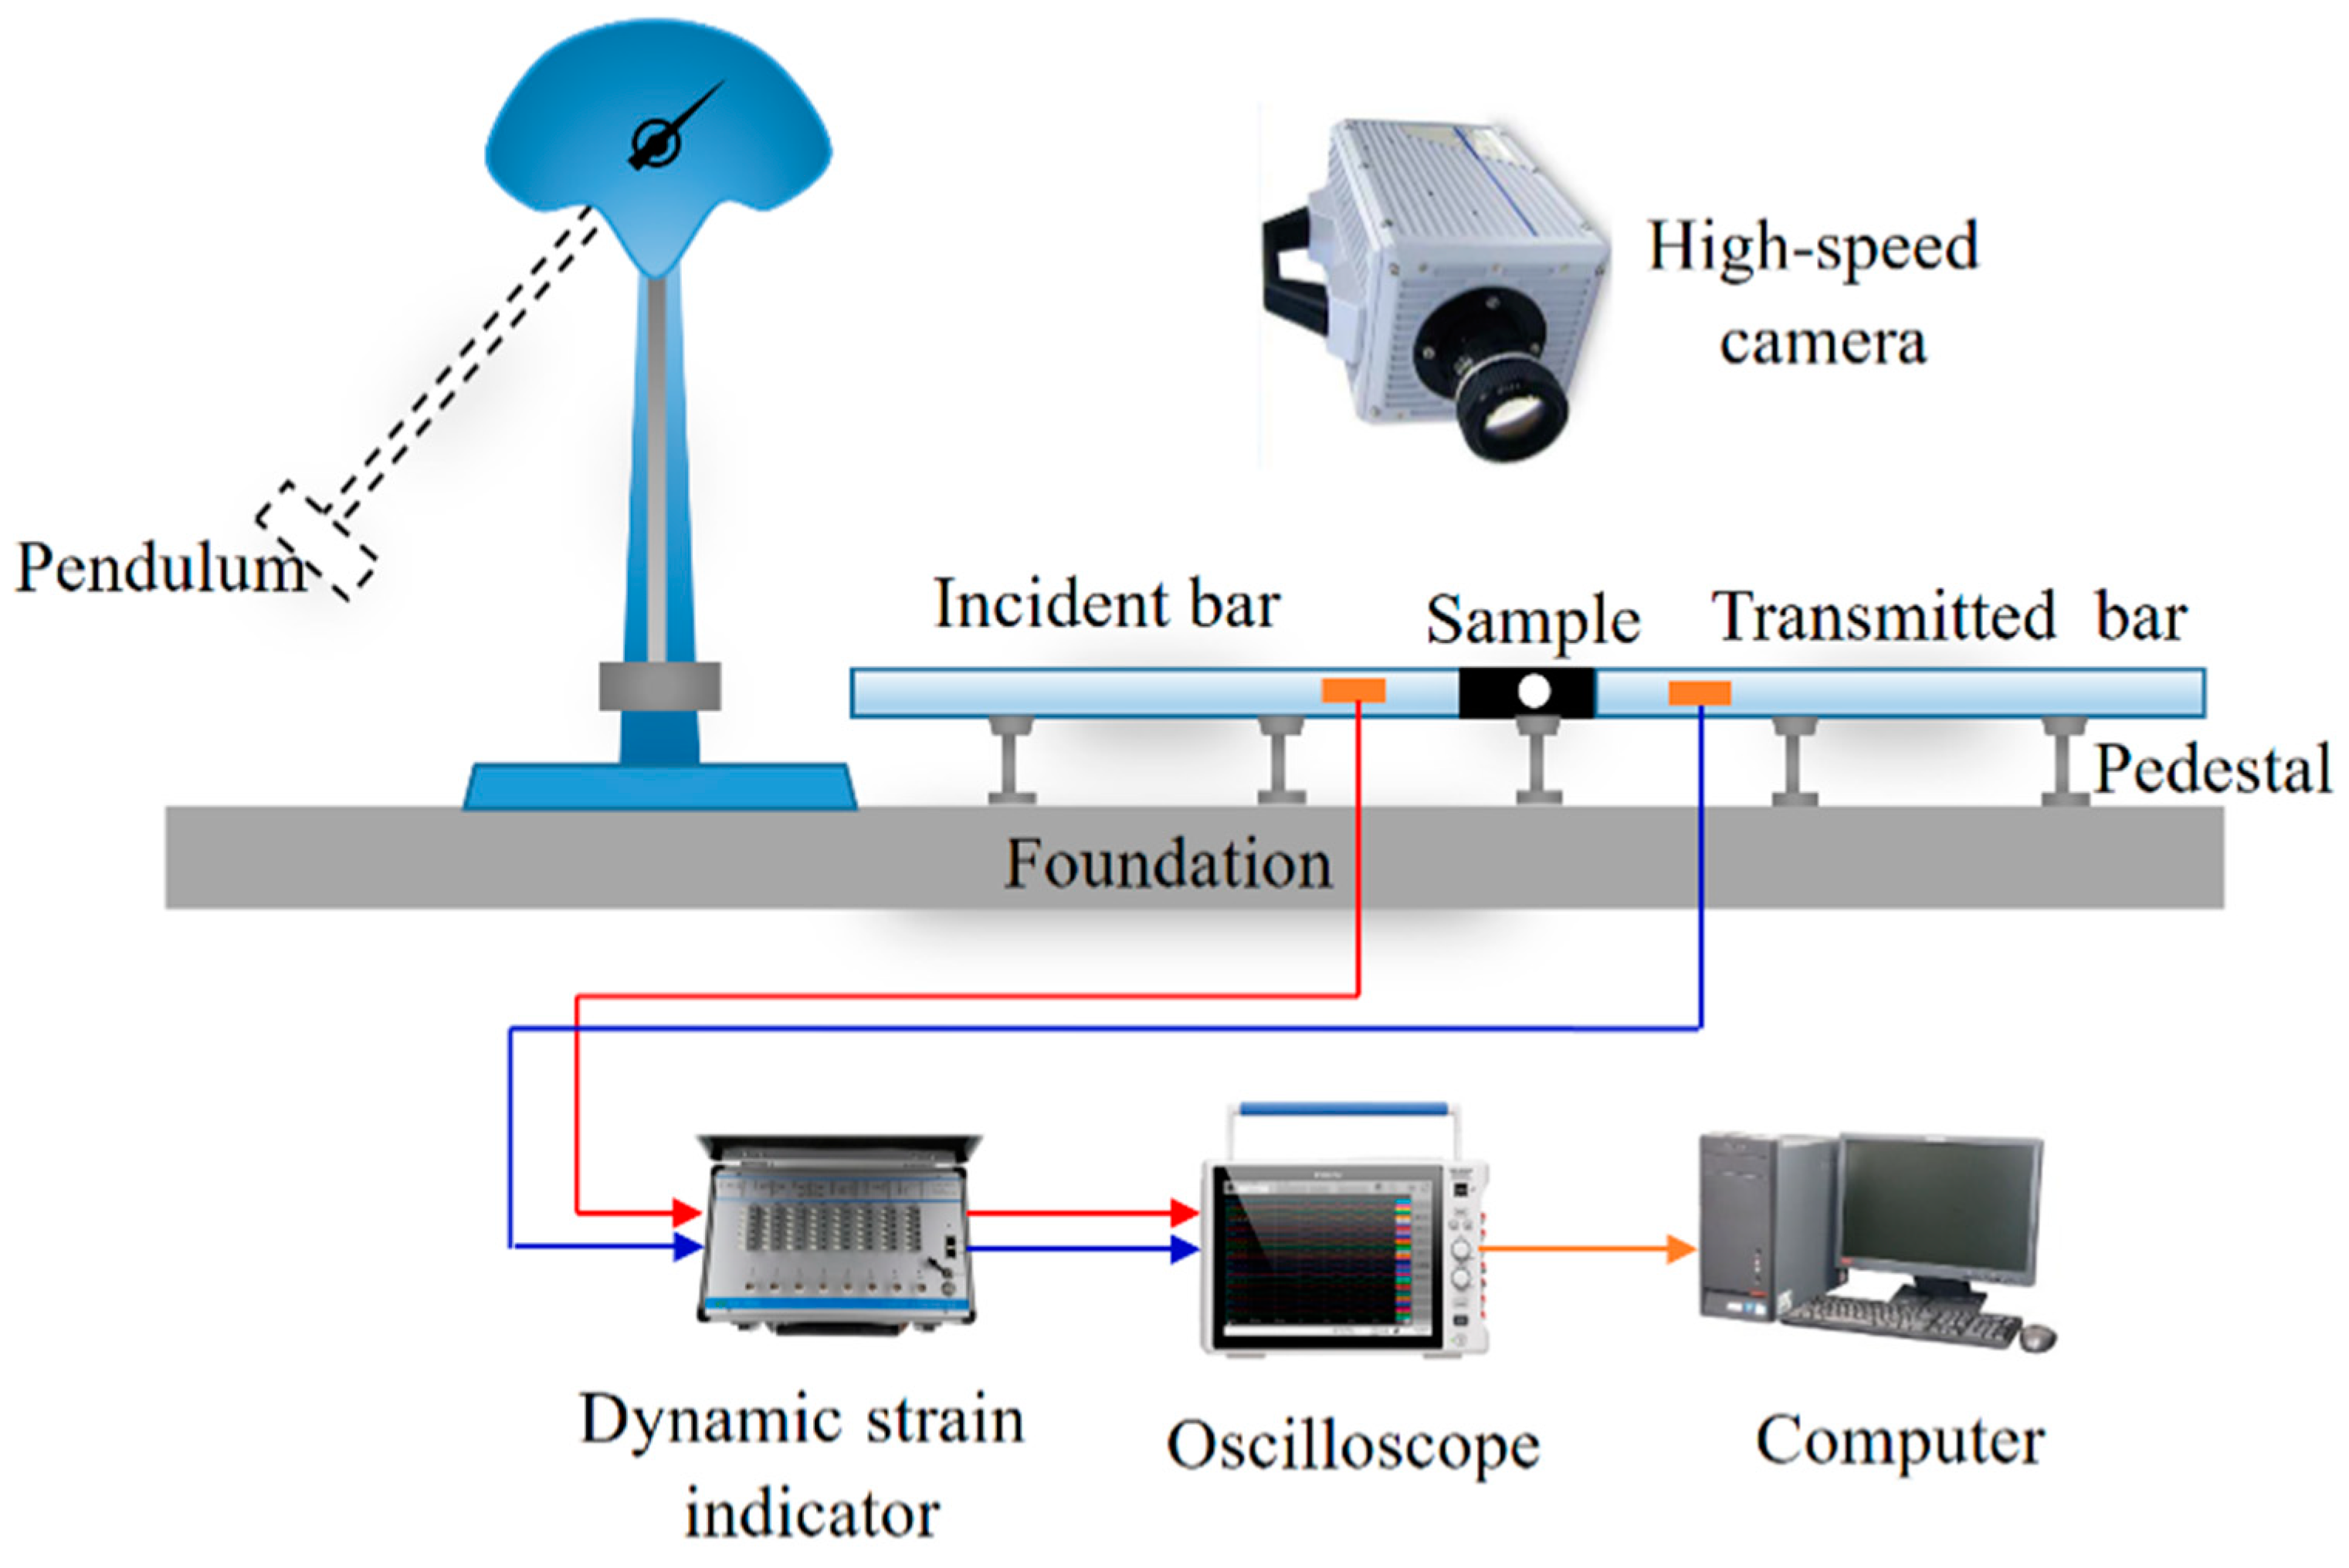
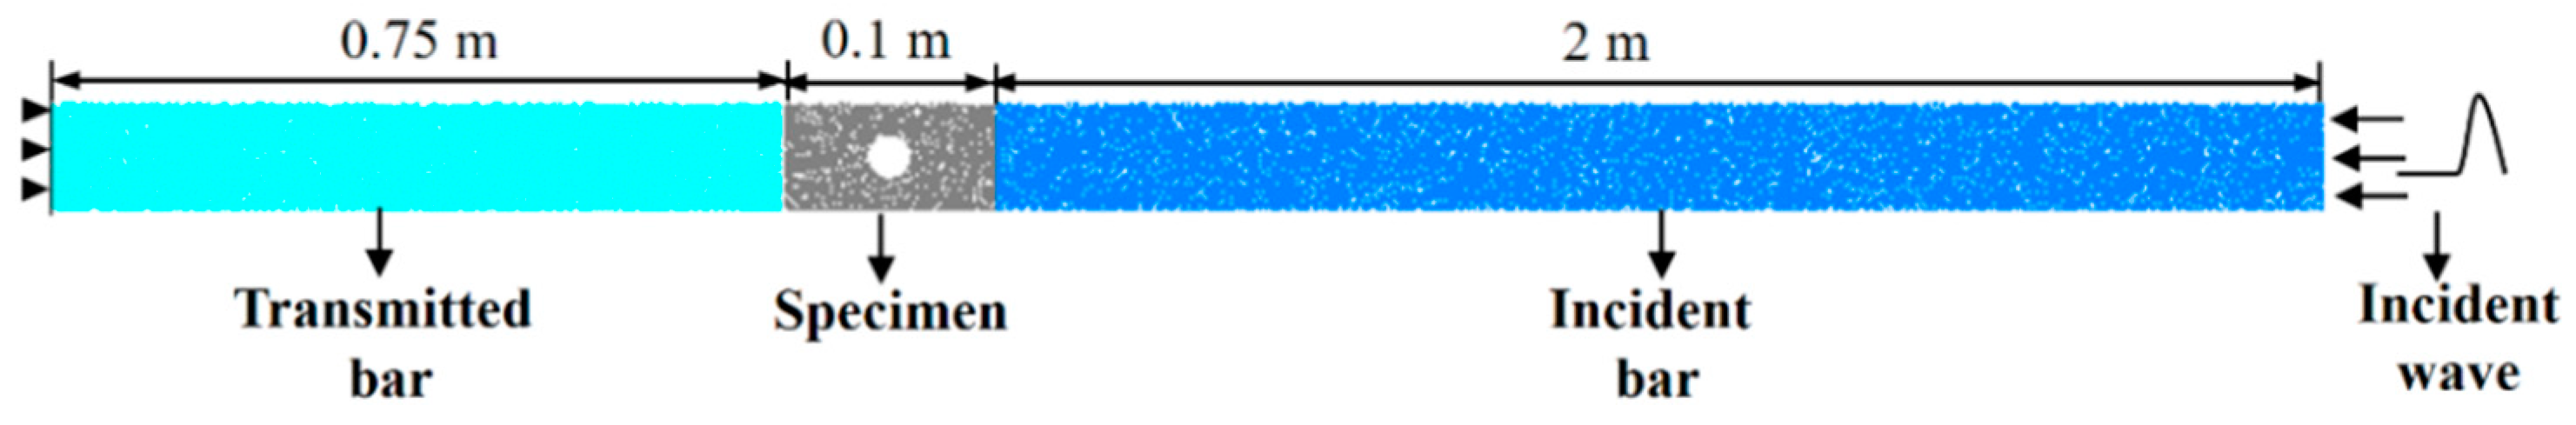
Figure 1, in this study, the initial generation position, the penetration process of the hole edge crack, and the final failure mode of the entire sample during the incident stress wave are first captured based on SHPB laboratory tests. This is performed to characterize the failure mechanism of holes caused by the incident stress wave. Then, the temporal and spatial variations in circumferential stress around the hole, crack formation, and energy conversion are monitored and investigated by PFC simulations. In addition, the failure modes in different areas of the hole are analyzed. Finally, the effects of the stress wave frequency, amplitude, and elastic modulus of the rock on the surrounding rock stability are discussed.
Considering that plenty of strong mine tremors can cause the deformation and failure of roadways, the main contributions of the study are as following: (1) the stress evolution process of the overall structure of the surrounding rock of the roadway after the incident of the stress wave is obtained. Considering the rock strength characteristics and dynamic stress evolution, the failure process of the surrounding rock is deeply analyzed, and the causes and differences of the failure of the surrounding rock in different regions are revealed; and (2) the research results are conducive to understand the failure mechanism when roadways are subjected to stress waves radiated by mine tremors, which is highly significant for proposing corresponding support methods for underground roadways/tunnels subjected to mining-tremor disturbances.

2. Impact Compression Tests of SHPB

2.1. Procedure

The dynamic failure process of a hole in a coal sample caused by an incident stress wave was reproduced using the Hopkinson impact system. A separated Hopkinson device composed of a loading system and monitoring system was adopted in the experiment. The loading system comprises a pendulum, incidence bar, and projection bar. The monitoring device includes a dynamic strain indicator, a data processing terminal, and a high-speed camera. The sample was then placed between the incident and transmission bars. The pendulum driven by gravitational potential energy falls and hits the incident bar to generate a compressive stress wave. A part of this is reflected when the stress wave is transmitted to the interface between the incident bar and the sample, and another part passes through the sample and causes a hole fracture. The dynamic fracture process of the samples was recorded using a high-speed camera. The test device is shown in Figure 2.
The coal samples were collected from coal mines. According to the standards of the dynamic experiment, the coal mass was cut and polished into a Φ50 × 100 mm cylinder with a uniaxial compressive strength of 26 MPa and an elastic modulus of 2.8 GPa. In addition, holes with different diameters were drilled in the center of the samples. The compressive stress wave generated by the hit between the pendulum and the incident bar was used to simulate the vibration wave radiating from the mine tremor. The hole in the center of the sample represents the underground tunnel. The simplified mechanical model is shown in Figure 3. The effects of the incident wave amplitude and hole size on the dynamic instability of the hole were assessed by adjusting the falling height and radius of the hole. The hole radius was set to 0 (intact), 8, 16, and 24 mm. The impact velocities corresponding to the hole diameters were set to 2 m/s, 3.3 m/s, and 4.2 m/s, respectively.

2.2. Results and Analysis

All the samples remained intact. No crack was generated at an impact speed of 2 m/s. The damage degree of the samples with different hole sizes varied as the impact speed increased to 3.3 m/s and 4.2 m/s. The fracture evolution process is shown in Figure 4. To conveniently describe the crack initiation position around the hole, the angles were used to represent the different positions of the hole edge. Here, the hole center was set at the center of the circle. In addition, the angle increased along the anticlockwise direction from 0° on the rightmost side of the hole edge, thereby representing the different positions of the hole edge (see Figure 3).
For intact samples, the cracks emerged at the end of the sample close to the transmitted bar under different impact velocities. This may have been caused by the reflected tensile waves caused by the impact of the sample on the transmitted bar. For a hole diameter of 8 mm and an impact velocity of 3.3 m/s, the cracks first initiated in the 90° and 270° directions of the hole edge, i.e., in the vertical direction. Then, these extended and converged in the reverse direction. This was accompanied by the formation of vertical macro-fractures. The crack evolution process was similar to that for an impact velocity of 3.3 m/s. However, a vertical crack appeared at the left end owing to the higher impact strength. This indicated higher damage. At the hole diameter of 16 mm and impact velocity of 3.3 m/s, the cracks began to emerge in the 0° and 180° directions of the hole edge and converged with the far-field cracks at both ends along the incident direction. Finally, a penetrating crack formed along the horizontal direction. As the velocity increased to 4.2 m/s, cracks appeared in the 90° and 270° directions and spread to both ends of the sample along the horizontal direction. This was accompanied by the spraying and falling of coal dust. When the sample with a hole diameter of 24 mm was impacted at a velocity of 3.3 m/s, cracks were almost generated around the hole approximately in the 0° and 180° directions at 250 µs. Then, these developed in the 270° and 90° directions at 500 µs. Finally, macrocracks formed in the vertical direction. This was accompanied by microcrack initiation in the horizontal direction. As the velocity increased to 4.2 m/s, cracks appeared at an angle of 0° at 250 µs. The other cracks were generated at an angle of approximately 180° at 500 µs and extended horizontally. At 750 µs, the horizontal macrocracks penetrated and formed, and vertical microcracks began to be generated around the hole. Finally, the sample was destroyed completely. This was accompanied by horizontal and vertical fractures.
To summarize, the positions of crack generation with different radii and impact velocities of the samples subjected to compressive stress waves were similar. Furthermore, these were concentrated in the 0°, 180°, 90°, and 270° directions around the hole. This indicated that an incident stress wave would redistribute the stress at the edge of the hole and that a strong dynamic stress concentration appears in the vertical and horizontal directions.

3. Numerical Simulations

In laboratory experiments, the process of the instantaneous failure of a hole caused by an incident stress wave is captured by a high-speed camera. However, it is extremely difficult to obtain the corresponding variation process of stress and energy. Numerical simulations can be used to effectively solve this problem. PFC can visually simulate the dynamic fracture behavior of rocks and monitor crack growth, energy conversion, and final failure. Thus, the hole fracture process caused by the incident stress wave can be reproduced using PFC2D.

3.1. Modeling

The entire numerical model is composed of an incident bar, sample, and transmission bar (see Figure 5). The sample size of Φ50 × 100 mm is consistent with that of the laboratory experiment. The lengths of the incident bar and transmitted bar are set to 1.5 m and 0.75 m, respectively, and both diameters are 50 mm. The incident/transmitted bar is mainly used to uniformly transmit stress waves. Their contact is set to the linear-bond modulus. An exceptionally large value is assigned to the normal and tangential bond strengths of the contact to prevent bar damage, as shown in Table 1. The mechanical properties of the simulated specimen are consistent with those of the laboratory experiment. Therefore, parallel-bond contact is used to calibrate the failure mode and peak strength by trial and error (see Figure 6). The corresponding micromechanical parameters of the particles and contact are listed in Table 2.

3.2. Loading Method

In the experiment, the stress wave amplitude could be varied by adjusting the swing angle of the pendulum. However, it was difficult to vary the frequency. To study the effect of the stress wave characteristics on the stress fields of the hole, a half-sine stress wave (consistent with the experimental monitoring results) was directly input into the incident bar (see Figure 7). The damping inside the incident rod and reflecting rod was set to zero to prevent attenuation of the stress wave in the incident process. Meanwhile, the damping of the sample was identified as 0.1.
Comparisons between the simulated and experimental failure models with an impact velocity of 4.3 m/s and a hole diameter of 8 mm are shown in Figure 8. It is evident that tensile failure occurred in the 90° and 180° directions around the hole. In addition, a nearly vertical tensile microcrack appeared on the left end, and the failure mode was completely consistent with the experiment. This indicated the rationality of the simulation method.

3.3. Scheme of Simulation Test

The final failure characteristics of the specimens with different hole diameters under various impact velocities are shown in Figure 9. All the specimens were completely intact for an impact speed of 2 m/s. As the impact velocity increased to 3.3 m/s, tensile cracks appeared in the 90° and 270° directions in the specimen with a hole diameter of 8 mm, and an additional tensile crack appeared in the 180° direction in the specimen with a hole diameter of 16 mm. Both vertical and horizontal tensile cracks appeared in the specimen with a hole diameter of 24 mm. The failure mode of each specimen when the impact velocity increased continuously to 4.3 m/s was similar to that for an impact velocity of 3.3 m/s. Meanwhile, vertical cracks transitioned into tensile–shear mixed failure. These results indicate that the failure process of the hole was similar. The initiation positions of all the cracks in each specimen were at angles of 0°, 90°, 180°, and 270°, respectively. This indicates that the dynamic stress was concentrated in these four regions, which is consistent with the experimental results. Therefore, the stress concentration and failure process of the hole by the incidence of the stress wave were studied in detail by considering a specimen with an impact velocity of 4.2 m/s and a hole diameter of 16 mm as an example.

4. Analysis of Simulation Results

4.1. Stress Variation

The hoop stresses are higher than the radial stresses in an opening subjected to dynamic loading. Furthermore, the local concentration of hoop stress results in surrounding rock failure. 
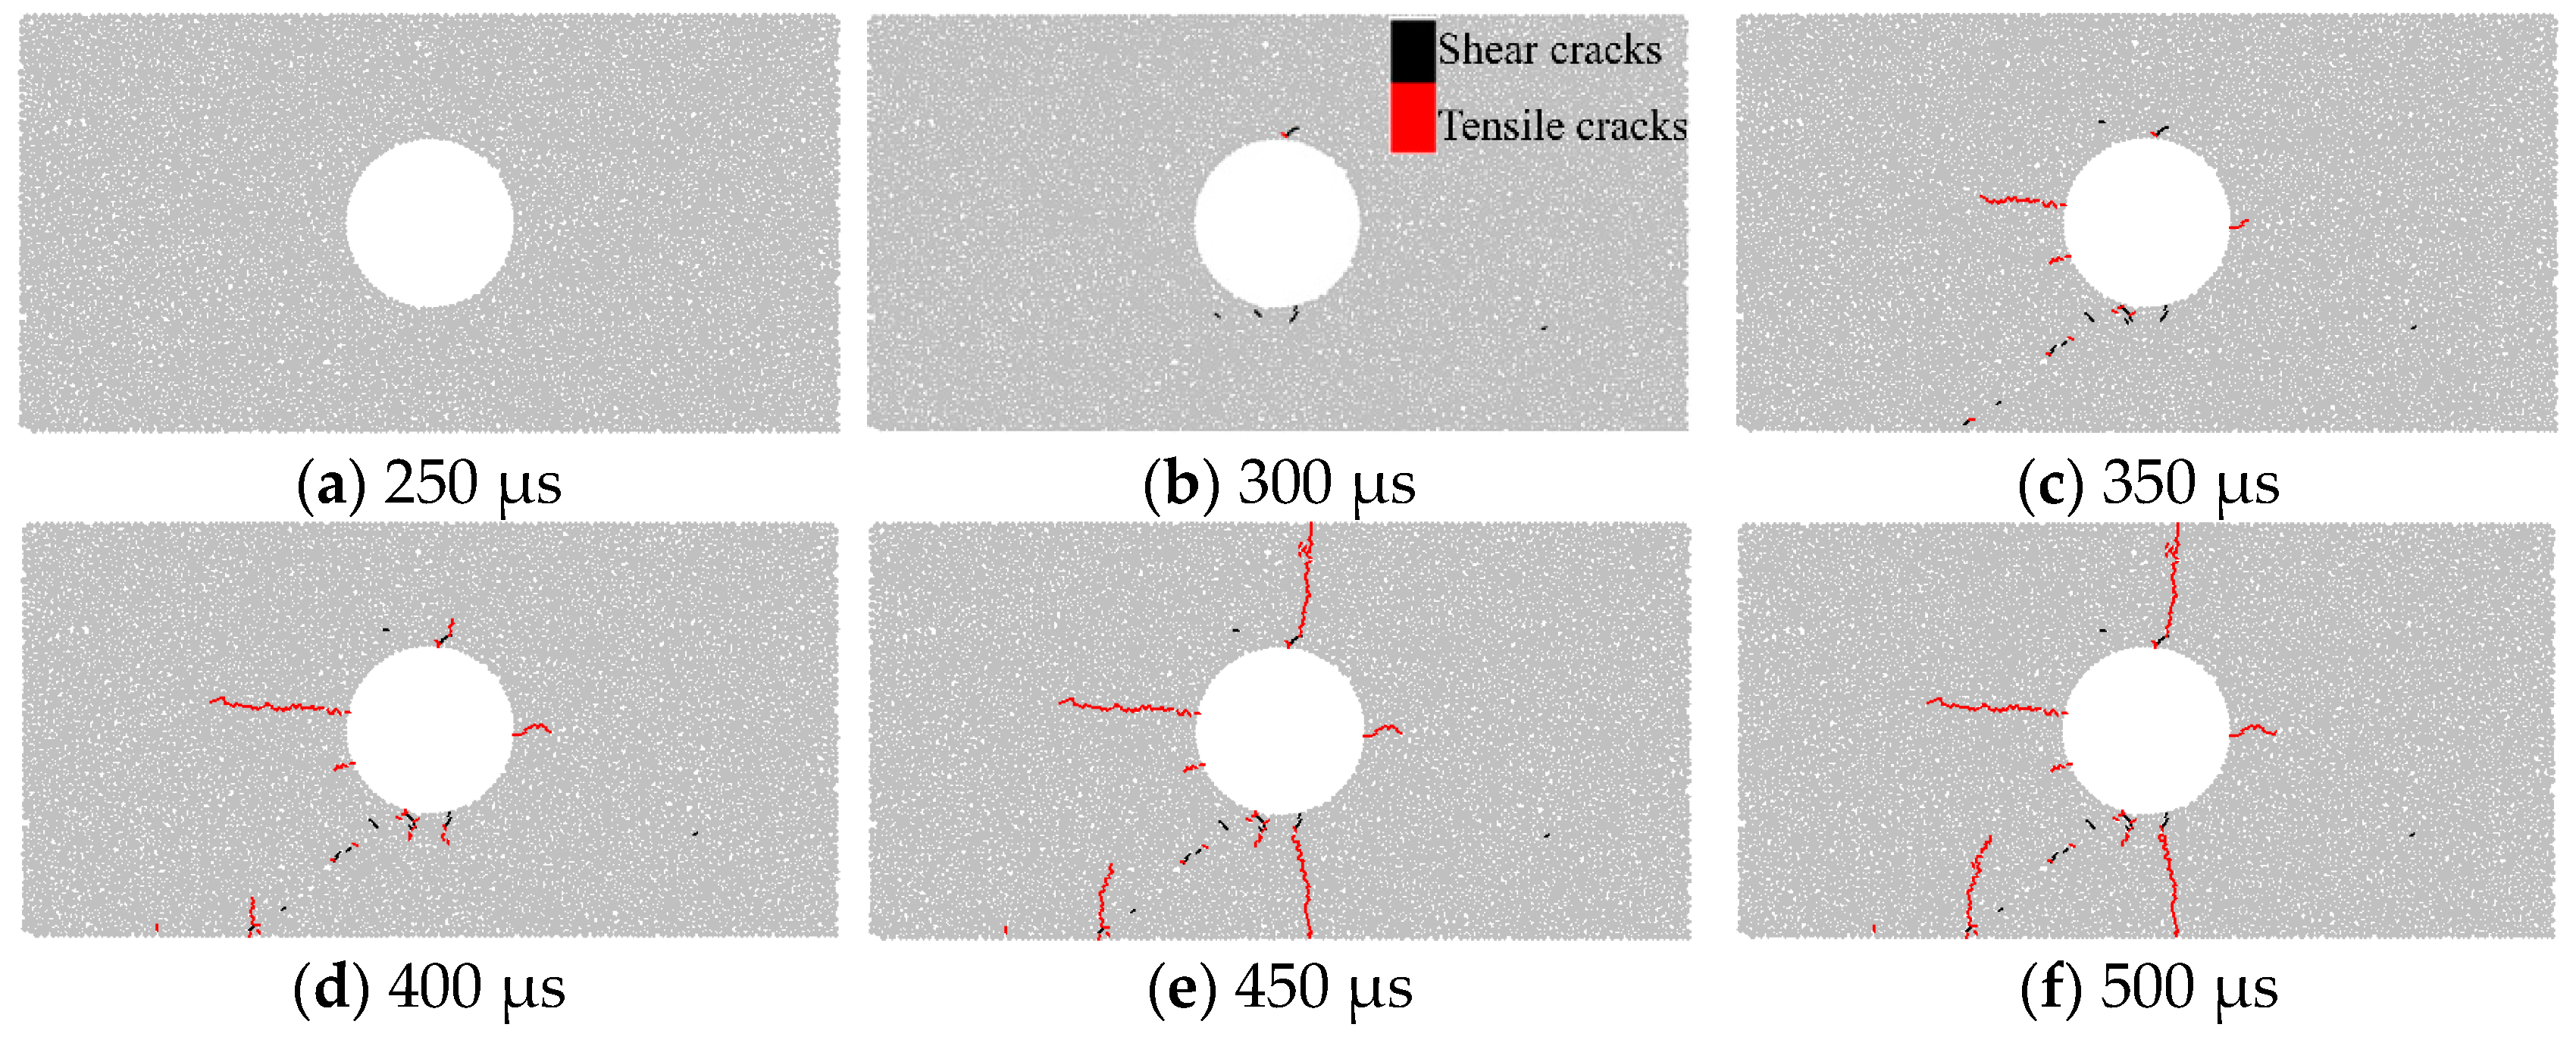
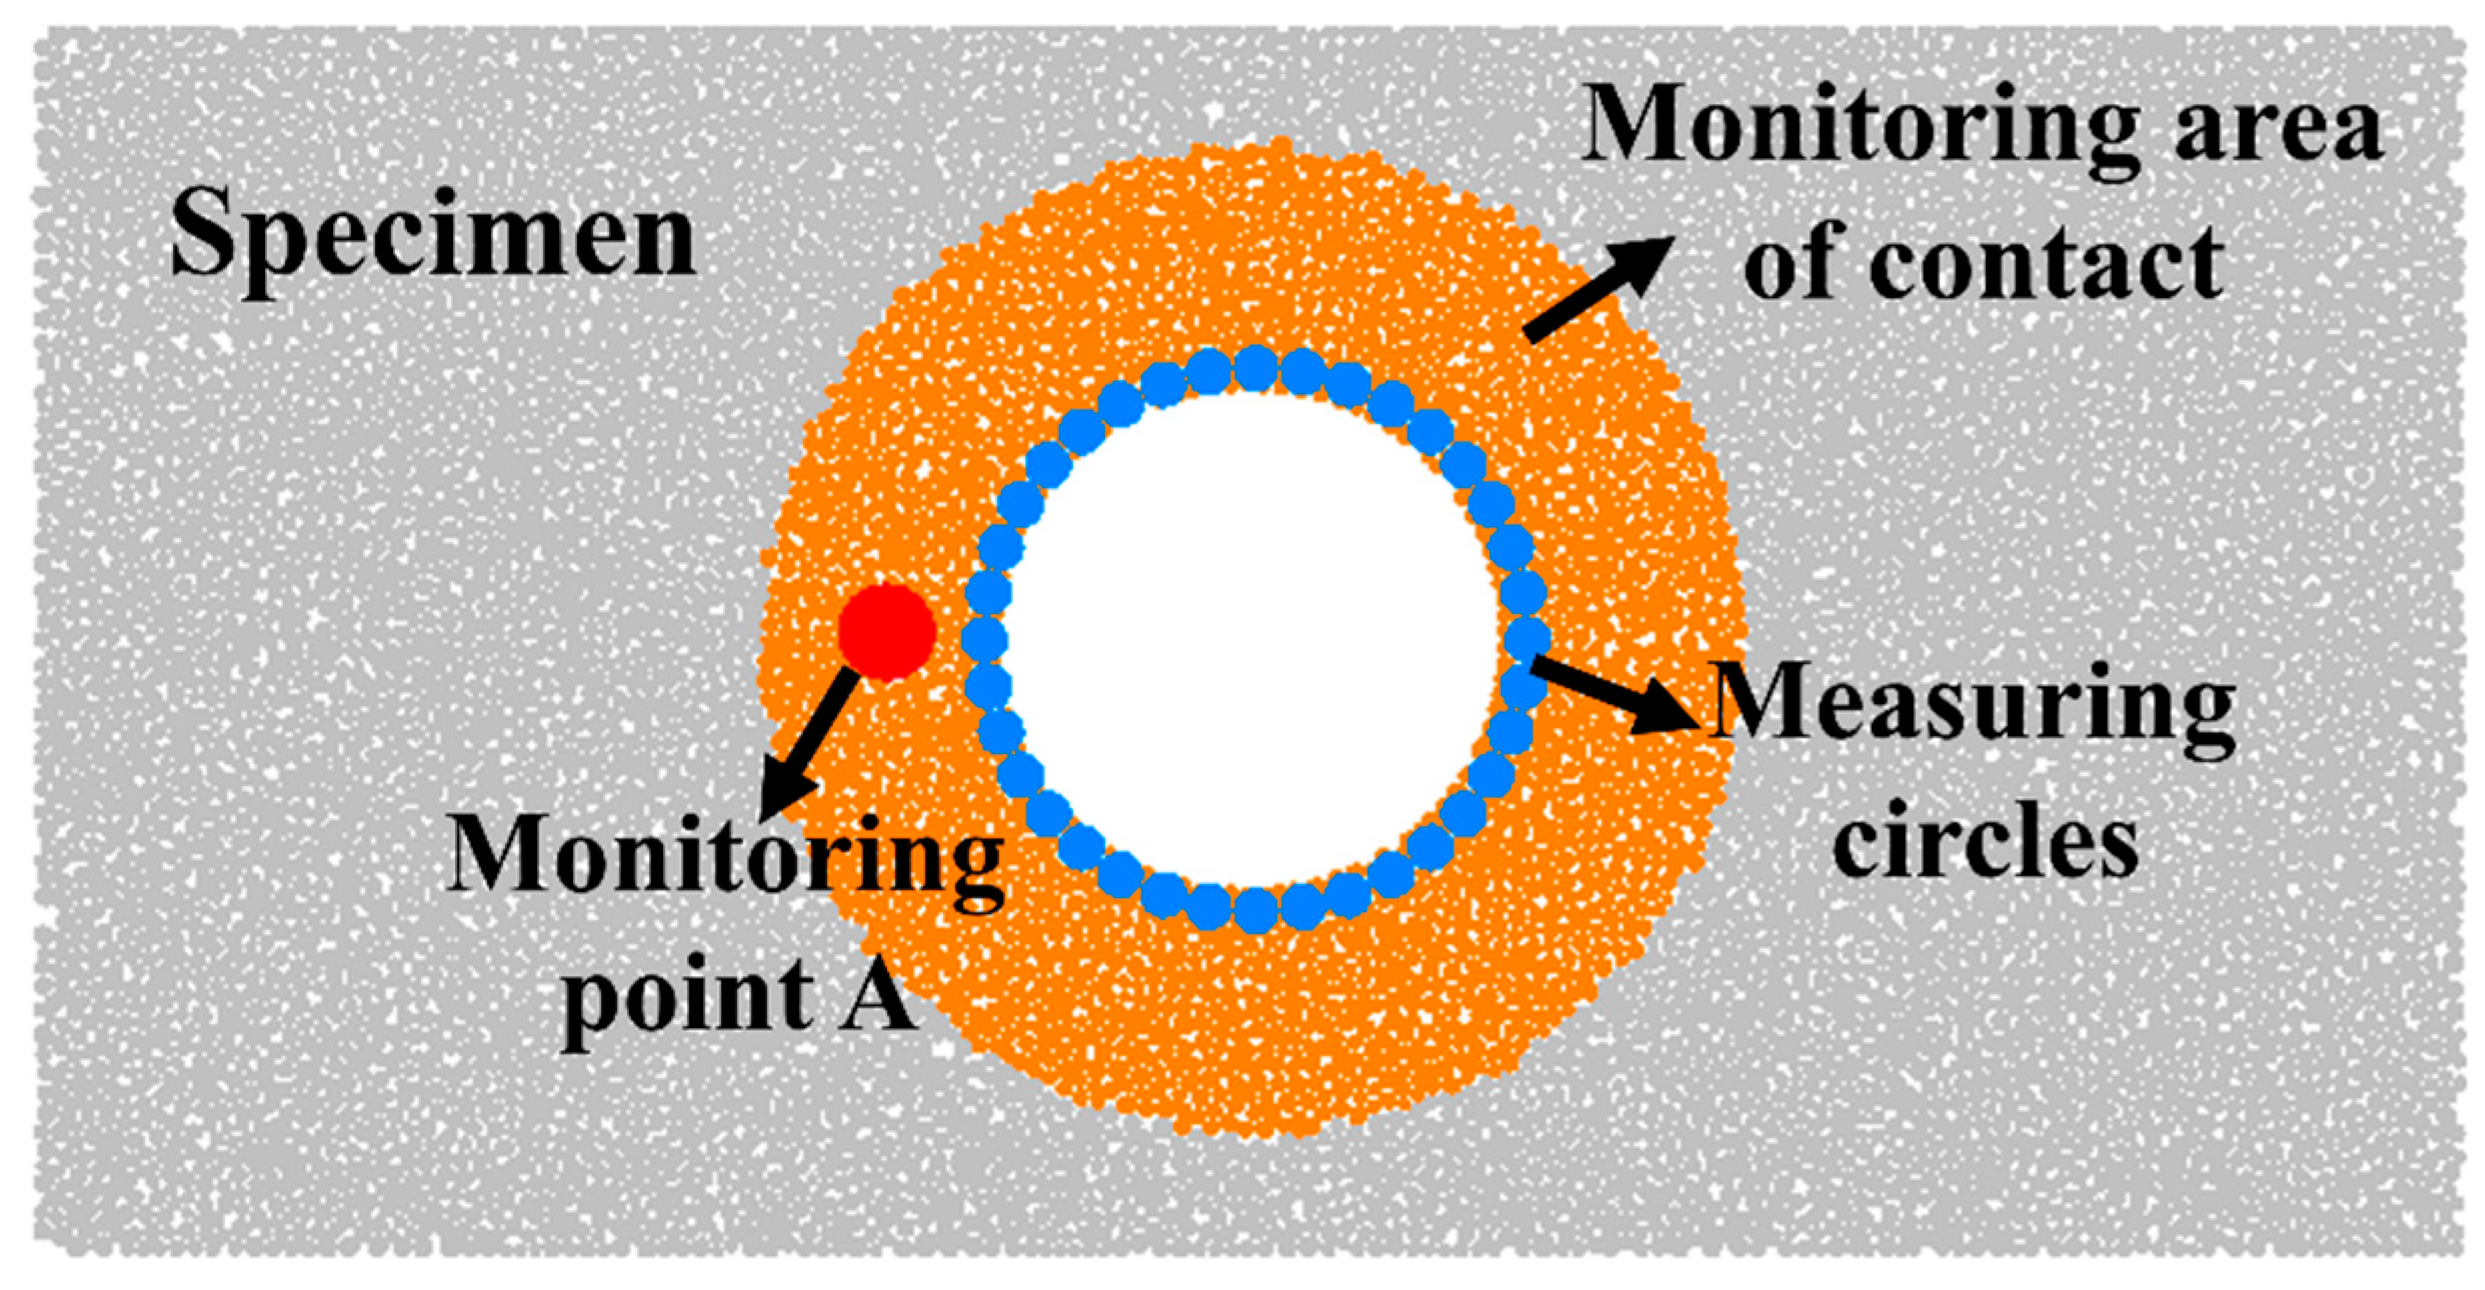
Figure 10 shows the evolution of cracks around the hole. The hoop stresses can be monitored by measuring circles arranged around the hole, as shown in 
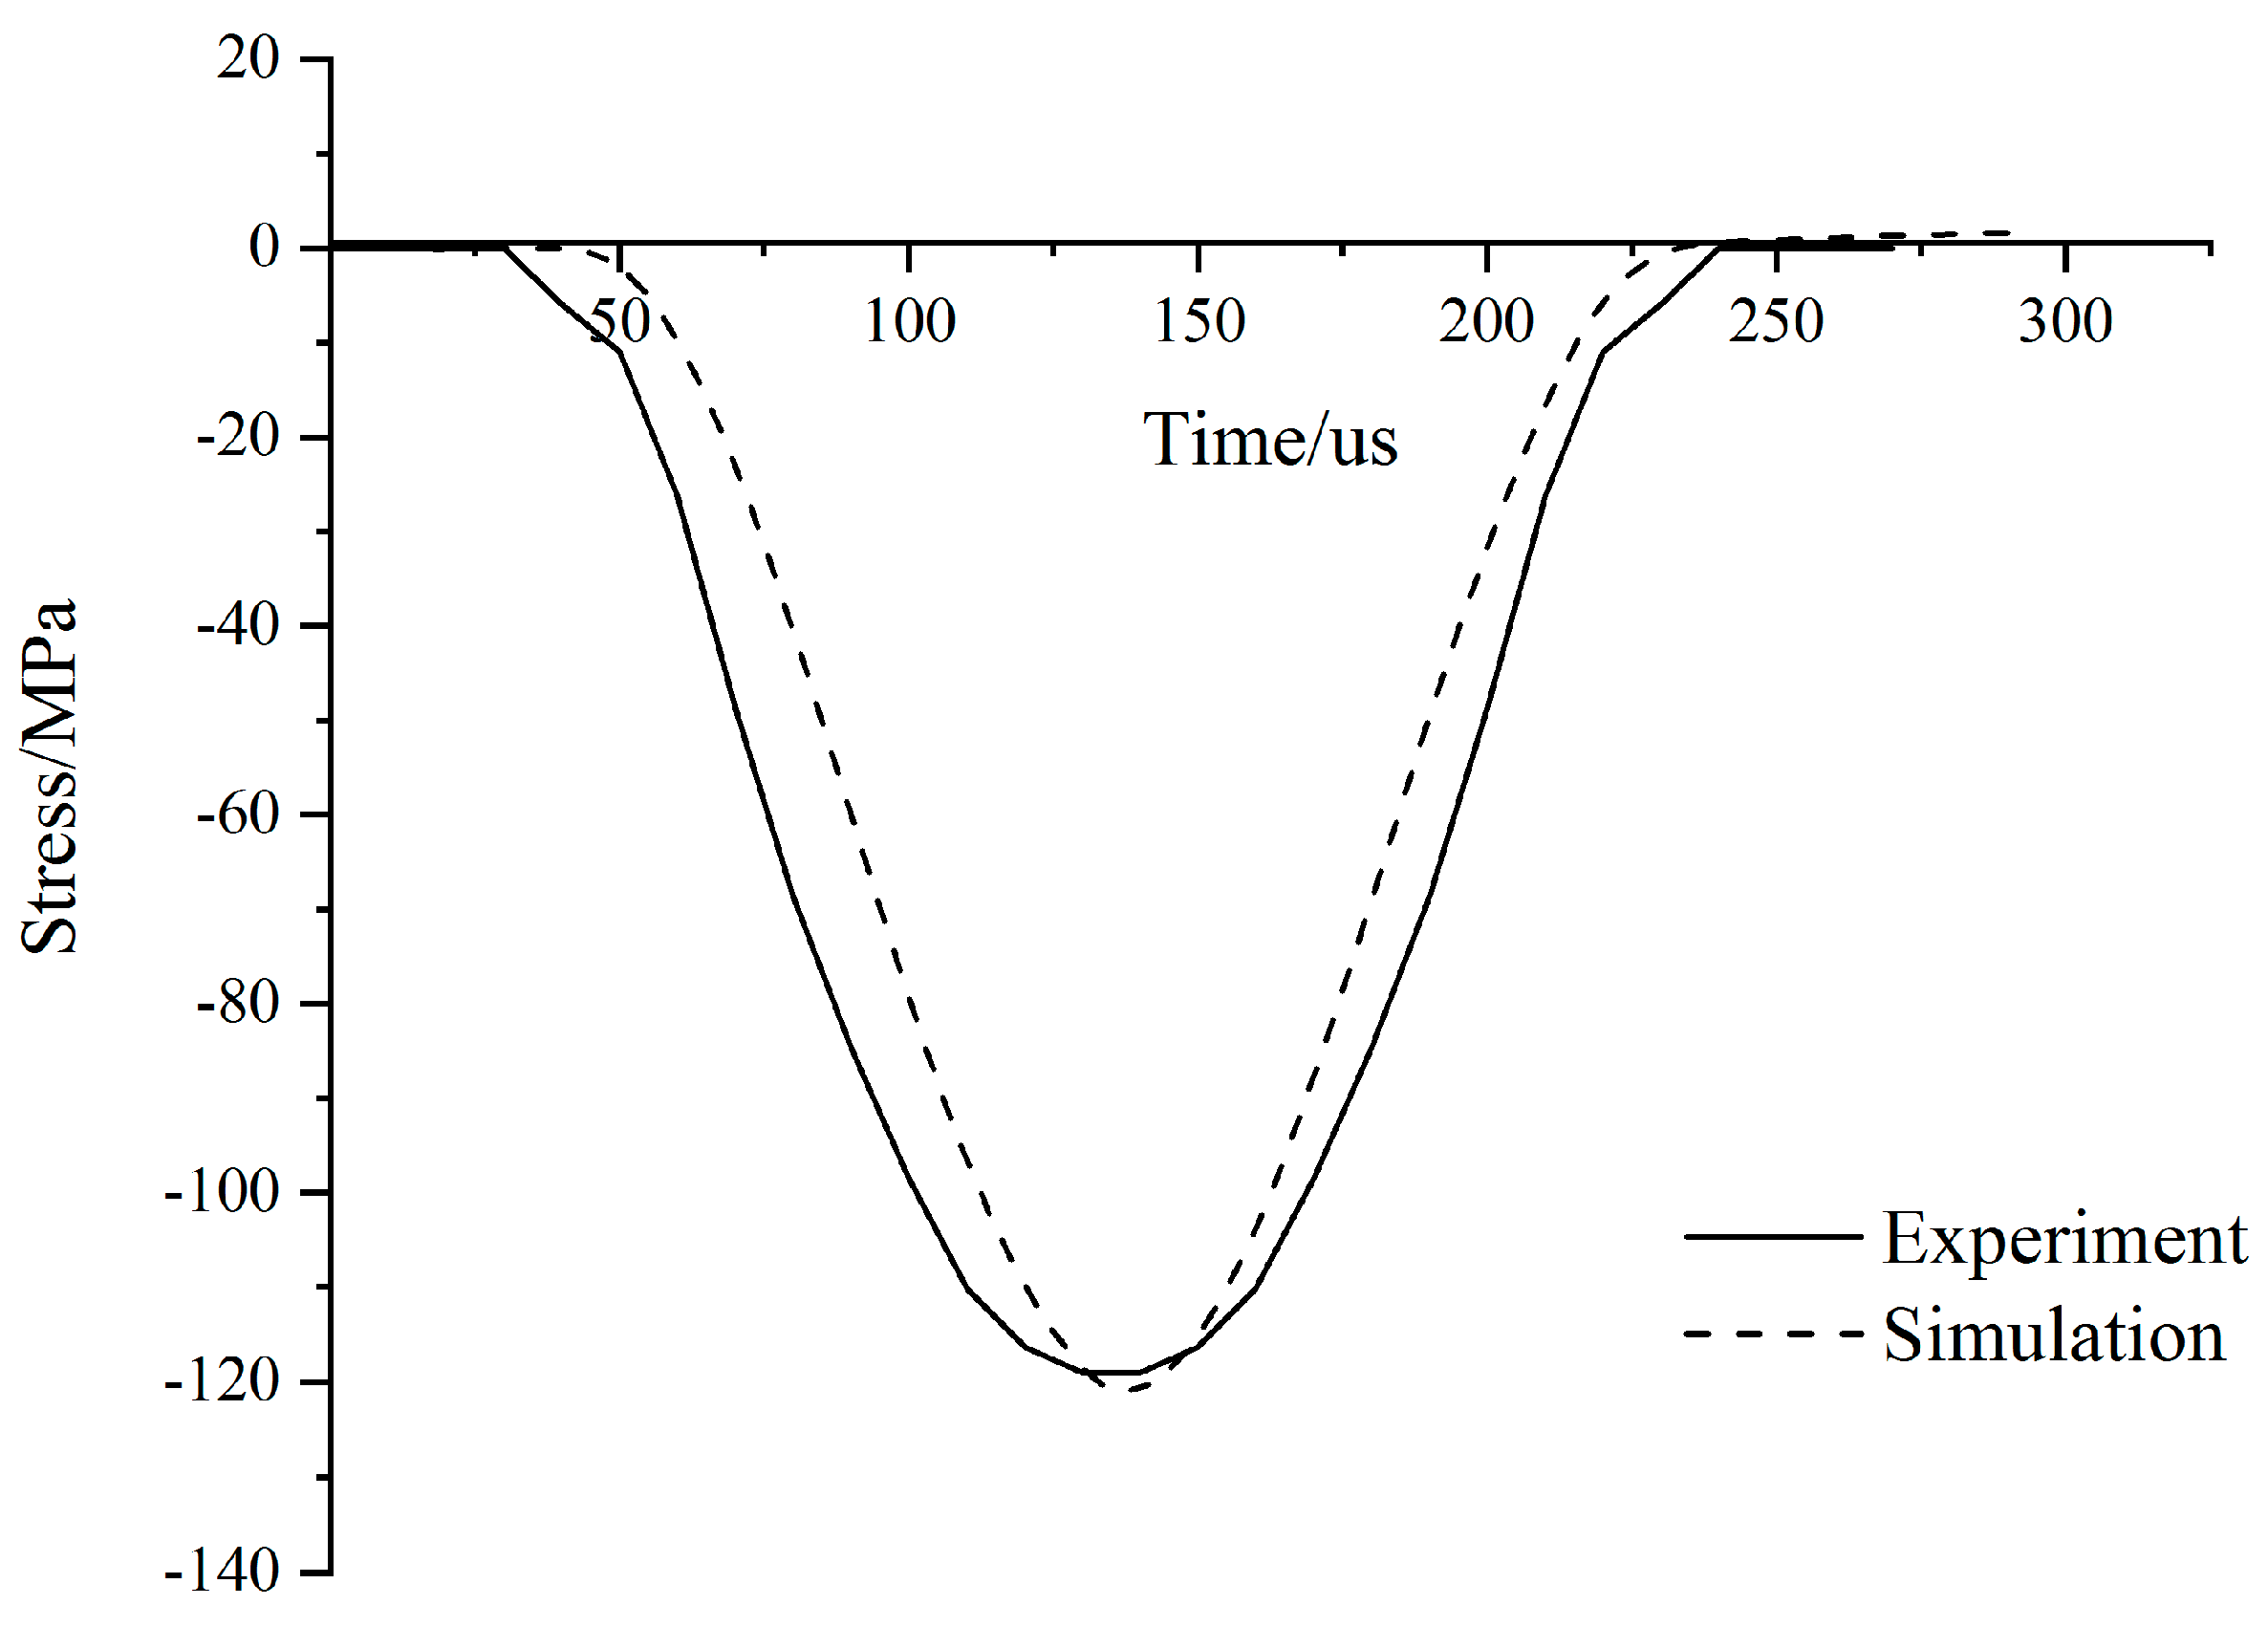
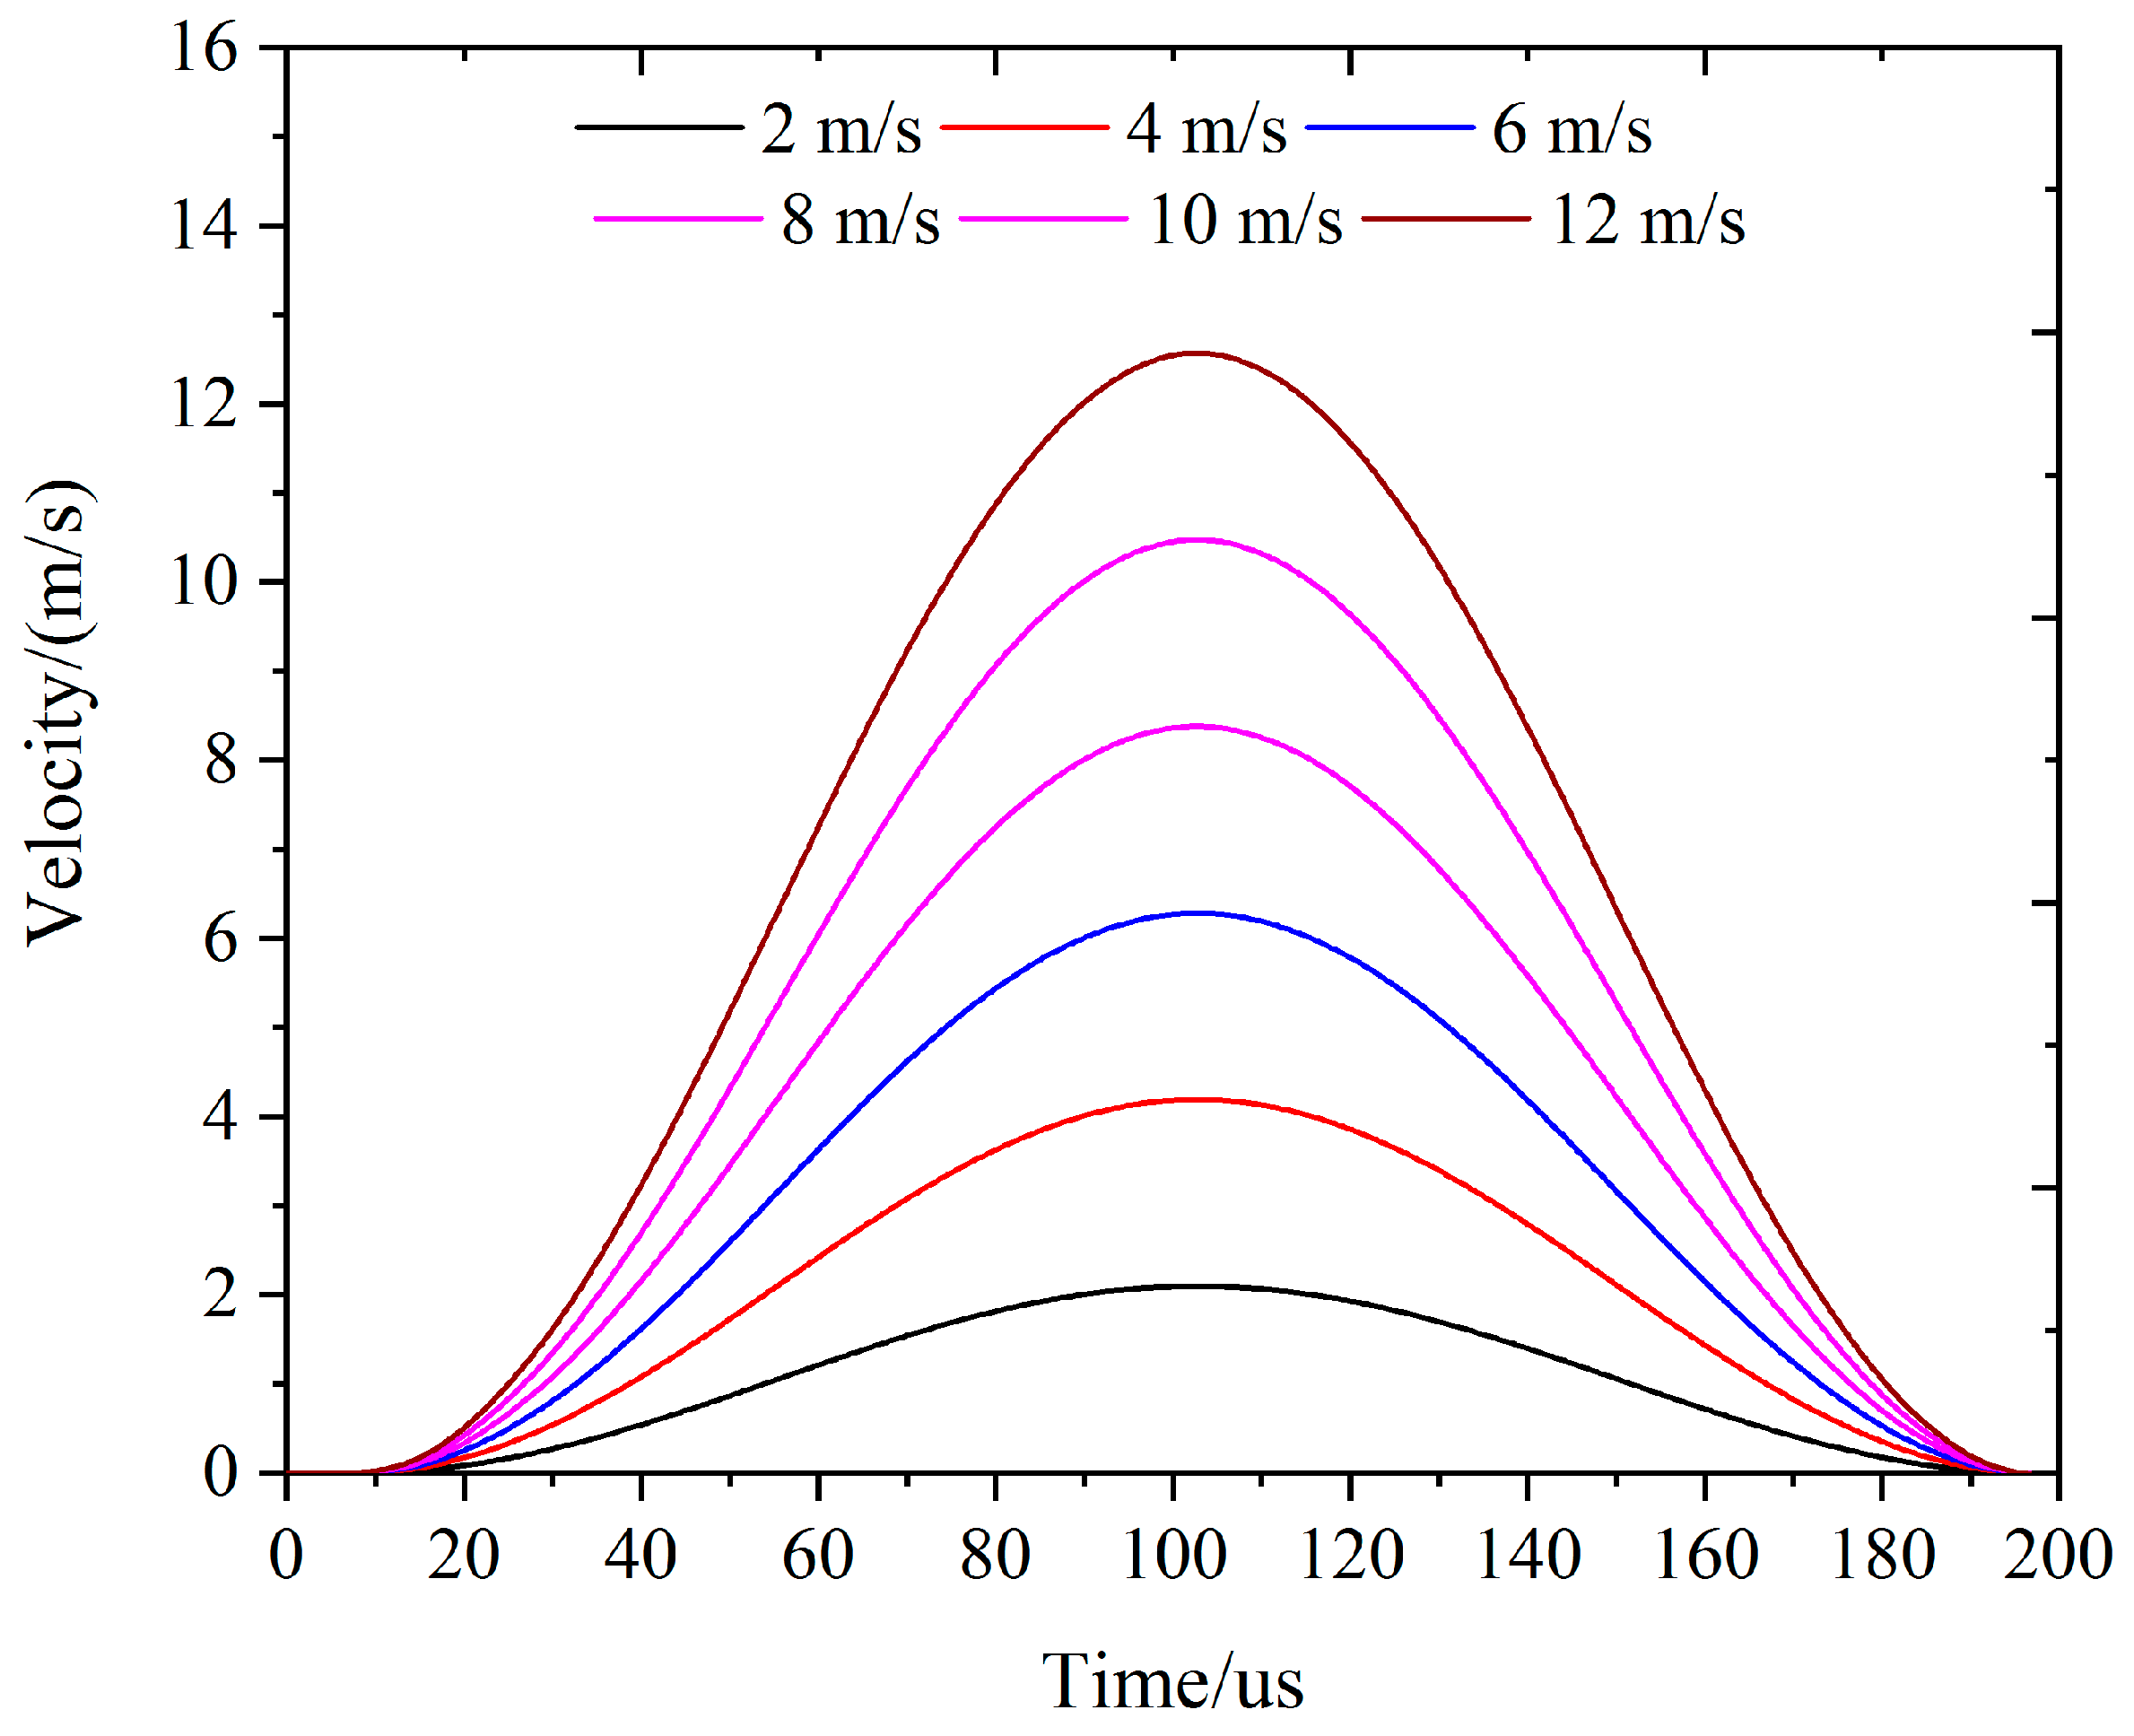
Figure 11. The duration of the incident/reflected stress waves can be estimated by monitoring the variation in the x-direction velocity of point A in Figure 11, as shown in Figure 12.
The duration from crack generation to the final failure of the specimen was 220–600 µs. Figure 13 shows the temporal and spatial variations in the hoop stresses around the hole in the period. According to 
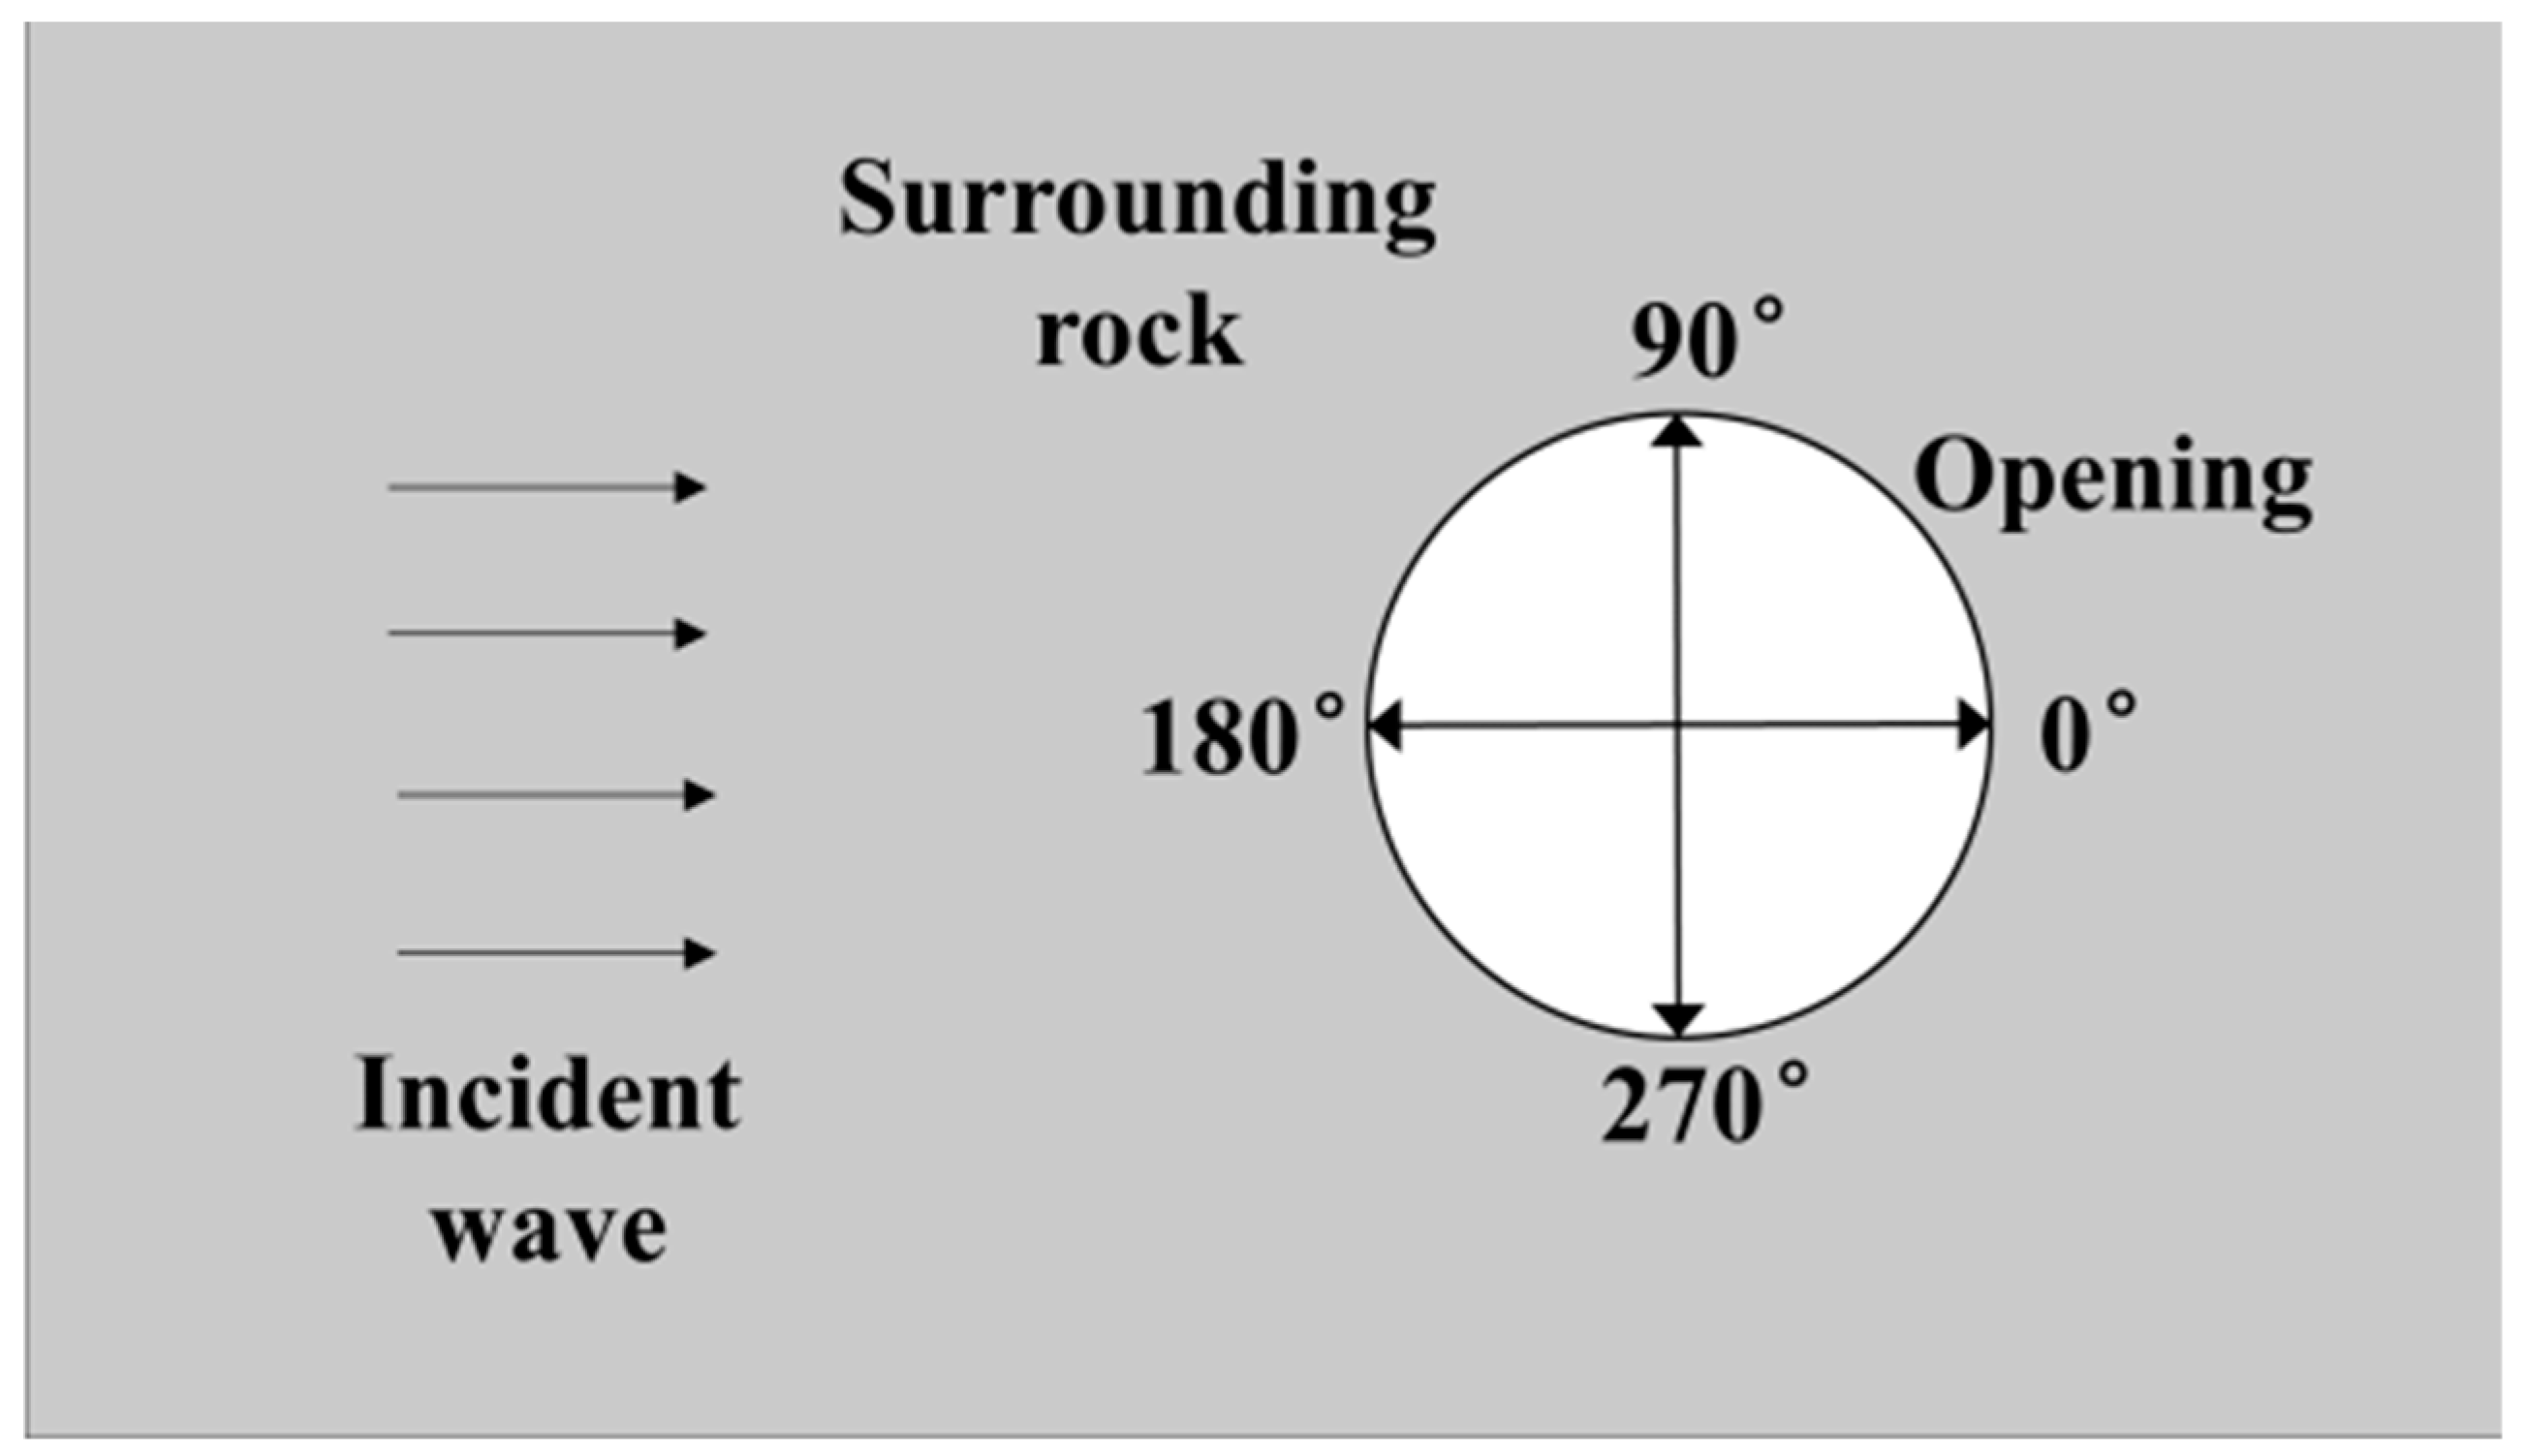
Figure 11, the x-direction velocity of point A was consistent with the incident direction during 220–360 µs. This indicates that the incident stress wave reached the hole for the first time, thereby causing hoop stress concentration at the edge of the hole. The compressive stress was concentrated at the angles of 30–150° and 210–330° with peak stress of 30 MPa. Meanwhile, the tensile stress was concentrated at angles of 150–210°, 0–30° and 330–360° with peak stress of 2 MPa. At 320 µs, a crack started to initiate at 180° from the hole edge (Figure 10). The tangential tensile stress exceeded the tensile strength of the specimen, which resulted in the generation of cracks in this area. The tensile crack was first generated at an angle of 180° because the hoop tensile stress exceeded the tensile strength of the specimen at 320 µs. There were a few cracks in the compression stress concentration area. This indicated that the compressive hoop stress did not attain its compressive strength. Correspondingly, the number of cracks increased abruptly (Figure 12) during 320–360 µs. This stage mainly manifested the generation and expansion of horizontal cracks. In the period 360–456 µs, the x-direction velocity of point A was opposite to the incident direction owing to the reflection of the stress wave transmitted to the transmission bar. Accordingly, the tensile stress concentration started to gather and form at the angles of 90° and 270° around the hole, and cracks began to be generated in this area. Therefore, the cracks started to rapidly add again (see Figure 10) during 396–456 µs. This stage is the generation and propagation of vertical cracks. During 456–545 µs (Figure 12), the stress wave was reflected again when it arrived at the incident bar. However, the stress wave amplitude reduced significantly owing to most of the energy consumption for crack propagation and friction loss. As shown in Figure 12, the tensile stress concentration was transferred to the area at the angles of 0–60° and 270–330°. However, the cracks increased less owing to the low strength of the stress wave.
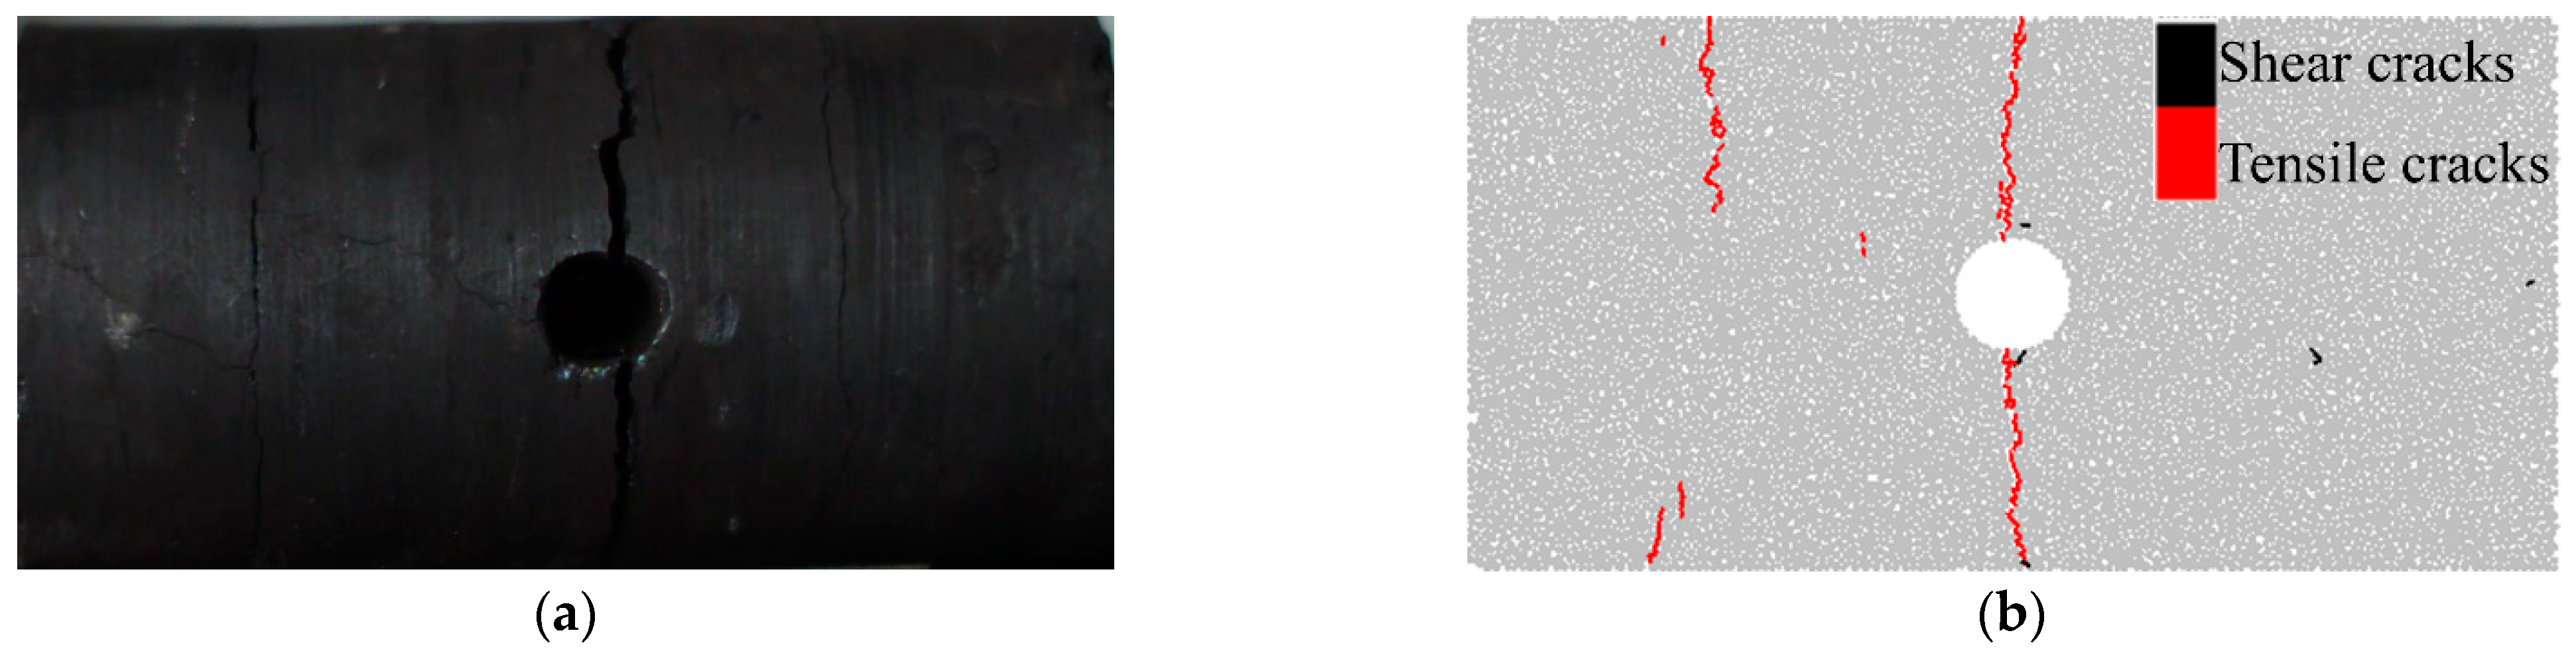
To conclude, the formation of horizontal and vertical macrocracks in the specimen is a result of the tensile hoop stress concentration around the hole caused by multiple reflections of the incident stress wave. For the first incidence, the compressive stress and tensile stresses were concentrated in the areas of 90° and 270° and in the areas of 0° and 180°, respectively. Subsequently, the tensile stress concentration area was transferred to the vertical direction owing to reflection. This resulted in tensile failure in different areas. The stress wave strength decreased gradually after multiple reflections, crack growth, and friction damping consumption, and the failure of the specimen stopped.

4.2. Variation of Force Chain

In PFC, the specimen consists of many rigid particles bonded by deformable and destructible contact. Furthermore, the failure of the specimen is manifested by contact fracture.
Tensile cracks form when the normal stress σ of the contact exceeds the normal strength limit σ c . Shear cracks are generated when the shear stress τ is larger than the shear strength limit τ c .
Tension crack: σ σ c , σ < 0 ;
Shear crack: τ τ c .
Thus, the failure of the specimen was directly caused by an increase or decrease in the contact force in the different areas.
The simulation focused on the process of stress concentration and damage around the hole caused by the incident stress wave. Therefore, the normal and shear force chains in an annular area around the hole with a thickness of 0.01 m at different times were extracted. The monitoring area is shown in Figure 11.
The normal-force evolution of the contact in the annular region is shown in Figure 14. Tensile cracks occurred only when the normal force was negative. Before the arrival of the incident stress wave, the normal force of contact was a compressive chain with a value closer to zero (Figure 14a). This was because the internal particles of the specimen after the initial formation were relatively loose with weak interactions. Subsequently, the particles began to compress each other, and the normal force increased accordingly with the effect of the stress wave at 260 µs once the front end of the stress wave arrived. The compressive stress converged from the incident end at the positions of 0° to 90° and 270° during 270–280 ms. During 290–300 µs, the compressive force at the positions of 90° and 270° gradually attained the peak (red force chain). However, no crack was generated because the compressive stress did not exceed the peak strength of the specimen. During 300–320 µs, the tensile force began to increase centrally in the region of 180° and attained a peak at 320 µs. Correspondingly, tensile cracks appeared and grew in the horizontal direction during 330–340 µs. At 400 µs, the stress wave was reflected after being transmitted to the transmission bar. The corresponding tensile stress area was transferred to the areas of 90° and 270°. Thereafter, vertical tensile cracks began to appear. Finally, macrofractures were formed in the horizontal and vertical directions at 440 µs.
Similarly, the shear force distribution of the contact in the annular area followed clear laws before and after the incidence of the stress wave. The shear force was low before the stress wave incidence (Figure 15a). It began to increase at 260 µs owing to the arrival of the stress wave at the front end. During 260–310 µs, the stress wave was transmitted from the right to the left in the specimen. Furthermore, the shear force transferred from 0° to 90° and 270° and attained the peak value. Similar to the distribution of the compressive stress peak, the shear force peak was concentrated in the regions of 90° and 270°. No shear crack appeared because the shear force did not exceed the shear strength limit. At 400 µs, the stress wave attained the left end of the sample and formed a tensile wave. A decrease in the normal compressive stress in the specimen caused a reduction in the shear force. Finally, the shear force in the entire annular region decreased significantly and was close to zero at 440 µs. However, the shear force in the regions of 0° and 180° remained constant at zero.
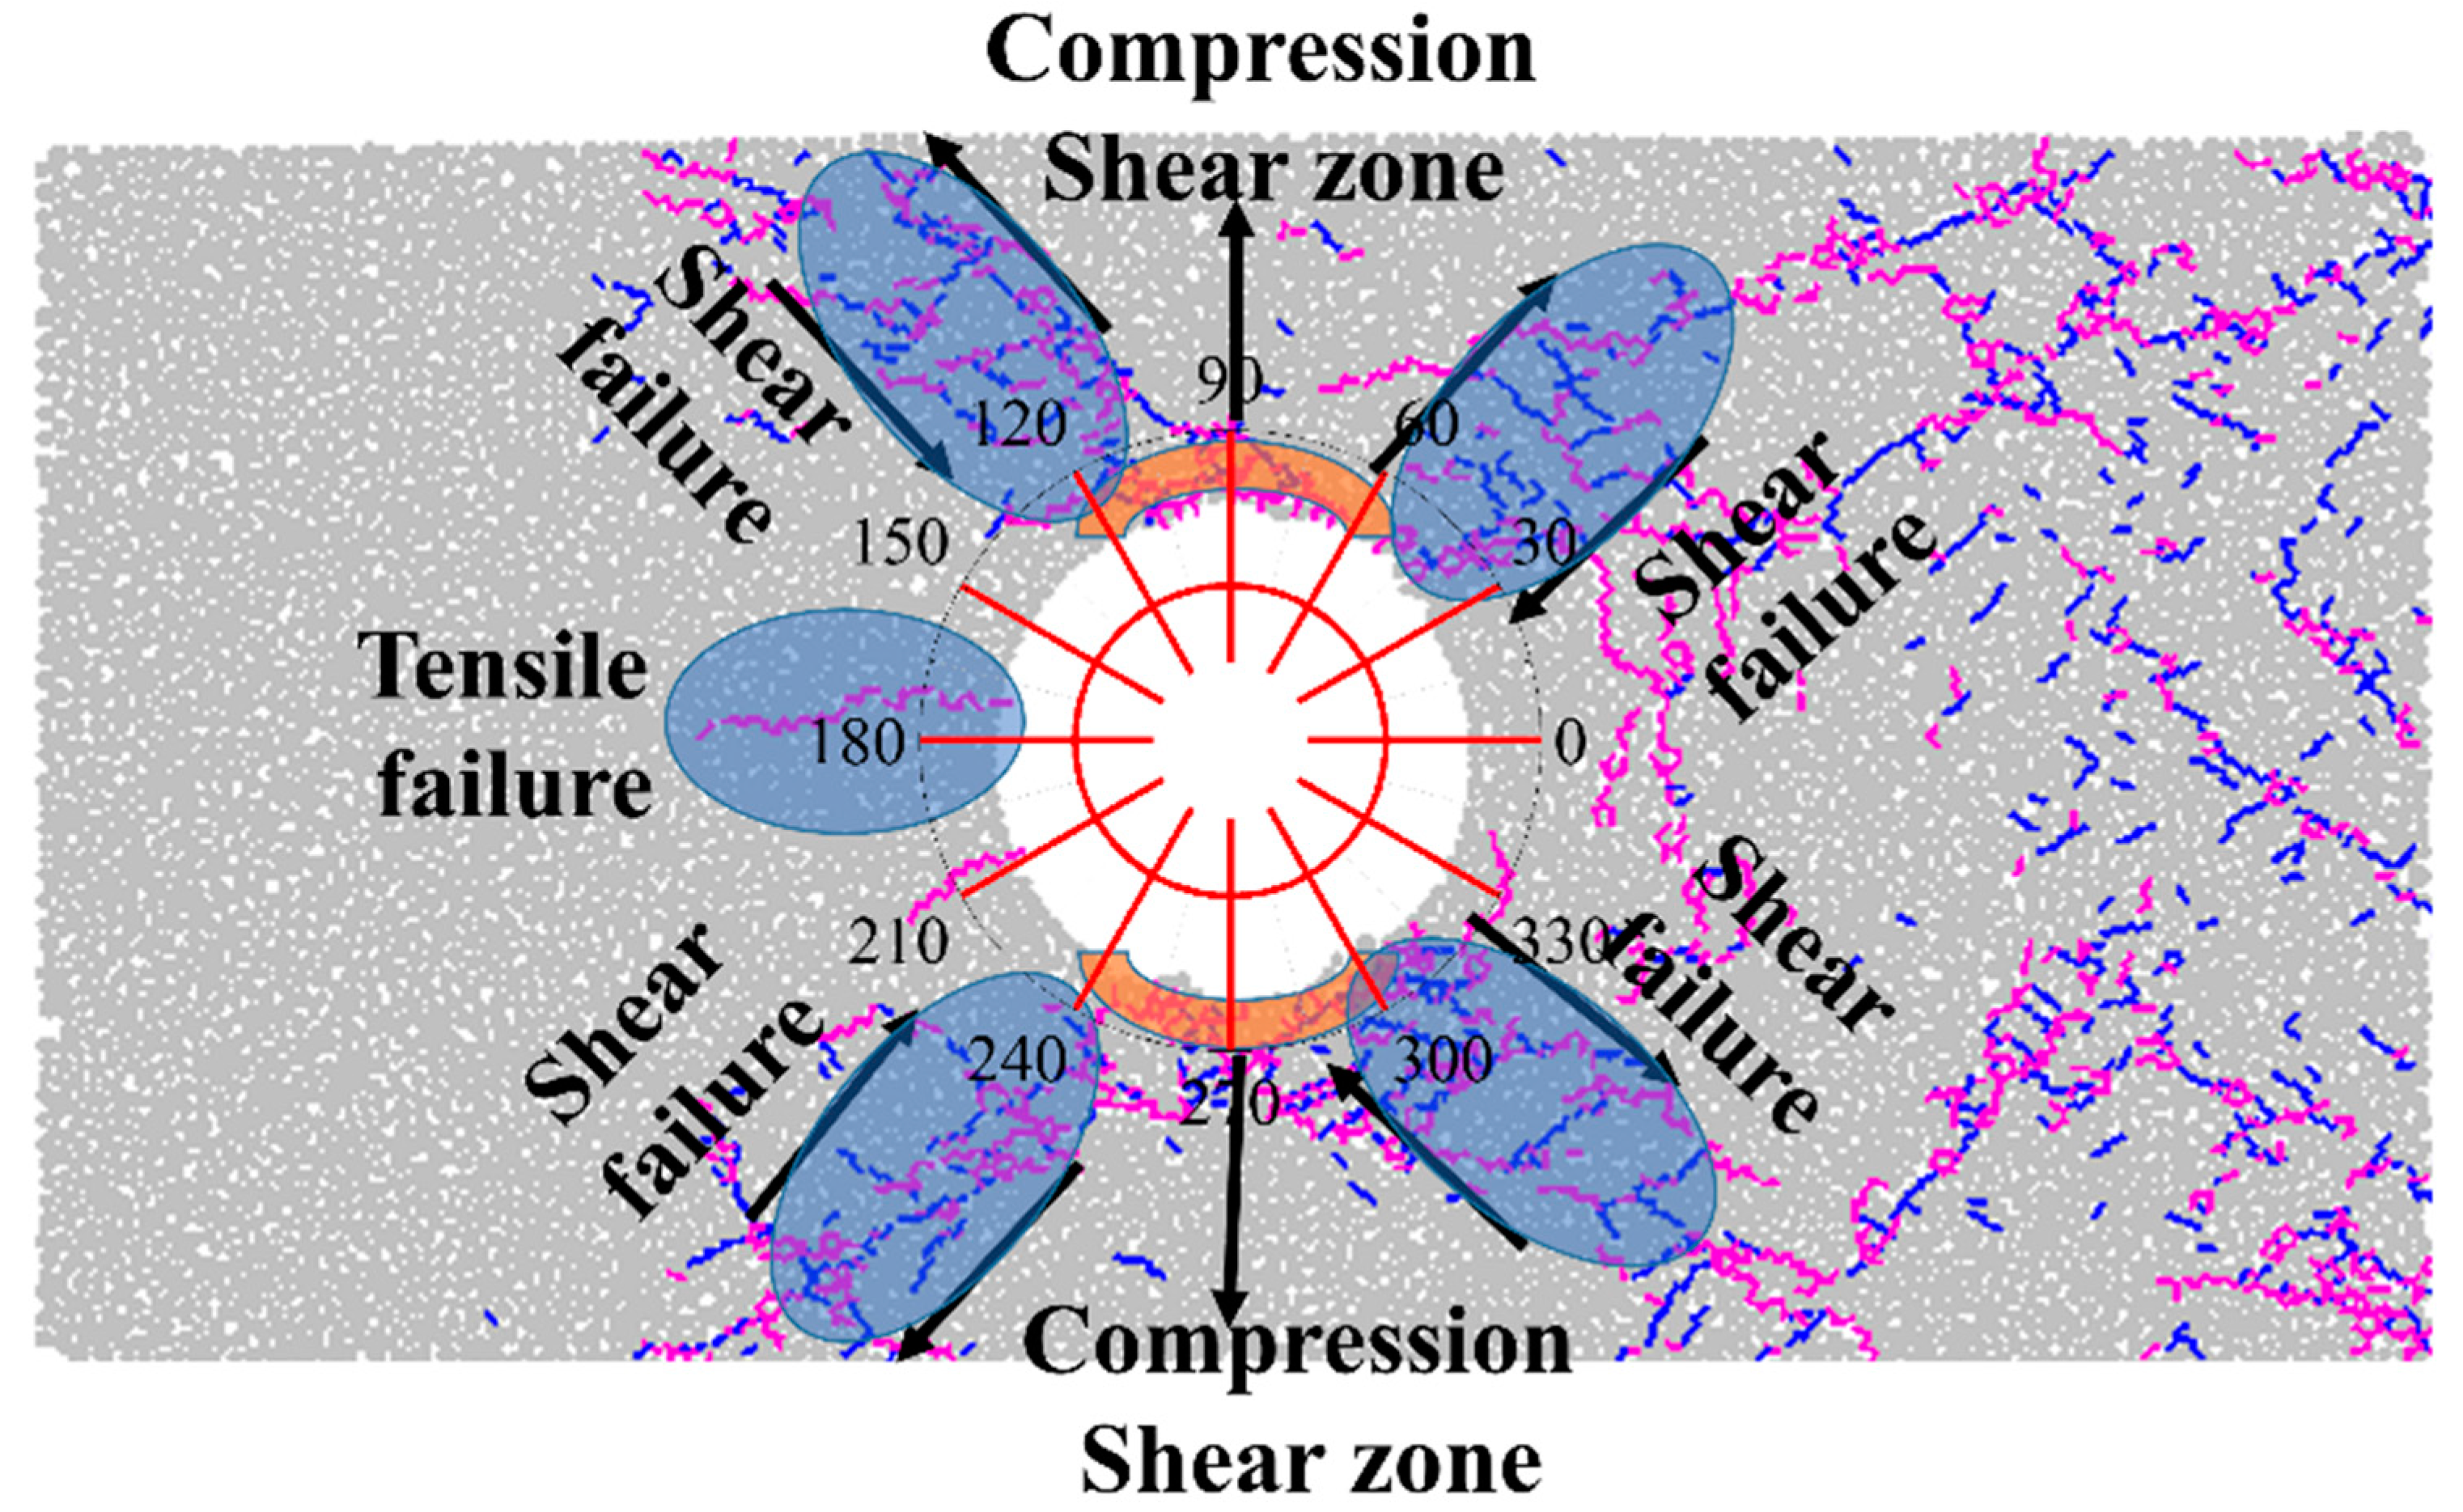
To summarize, after the compressive stress wave reached the hole, a compression shear zone was formed straightforwardly in the area perpendicular to the incident direction, and a tensile stress concentration area was formed in the area parallel to the incident direction. However, because the tensile strength of rocks is generally less than its shear strength, tensile failure is more likely to occur first around a hole parallel to the incident direction when subjected to a compressive stress wave with a lower value. It can be inferred that the compressive shear stress strength increases with increasing impact velocity, and that shear failure may occur first in the vertical direction of the hole during the process of stress wave incidence.

4.3. Energy Conversion

The variation curves of the various energies after the stress wave was transmitted to the specimen are shown in Figure 16. The strain energy was mainly stored in contact bonding. Each decrease indicated a break in the contact bond and micro-failure inside the specimen. At 212 µs, the stress wave began to be input into the specimen, the vibration speed of the specimen increased, and the kinetic energy increased abruptly. Simultaneously, the particles in the specimen were compressed compactly. This resulted in an increase in the strain energy of the contact between particles. After 260 µs, the strain energy first attained a peak and then began to fall. This indicated that the local accumulated strain energy attained the storage limits of the specimen and that microcracks appeared. Part of the strain energy released owing to the breakage of contact was converted into kinetic energy. Thereby, the kinetic energy increased, attained a peak at 274 µs, and then began to fall. At 277 µs, the strain energy began to increase because of the local stress concentration, and the local particles of the specimen were compacted. This was accompanied by the transformation of part of the kinetic energy into strain energy. Subsequently, the strain energy decreased abruptly during 300–338 µs, internal failure of the specimen occurred again, and the strain energy was released. This resulted in an increase in kinetic energy during 306–336 µs. This process occurred repeatedly until the failure of the sample stopped. Apparently, a mutual transformation between strain energy and kinetic energy occurs during the process of specimen failure, and the decrease in one type of energy would result in an increase in another type of energy. However, the decrease in energy should be larger than the increase in energy owing to the damping and friction energy consumption in the conversion process. The trends of the damping energy and friction energy maintain the level after increasing to a maximum value with the incidence of the stress wave. As a result, the final kinetic energy gradually tends to zero.

5. Discussion

5.1. The Influence of Stress Wave Vibration Frequency

The frequencies of stress waves radiated by different mine tremors are diverse because of the difference in the fracture scale during underground extraction. According to Lu’s research [34], the dominant frequency of mine tremors shifts to lower frequencies with an increase in the fracture scale. To investigate the influence of the compression wave frequency on the dynamic stress concentration around the hole, the frequency was varied (1, 2, 3, 4, and 5 kHz) while maintaining the velocity peak value at 4 m/s. That is, the wave periods were 1000 µs, 500 µs, 333 µs, 250 µs, and 200 µs, respectively (see Figure 17). The corresponding dynamic stress concentration factors (DSCFs) were calculated and compared.
The DSCF around the hole was distributed similarly and symmetrically, as shown in Figure 18a. The maximum DSCF with a positive value is at the angles of 90° and 270°, thereby showing a compressive stress concentration. Furthermore, its minimum with a negative value is at the angles of 0° and 180°, which is characterized by tensile stress concentration. Apparently, the DSCF around the hole shows a decreasing trend with a decrease in the incident wave frequency. The maximum compressive stress concentration factor (MCSCF) and maximum tensile stress concentration factor (MTSCF) decrease with frequency. Pao et al. observed that a sufficiently low frequency causes dynamic loading to become quasi-static loading [18]. According to field investigations, the low-frequency components of mine tremors induce rockbursts owing to the attenuation of high-frequency components propagating in coal and rock media. Therefore, the disturbance effect of low-frequency mine tremors on mining can be considered from the perspective of static-stress loading.

5.2. The Influence of Stress Wave Amplitude

It is established that mine tremors with higher energy can straightforwardly induce dynamic disasters compared with those with lower energy. Thus, the amplitude of the stress wave has a significant effect on the dynamic stress response of a roadway. The failure mode and stress redistribution were studied by maintaining the frequency of the stress wave at 5000 Hz and setting its peak velocity to 2, 4, 6, 8, 10, and 12 m/s (see Figure 19).
The final failure modes of the specimens at different impact velocities are illustrated in Figure 20. No cracks appeared at a velocity of 2 m/s. As the velocity increased to 4 m/s, tensile failure occurred in both horizontal and vertical directions. As the velocity increased to 6 m/s, shear failure began to occur at the angles of approximately 120° and 240° at the upper left and lower left corners around the hole. These continued to expand and converge into macro-cracks as the velocity increased to 8 m/s. When the velocity was 10 m/s, shear failure began to increase at the angles of approximately 60° and 300° in the upper right and lower right corners. X-shape shear failure occurred in the specimen when the velocity increased to 12 m/s. It can be concluded that the failure mode of the hole gradually transitioned from horizontal and vertical tensile failure to X-shape shear failure centered at the angles of 60°, 120°, 240°, and 300° with an increase in impact velocity.
The distribution of DSCF at different impact velocities is shown in Figure 21. With an increase in the impact velocity, the DSCF around the hole showed a decreasing trend (Figure 21a), the MCSCF decreased gradually, and the MTSCF first increased and then decreased. In addition, the peak value of compressive stress was essentially concentrated at the angles of 90° and 270° (i.e., in the vertical direction) under a relatively lower velocity of 2–6 m/s. As the velocity increased to 8–12 m/s, the peak value of compressive stress began to deflect to varying degrees from the vertical direction to both sides. This induced the formation of X-shape shear failure. Meanwhile, the tensile stress peak remained concentrated in the directions of 0° and 180° without significant variations. A comparison of Figure 20 and Figure 21a reveals that the area of the compressive stress peak concentration approximately corresponds to the area of shear fracture propagation. With the increase in impact velocity, the distribution of DSCF gradually approaches the butterfly-type distribution, which corresponds to the final X-shape shear failure.
To summarize, the evolution of the hoop stress and failure mode around the hole can be determined. With an increase in impact velocity, the compression shear stress and tensile stress were concentrated in the vertical and horizontal areas, respectively, of the hole subjected to the instantaneous incidence of compressive stress waves. Because the tensile strength of coal is significantly lower than its compressive strength, horizontal tensile failures were generated first under a lower impact velocity. As the impact velocity increased further, the maximum compressive stress gradually attained its compressive strength and began to deflect from the vertical direction to both sides. The hoop stress around the hole gradually approached a butterfly-type distribution. This caused the occurrence of X-shape shear failure. The failure modes in different areas around the hole are summarized in Figure 22.

5.3. The Influence of Elastic Modulus of Surrounding Coal

In this section, the influence of the elastic modulus of the surrounding coal on the dynamic stress concentration is discussed. The elastic modulus was set to 3, 6, 9, 12, and 15 GPa (see Figure 23) to ensure that the peak strength of different specimens was 26 MPa. The dynamic stress distribution and variation in the maximum stress concentration factor are shown in Figure 24.
As shown in Figure 24a, the stress concentration factor of the compressive stress area increased with an increase in the elastic modulus from 3 GPa to 6 GPa and 9 GPa. When the elastic modulus increased from 9 GPa to 12 GPa, the compressive stress concentration factor increased in the vertical direction and decreased in other areas to a certain extent. The distribution of the dynamic stress concentration factor showed no apparent variation when the elastic modulus increased from 12 GPa to 15 GPa. According to the variation in the maximum stress concentration factor in Figure 24b, the surrounding coal gradually transitioned to brittleness with an increase in the elastic modulus, which increased gradually when the MTSCF decreased. Considering the variations in the tensile and compressive stresses, the failure mode of the hole transformed from tensile to compression shear failure. Thus, the incident stress wave may have induced a stronger fracture in the condition of surrounding coal with higher brittleness because the release energy of shear failure is generally higher than that of tensile failure.

6. Conclusions

The process of cavity dynamic fractures subjected to stress waves was reproduced through laboratory experiments, to investigate the dynamic disaster mechanism of roadways induced by mine tremor disturbances. The corresponding stress redistribution and failure modes around the hole were investigated using numerical simulations. The main conclusions are as follows:
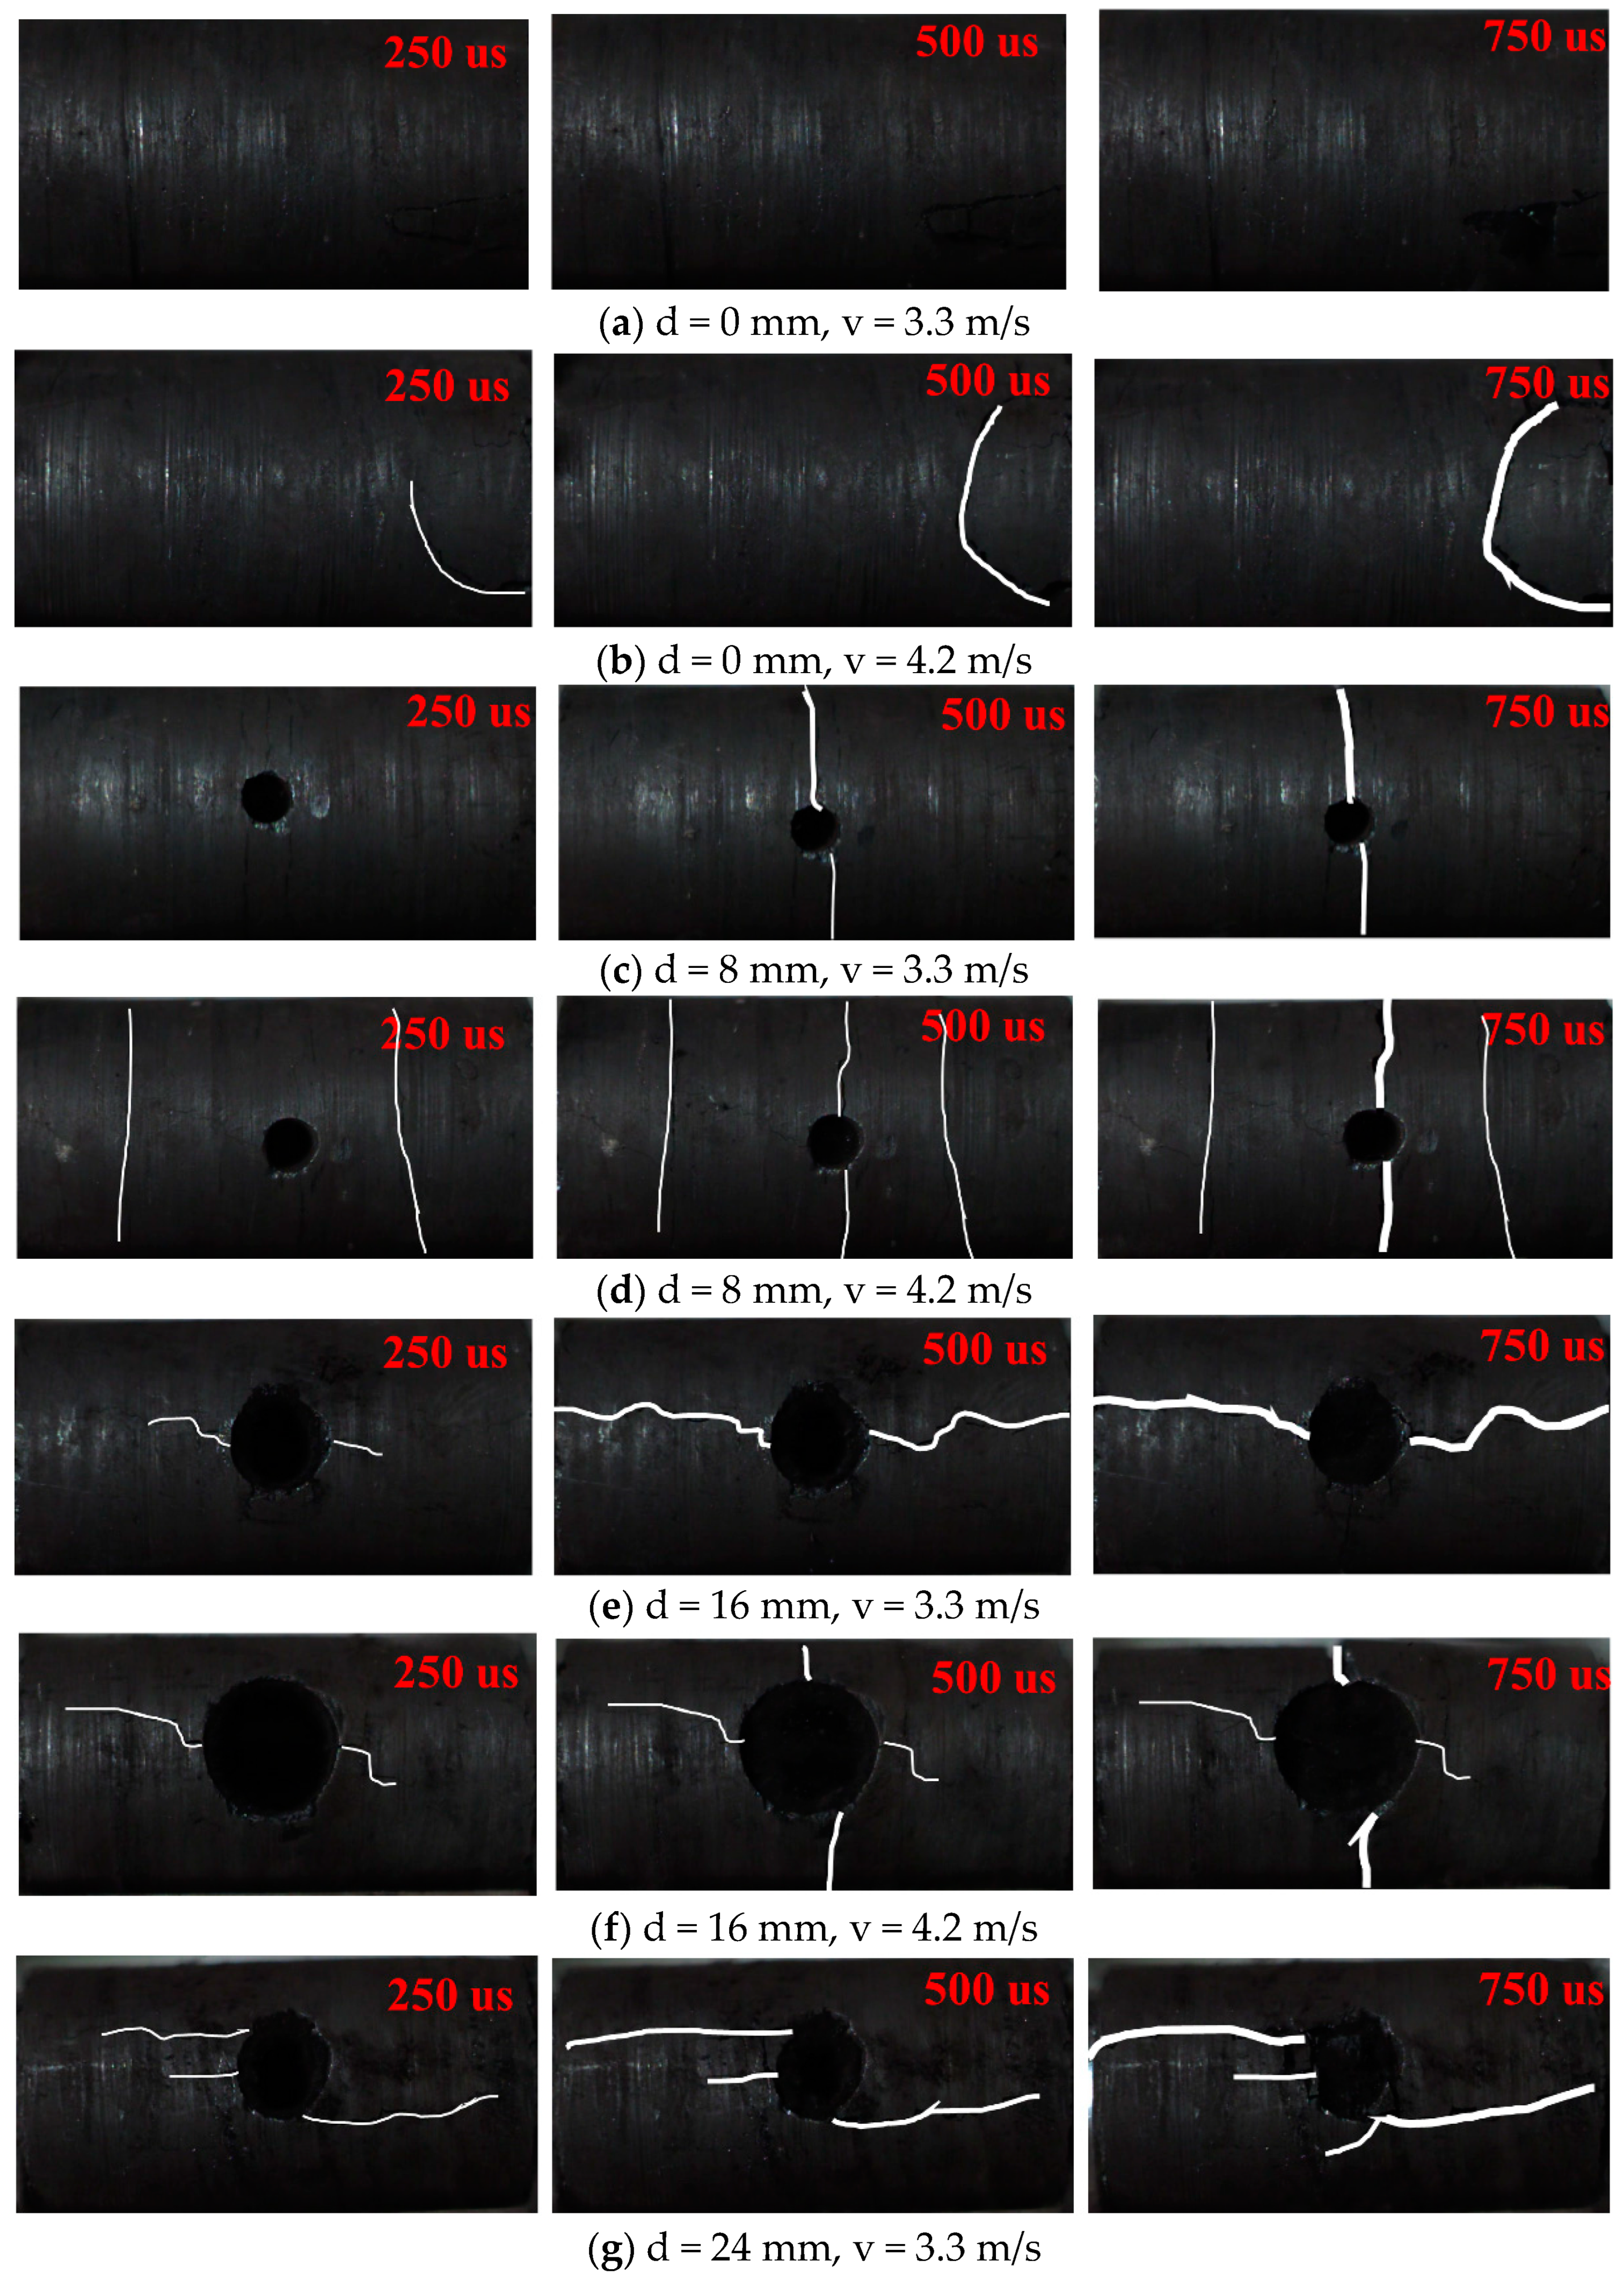
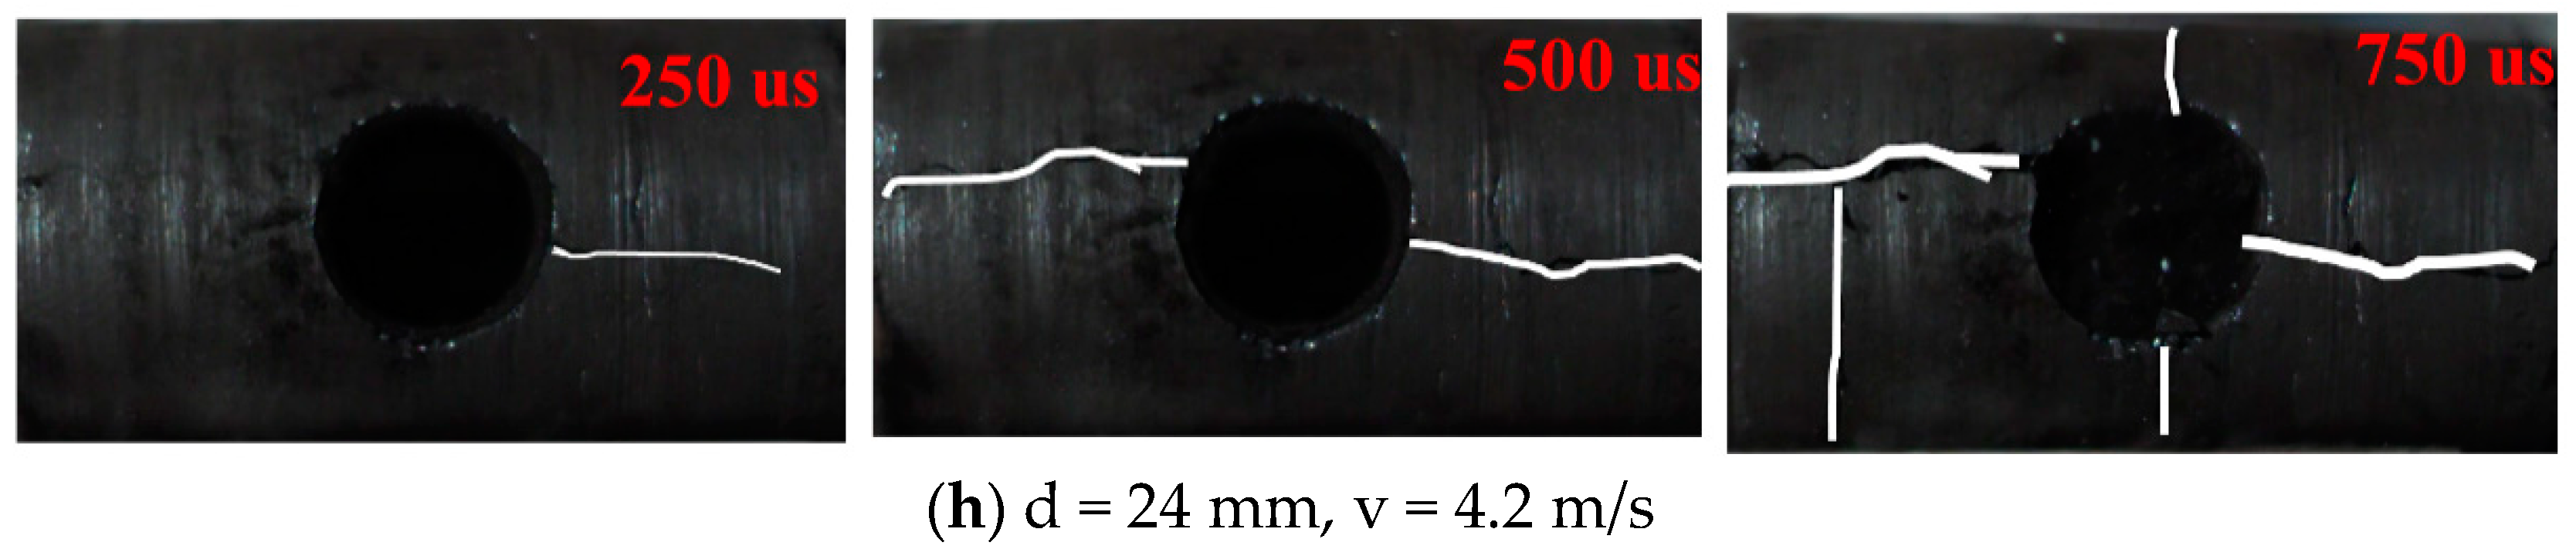
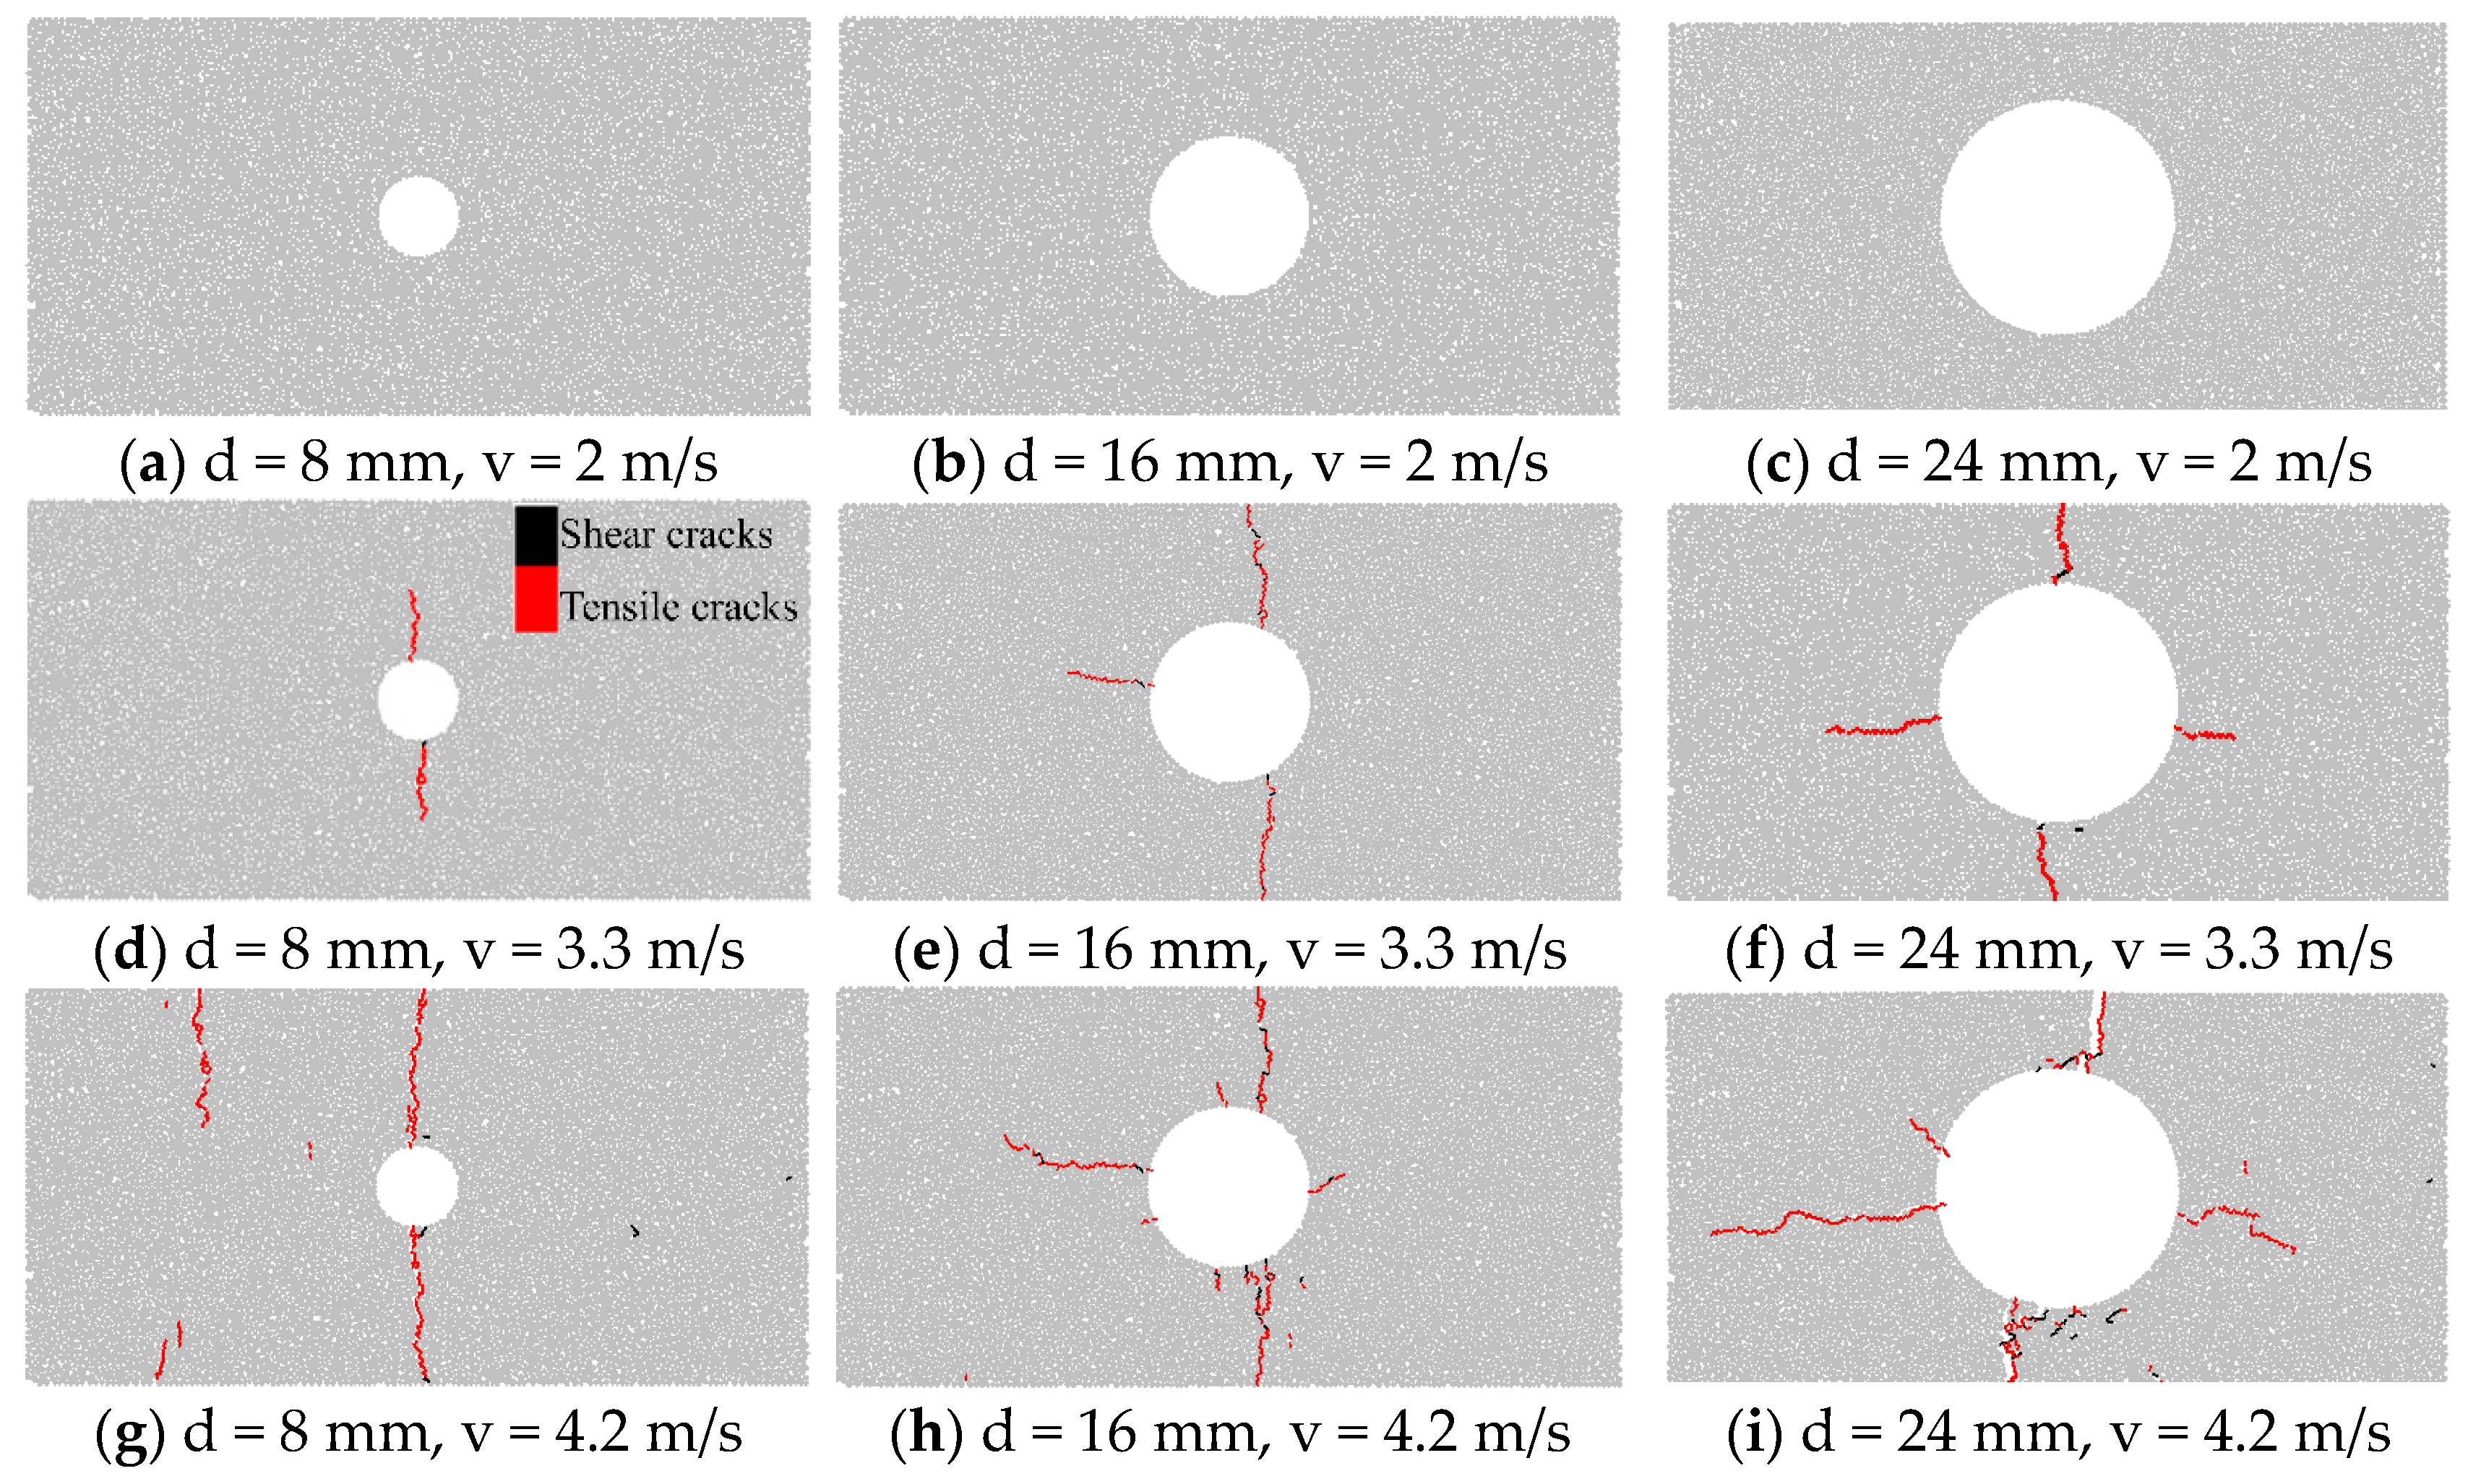
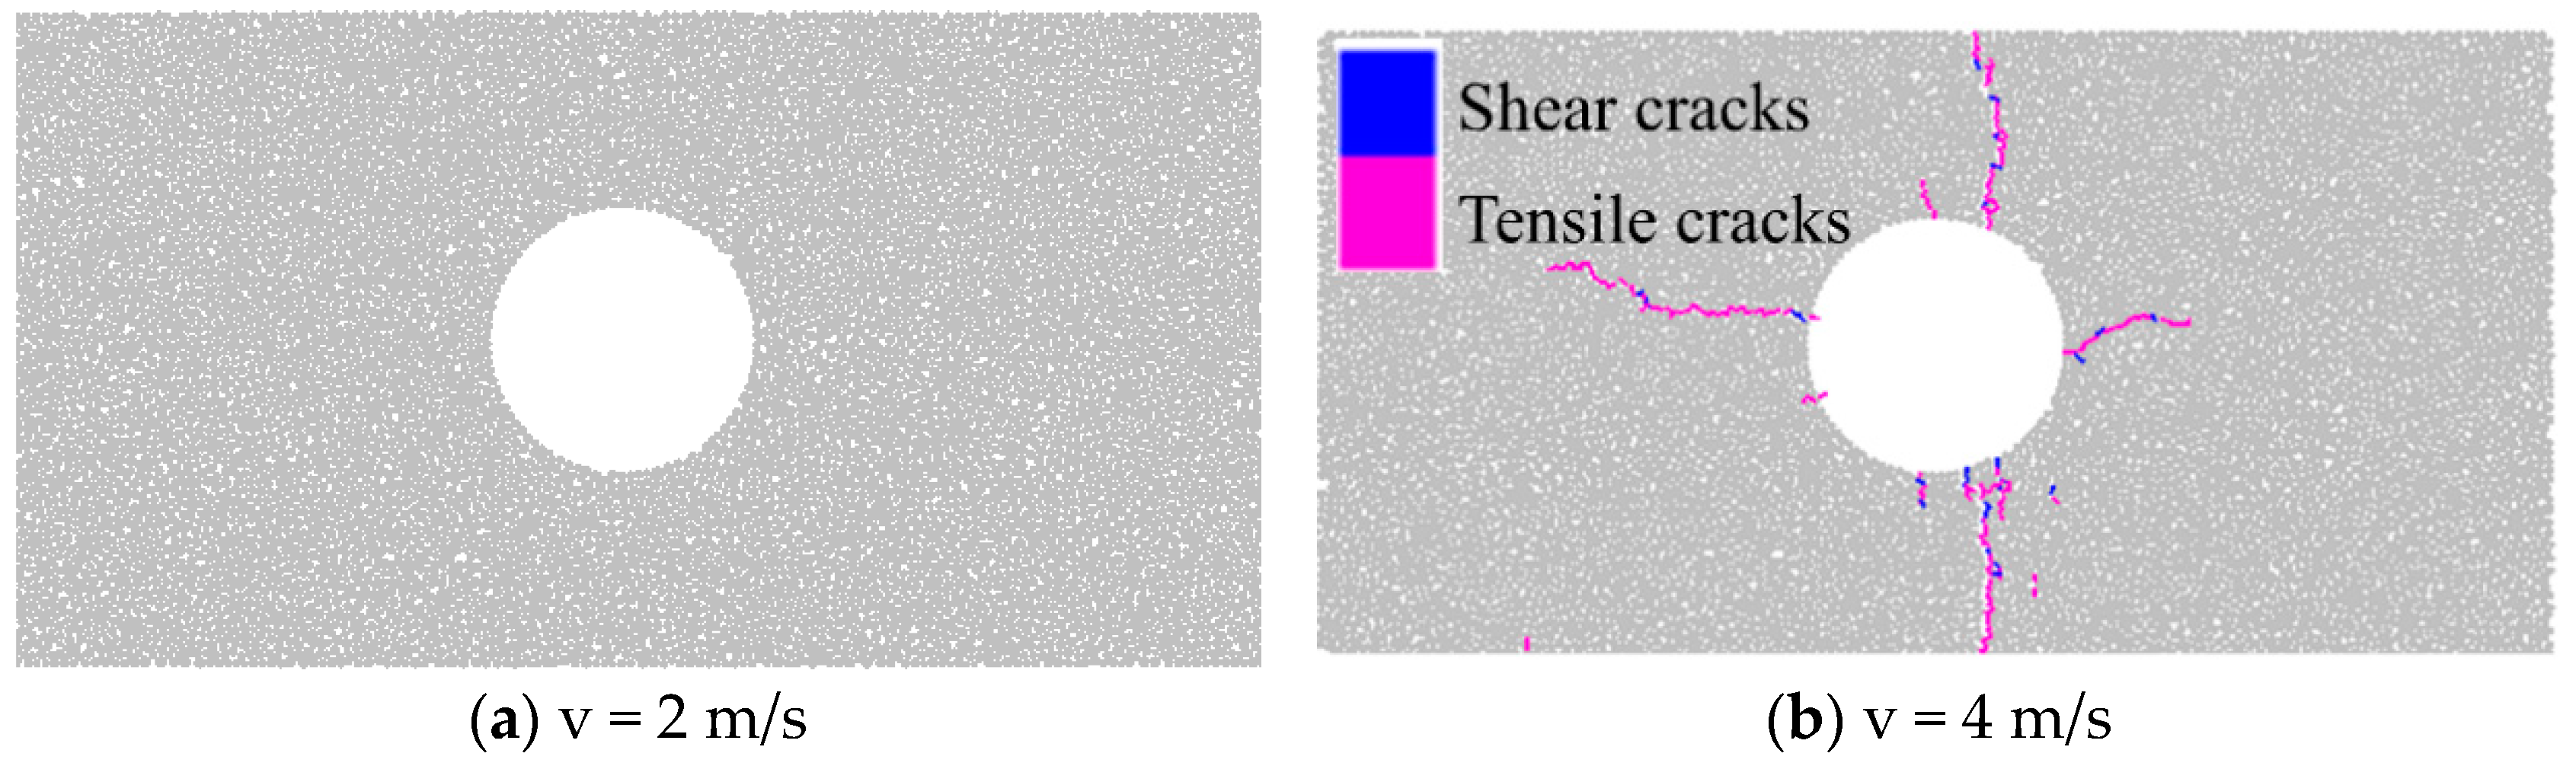
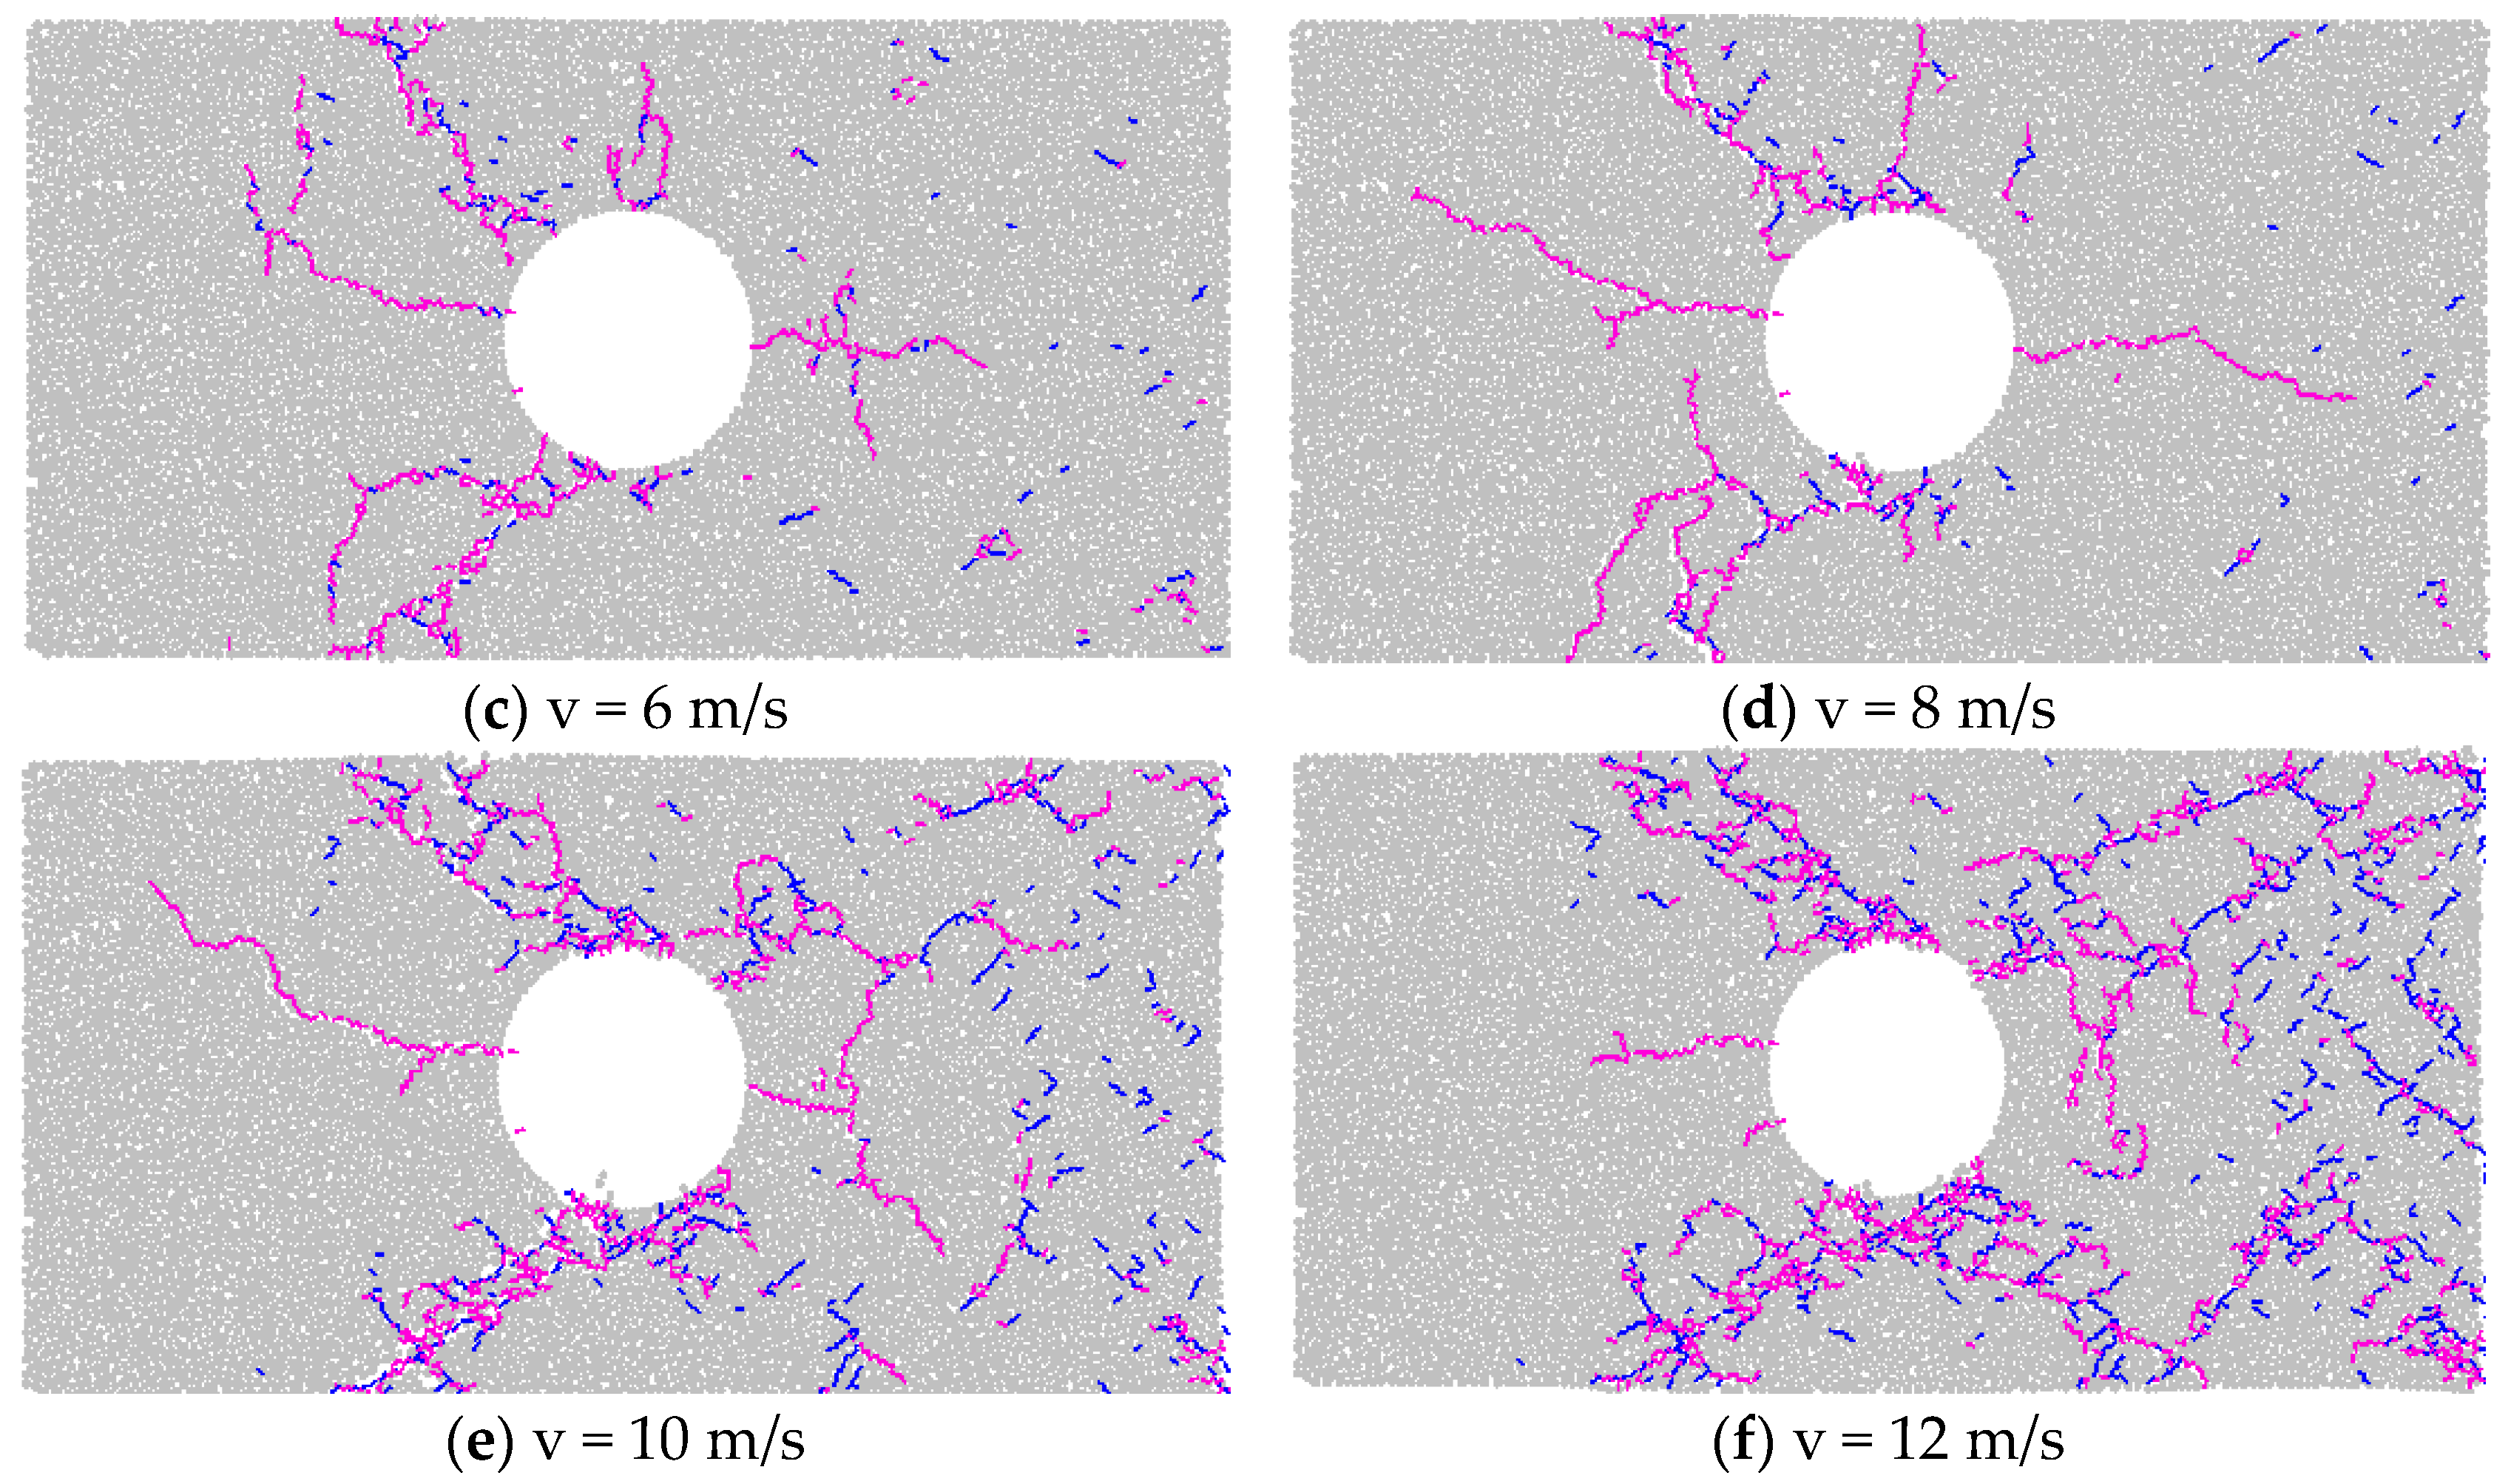
(1) According to the results of the dynamic impact experiment, the cracks in the specimens with different impact velocities and hole diameters first occurred in the regions of 0°, 180°, 90°, and 270°. This indicated that the stress was concentrated in these four areas;
(2) The instantaneous incidence of stress waves promoted stress redistribution around the hole. The tensile stress peak appeared on the incident and back sides, whereas the compressive stress peak was concentrated in the vertical direction. When the intensity of the stress wave was low, the tensile crack first appeared in the horizontal direction around the hole and then occurred in the vertical direction, owing to stress wave reflection. The process of hole failure was mainly the mutual transformation of kinetic energy and strain energy;
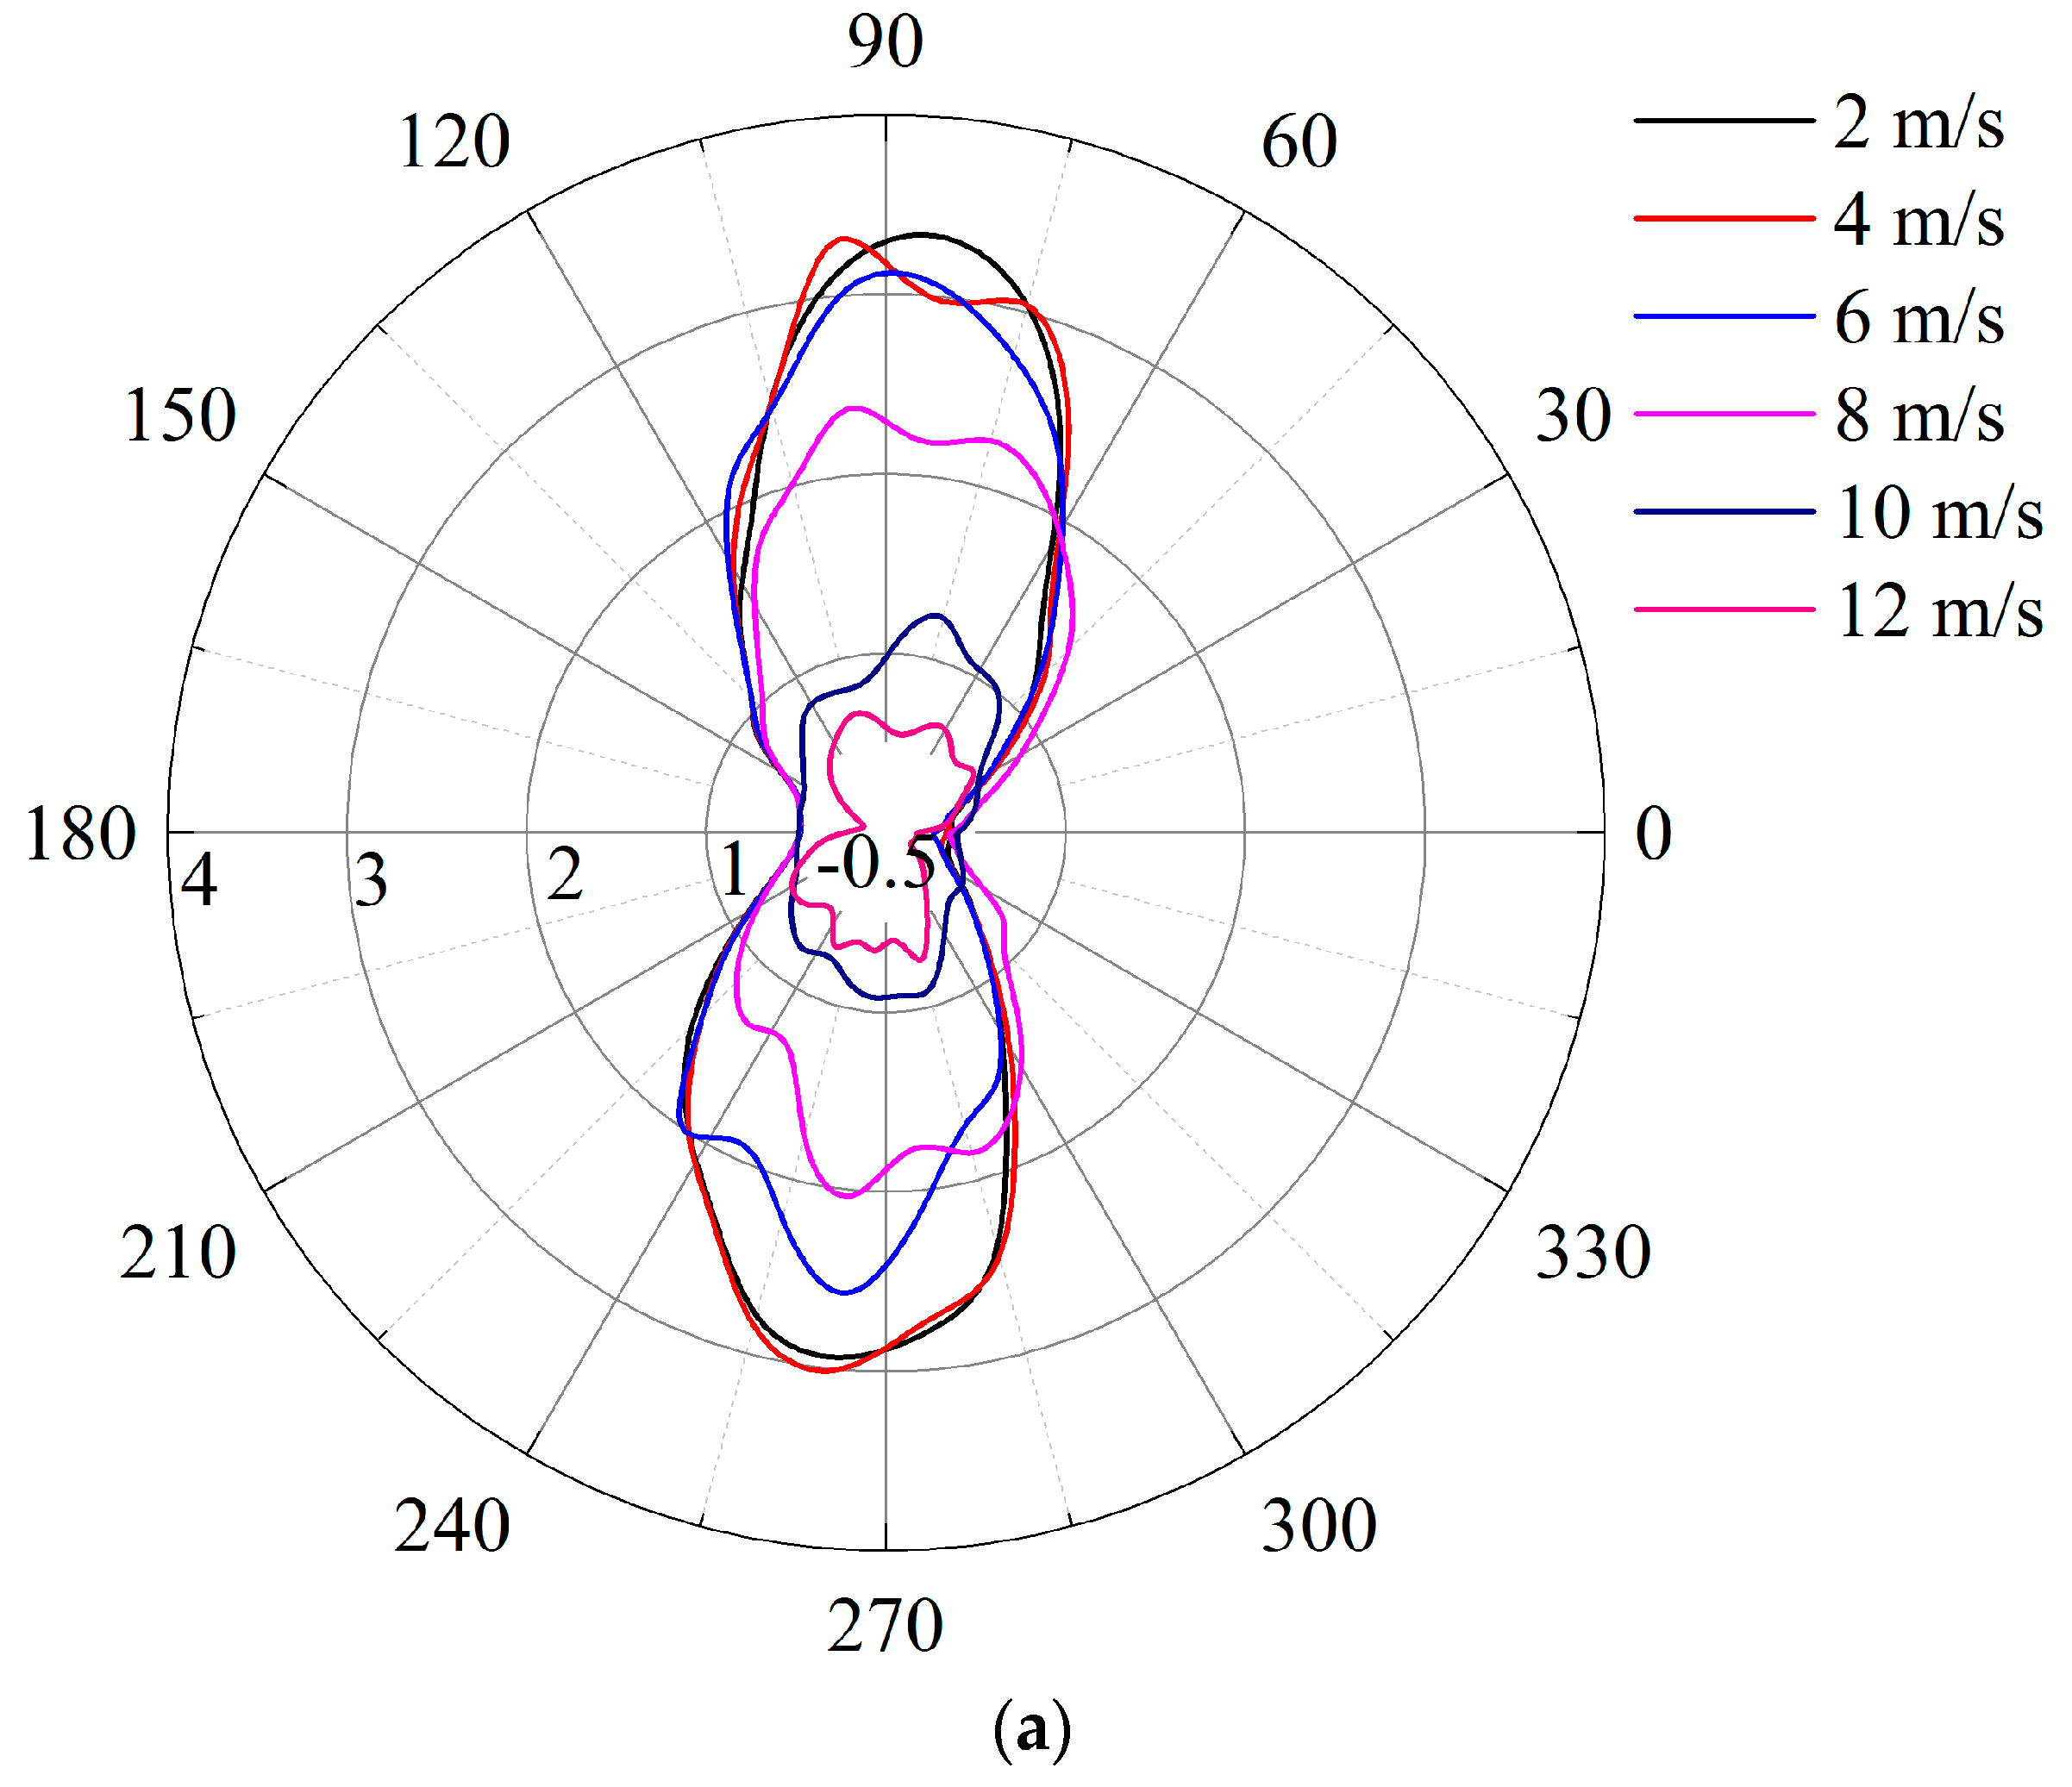
(3) With the increase in stress wave intensity, the compressive stress peak around the hole increased continuously, and its position deflected from the vertical direction to both sides. Meanwhile, the tensile stress peak remained concentrated in the horizontal direction. The hoop stress gradually evolved into a butterfly-type distribution. The corresponding failure mode of the hole transformed from horizontal and vertical tensile failure to X-shape shear failure;
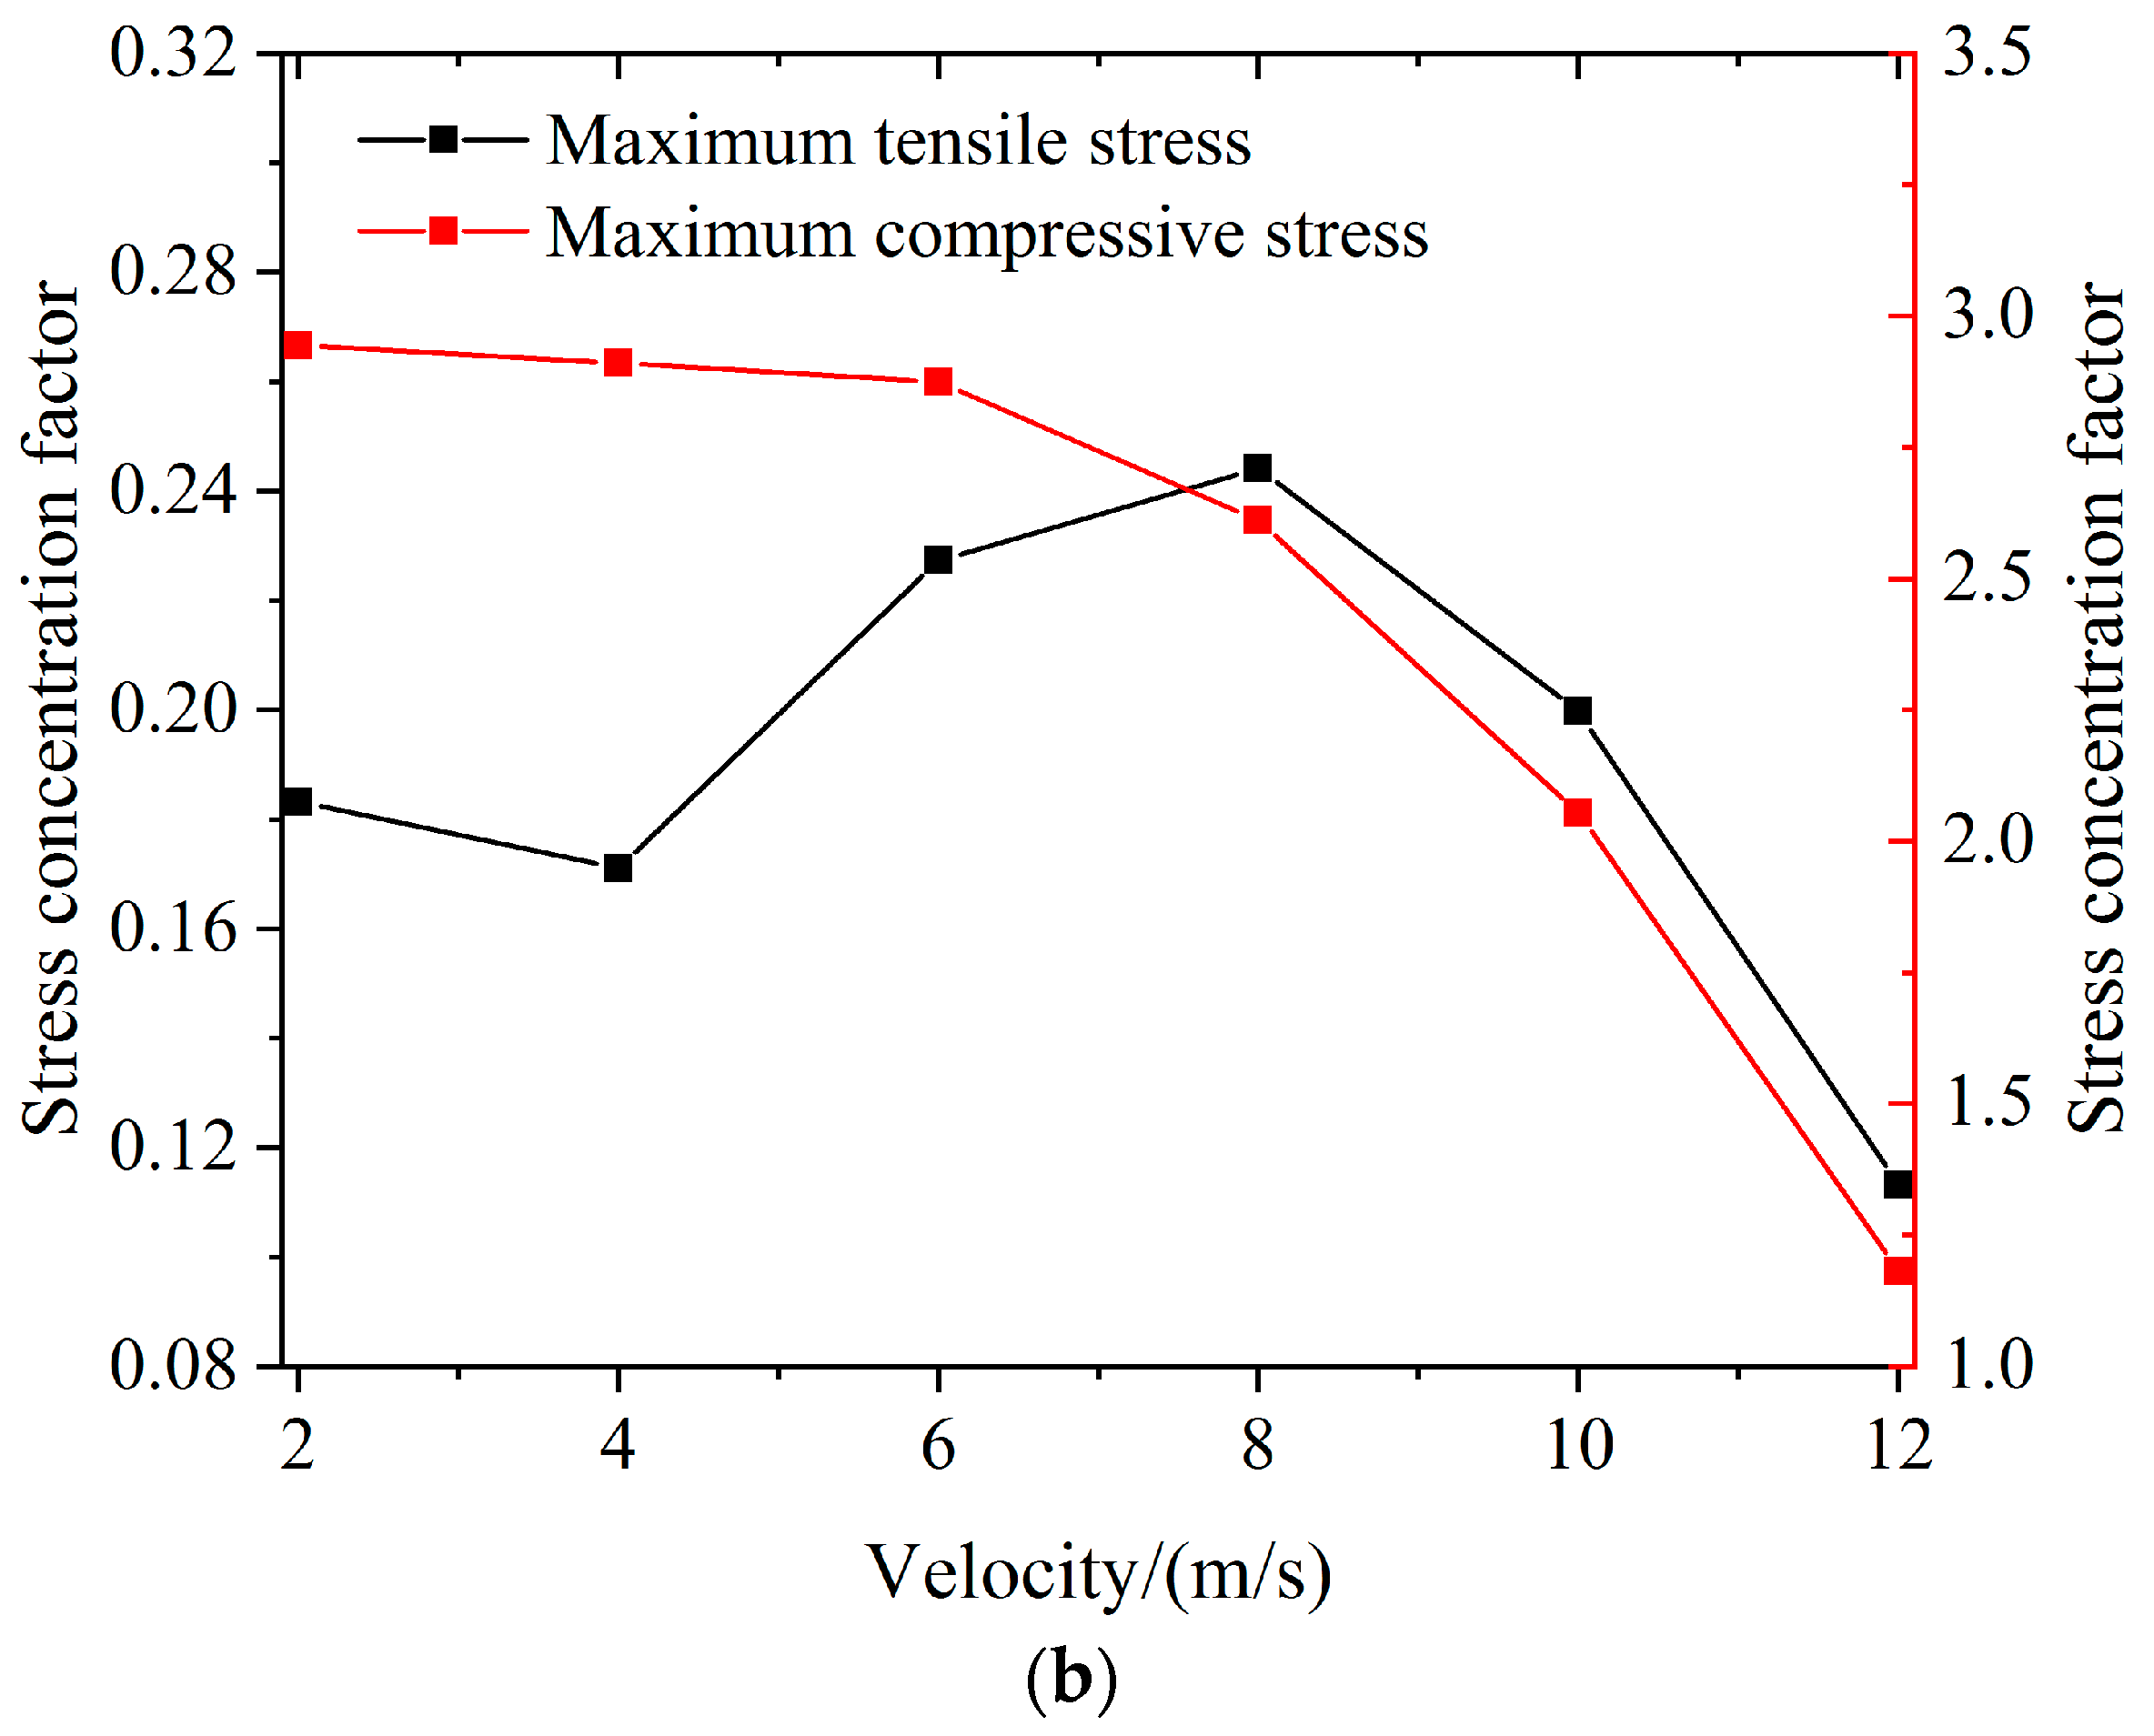
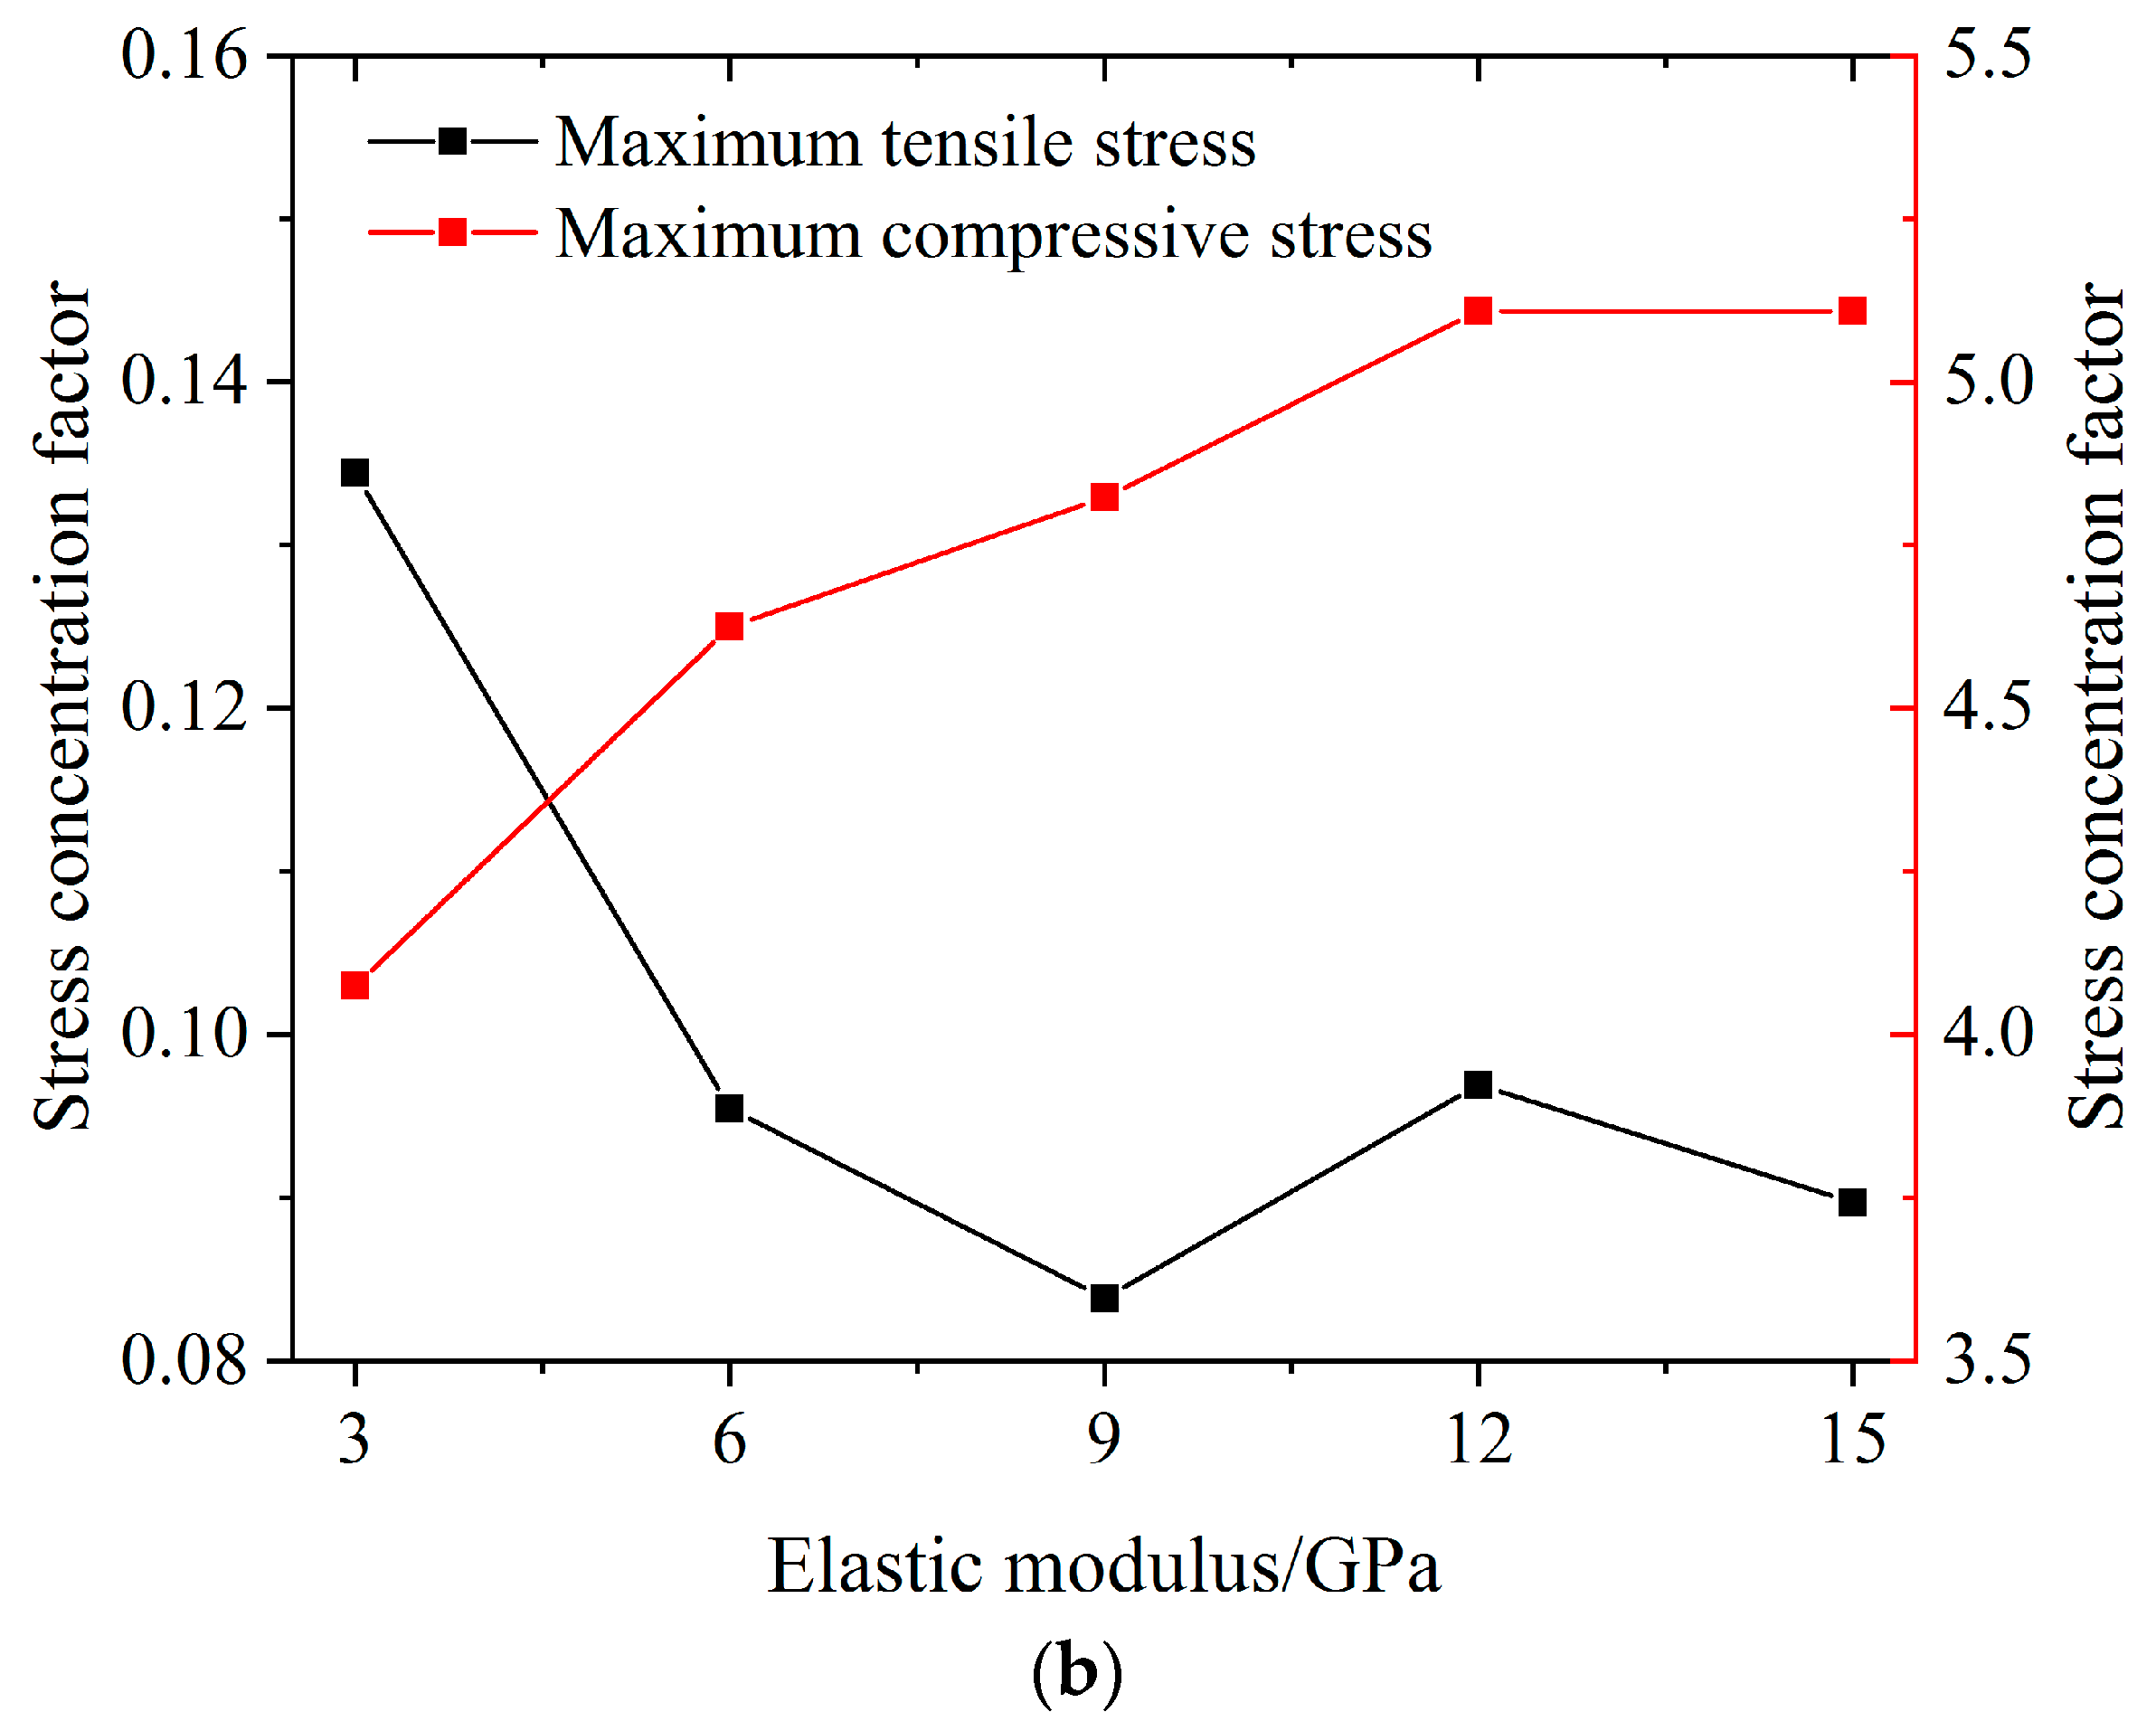
(4) The characteristics of the stress wave and the properties of the specimen had a significant impact on the dynamic stress concentration around the hole. The MCSCF decreased with an increase in the incident wave amplitude and wavelength. As the elastic modulus of the surrounding coal increased gradually, the MCSCF first increased, and then remained constant. This indicated that the damage caused by the compressive stress wave was higher.

Author Contributions

Writing—original draft preparation, Z.-L.H.; writing—review and editing, C.-P.L.; conceptualization, X.-F.Z. All authors have read and agreed to the published version of the manuscript.

Funding

This research was funded by the National Natural Science Foundation of China, the Graduate Innovation Program of China University of Mining and Technology, and a Project Funded by the Priority Academic Program Development of Jiangsu Higher Educa-tion Institutions. The grant number are [51574225], [2022WLKXJ045], and [PAPD], respectively.

Institutional Review Board Statement

Not applicable.

Informed Consent Statement

Not applicable.

Data Availability Statement

Not applicable.

Acknowledgments

We gratefully wish to acknowledge the collaborative funding support from the National Natural Science Foundation of China (51574225), the Graduate Innovation Program of China University of Mining and Technology (2022WLKXJ045), and a Project Funded by the Priority Academic Program Development of Jiangsu Higher Education Institutions (PAPD). In addition, the data in this manuscript are available from the authors. The authors declare that there is no conflict of interest regarding the publication of this paper.

Conflicts of Interest

The authors declare no conflict of interest.

References

  1. Zhang, X.; Feng, X.P.; Li, D.H.; Yin, F.L.; Yi, L. Diverse rupture processes of the 2014 Kangding, China, earthquake doublet (MW 6.0 and 5.7) and driving mechanisms of aftershocks. Tectonophysics 2021, 820, 229118. [Google Scholar] [CrossRef]
  2. Hosseinzadehsabeti, E.; Ferr´e, E.C.; Persaud, P.; Fabbri, O.J.; Geissman, W. The rupture mechanisms of intraslab earthquakes: A multiscale review and re-evaluation. Earth-Sci. Rev. 2021, 221, 103782. [Google Scholar] [CrossRef]
  3. Wasilewski, S. Gas-dynamic phenomena caused by rock mass tremors and rock bursts. J. Min. Sci. Technol. 2020, 30, 8. [Google Scholar] [CrossRef]
  4. Kuzniar, K.; Zajac, M. Numerical evaluation of natural vibration frequencies of thermo-modernized apartment buildings subjected to mining tremors. Procedia Eng. 2017, 199, 296–301. [Google Scholar] [CrossRef]
  5. Cielik, J.; Burtan, Z.; Chlebowski, D. Geomechanical analysis of location and conditions for mining-induced tremors in LGOM copper mines. J. Sustain. Min. 2021, 16, 94–103. [Google Scholar] [CrossRef]
  6. Durrheim, R.J. Mitigating the risk of rockbursts in the deep hard rock mines of South Africa: 100 years of research. In Proceedings of the Symposium ‘‘100 Years of Mining Research”, Phoenix, AZ, USA, 10 August 2010; pp. 156–171. [Google Scholar]
  7. Feng, F.; Li, X.B.; Rostami, J.; Li, D.Y. Modeling hard rock failure induced by structural planes around deep circular tunnels. Eng. Fract. Mech. 2019, 205, 152–174. [Google Scholar] [CrossRef]
  8. Timoshenko, S.; Goodier, J.N. Theory of Elasticity; McGrawHill Book Company: New York, NY, USA, 1951. [Google Scholar]
  9. Zhu, Q.Q.; Li, D.Y.; Han, Z.Y.; Li, X.B.; Zhou, Z.L. Mechanical properties and fracture evolution of sandstone specimens containing different inclusions under uniaxial compression. Int. J. Rock Mech. Min. Sci. 2019, 115, 33–47. [Google Scholar] [CrossRef]
  10. Karl, T.; Richart, F.E. Stresses in rock about cavities. Geotechnique 1952, 3, 57–90. [Google Scholar] [CrossRef]
  11. Li, D.Y.; Zhu, Q.Q.; Zhou, Z.L.; Li, X.B.; Ranjith, P.G. Fracture analysis of marble specimens with a hole under uniaxial compression by digital image correlation. Eng. Fract. Mech. 2017, 183, 109–124. [Google Scholar] [CrossRef]
  12. Zhao, K.; Liu, C.W.; Zhang, G.L. Solution for perimeter stresses of rocks around a rectangular chamber using the complex function of elastic mechanics. J. Min. Saf. Eng. 2007, 24, 361–365. (In Chinese) [Google Scholar]
  13. Exadaktylos, G.E.; Stavropoulou, M.C. A closed form elastic solution for stresses and displacements around tunnels. Int. J. Rock Mech. Min. Sci. 2002, 39, 905–916. [Google Scholar] [CrossRef]
  14. Gercek, H. An elastic solution for stresses around tunnels with conventional shapes. Int. J. Rock Mech. Min. Sci. 1997, 34, 96.e1. [Google Scholar] [CrossRef]
  15. Martini, C.D.; Read, R.S.; Martino, J.B. Observations of brittle failure around a circular test tunnel. Int. J. Rock Mech. Min. Sci. 1997, 34, 1065–1073. [Google Scholar] [CrossRef]
  16. Mitelman, A.; Elmo, D. Analysis of tunnel support design to withstand spalling induced by blasting. Tunn. Undergr. Space Technol. 2016, 51, 354–361. [Google Scholar] [CrossRef]
  17. Schuler, H.; Mayrhofer, C.; Thoma, K. Spall experiments for the measurement of the tensile strength and fracture energy of concrete at high strain rates. Int. J. Impact Eng. 2006, 32, 1635–1650. [Google Scholar] [CrossRef]
  18. Xu, K.; Lu, Y. Numerical simulation study of spallation in reinforced concrete plates subjected to blast loading. Comput. Struct. 2006, 84, 431–438. [Google Scholar] [CrossRef]
  19. Weerheijm, J.; Doormaal, J. Tensile failure of concrete at high loading rates: New test data on strength and fracture energy from instrumented spalling tests. Int. J. Impact Eng. 2007, 34, 609–626. [Google Scholar] [CrossRef]
  20. Xu, P.; Yang, R.S.; Guo, Y.; Chen, C.; Zhang, Y.T. Experimental and numerical investigation of the interaction between blast wave and precrack in a defected material. Appl. Opt. 2019, 58, 9718–9727. [Google Scholar]
  21. Fan, Z.F.; Zhang, J.C.; Xu, H. Theoretical study of the dynamic response of a circular lined tunnel with an imperfect interface subjected to incident SV-waves. Comput. Geotech. 2019, 110, 308–318. [Google Scholar] [CrossRef]
  22. Feng, J.J.; Wang, E.Y.; Huang, Q.S.; Ding, H.C.; Zhang, X.Y. Experimental and numerical study of failure behavior and mechanism of coal under dynamic compressive loads. Int. J. Min. Sci. Technol. 2020, 30, 613–621. [Google Scholar] [CrossRef]
  23. Tao, M.; Li, Z.W.; Cao, W.Z.; Li, X.B.; Wu, C.Q. Stress redistribution of dynamic loading incident with arbitrary waveform through a circular cavity. Int. J. Numer. Anal. Methods 2019, 43, 1279–1299. [Google Scholar] [CrossRef]
  24. Liu, Z.; Ju, X.; Wu, C.; Liang, J. Scattering of plane p1waves and dynamic stress concentration by a lined tunnel in a fluid-saturated poroelastic half-space. Tunn. Undergr. Space Technol. 2017, 67, 71–84. [Google Scholar] [CrossRef]
  25. Qi, H.; Chu, F.; Guo, J. Dynamic stress concentration of an elliptical cavity in a semi-elliptical hill under SH-waves. Earthq. Eng. Eng. Vib. 2021, 20, 347–359. [Google Scholar]
  26. Yang, Z.; Xiao, Y.; Yang, Y.; Sun, M.; Deng, H. Dynamic stress analysis of scattering by a circular cavity in a radially inhomogeneous unbounded space under sh waves. J. Mech. 2021, 37, 609–615. [Google Scholar] [CrossRef]
  27. Li, Z.; Tao, M.; Du, K.; Cao, W.; Wu, C. Dynamic stress state around shallow-buried cavity under transient p wave loads in different conditions. Tunn. Undergr. Space Technol. 2020, 97, 103228.1–103228.12. [Google Scholar] [CrossRef]
  28. He, C.; Zhou, S.; Guo, P.; Di, H.; Yu, F. Theoretical modelling of the dynamic interaction between twin tunnels in a multi-layered half-space. J. Sound Vib. 2019, 456, 65–85. [Google Scholar] [CrossRef]
  29. Li, X.B.; Li, C.J.; Cao, W.Z.; Tao, M. Dynamic stress concentration and energy evolution of deep-buried tunnels under blasting loads. Int. J. Rock Mech. Min. 2018, 104, 131–146. [Google Scholar] [CrossRef]
  30. Castro-Filgueira, U.; Alejano, L.R.; Ivars, D.M. Particle flow code simulation of intact and fissured granitic rock samples. J. Rock Mech. Geotech. Eng. 2020, 12, 960–974. [Google Scholar] [CrossRef]
  31. Xu, W.B.; Cao, P.W. Fracture behaviour of cemented tailing backfill with pre-existing crack and thermal treatment under three-point bending loading: Experimental studies and particle flow code simulation. Eng. Fract. Mech. 2018, 195, 129–141. [Google Scholar] [CrossRef]
  32. Luo, Y.; Wang, G.; Li, X.B.; Liu, T.T.; Mandal, A.K.; Xu, M.N. Analysis of energy dissipation and crack evolution law of sandstone under impact load. Int. J. Rock Mech. Min. Sci. 2020, 132, 104359. [Google Scholar] [CrossRef]
  33. Yuan, W.; Wang, W.; Su, X.B.; Li, J.X.; Li, Z.H.; Wei, L.; Chang, J.F. Numerical study of the impact mechanism of decoupling charge on blasting-enhanced permeability in low-permeability sandstones. Int. J. Rock Mech. Min. Sci. 2018, 106, 300–310. [Google Scholar] [CrossRef]
  34. Lu, C.P.; Liu, Y.; Wang, H.Y.; Liu, P.F. Microseismic signals of double-layer hard and thick igneous strata separation and fracturing. Int. J. Coal Geol. 2016, 160–161, 28–41. [Google Scholar] [CrossRef]
Figure 1. The flowchart of the study.
Applsci 12 10350 g001
Figure 2. SHPB apparatus and monitoring system.
Applsci 12 10350 g002
Figure 3. Schematic of incident stress wave.
Applsci 12 10350 g003
Figure 4. Process of dynamic rupture around the hole (The length and width of the white line represent the crack development and the crack width, respectively).
Applsci 12 10350 g004aApplsci 12 10350 g004b
Figure 5. Schematic diagram of SHPB simulation model.
Applsci 12 10350 g005
Figure 6. Failure mode and stress–strain of calibrations. (a) Failure modes, (b) Stress–strain.
Applsci 12 10350 g006
Figure 7. Experimental and numerical stresses of the incident bar.
Applsci 12 10350 g007
Figure 8. Comparison of failure modes between experiment and simulation (d = 8 mm, v = 4.2 m/s). (a) Experiment, (b) Simulation.
Applsci 12 10350 g008
Figure 9. Final failure mode around the hole.
Applsci 12 10350 g009
Figure 10. Evolution of cracks around the hole.
Applsci 12 10350 g010
Figure 11. Layout of monitoring point and measuring circles.
Applsci 12 10350 g011
Figure 12. X−direction velocity of monitoring point and crack number.
Applsci 12 10350 g012
Figure 13. Temporal and spatial variation in hoop stress. Note: positive and negative values represent tensile stress and compressive stress, respectively.
Applsci 12 10350 g013
Figure 14. Evolution of normal force chain.
Applsci 12 10350 g014aApplsci 12 10350 g014b
Figure 15. Evolution of shear force chain.
Applsci 12 10350 g015aApplsci 12 10350 g015b
Figure 16. Energy conversion during stress wave incidence.
Applsci 12 10350 g016
Figure 17. Incident wave with different frequencies.
Applsci 12 10350 g017
Figure 18. Stress concentration factor under different frequencies. (a) DSCF around hole, (b) maximum stress concentration factor.
Applsci 12 10350 g018
Figure 19. Incident wave with different amplitudes.
Applsci 12 10350 g019
Figure 20. Failure mode around the hole under different amplitudes.
Applsci 12 10350 g020aApplsci 12 10350 g020b
Figure 21. Variation in stress concentration factor under different amplitudes. (a) DSCF around the holes under different amplitudes, (b) maximum stress concentration factor for different amplitudes.
Applsci 12 10350 g021aApplsci 12 10350 g021b
Figure 22. Failure mode of different areas around the hole.
Applsci 12 10350 g022
Figure 23. Stress−strain curves with respect to elastic modulus.
Applsci 12 10350 g023
Figure 24. Variation in stress concentration factor with respect to elastic modulus. (a) DSCF around hole under elastic modulus, (b) maximum stress concentration factor with respect to elastic modulus.
Applsci 12 10350 g024aApplsci 12 10350 g024b
Table 1. Micro-parameters of specimen after calibration.
Particle-Based PropertiesValue
Bulk density/(kg/m3)2200
Ball radius/m3 × 10−4–5 × 10⁻⁴
Parallel-bond modulus
K ratio/(kn/ks)1
pb-cohesion/MPa10
pb-tension/MPa8
pb_fa/°30
Table 2. Micro-parameters of incident/transmitted bar after calibration.
Particle-Based PropertiesValue
Bulk density/(kg/m3)7800
Ball radius/m3 × 10−4–5 × 10⁻⁴
Linear-bond modulus
K ratio/(kn/ks)1
cb-cohesion/MPa1 × 104
cb-tension/MPa1 × 104
cb_fa/°30
Publisher’s Note: MDPI stays neutral with regard to jurisdictional claims in published maps and institutional affiliations.

