Article

The Center of the Circle Fitting Optimization Algorithm Based on the Hough Transform for Crane

1
School of Transportation and Logistics Engineering, Wuhan University of Technology, Wuhan 430063, China
2
CCCC Second Harbor Engineering Company Ltd., Wuhan 430040, China
3
Key Laboratory of Large-Span Bridge Construction Technology, Wuhan 430040, China
4
Research and Development Center of Transport Industry of Intelligent Manufacturing Technologies of Transport Infrastructure, Wuhan 430040, China
*
Author to whom correspondence should be addressed.
These authors contributed equally to this work.
Appl. Sci. 2022, 12(20), 10341; https://doi.org/10.3390/app122010341
Submission received: 25 August 2022 / Revised: 11 October 2022 / Accepted: 11 October 2022 / Published: 14 October 2022

Abstract

:
The basic principle of photogrammetry is mature and widely used in engineering. For gantry cranes, the base of which is usually a cylinder, the measurement of the center of the cylinder cross section is difficult, but its coordinates have an important impact on the safety evaluation of cranes. Aiming at the problem of measuring the center of a circle, an optimization method of fitting the center of a circle based on photogrammetry and the Hough transform is proposed. In this algorithm, the effect of image point distortion on the measurement accuracy is considered, and the similarity between ideal and actual midperpendicular is compared in the Hough space. The similarity is taken as the weight of the midperpendicular, and the space coordinates of the center of the circle are fitted again. This process needs to iterate repeatedly until convergence, and the fitting accuracy of the equal weighted midperpendicular fitting algorithm and the weighted midperpendicular fitting algorithm is compared. Finally, according to the characteristics of the algorithm, a theoretical verification experiment and an engineering experiment are carried out. The experimental results show that the proposed weighted midperpendicular fitting algorithm has a better effect than the equal weighted midperpendicular fitting algorithm, which obviously improves the fitting accuracy of the center of the circle and has high engineering value. In both experiments, the relative error was less than one percent. Especially in the engineering experiments, the weighted midperpendicular algorithm improved accuracy by an order of magnitude. Therefore, the proposed algorithm significantly improves the fitting accuracy of the center of the circle and effectively solves the difficulty that the center of the circle cannot be directly measured on the construction machinery.

1. Introduction

A port crane is a large piece of construction machinery, widely used in major ports, playing an important role in cargo transport. Due to its high frequency and high intensity working characteristics [1], its structural safety has attracted much attention [2]. To evaluate the safety of port machinery, it is necessary to measure the coordinates of its key points or measure the key dimensions. Port machinery works continuously for a long time and its structure is usually tall [3]. Some positions cannot be reached manually, so there are few tools that can complete the measurement, and some key data cannot be measured directly.
At present, among the effective measurement methods within a certain range, the operation of total station [4,5] is complicated. If too many points need to be measured, its efficiency will be relatively low. For high-strength, long-working construction machinery such as port cranes, the working clearance is relatively short. If the total station is used for measurement, the crane needs to stop working for a long time, which will cause relatively large economic losses. Laser scanner [6] has a high cost and complex post-processing. The price of a single device usually exceeds USD 120,000. It needs to work for a long time in one location to obtain a sufficient number of point clouds, so it does not practical for large-scale application. Installing sensors [7] is too manual and dangerous. Coordinate measuring machine (CMM) [8,9] has high measurement accuracy and good versatility, but it belongs to the contact measurement mode with high requirements on the environment, and its measurement range is small. Laser tracker [10] also belongs to contact measurement, but each contact can only obtain the coordinates of one point, and its measurement efficiency is low. Compared with the above measurement methods, photogrammetry is not only simple and flexible in operation and low in cost, but also with the continuous development and progress of computer vision technology [11,12,13], image post-processing is very convenient.
Photogrammetry has the characteristics of non-contact and automatic processing, so the use of photogrammetry has become a new idea of traditional engineering measurement, especially in today’s pursuit of automation and the intelligent development trend [14]. The development of instruments, sensors, robots, electronic circuits, chips and other technologies has also injected new vitality into the development of photogrammetry technology. With the continuous emergence of various innovative technologies in recent years, close range photogrammetry has been widely applied in fields, such as deformation photogrammetry, architectural photogrammetry, engineering photogrammetry and so on. Close-range photogrammetry is more advantageous than the traditional geodetic method for measuring deformation of objects, especially for high-rise buildings, bridges, machines and dams. Darmstadt Institute of Engineering published their research results on deformation observation of a 43-story building with a height of 142 m, and Freiberg Institute of Mines in Germany published a report on deformation of a transport bridge in an open-pit coal mine under load conditions, both of which achieved good results [15]. Close-range photogrammetry is also used in reverse engineering, which greatly shortens the development cycle of industrial products. Due to the high detection accuracy of close-range photogrammetry, it has many applications in automobile manufacturing, parts quality control, whole machine assembly, automatic welding, automatic painting and so on [16].

2. Related Work

The application of photogrammetry in port machinery is still relatively rare. Aihua Li [17] tried to use photogrammetry to measure the data of gantry cranes, but the effect was not good. Qi Wang [18] developed the calibration method of camera effective focal length for port cranes. He proposed a new position and attitude estimation method to solve the problem of low measurement accuracy when the attitude angle is large. Enshun Lu [19] developed a multi-line intersection point-fitting optimization algorithm for crane structure characteristics. Most of the corners on the crane are the intersections of three straight lines. Taking advantage of this feature, Enshun Lu solved the problem that some key corners cannot be directly measured due to occlusion. The structure of port machinery has obvious characteristics, and a suitable photogrammetry algorithm can be developed according to its structural characteristics.
Taking gantry crane [20] as the representative of port machinery, after a long period of high-intensity work, its supporting cylinder will be deformed, the center of the circle will be offset, and the safety will be reduced. The coordinates of the center of the circle and other key points play a crucial role in the safety evaluation of mechanical structures [21,22]. Therefore, it is very important to measure the coordinates of the center of the circle. However, it is usually impossible to measure the center of a circle directly. In general, the coordinates of multiple points on a circle are measured first, and the center of a circle is fitted according to the spatial coordinates of each point [23]. In mathematical theory, the intersection point of midperpendicular of multiple strings on a circle is the center of the circle, but due to the existence of error, the multiple midperpendicular cannot strictly intersect at one point [19]. Therefore, an approximate model of image point distortion [24,25] is established in the image plane. The Hough transform [26,27,28] is used to determine the similarity between the actual and ideal midperpendicular, and then the weight of each midperpendicular is determined according to the similarity, and more accurate coordinates of the center of the circle are obtained through the above process.
Few scholars combine photogrammetry with the fitting of the center of the circle in space. This paper has made relevant research in this direction because of the need to provide supporting data for crane safety assessment. Compared with the previous research work conducted by scholars on the measurement of cranes, this paper has the following innovations: (i) A new approximate model of image point distortion is proposed; (ii) An iterative optimization method based on reprojection is proposed; and (iii) The midperpendicular is weighted by using the Hough transform. The research in this paper solves the problem of poor fitting accuracy of the measurement of the center of a port crane.
The rest of this paper is structured as follows. The circle center fitting theory based on equal weight midperpendicular is proposed in Section 3.1; on the basis of Section 3.1, the circle center fitting theory based on weighted midperpendicular is proposed in Section 3.2. Section 4 introduces the experimental process. Section 5 analyzes the experimental results. And Section 6 summarizes the whole paper and prospective future research.

3. Methodology

3.1. Circle Center Fitting Method Based on Equal Weight Midperpendicular

As shown in Figure 1, points A, B, C and D are on the space circle. L 1 , L 2 and L 3 are the midperpendicular of lines A B , B C and C D , respectively. Points T 1 , T 2 and T 3 are vertical feet. Due to errors in the spatial coordinates of points A, B, C and D obtained by photogrammetry, lines L 1 , L 2 and L 3 cannot strictly intersect at one point. Point G is the center of the circle obtained by fitting lines L 1 , L 2 and L 3 . The distances between point G and lines L 1 , L 2 and L 3 are D 1 , D 2 and D 3 , respectively.
All the points used in the fitting are space points. First, the plane where the center of the circle is located is fitted according to space points A, B, C and D. The equation of the space plane is as follows.
A 0 X + B 0 Y + C 0 Z + D 0 = 0
where A 0 , B 0 , C 0 and D 0 are coefficients of the plane equation. X, Y and Z are the coordinates of the point in space.
Then, the least square method is used to fit the plane, and the formula is as follows.
X 1 Y 1 Z 1 X n Y n Z n A 0 / D 0 B 0 / D 0 C 0 / D 0 = 1 1 1
where X n , Y n and Z n are the coordinates of the space point.
In space, the formula for midperpendicular is as follows.
X X 0 m = Y Y 0 n = Z Z 0 p = t
where ( X 0 , Y 0 , Z 0 ) is a point in the space line, and m, n, p and t are the coefficients of the space line equation.
The points T 1 , T 2 and T 3 which are the feet of the midperpendicular are theoretically close to the space plane, so it can be approximately considered that points T 1 , T 2 and T 3 are on this plane. According to the constraint conditions that the direction vector of the midperpendicular is perpendicular to the normal vector of the plane, the solution equation of parameters m, n and p is as follows.
m n p = X B X A Y B Y A Z B Z A × A B C
After obtaining the equation parameters of midperpendicular, the point G can be fitted according to the principle of the minimum sum of the distances ( D 1 + D 2 + D 3 ) between the point G and the midperpendicular. To facilitate calculation, the solution of the minimum sum of their distances ( D 1 + D 2 + D 3 ) is converted to the solution of the minimum sum of the squares of their distances ( D 1 2 + D 2 2 + D 3 2 ), and the expression is as follows.
W ( X G , Y G , Z G ) = D 1 2 + D 2 2 + D 3 2
where
D 1 2 = X G X T 1 Y G Y T 1 Z G Z T 1 × m 1 n 1 p 1 2 m 1 2 + n 1 2 + p 1 2
D 2 2 = X G X T 2 Y G Y T 2 Z G Z T 2 × m 2 n 2 p 2 2 m 2 2 + n 2 2 + p 2 2
D 3 2 = X G X T 3 Y G Y T 3 Z G Z T 3 × m 3 n 3 p 3 2 m 3 2 + n 3 2 + p 3 2
W is the function value, and the coordinates of point G are obtained by minimizing the function value W where the nonlinear optimization function Fmincon is used. This method is the equal weight fitting algorithm (EWFA).

3.2. Circle Center Fitting Method Based on Weighted Midperpendicular

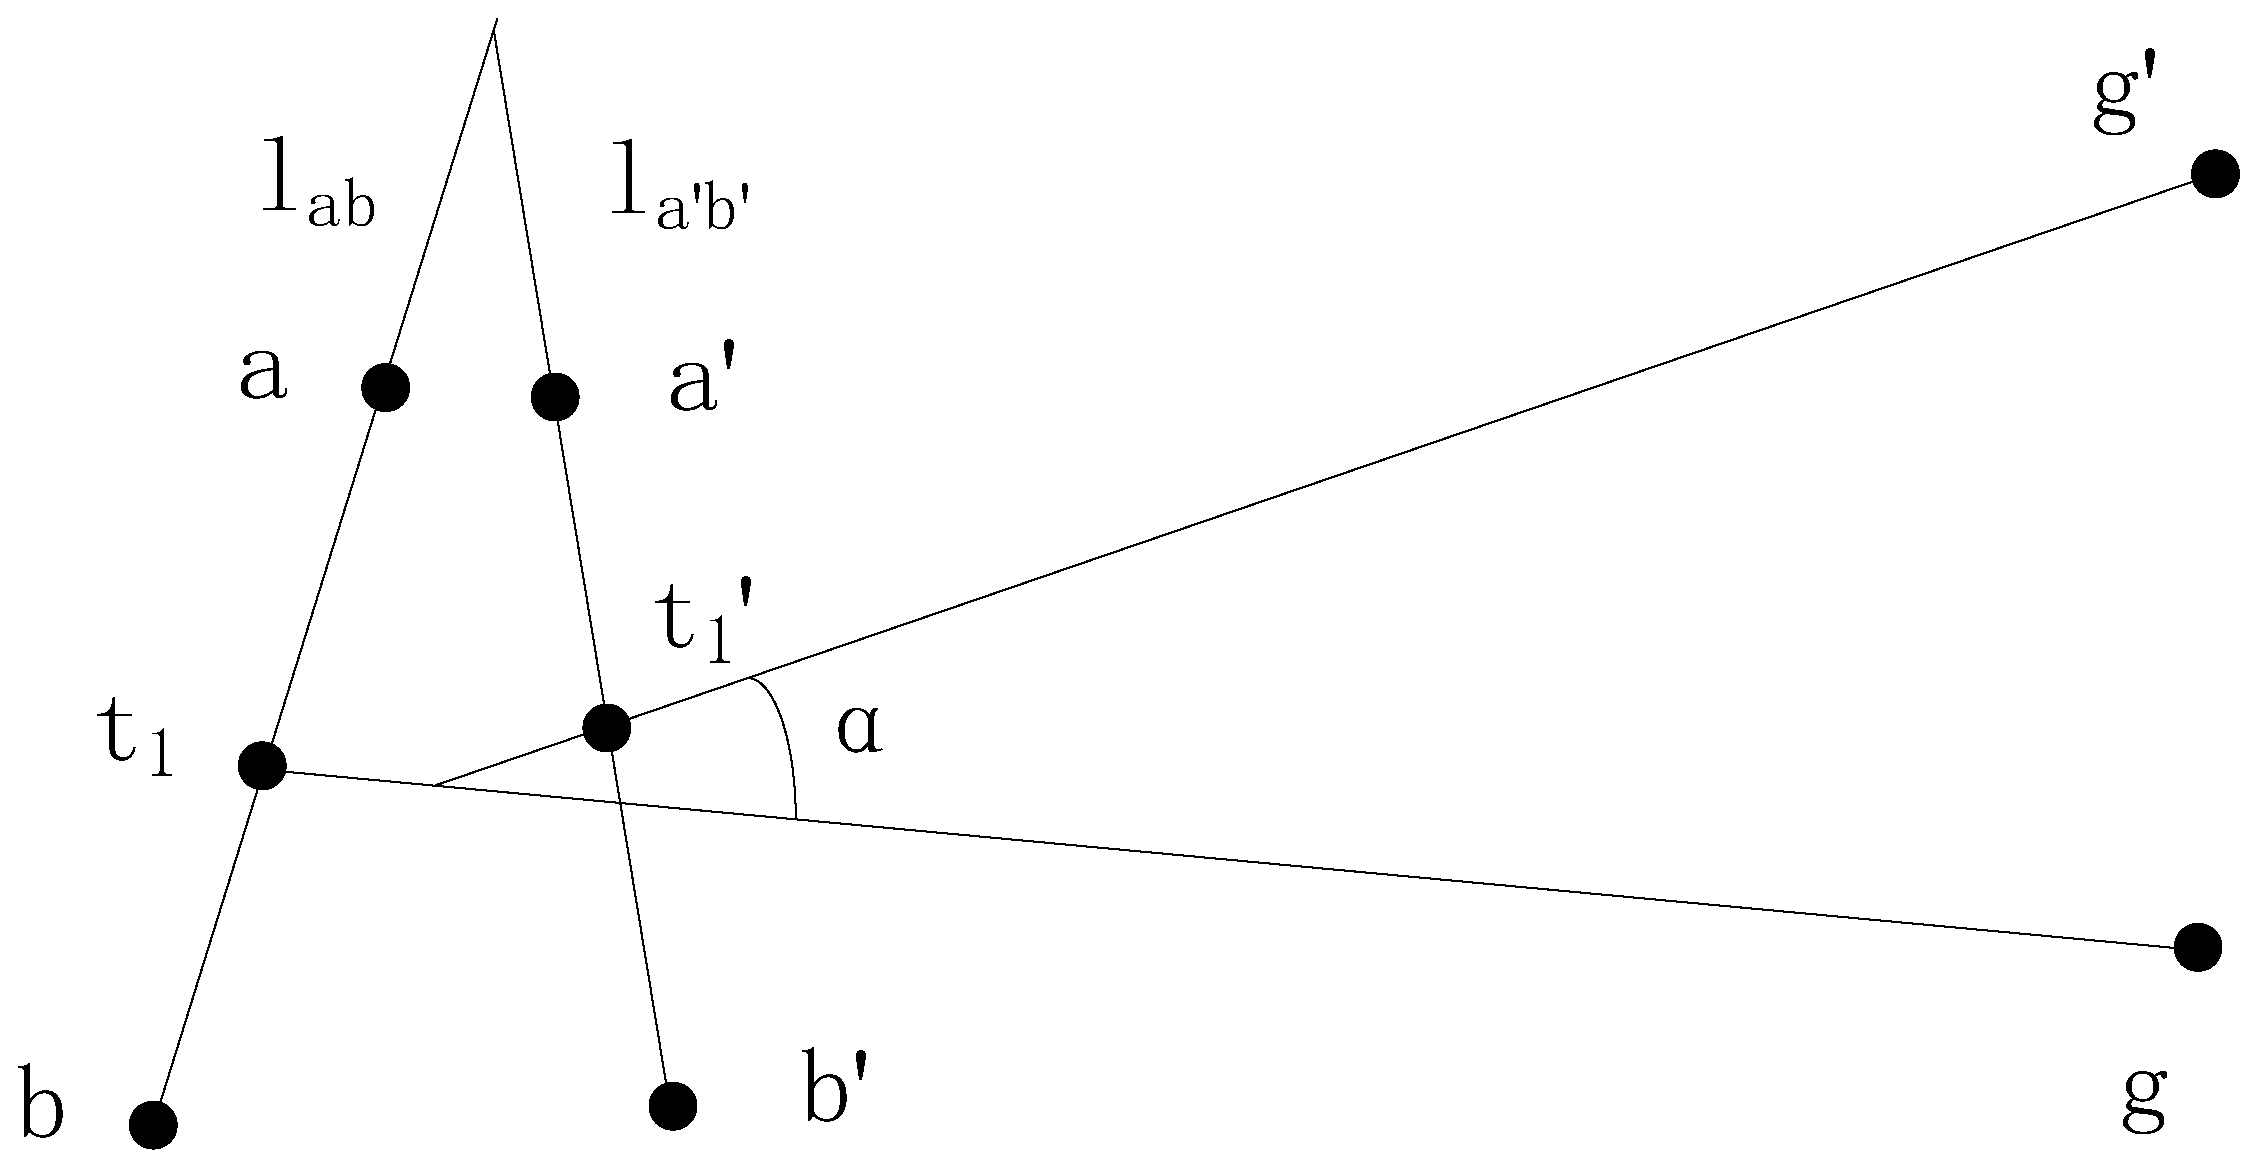
As shown in Figure 2, due to the optical distortion of the camera, there will be a certain error [29,30] between the ideal image point and the true image point, thus affecting the fitting accuracy of the center of the circle. An image point distortion model is shown in Figure 2. Image points a, b and t 1 are the ideal projection points of space points A, B and T 1 ; image points a , b and t 1 are the actual projection points of space points A, B and T 1 ; t 1 is the midpoint of the line a b . Point g is the ideal projection point of point G, and point g is the true projection point of point G. Point G is the center of the fitting space circle. Since the distortion of the image point is very small relative to the distance between point t 1 and point g , it can be approximated that a t 1 g = a t 1 g .
The space coordinate of the center of the circle obtained in Section 3.1 is taken as the initial value. Then, the coordinates of its projection point g on the image can be obtained. Its calculation formula is as follows.
x g = f ( cos φ cos κ sin φ sin ω sin κ ) ( X g X S ) + cos ω sin κ ( Y g Y S ) + ( sin φ cos κ + cos φ sin ω sin κ ) ( Z g Z S ) sin φ cos ω ( X g X S ) sin ω ( Y g Y S ) + cos φ cos ω ( Z g Z S ) Δ x
y g = f ( cos φ sin κ sin φ sin ω sin κ ) ( X g X S ) + cos ω cos κ ( Y g Y S ) + ( sin φ cos κ + cos φ sin ω sin κ ) ( Z g Z S ) sin φ cos ω ( X g X S ) sin ω ( Y g Y S ) + cos φ cos ω ( Z g Z S ) Δ y
where X S , Y S , Z S , φ , ω and κ are the external orientation elements of the camera, and Δ x , Δ y and f are intrinsic parameters of the camera.
According to the coordinates of true image points, the coordinates of ideal image points can be obtained, and the formula is as follows.
x a = x a { k 1 x a ( x a 2 + y a 2 ) + [ q 1 ( 3 x a 2 + y a 2 ) + 2 q 2 x a y a ] + s 1 ( x a 2 + y a 2 ) }
y a = y a { k 2 y a ( x a 2 + y a 2 ) + [ q 2 ( 3 x a 2 + y a 2 ) + 2 q 1 x a y a ] + s 2 ( x a 2 + y a 2 ) }
where k 1 and k 2 are radial distortion, q 1 and q 2 are tangential distortion, and s 1 and s 2 are poison-prism distortion. Similarly, the coordinates of other ideal image points can be obtained.
The n images and m midperpendicular are used to calculate the center of the circle. Given the coordinates of point t and point g , the equation of the jth midperpendicular on the ith image is as follows.
a i j x + b i j y + c i j = 0
Since the space resection is a linear transformation, the similarity between the line g t and the line g t in the plane directly determines the confidence of midperpendicular in space. Therefore, the Hough transform is used to convert line g t and line g t into parameter space to calculate their similarity. In the parameter space, the expression of line g t is as follows.
ρ i j 1 = c i j a i j 2 + b i j 2
θ i j = arccos a i j a i j 2 + b i j 2
The angle between line g t and line g t is the angle between line a b and line a b , and the formula is as follows.
α i j = arccos ( x a x b , y a y b ) · ( x a x b , y a y b ) ( x a x b ) 2 + ( y a y b ) 2 · ( x a x b ) 2 + ( y a y b ) 2
ρ i j 2 = x t 1 cos ( θ i j + α i j ) + y t 1 sin ( θ i j + α i j )
The equation of the line in the image plane is converted to the parameter space, and the similarity of the two lines in the image plane is measured by the distance between two points in the parameter space. The greater the distance between two points, the lower the similarity is, and vice versa. In order to facilitate calculation, the reciprocal of the square of the distance is used to measure the similarity, so for jth midperpendicular in space, the expression of their weight is as follows.
Q j = i = 1 n ( 1 / d i j ) k = 1 m i = 1 n ( 1 / d i k )
where d i j = ( ρ i j 1 ρ i j 2 ) 2 + α i j 2 .
The calculation formula of the weighted midperpendicular fitting algorithm is as follows.
W ( X G , Y G , Z G ) = j = 1 m Q j D j 2
This method is the weighted fitting algorithm(WFA). The flowchart of the circle center fitting algorithm based on the weighted midperpendicular is shown in Figure 3.

4. Case Study

4.1. The Experimental Process

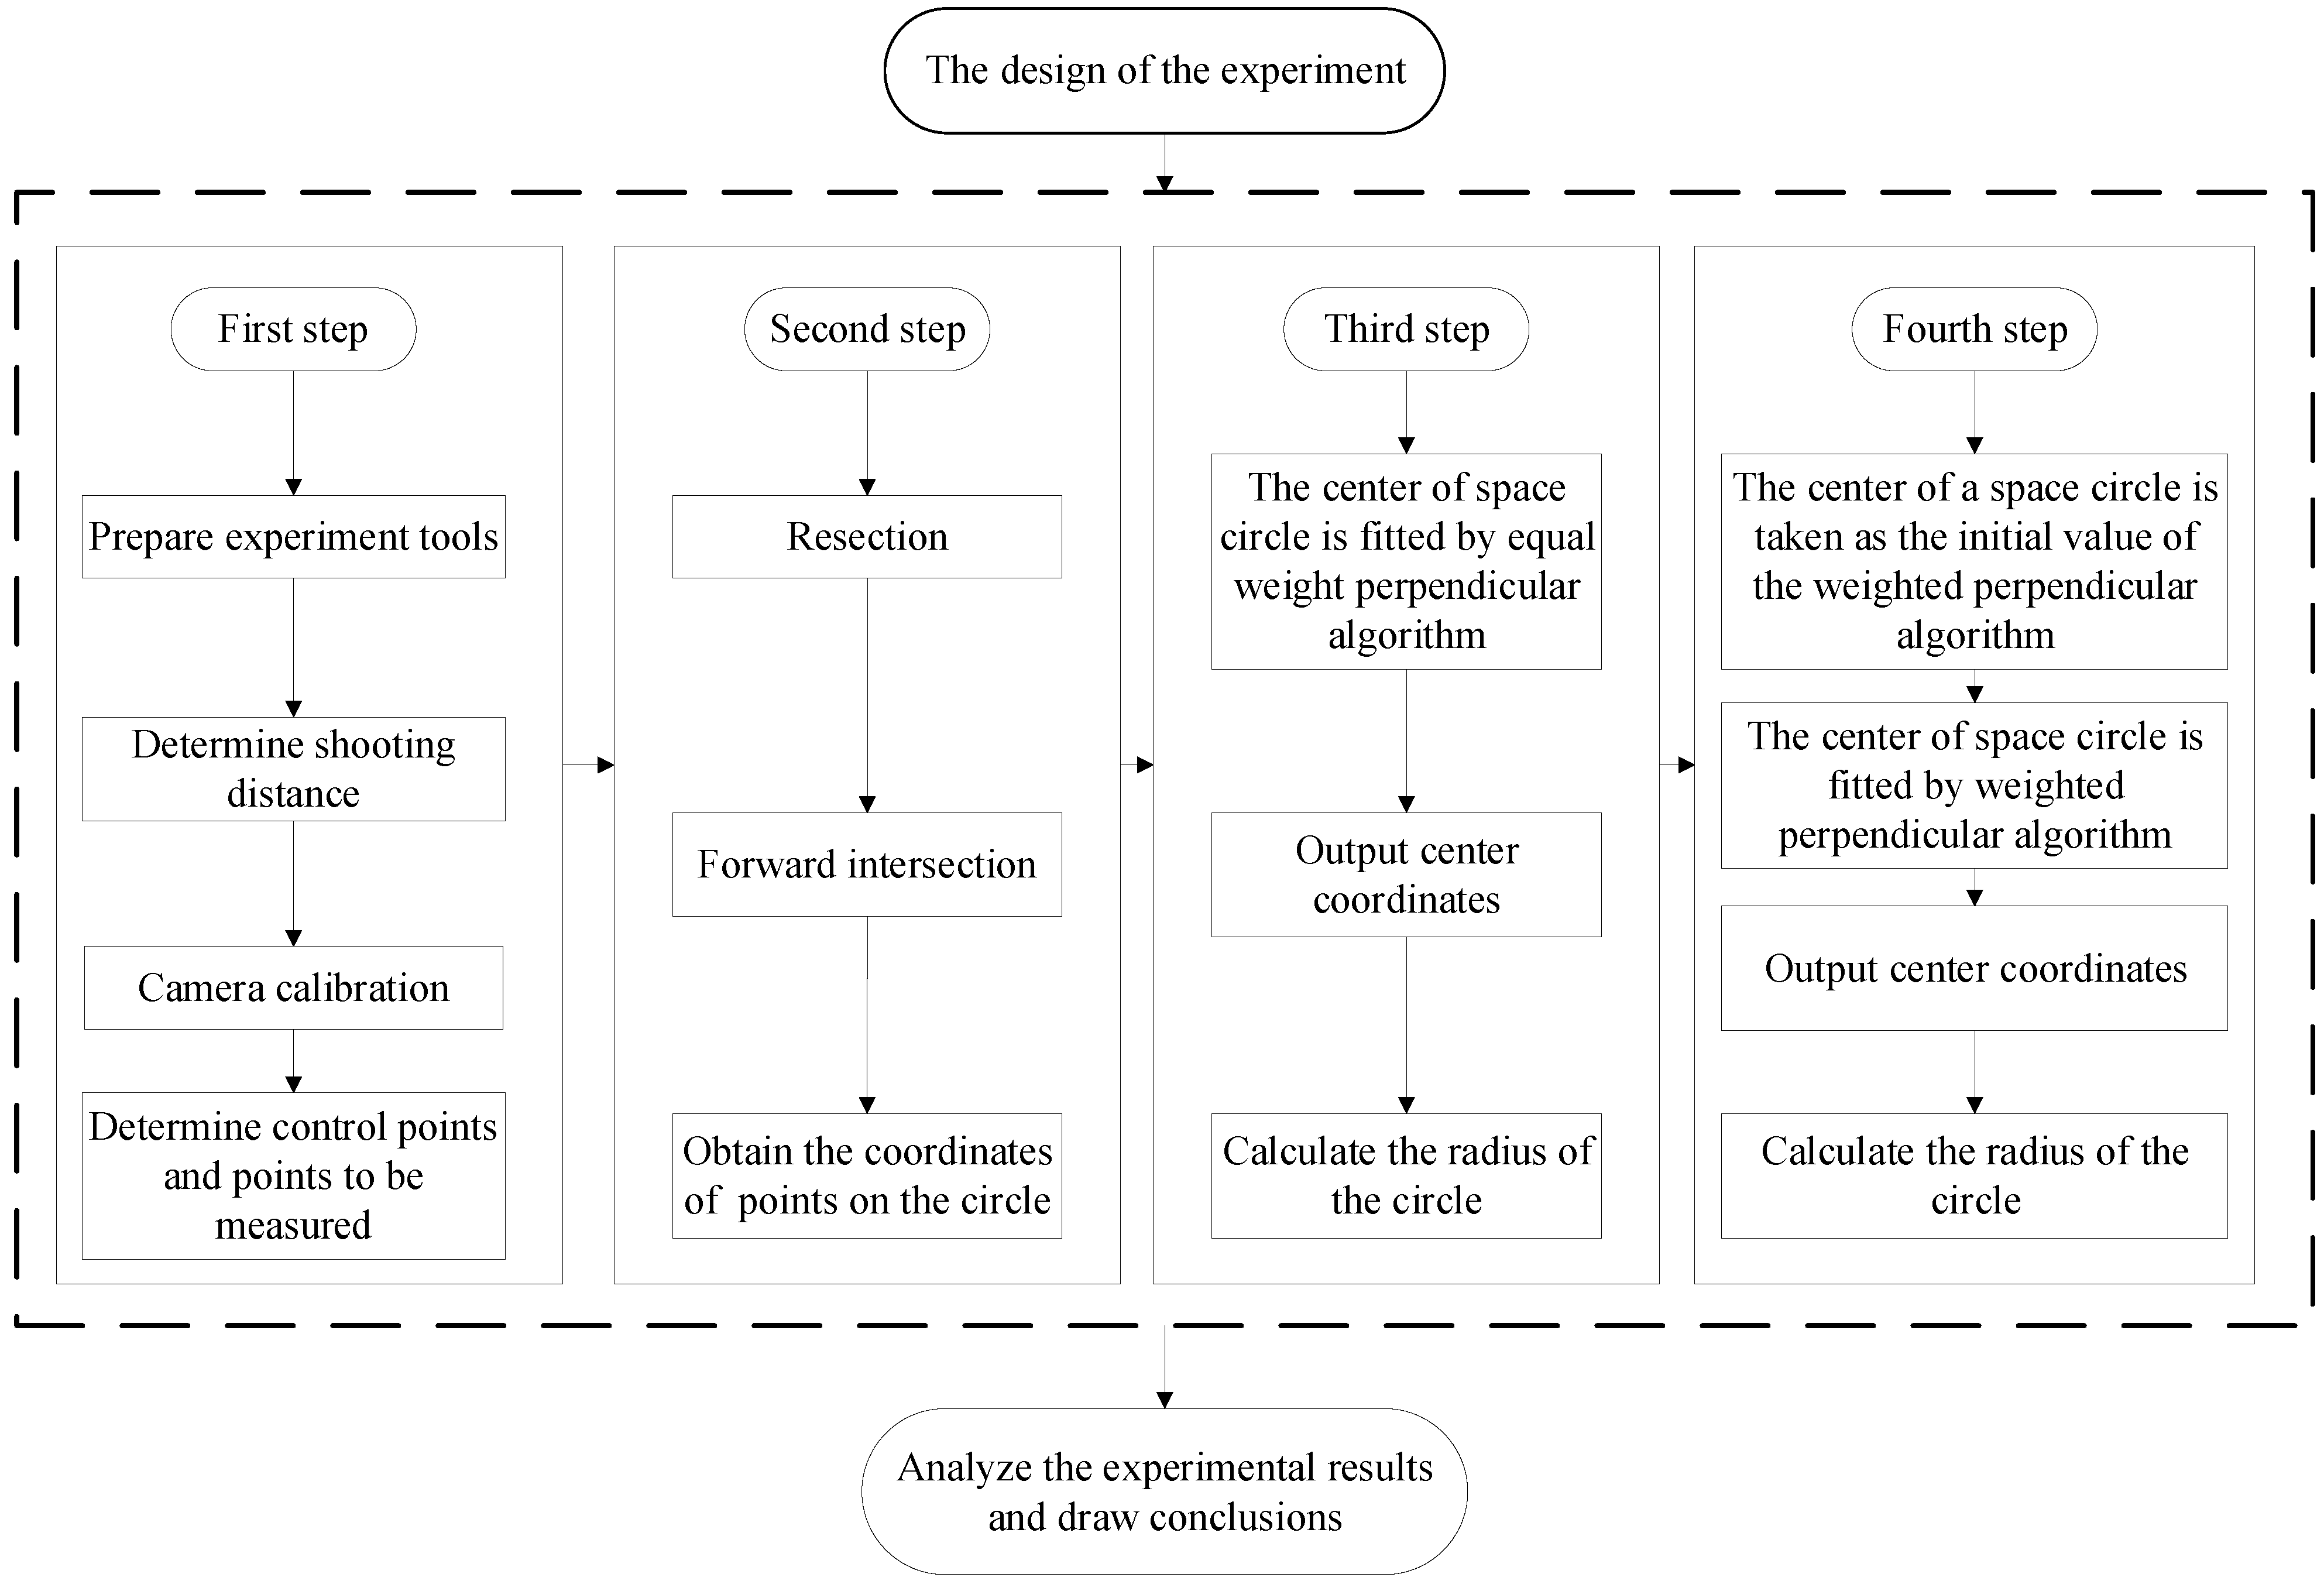
The effect of the algorithm needs to be verified by experiments, so the real objects are photographed, and two images and three vertical lines are taken as examples to conduct verification experiments. In order to verify the stability and practicability of the algorithm, the experiment is divided into two groups. The first group is for the close-range black and white square experiment. The second group is an engineering experiment using the portal crane to complete the algorithm verification. The experimental flow chart is shown as Figure 4. The first step is to determine the shooting distance based on the size of the object. The second step is to calculate the coordinates of the points on the spatial circle. The third step is to initially calculate the center and radius according to the equal weighted midperpendicular algorithm. The fourth step is to accurately calculate the center and radius of the circle by using the weighted midperpendicular algorithm according to the calculation results of the third step. The whole process is to calculate the spatial coordinates of the points on the circle based on the basic principles of photogrammetry [31]. The center of the circle will be fitted by two algorithms proposed in Section 3.1 and Section 3.2. The experimental effects of the equal weight midperpendicular fitting algorithm and the weighted midperpendicular fitting algorithm will be compared.

4.2. The Experiment Platform

4.2.1. First Experiment

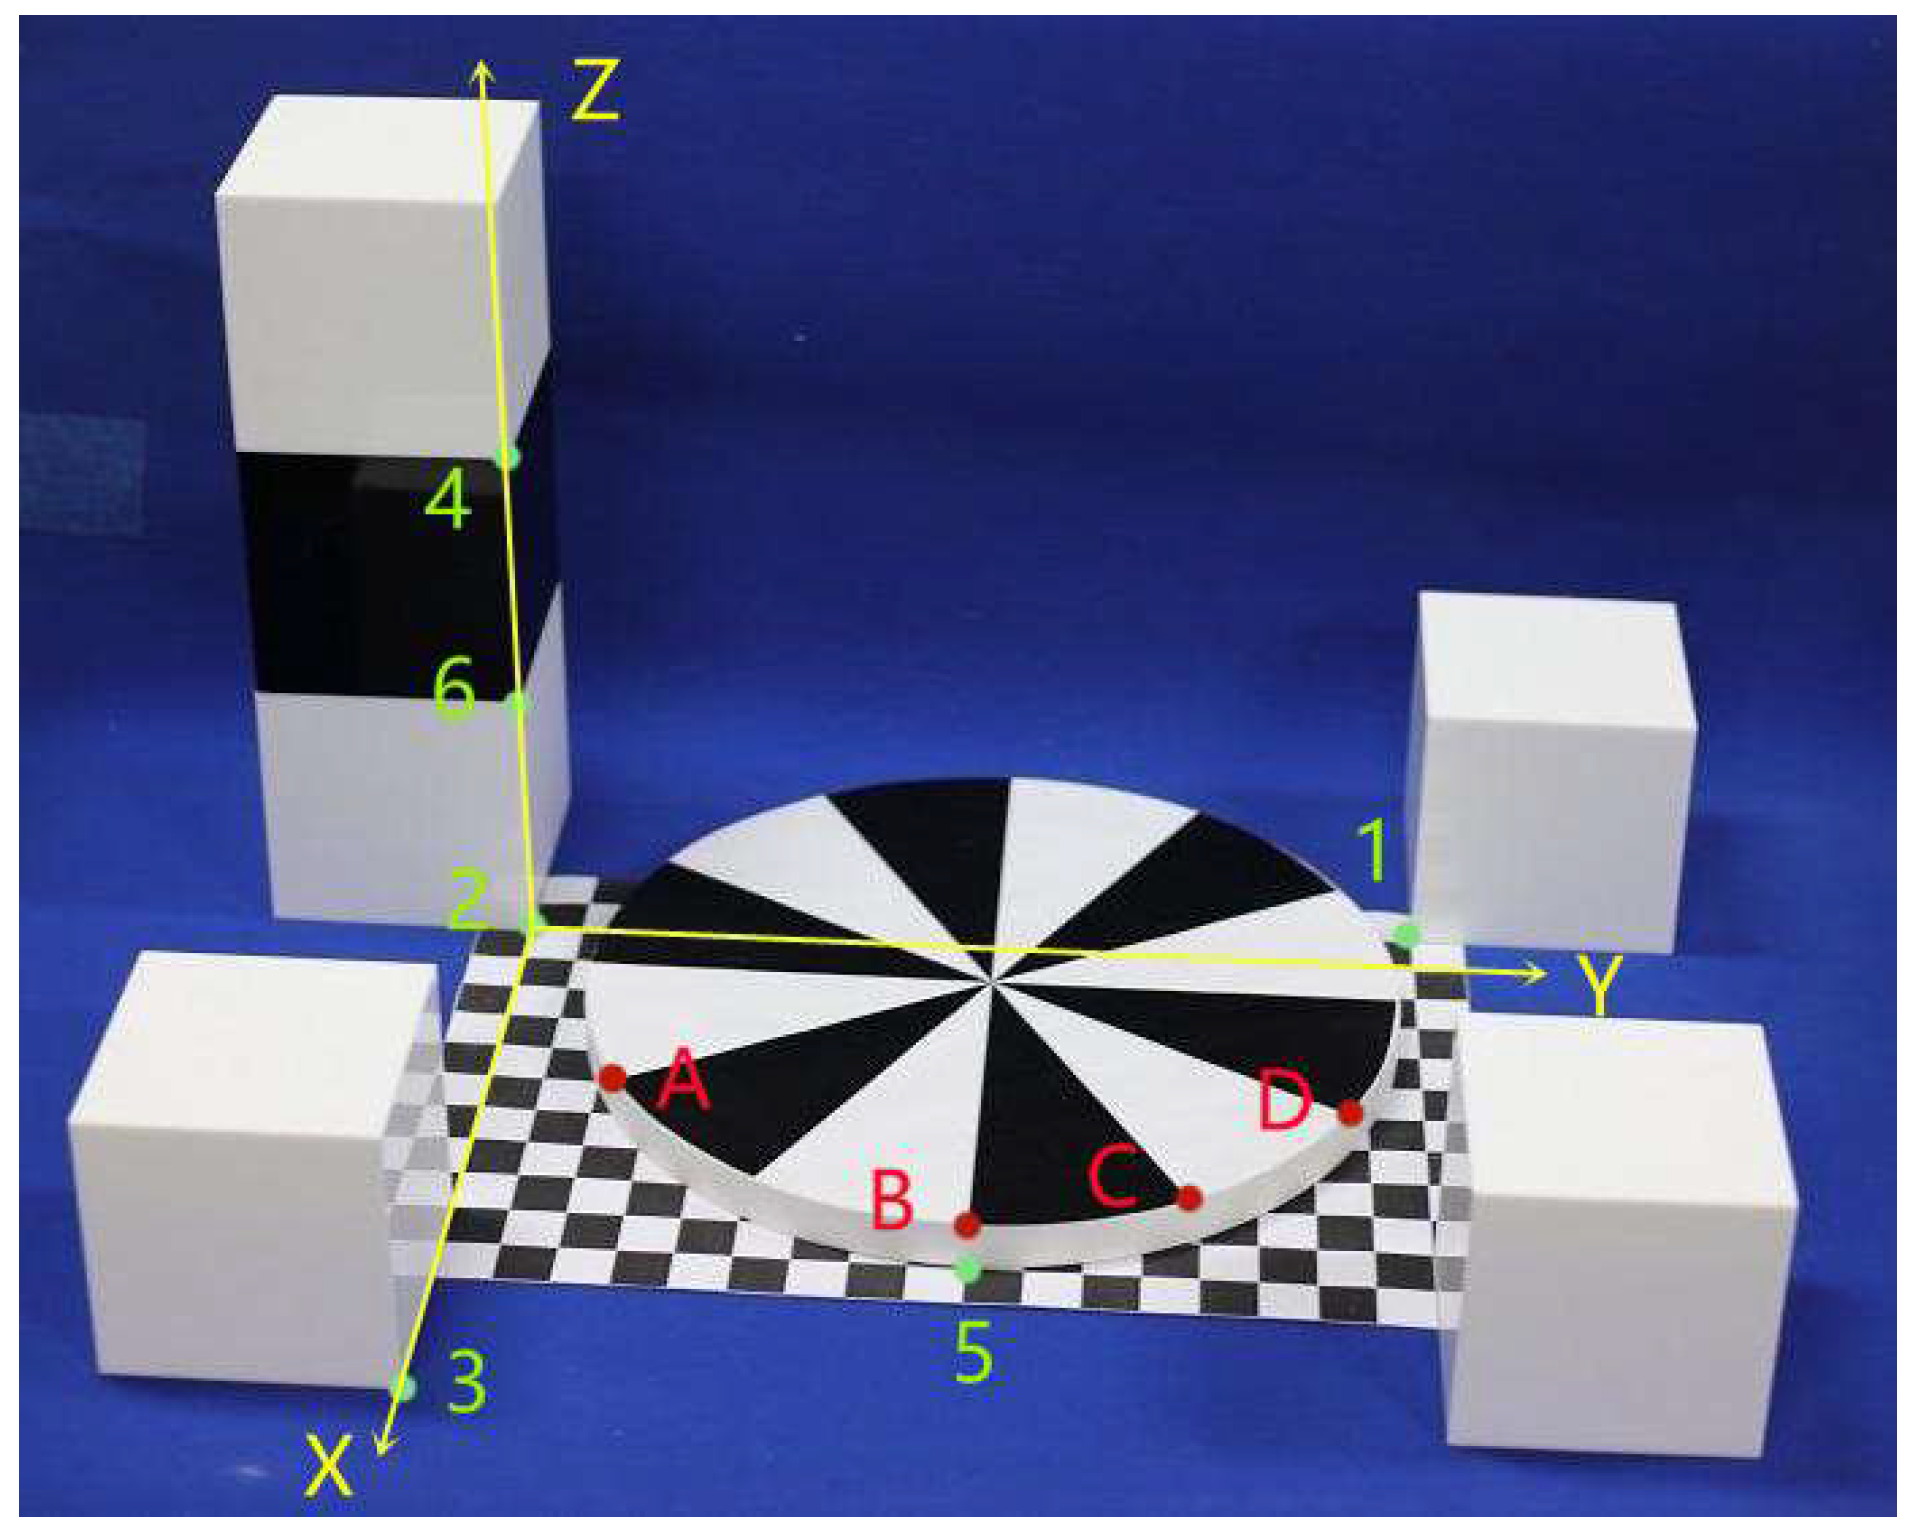
As shown in Figure 5, the Cartesian space coordinate system is established. The side length of the black and white square is 100 mm. The side length of the black and white checkerboard is 20 mm. The height of the cylinder is 18mm, its diameter is 300 mm, and the angles of the 12 sectors are equal. Points 1, 2, 3, 4, 5 and 6 are control points; points A, B, C and D are to be measured. Point G is the center of the circle. There is a certain error between the fitting coordinates and the true coordinates, which is used to measure the accuracy of the equal weight midperpendicular algorithm and the weighted midperpendicular algorithm.
The camera is a Canon 5DS, and its parameters are shown in Table 1; f represents the focal length. Δ x and Δ y represent deviations of principal point of the photograph in the direction of X and Y, respectively. k 1 and k 2 are radial distortion parameters, respectively.
The spatial coordinates of control points and points to be measured are shown in Table 2. Point 2 is the coordinate origin of the spatial coordinate system.
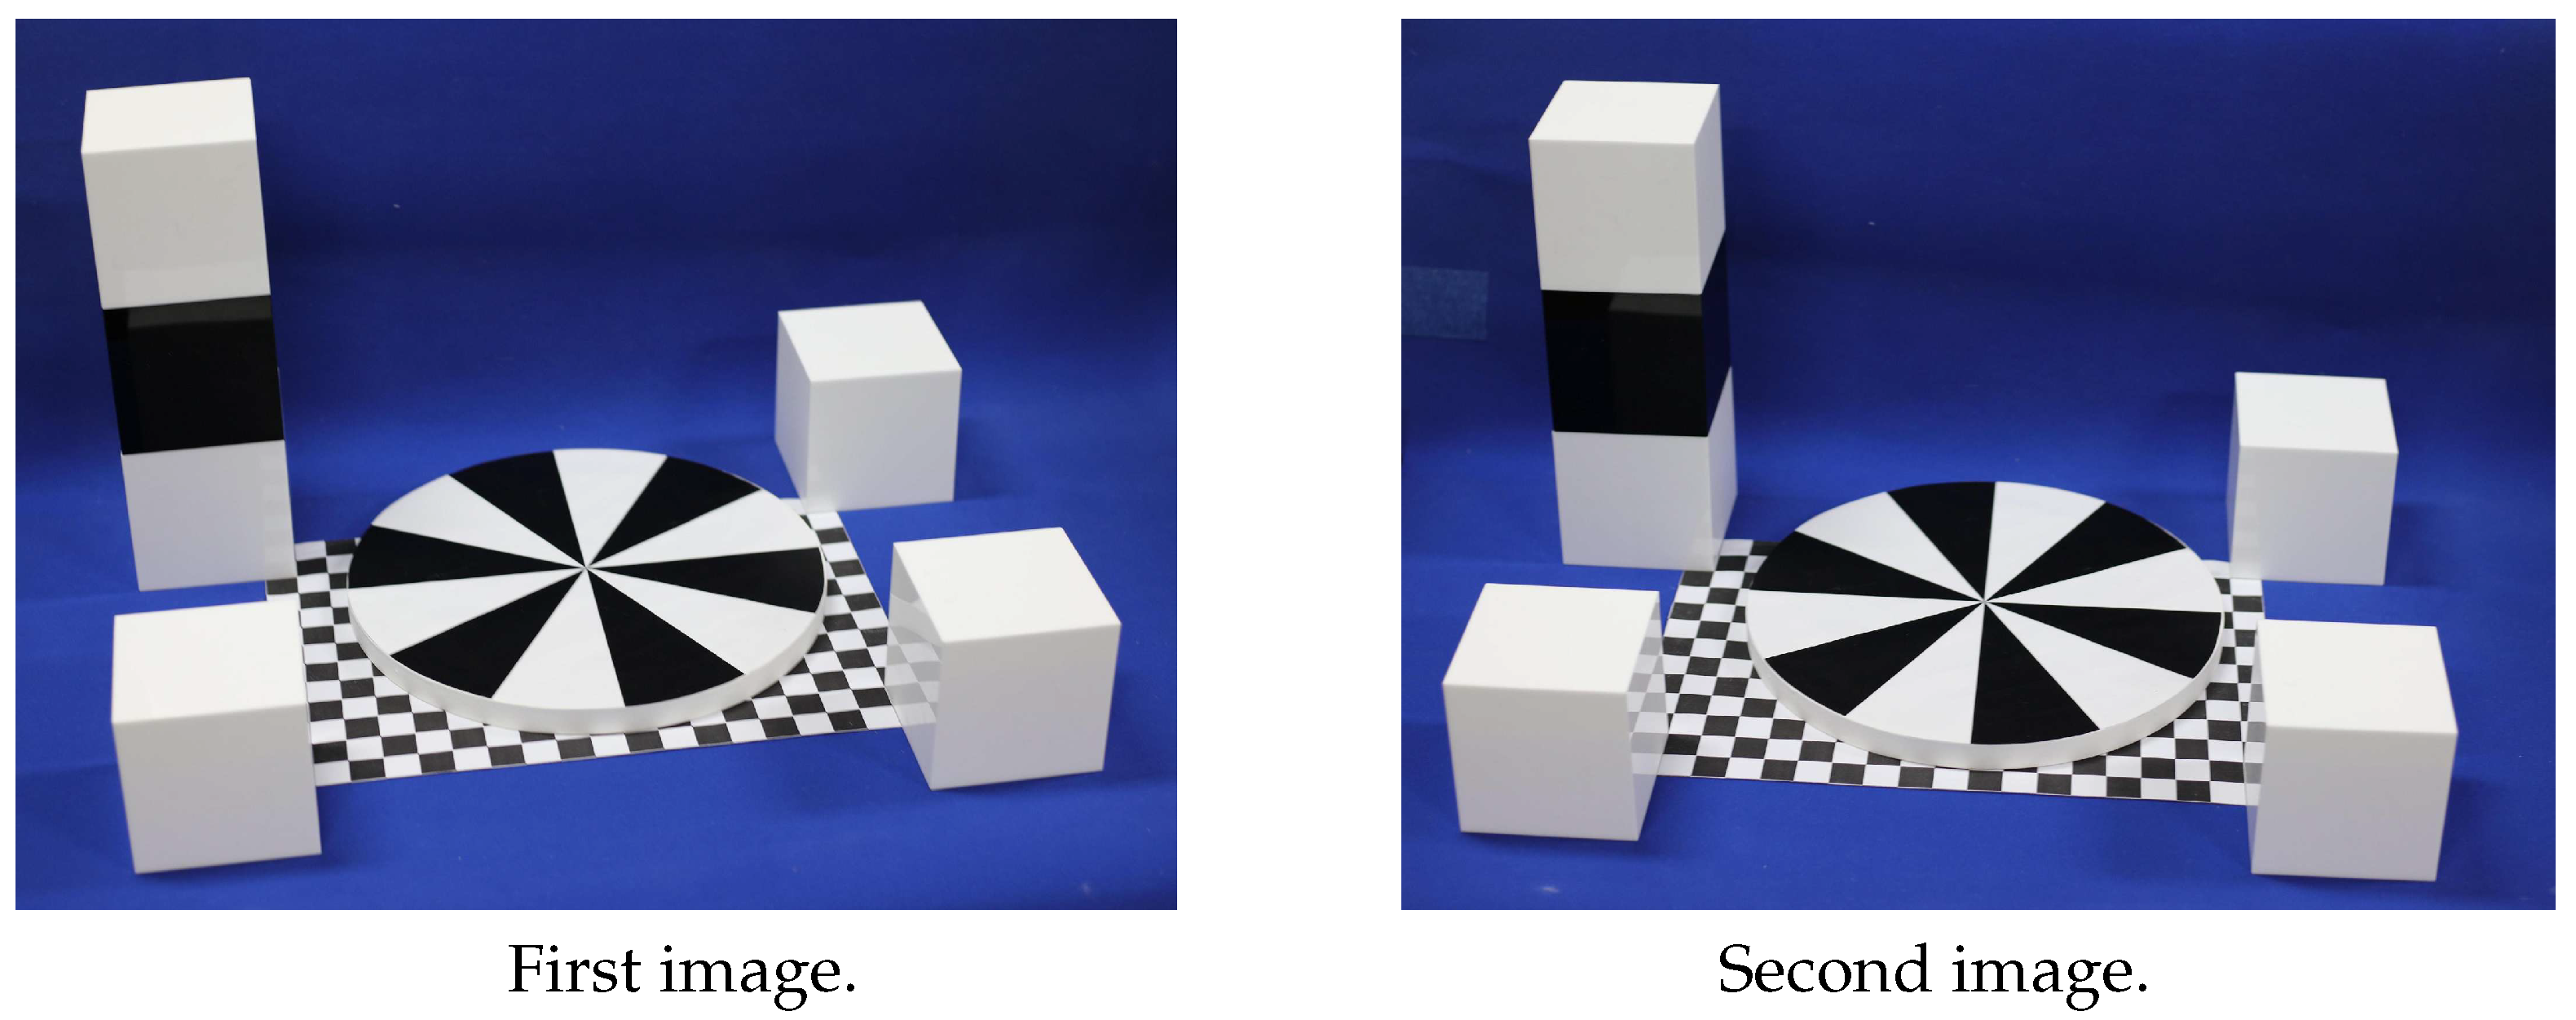
There are two photography sites, and one image is taken at each site. As shown in Figure 6, according to the basic principle of photogrammetry [31], two images are used to complete the calculation of points.
The image plane coordinates of the control points and the points to be measured on the two images are shown in Table 3.
The six elements of exterior orientation of the two images are shown in Table 4. X S , Y S and Z S are the spatial coordinates of the center of the image projection, respectively; φ , ω and κ are the angle of the camera relative to the spatial coordinate system, and these six parameters together determine the spatial position and attitude of the image.
The calculated coordinates of space points are shown in Table 5. Points A, B, C and D are all on the spatial circle.

4.2.2. Second Experiment

A gantry crane is shown in Figure 7. The purpose of the experiment is to measure the center of the cylinder cross section. Points 1, 2, 3, 4, 5 and 6 are control points, and points A, B, C and D are to be measured. Since the center of a circle cannot be measured directly in engineering, the circumference can be measured. Therefore, after the center of a circle is calculated by the two algorithms of Section 3.1 and Section 3.2, the radius is calculated. The accuracy of the center fitting algorithm proposed in Section 3.1 and Section 3.2 is measured by the radius error.
The camera is a Canon 5DS, and its parameters are shown in Table 6.
The coordinates of the control points and the points to be measured in space are shown in Table 7. The coordinates of these points are measured by the total station.
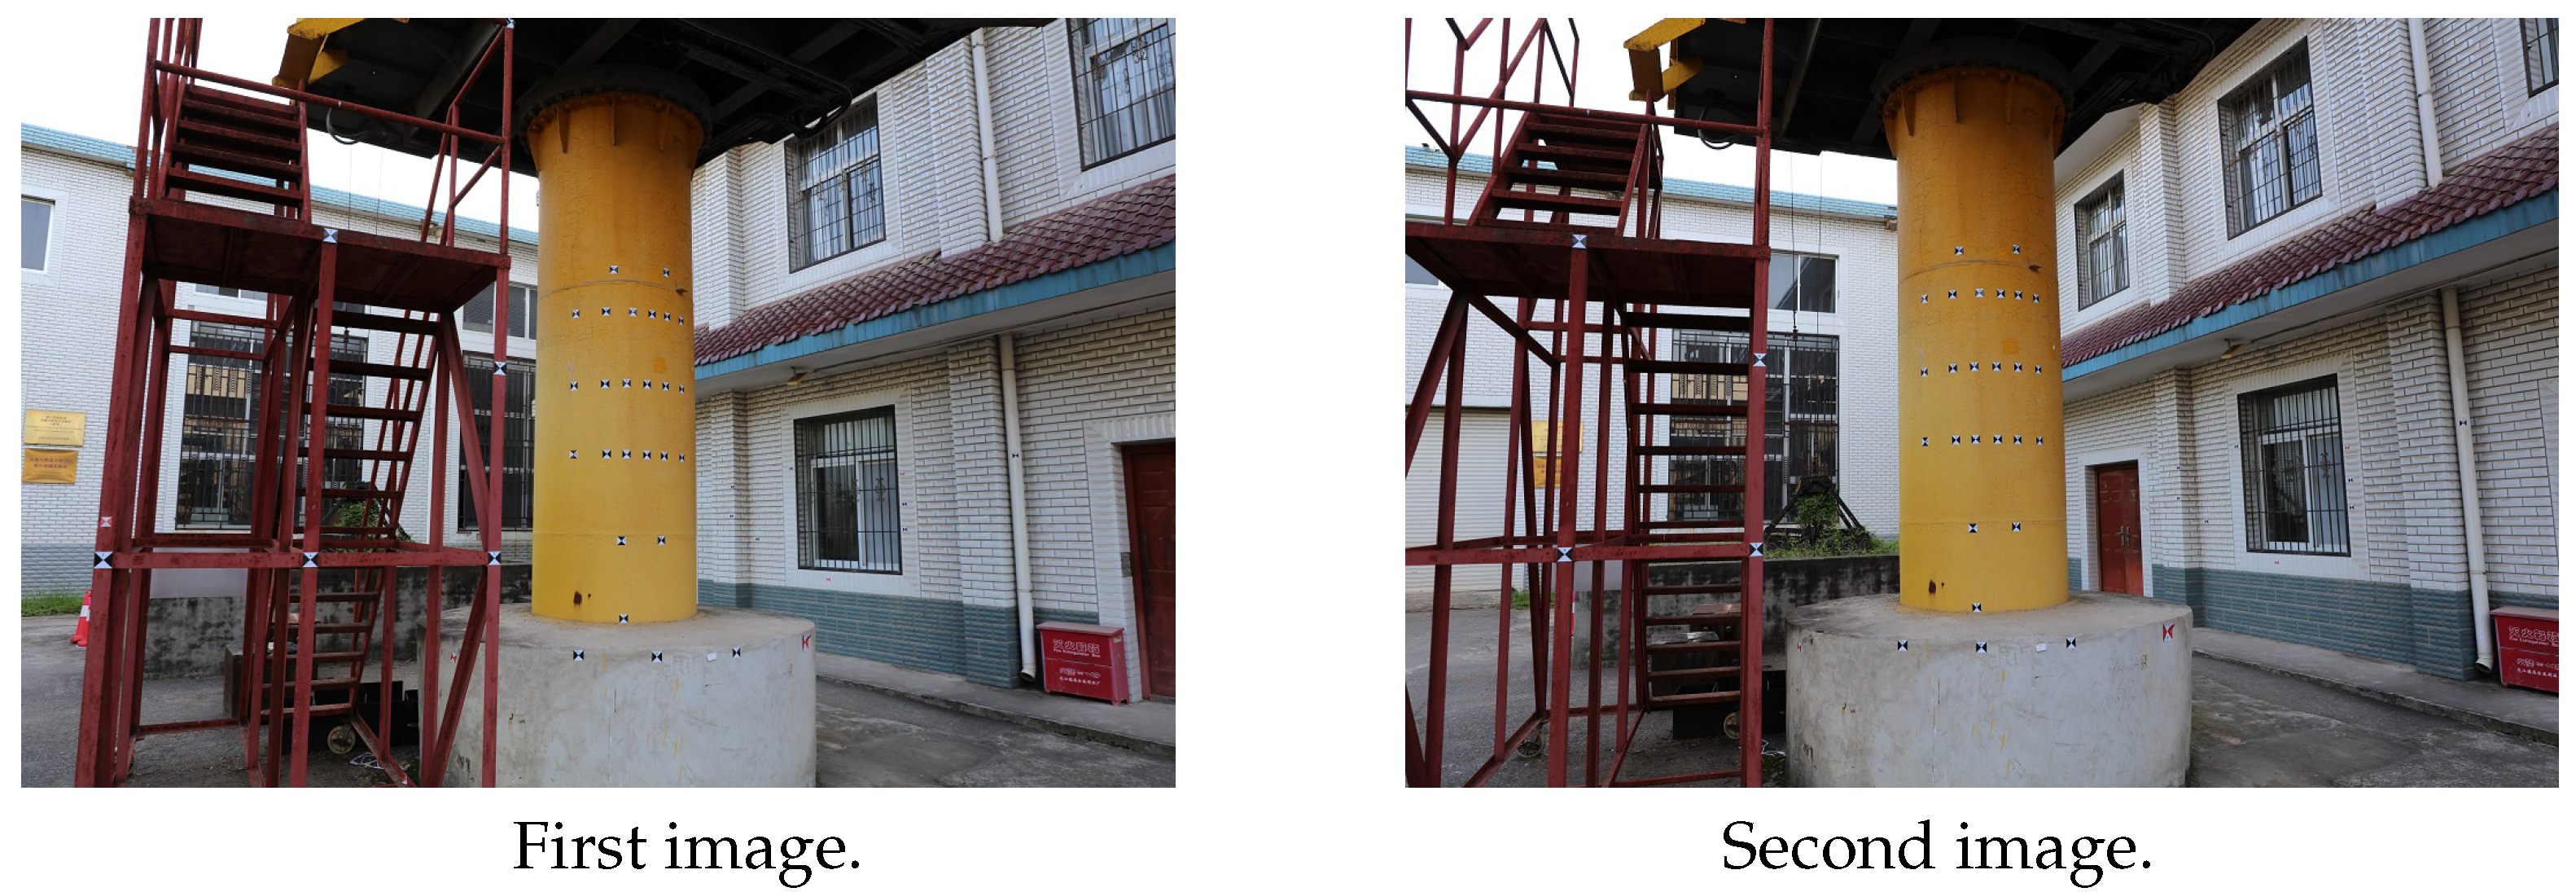
One image was taken at each of the two stations, as shown in Figure 8. According to the basic principle of photogrammetry [31], two images are used to complete the calculation of points.
The image plane coordinates of points in two images are shown in Table 8.
The six elements of exterior orientation of the two images are shown in Table 9.
The calculated coordinates of space points are shown in Table 10.

5. Results and Discussion

For the two experiments above, the changes of weights ( Q 1 , Q 2 , Q 3 ) and coordinates ( X G , Y G , Z G ) of each spatial line in the iterative process are shown in Table 11 and Table 12.
In the first experiment, the spatial coordinates of the center of the circle are known, so the measured results of the two algorithms can be compared with the true coordinates of the center of the circle. The comparison results are shown in Table 13. It can be seen from the table that the precision of the WFA is obviously higher than that of the EWFA.
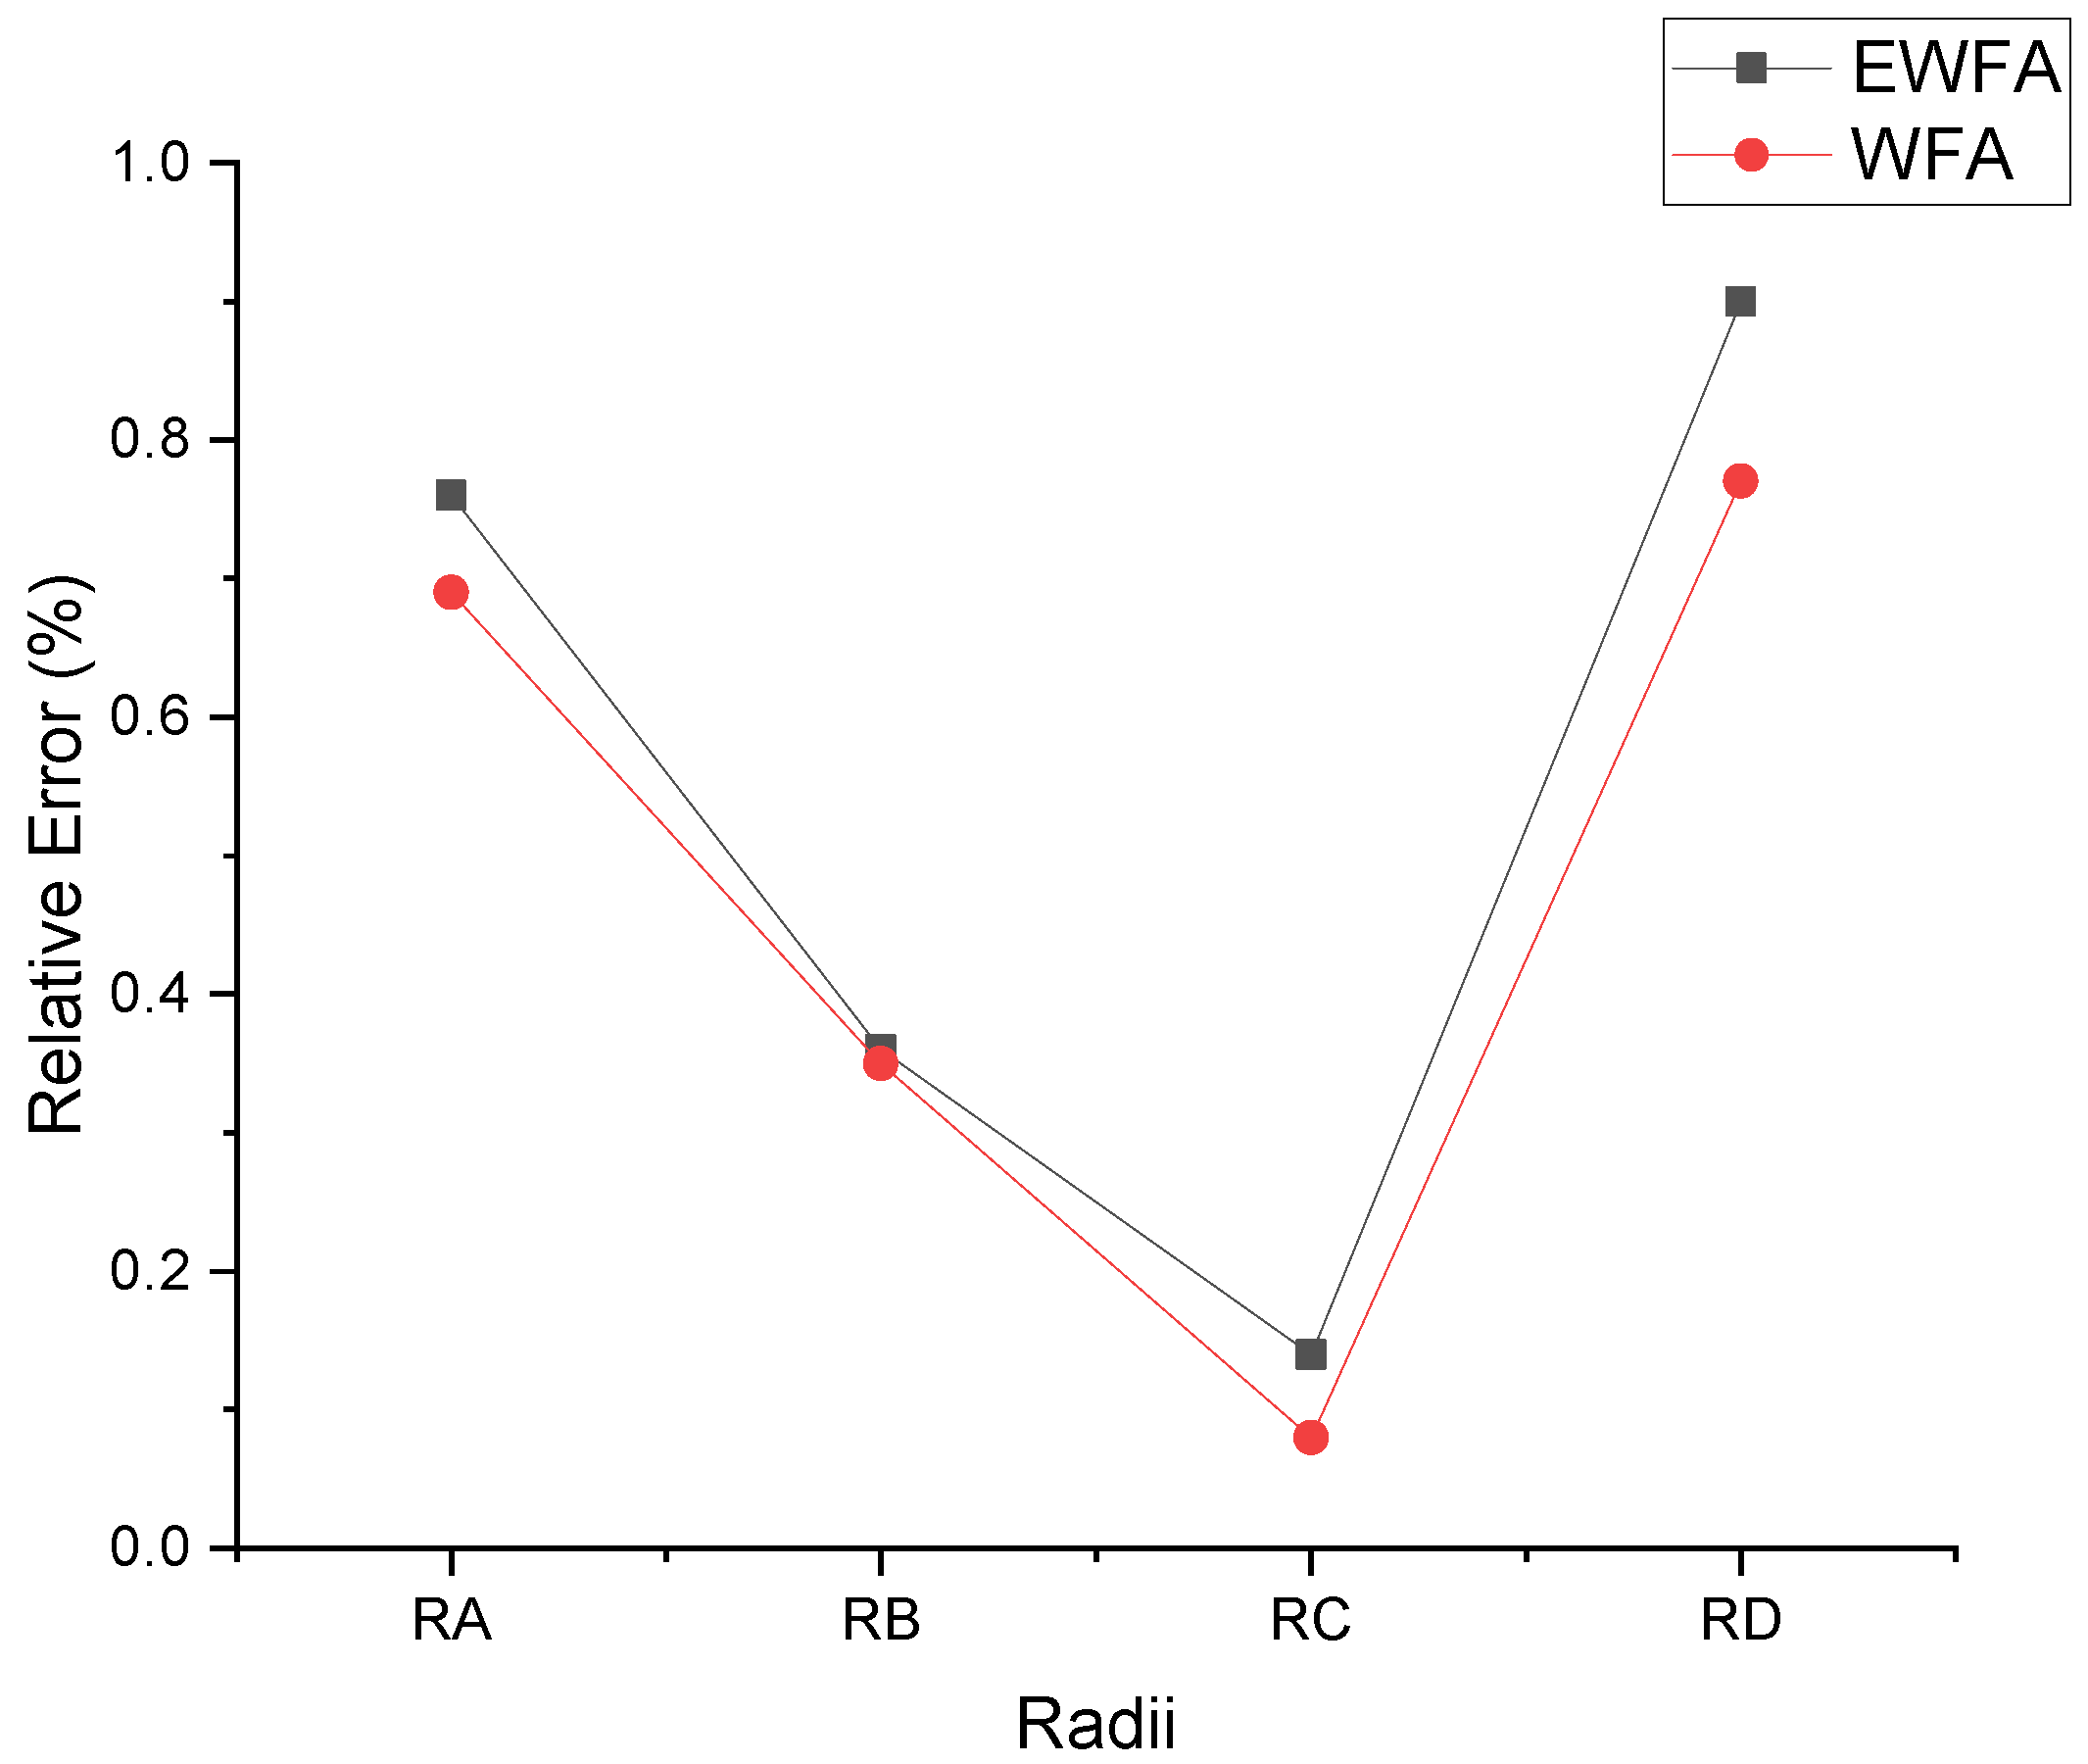
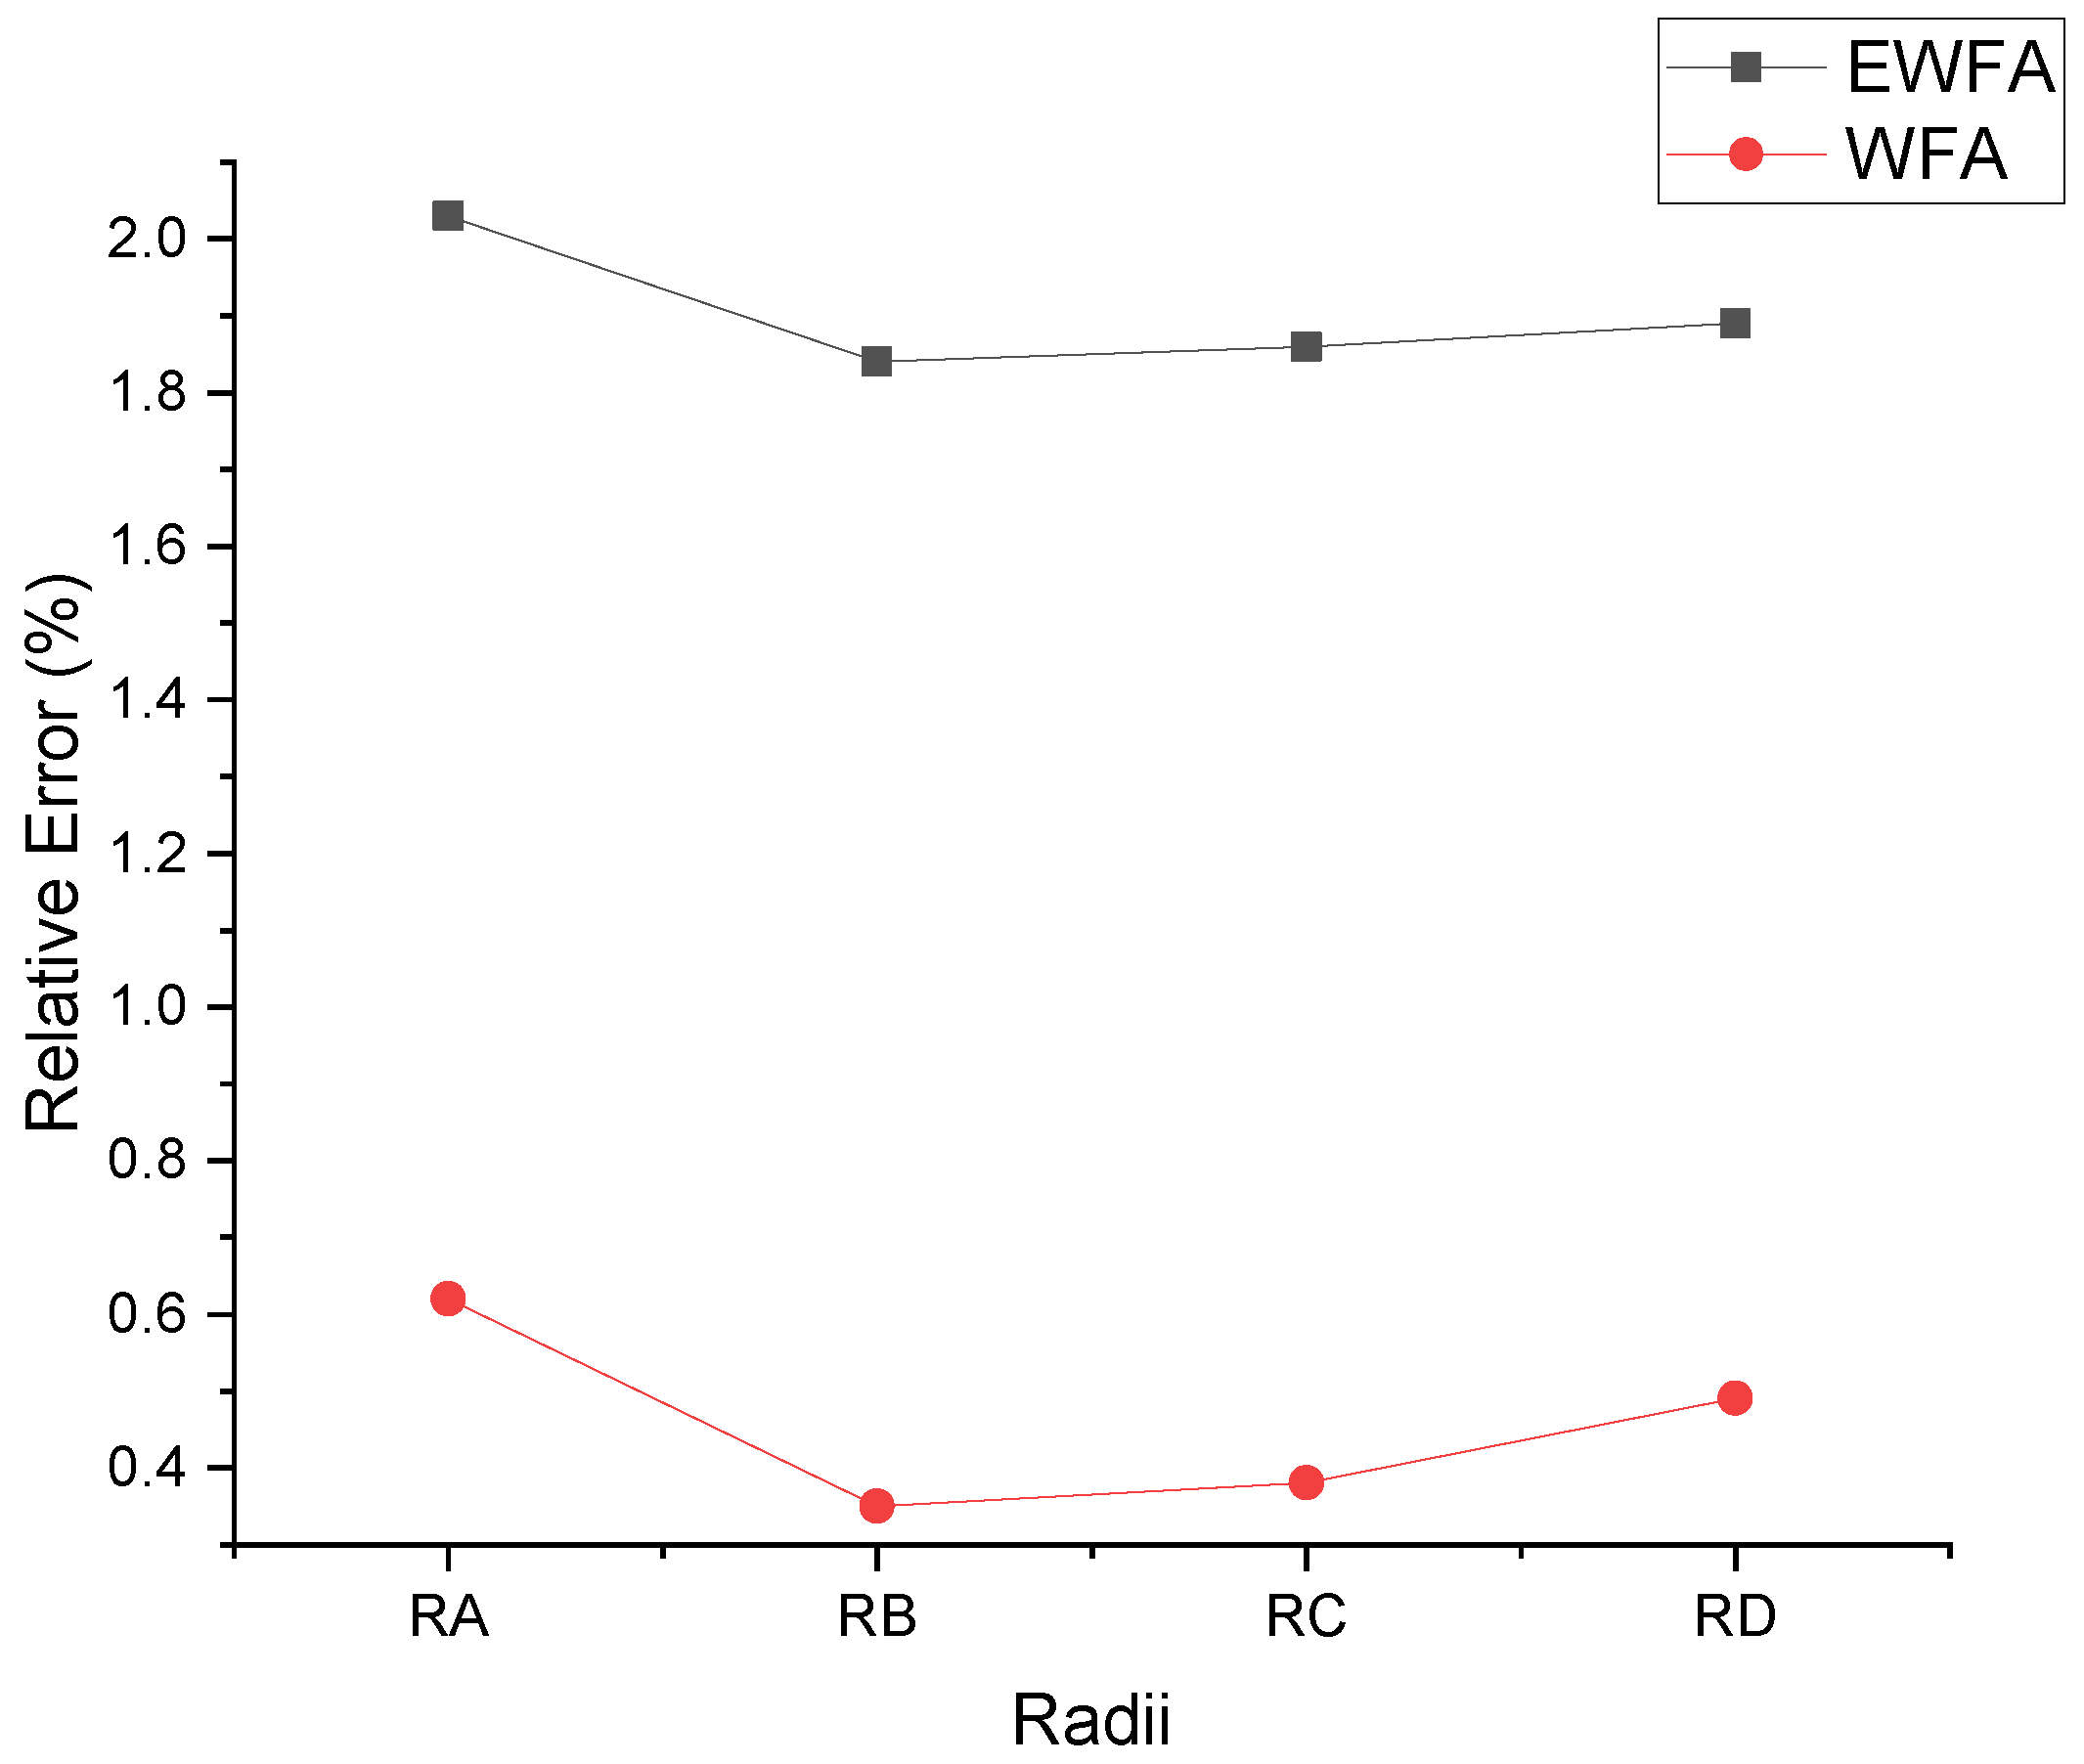
Since the second experiment is an engineering experiment, the center of the circle cannot be measured directly, and its true coordinates are unknown. Therefore, the accuracy of center fitting is evaluated by the error of multiple radii. RA, RB, RC and RD represent the radii between points A, B, C and D and the center of the circle, respectively. The radii calculated in the two experiments are shown in Table 14 and Table 15. The true radius of the first experiment is 150 mm, The true radius of the second experiment is 545 mm.
For the first experiment and the second experiment, the error between the calculated radii and the true radii is shown in Figure 9 and Figure 10.
It can be seen from Table 10 and Table 11 that the convergence speed of the algorithms is fast, and it can basically converge within 10 iterations and obtain the optimal value. As can be seen from Figure 9 and Figure 10, compared with the equal-weight midperpendicular algorithm, the four radii obtained by the weighted midperpendicular algorithm have smaller fluctuations and smaller differences with the true radii. Especially in engineering experiments, when the error is large, the optimization effect of the proposed algorithm is more obvious. Therefore, according to the above theoretical verification experiment and engineering experiment results, it can be concluded that the center of the circle fitted by the weighted iterative algorithm is more accurate.

6. Conclusions

Few scholars have studied the combination of spatial center fitting and photogrammetry. This paper examines how to use the center coordinates of the cylinder cross section of the crane to complete the safety assessment of the structure.
Considering the distortion of image points, an algorithm of fitting the center of a circle by means of the midperpendicular is proposed based on the principle of photogrammetry. First, the coordinates of each point on the circle are calculated by photogrammetry, and then the plane of the circle is fitted using the spatial coordinates. Every two points on a circle can obtain one midperpendicular, and the sum of squares of the distances between the center of the circle and the midperpendicular is the smallest. According to this constraint, the intersection points of multiple midperpendiculars are fitted. The intersection point is the center of the circle fitted by the equal weight midperpendicular algorithm. The above is the equal weighted midperpendicular algorithm. On the basis of the equal weighted midperpendicular algorithm, the weighted midperpendicular algorithm is further proposed.The space coordinates obtained by the equal weight midperpendicular algorithm are used as the initial value, and the center of the space circle is projected onto the image. The similarity between the actual midperpendicular and the ideal midperpendicular is calculated by the Hough transform on the image plane. The higher the similarity is, the higher the weight of the corresponding midperpendicular in space is and vice versa. Finally, the weighted midperpendicular is used to solve the space coordinates of the center of the circle, and projection and iteration continue until convergence. The results of the two groups of experiments show that the proposed algorithm based on the basic principle of photogrammetry and the Hough transform has high accuracy, and the effect of the equal weighted midperpendicular algorithm is obviously better than that of the weighted midperpendicular algorithm. It has strong practicability and solves the problem that the center of the circle cannot be directly measured.
The algorithm presented in this paper can be used not only for gantry cranes, but also for other large construction machinery which needs to the center of the circle measured. The algorithm has high universality and engineering application value. In the future, photogrammetry algorithms will be developed for other structural features of port machinery to solve more difficult problems in engineering measurement. Photogrammetry and computer vision technology will also be extended to more engineering fields.

Author Contributions

Z.Z. guided the direction of the paper; C.F. provided the experimental platform and completed the experiment; C.Z. analyzed the experimental data and wrote the paper. All authors have read and agreed to the published version of the manuscript.

Funding

This research received no external funding.

Institutional Review Board Statement

Not applicable.

Informed Consent Statement

Not applicable.

Data Availability Statement

Not applicable.

Acknowledgments

In the process of completing this paper, I would like to thank Zhangyan Zhao for his guidance on the direction of the paper, and thank other partners for providing key data. We also express our sincere thanks to the journal editors and anonymous reviewers for their help with the paper.

Conflicts of Interest

The authors declare no conflict of interest.

References

  1. Li, H. Research and Application of Port Crane Lightweight Technology. In Proceedings of the 2019 5th International Conference on Transportation Information and Safety (ICTIS), Liverpool, UK, 14–17 July 2019; pp. 309–312. [Google Scholar]
  2. Shen, G.; Liu, Y. Research and Application Assumptions of Health Management Theory of Large Mechanical System. Mech. Eng. J. 2017, 53, 1–9. [Google Scholar] [CrossRef] [Green Version]
  3. Zhao, N.; Fu, Z.; Sun, Y.; Pu, X.; Luo, L. Digital-twin driven energy-efficient multi-crane scheduling and crane number selection in workshops. J. Clean. Prod. 2022, 336, 130175. [Google Scholar] [CrossRef]
  4. Mugnai, F.; Caporossi, P.; Mazzanti, P. Exploiting Image Assisted Total Station in Digital Image Correlation (DIC) displacement measurements: Insights from laboratory experiments. Eur. J. Remote Sens. 2022, 55, 115–128. [Google Scholar] [CrossRef]
  5. Liu, J.; Khan, T.U.; Nie, Z.; Yu, Q.; Feng, Z. Calibration and precise orientation determination of a gun barrel for agriculture and forestry work using a high-precision total station. Measurement 2021, 173, 108494. [Google Scholar] [CrossRef]
  6. Grepl, J.; Landryova, L. Using Laser Scanners. In Proceedings of the 2016 17th International Carpathian Control Conference (ICCC), Tatranska Lomnica, Slovakia, 29 May–1 June 2016; pp. 218–221. [Google Scholar]
  7. Helma, V.; Goubej, M. Active anti-sway crane control using partial state feedback from inertial sensor. In Proceedings of the 2021 23rd International Conference on Process Control (PC), Štrbské Pleso, Slovakia, 1–4 June 2021; pp. 137–142. [Google Scholar]
  8. Huang, G. Theory, Method and Application of Digital Close-Range Photogrammetry; Science Press: Beijing, China, 2016. [Google Scholar]
  9. Bastas, A. Comparing the probing systems of coordinate measurement machine: Scanning probe versus touch-trigger probe. Measurement 2020, 156, 107604. [Google Scholar] [CrossRef]
  10. Burge, J.H.; Su, P.; Zhao, C.; Zobrist, T. Use of a commercial laser tracker for optical alignment. Opt. Syst. Alignment Toler. 2007, 6676, 132–143. [Google Scholar]
  11. Voulodimos, A.; Doulamis, N.; Doulamis, A.; Protopapadakis, E. Deep Learning for Computer Vision: A Brief Review. Comput. Intell. Neurosci. 2018, 2018, 7068349. [Google Scholar] [CrossRef] [PubMed]
  12. Kruger, N.; Janssen, P.; Kalkan, S.; Lappe, M.; Leonardis, A.; Piater, J.; Rodriguez-Sanchez, A.J.; Wiskott, L. Deep Hierarchies in the Primate Visual Cortex: What Can We Learn for Computer Vision? IEEE Trans. Pattern Anal. Mach. Intell. 2013, 35, 1847–1871. [Google Scholar] [CrossRef]
  13. Ye, X.W.; Dong, C.Z.; Liu, T. A Review of Machine Vision-Based Structural Health Monitoring: Methodologies and Applications. J. Sens. 2016, 2016, 7103039. [Google Scholar] [CrossRef] [Green Version]
  14. Zhang, Z.; Zheng, S.; Wang, X. Development and Application of Industrial Photogrammetry technology. J. Surv. Mapp. 2022, 51, 843–853. [Google Scholar]
  15. Cheng, X. Research on Application of Digital Close-Range Photogrammetry in Engineering. Ph.D. Thesis, Tongji University, Shanghai, China, 2002. [Google Scholar]
  16. Xu, J. Industrial Measurement Technology and Data Processing; Wuhan University Press: Wuhan, China, 2014. [Google Scholar]
  17. Li, A. Research on Safety Assessment Methods of Quayside Container Crane. Ph.D. Thesis, Wuhan University of Technology, Wuhan, China, 2017. [Google Scholar]
  18. Wang, Q.; Zhao, Z. An Accurate and Stable Pose Estimation Method Based on Geometry for Port Hoisting Machinery. IEEE Access 2019, 7, 39117–39128. [Google Scholar] [CrossRef]
  19. Lu, E.; Zhao, Z.; Wang, Q.; Liu, Y.; Liu, L. A weighting intersection point prediction iteration optimization algorithm used in photogrammetry for port hoisting machinery. Opt. Laser Technol. 2019, 111, 323–330. [Google Scholar] [CrossRef]
  20. Ren, L.x.; Ma, J.q.; Tong, Y.t.; Huang, Z.q. A review of fatigue life prediction method for portal crane. In Proceedings of the 2020 International Symposium on Energy Environment and Green Development, Shijiazhuang, China, 18–20 November 2021; Volume 657. [Google Scholar]
  21. Im, S.; Park, D. Crane safety standards: Problem analysis and safety assurance planning. Saf. Sci. 2020, 127, 104686. [Google Scholar] [CrossRef]
  22. Pfingstl, S.; Steiner, M.; Tusch, O.; Zimmermann, M. Crack Detection Zones: Computation and Validation. Sensors 2020, 20, 2568. [Google Scholar] [CrossRef] [PubMed]
  23. Chernov, N.; Lesort, C. Least squares fitting of circles. J. Math. Imaging Vis. 2005, 23, 239–252. [Google Scholar] [CrossRef]
  24. Marrugo, A.G.; Gao, F.; Zhang, S. State-of-the-art active optical techniques for three-dimensional surface metrology: A review [Invited]. J. Opt. Soc. Am.-Opt. Image Sci. Vis. 2020, 37, B60–B77. [Google Scholar] [CrossRef] [PubMed]
  25. Zhang, Z. A flexible new technique for camera calibration. IEEE Trans. Pattern Anal. Mach. Intell. 2000, 22, 1330–1334. [Google Scholar] [CrossRef] [Green Version]
  26. Mukhopadhyay, P.; Chaudhuri, B.B. A survey of Hough Transform. Pattern Recognit. 2015, 48, 993–1010. [Google Scholar] [CrossRef]
  27. Rong, F.; Cui, D.-W.; Bo, H. A novel Hough transform algorithm for multi-objective detection. In Proceedings of the 2009 Third International Symposium on Intelligent Information Technology Application, Nanchang, China, 21–22 November 2009; Volume 3, pp. 705–708. [Google Scholar]
  28. Matas, J.; Galambos, C.; Kittler, J. Robust detection of lines using the progressive probabilistic Hough transform. Comput. Vis. Image Underst. 2000, 78, 119–137. [Google Scholar] [CrossRef]
  29. Sun, J.; Liu, Q.; Liu, Z.; Zhang, G. A calibration method for stereo vision sensor with large FOV based on 1D targets. Opt. Lasers Eng. 2011, 49, 1245–1250. [Google Scholar] [CrossRef]
  30. Meng, X.; Hu, Z. A new easy camera calibration technique based on circular points. Pattern Recognit. 2003, 36, 1155–1164. [Google Scholar] [CrossRef]
  31. Wang, Z. Principle of Photogrammetry; Surveying and Mapping Publishing House: Beijing, China, 1979. [Google Scholar]
Figure 1. Diagram of center fitting.
Applsci 12 10341 g001
Figure 2. Diagram of Image point distortion.
Applsci 12 10341 g002
Figure 3. Flowchart of calculation.
Applsci 12 10341 g003
Figure 4. Flowchart of experiment.
Applsci 12 10341 g004
Figure 5. The experimental model.
Applsci 12 10341 g005
Figure 6. Images of the model.
Applsci 12 10341 g006
Figure 7. Points selection diagram of crane.
Applsci 12 10341 g007
Figure 8. Images of the crane.
Applsci 12 10341 g008
Figure 9. The error of radii in the first experiment.
Applsci 12 10341 g009
Figure 10. The error of radii in the second experiment.
Applsci 12 10341 g010
Table 1. Camera parameters of first experiment.
f (mm)ResolutionPixel Size (μm) Δ x (mm) Δ y (mm) k 1 k 2
48.198688 × 57924.143650.01892−0.15786−0.08748−0.73372
Table 2. The object space coordinates of first experiment.
PointsX (mm)Y (mm)Z (mm)
1−203400
2000
328000
400200
52001800
600100
A12550.096218
B179.903810518
C20018018
D125309.903818
G5018018
Table 3. Image plane coordinates of the two images of first experiment.
First ImageSecond Image
Pointsx  (mm)y  (mm)x  (mm)y  (mm)
16.18674.48685.17251.6796
2−5.49854.3206−6.31703.0732
3−7.237610.4184−5.75829.3107
4−5.8047−1.9510−6.9455−3.2973
50.27908.82371.06816.5986
6−5.65051.2744−6.6369−0.0267
A−4.37366.3158−4.24504.8427
B−2.53967.6163−1.94315.8007
C0.31328.23371.09735.9870
D5.38366.78335.39523.9046
Table 4. The elements of exterior orientation of the two images in first experiment.
First ImageSecond Image
X S (mm)1191.77391181.1086
Y S (mm)209.19366.4546
Z S (mm)742.3528−7.3536
φ (rad)14.5999−7.3536
ω (rad)0.03823.2725
κ (rad)−7.893720.5072
Table 5. Calculation results of space points of first experiment.
ResultsX (mm)Y (mm)Z (mm)
A124.832350.469017.1753
B178.0394104.782716.4942
C201.4920178.986818.2143
D126.8505309.511517.7871
Table 6. Camera parameters of second experiment.
f (mm)ResolutionPixel Size (μm) Δ x (mm) Δ y (mm) k 1 k 2
25.568688 × 57924.143650.01890−0.15772−0.08845−0.74784
Table 7. The object space coordinates of second experiment.
PointsX (mm)Y (mm)Z (mm)
1170.316775.2417842.0083
2−319.4833581.4417−1314.9917
3−506.3833250.7417−1322.1917
4−588.5833−180.6583−1325.1917
595.4167−259.7583858.6083
6152.616720.3417−1217.4917
A118.9167−25.1583578.9083
B96.2167−151.0583578.6083
C99.6167−264.4583578.8083
D134.9167−398.4583578.9083
Table 8. Image plane coordinates of the two images in second experiment.
First ImageSecond Image
Pointsx  (mm)y  (mm)x  (mm)y  (mm)
10.4666−4.0025−0.7369−4.5946
2−0.63968.0258−2.49637.7159
31.80838.0767−0.03917.7759
44.29247.93962.76417.6439
52.0959−3.91651.0454−4.6371
60.76906.8769−0.18576.5337
A1.0561−2.6815−0.0975−3.2805
B1.6578−2.61760.5660−3.2588
C2.1248−2.53791.1112−3.2081
D2.5611−2.40741.6682−3.1037
Table 9. The elements of exterior orientation of the two images in second experiment.
First ImageSecond Image
X S (mm)−3904.4757−4225.2792
Y S (mm)2611.19731679.2832
Z S (mm)−686.9809−695.0026
φ (rad)−1.3931−1.4217
ω (rad)0.53130.3714
κ (rad)1.47731.5399
Table 10. Calculation results of space points of second experiment.
ResultsX (mm)Y (mm)Z (mm)
A119.54−27.75579.79
B97.19−153.39579.34
C99.90−266.98579.05
D136.87−401.06578.15
Table 11. The iteration of first experiment.
Iteration1...910
Q 1 0.2307...0.34400.3440
Q 2 0.1919...0.31220.3122
Q 3 0.5774...0.34380.3438
X G (mm)50.2157...50.135750.1357
Y G (mm)181.4355...181.2654181.2654
Z G (mm)17.0186...17.020017.0200
Table 12. The iteration of second experiment.
Iteration1...910
Q 1 0.1368...0.14810.1481
Q 2 0.2092...0.21420.2142
Q 3 0.6540...0.63770.6377
X G (mm)649.8079...641.6656641.6656
Y G (mm)−190.5701...−190.7673−190.7673
Z G (mm)575.2937...575.3672575.3672
Table 13. Error comparison of the first experiment.
Results (mm)EWFAWFA
Δ X 0.21570.1357
Δ Y 1.43551.2654
Δ Z −0.9814−0.9800
Table 14. The calculated radii of the first experiment.
EWFAWFA
Results (mm)Measured ValuesRelative ErrorMeasured ValuesRelative Error
RA151.14120.76%151.03310.69%
RB150.54020.36%150.52290.35%
RC149.79440.14%149.87290.08%
RD148.65310.90%148.84040.77%
Table 15. The calculated radii of the second experiment.
EWFAWFA
Results (mm)Measured ValuesRelative ErrorMeasured ValuesRelative Error
RA556.07522.03%548.36610.62%
RB555.00941.84%546.90210.35%
RC555.14161.86%547.04600.38%
RD555.28691.89%547.67020.49%
Publisher’s Note: MDPI stays neutral with regard to jurisdictional claims in published maps and institutional affiliations.