
Evaluation of Different Internal Designs of Hydraulic Nozzles under an Accelerated Wear Test


Abstract
1. Introduction
2. Materials and Methods
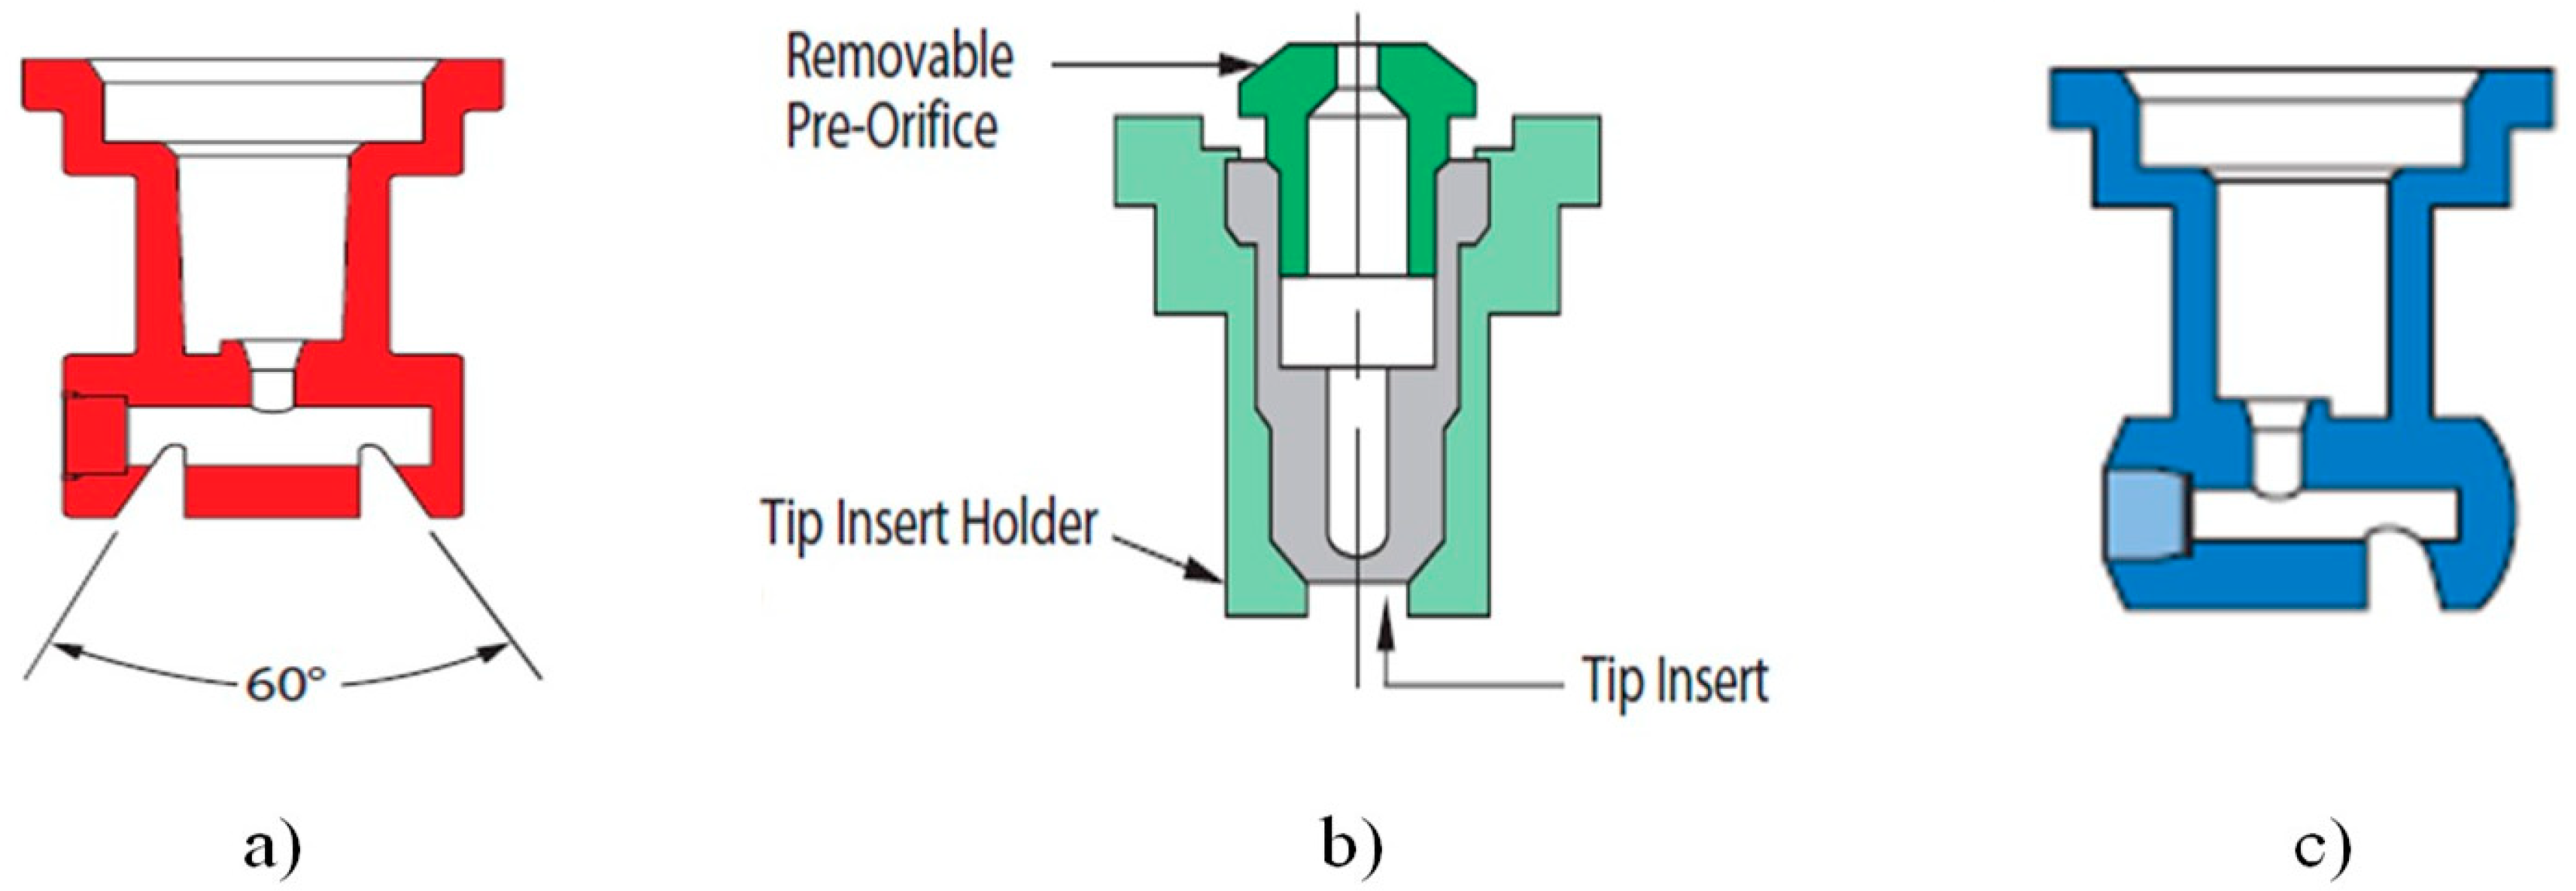
2.1. Nozzle Characteristics
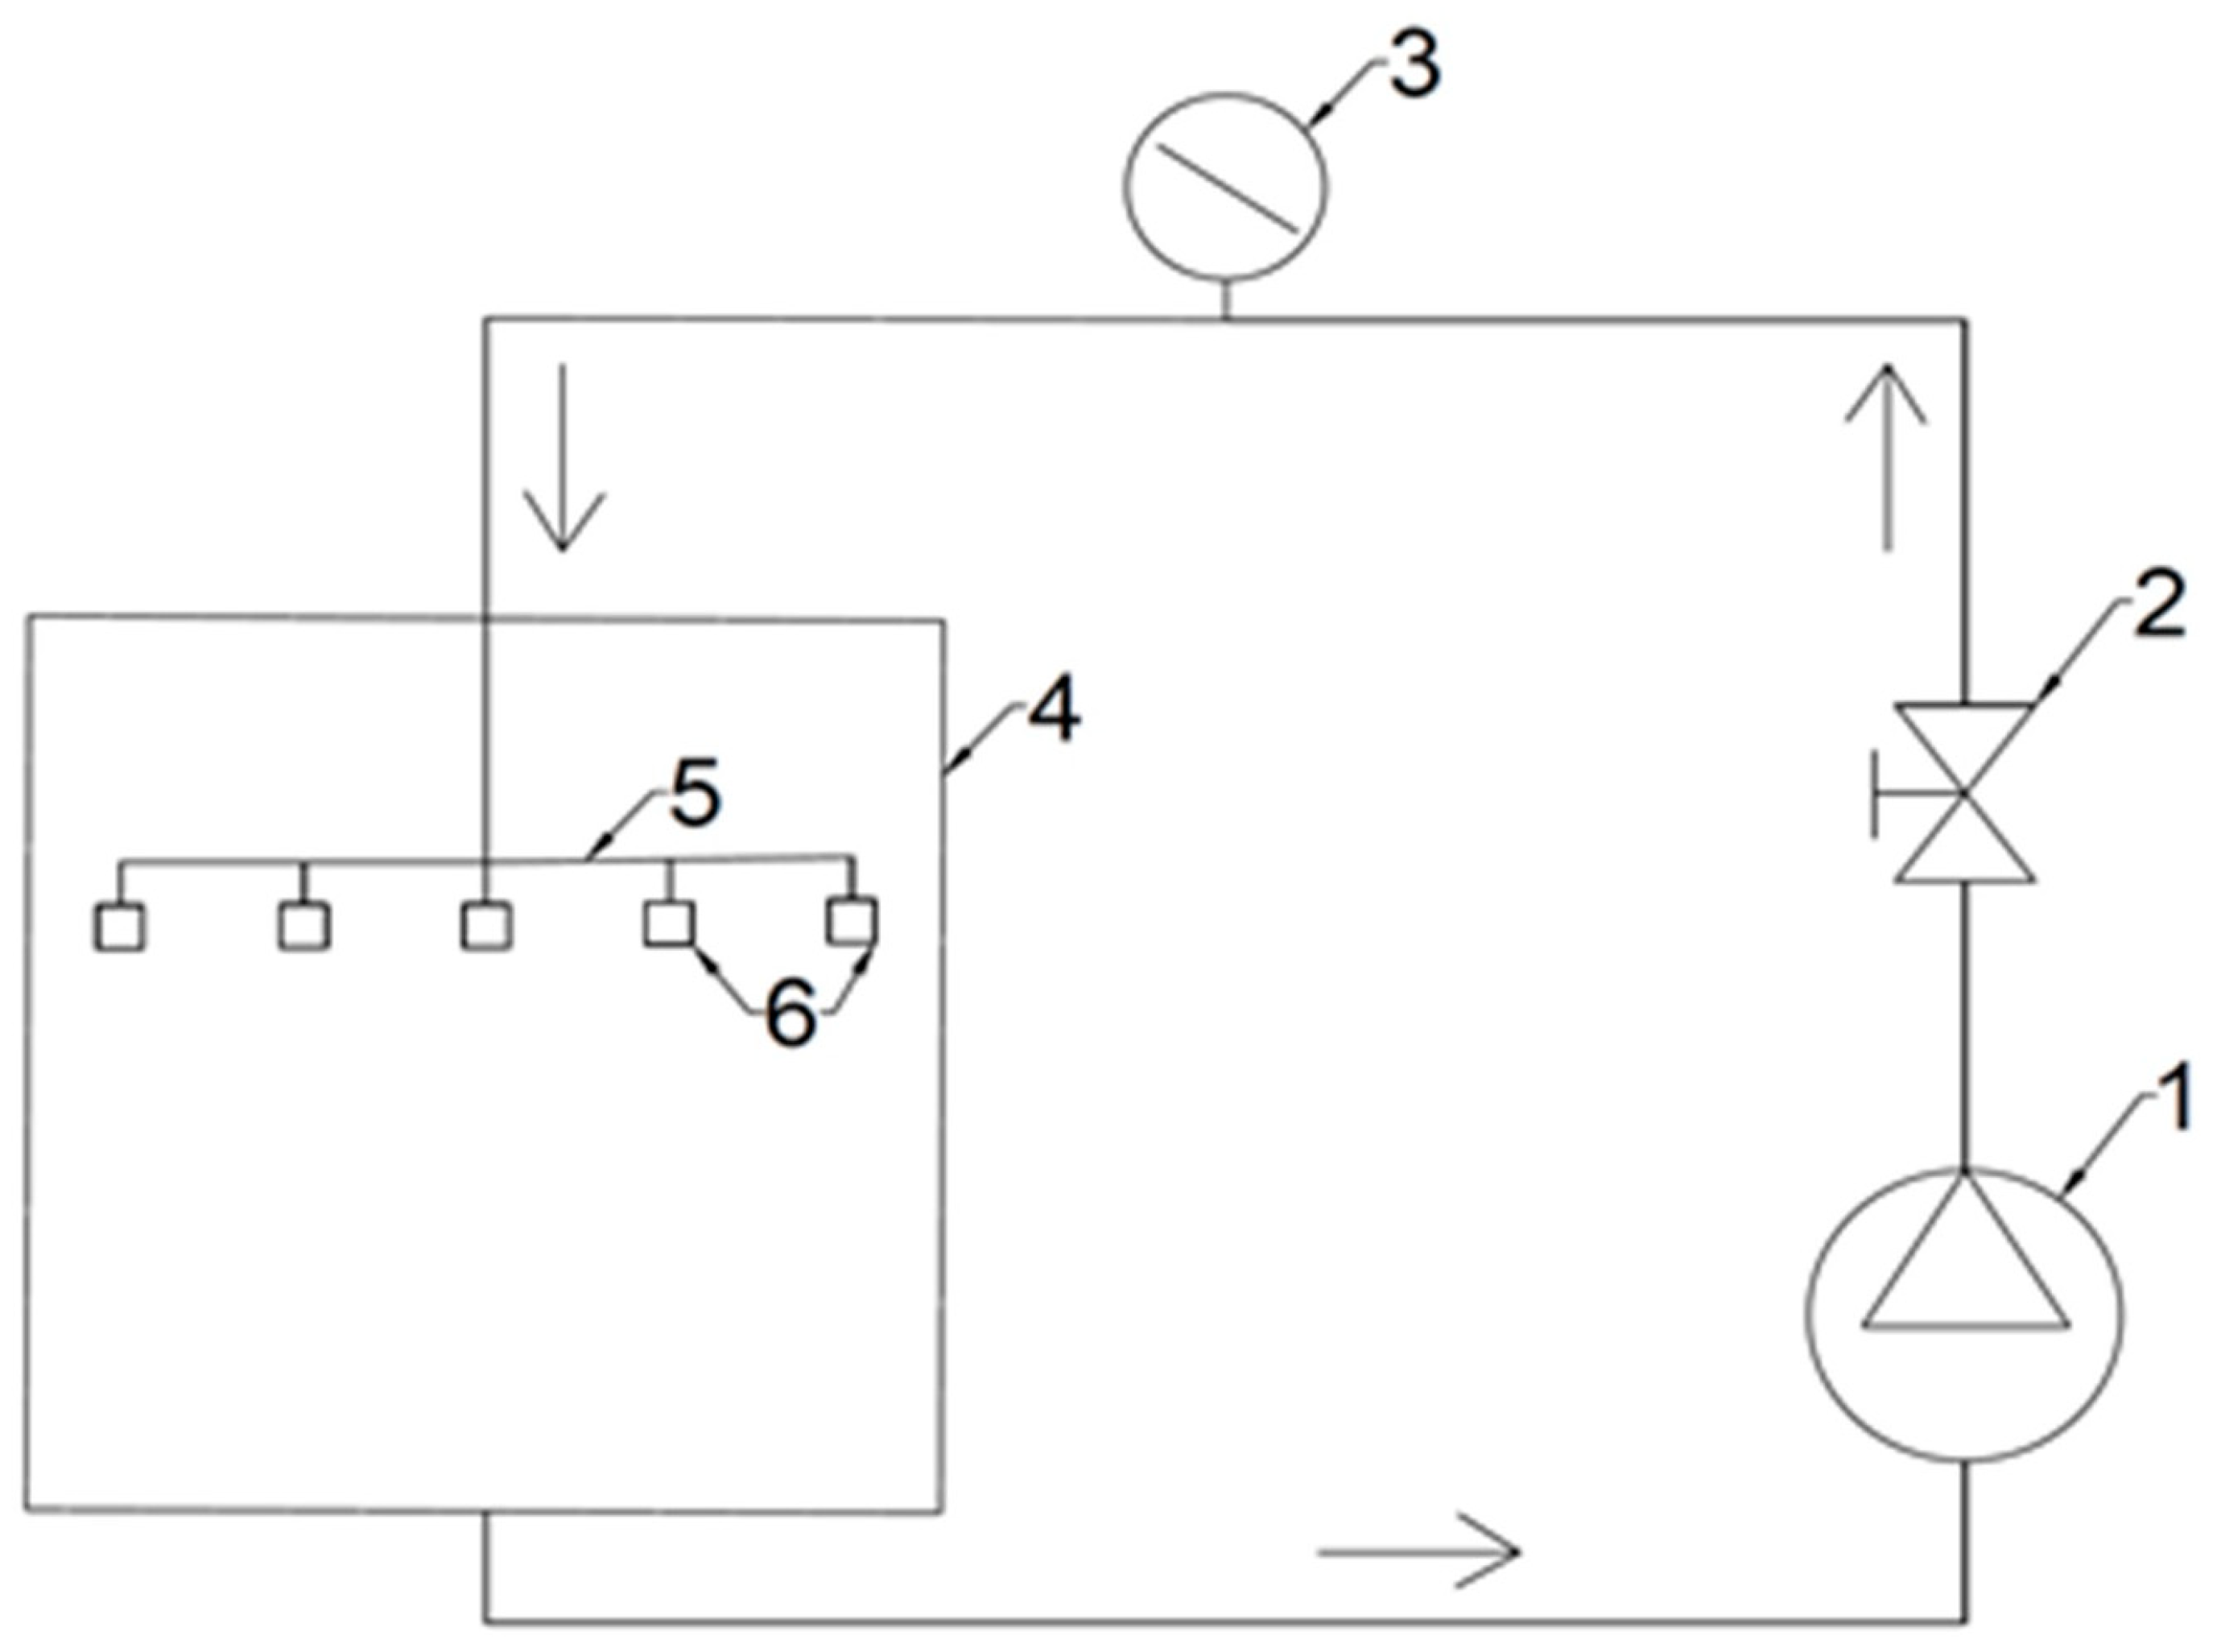
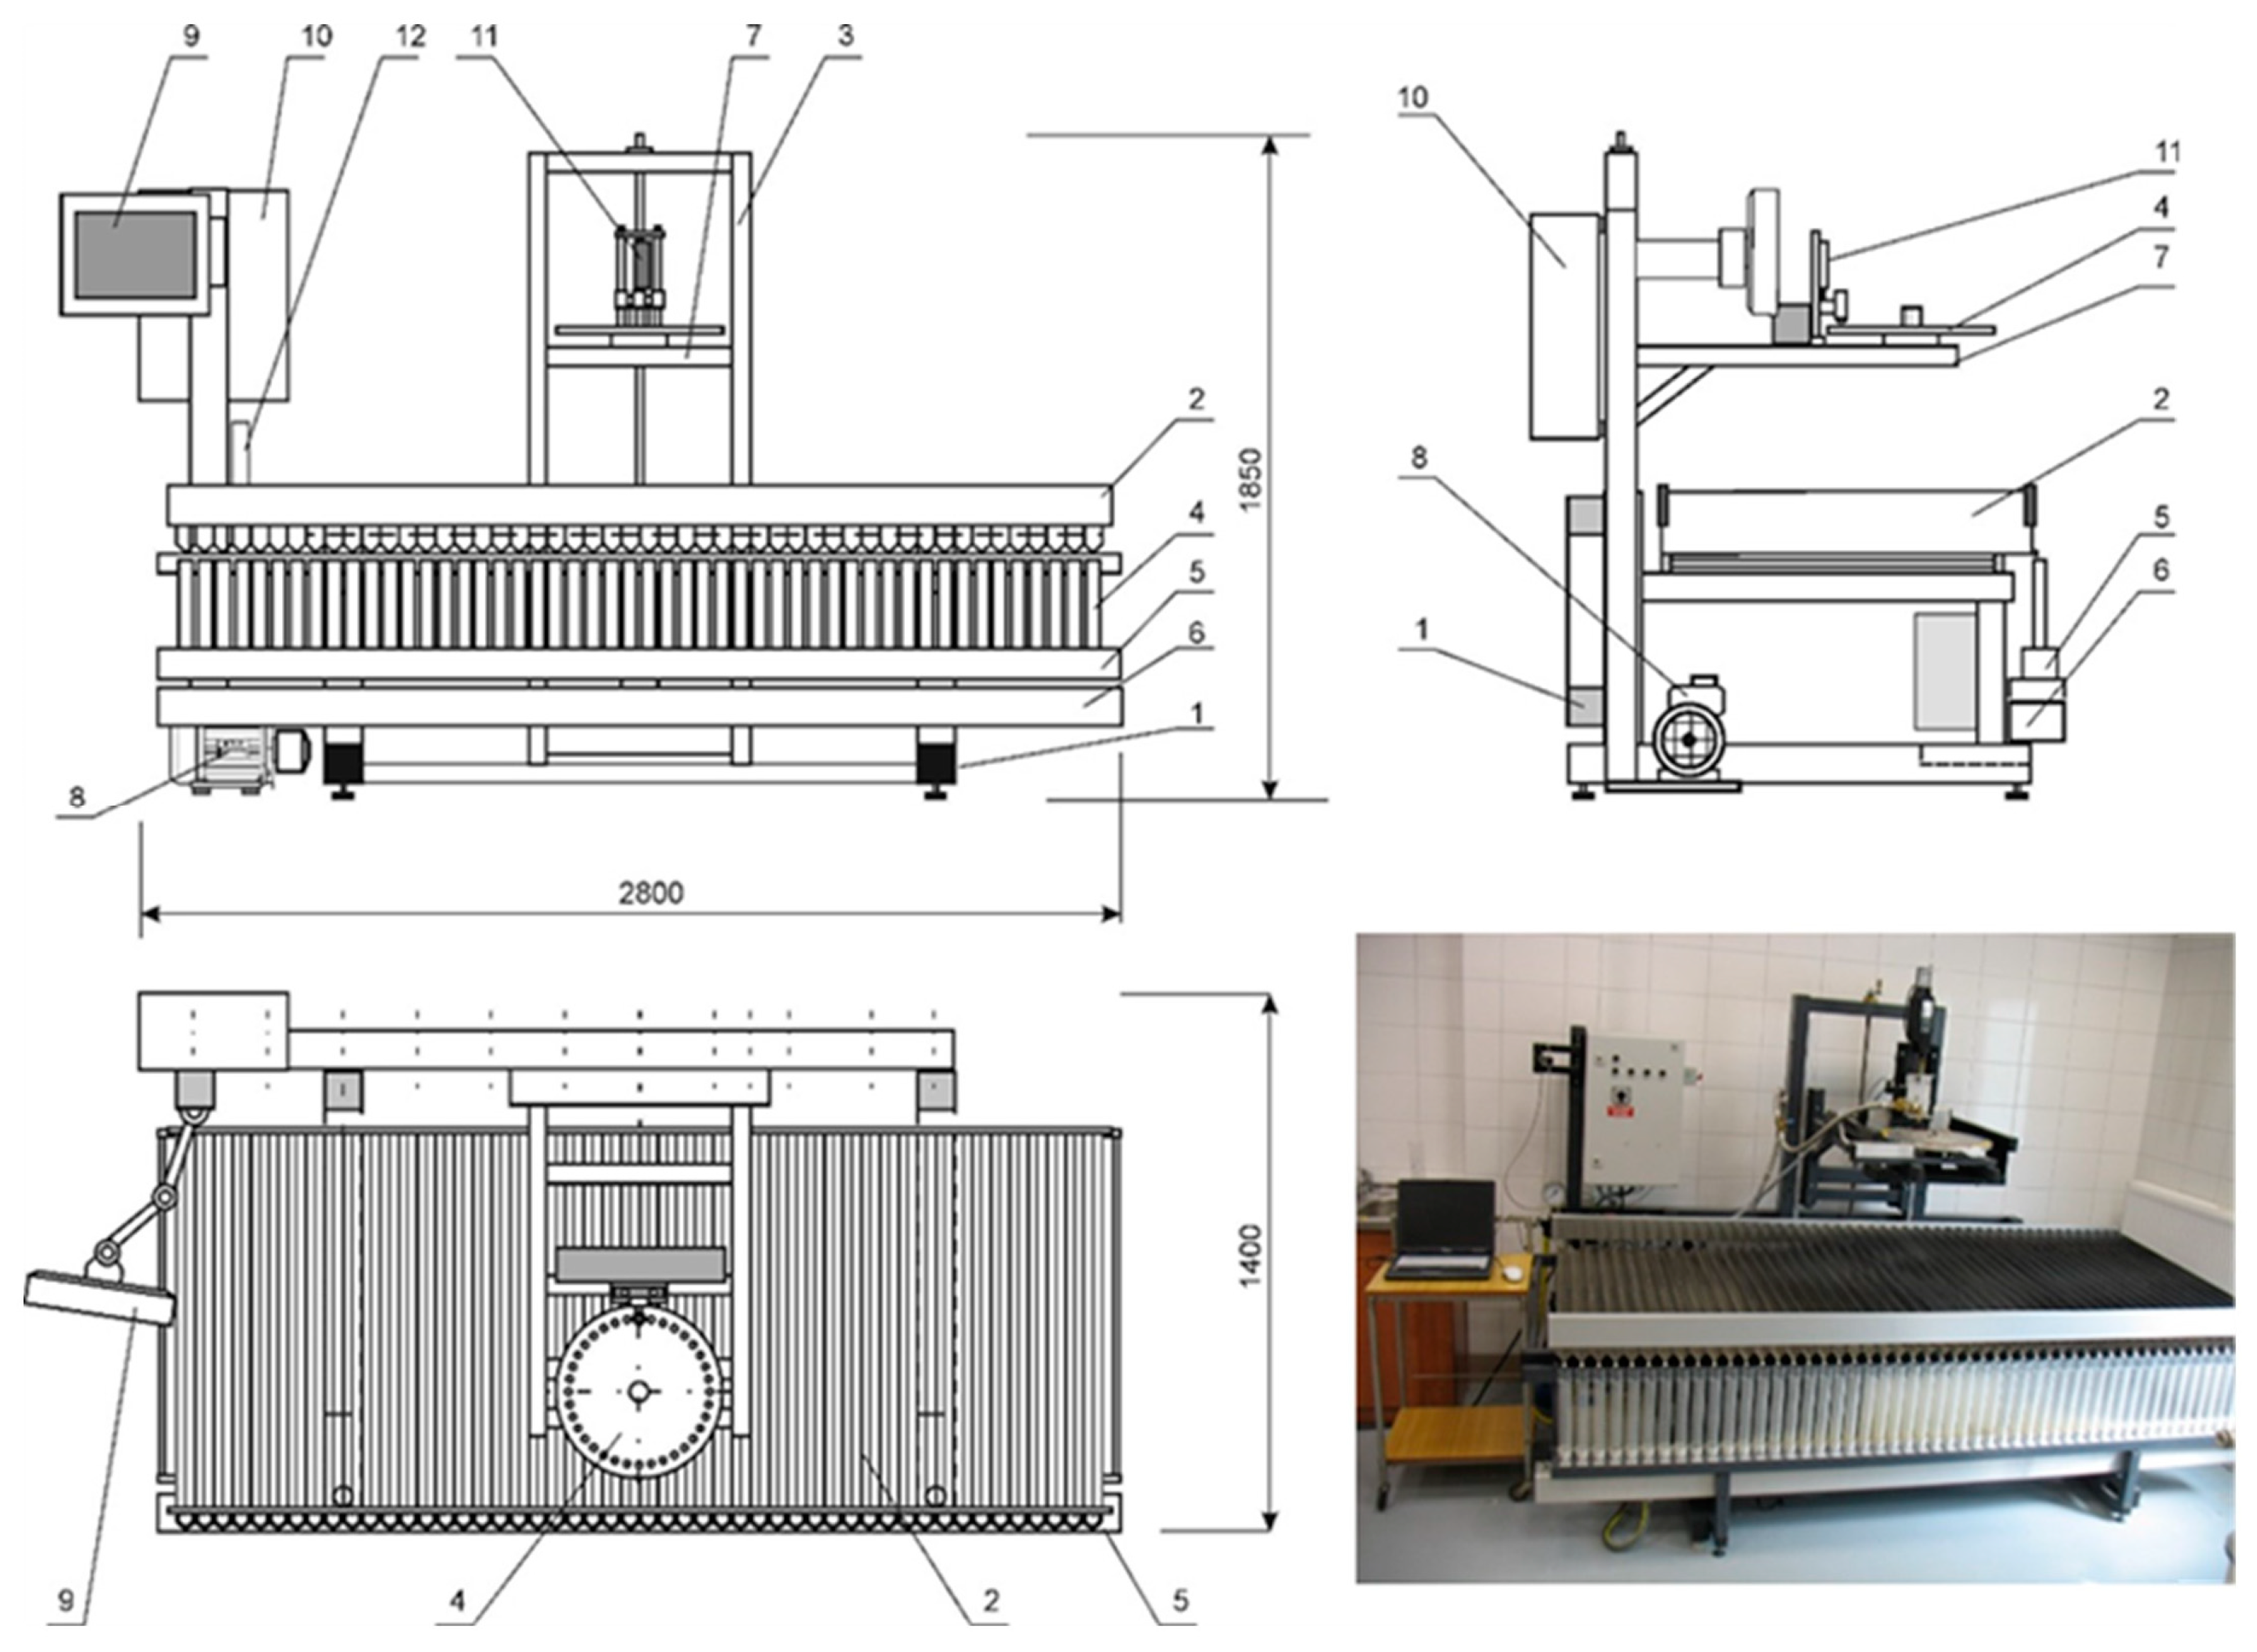
2.2. The Wear Test and Flow Rate Measurement
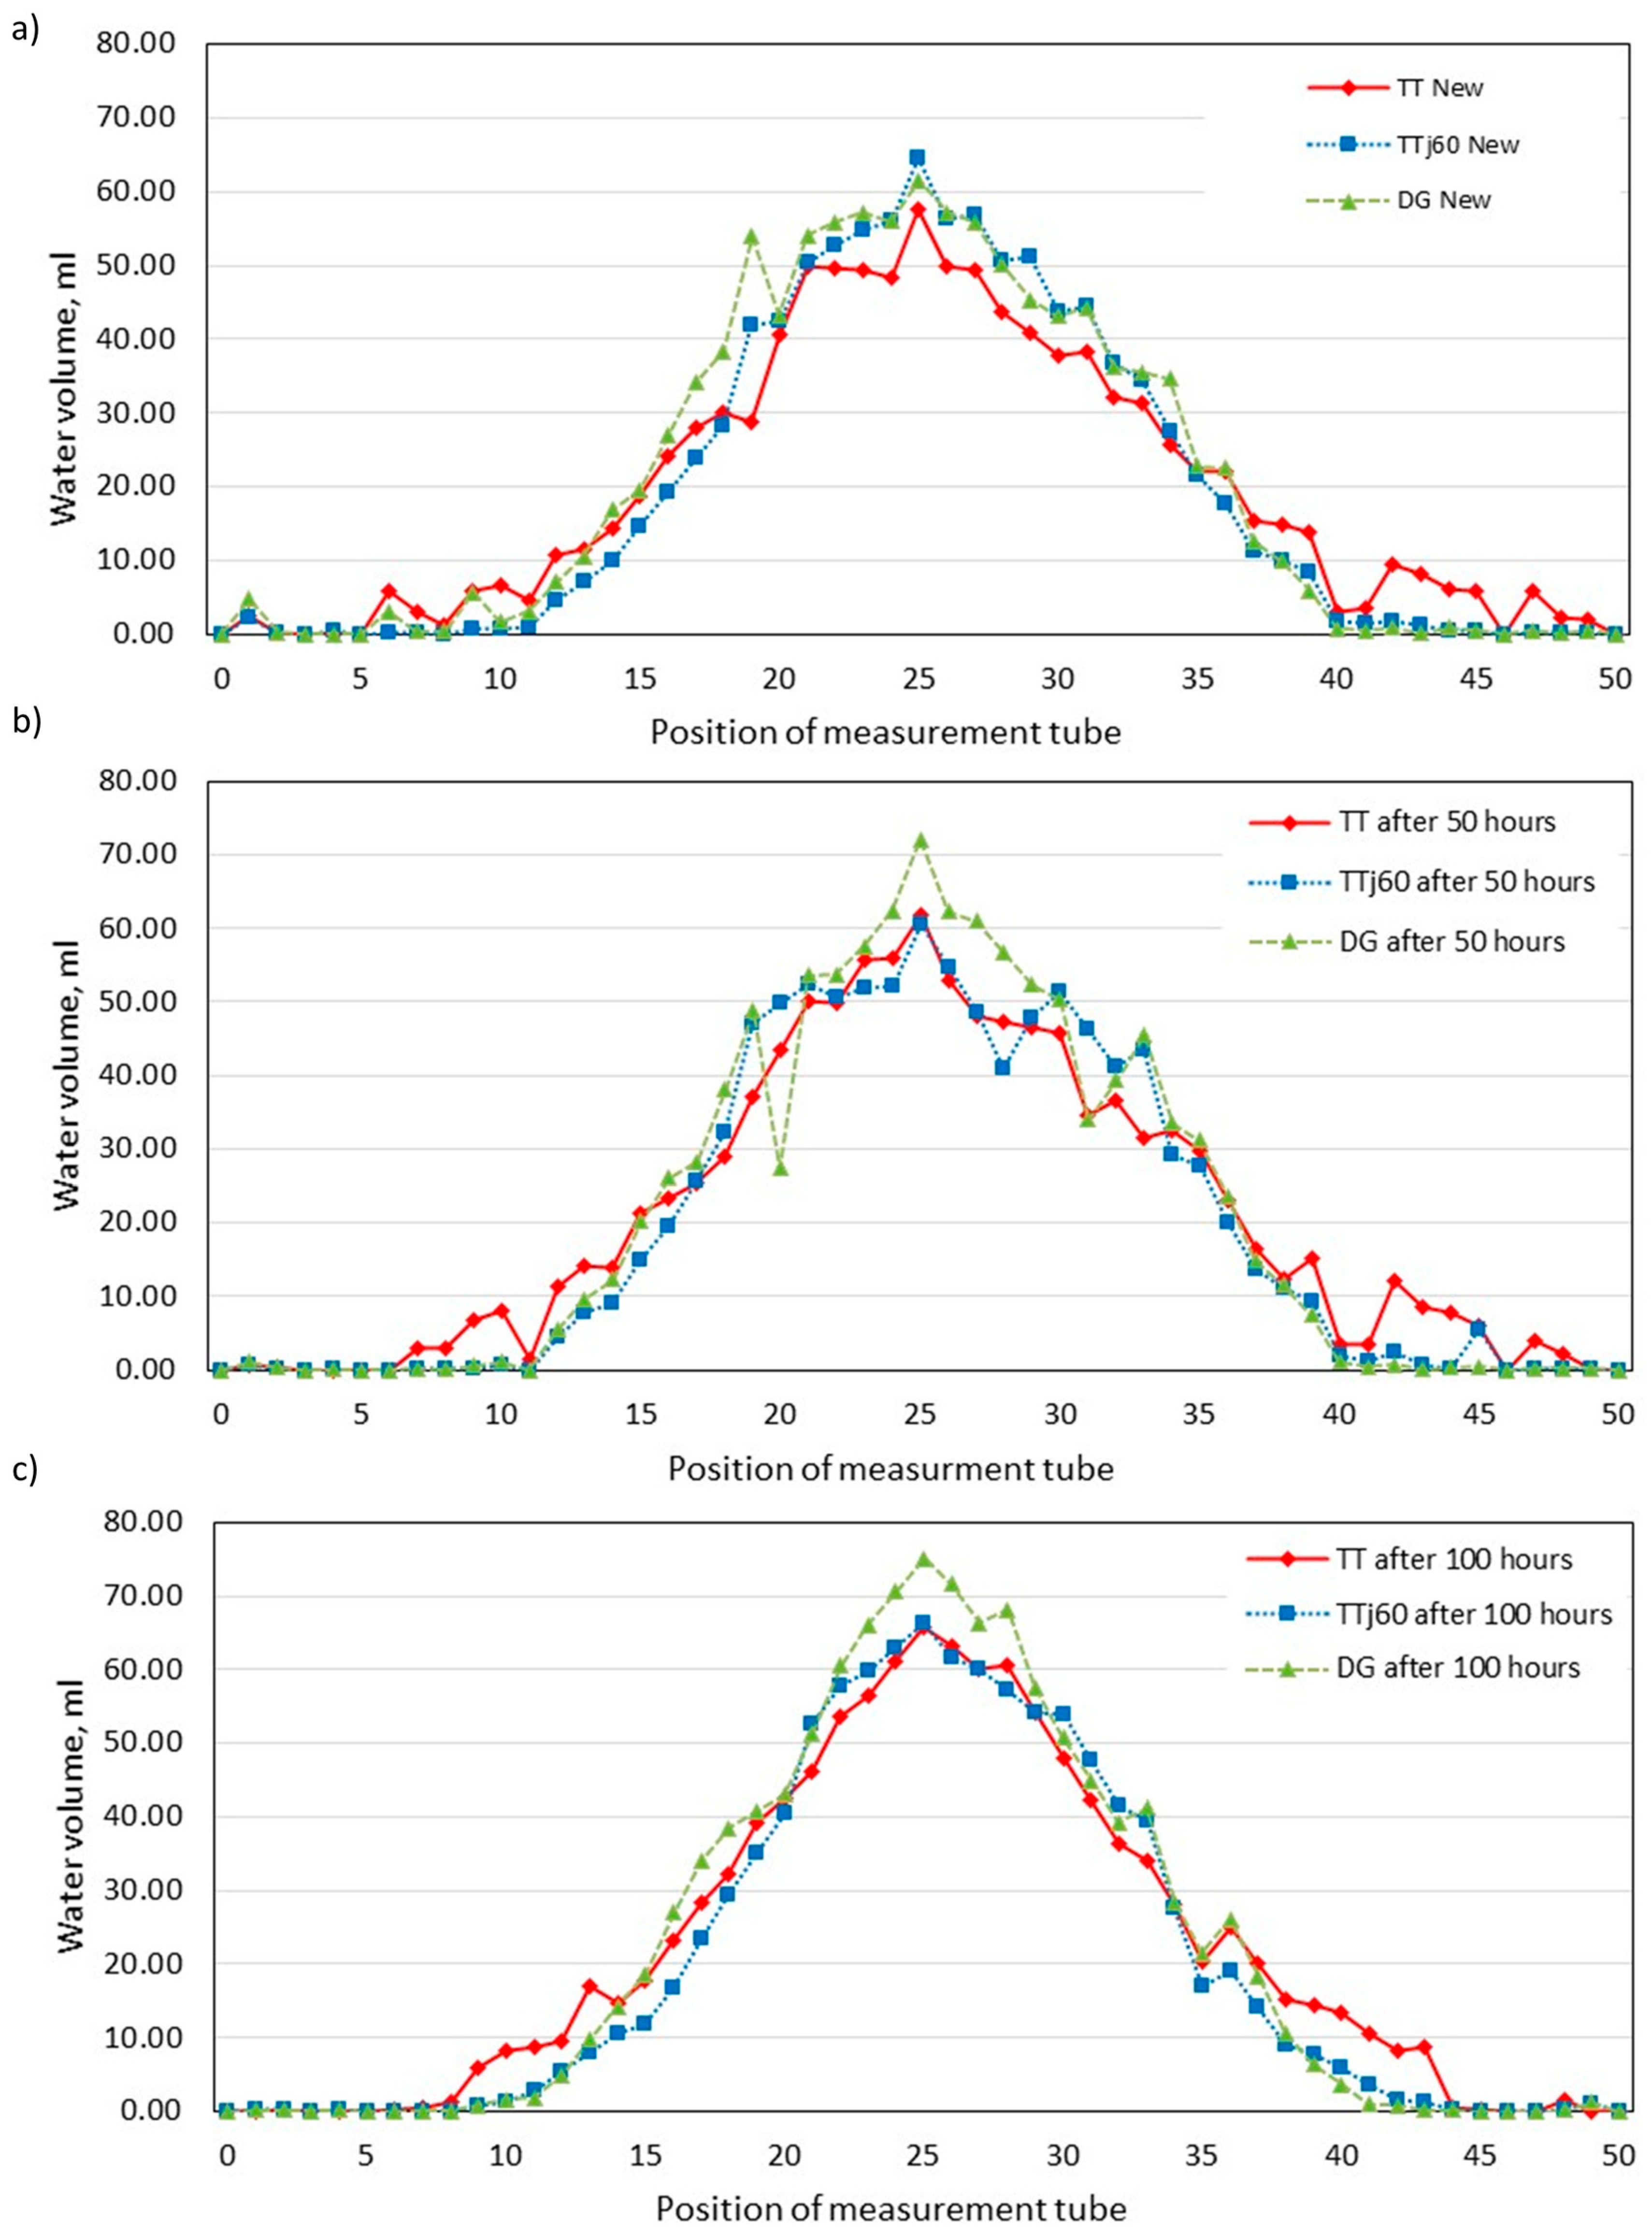
2.3. Spray Distribution
2.4. Data Analysis
3. Results
4. Conclusions
- The TTj60 nozzle type showed the highest resistance to wear, followed by the TT type and DG. The wear rate of the TTj60 nozzle after finishing the accelerated wear test was 0.5%, while it was 7.4% and 8.3% for the TT and DG nozzles, respectively.
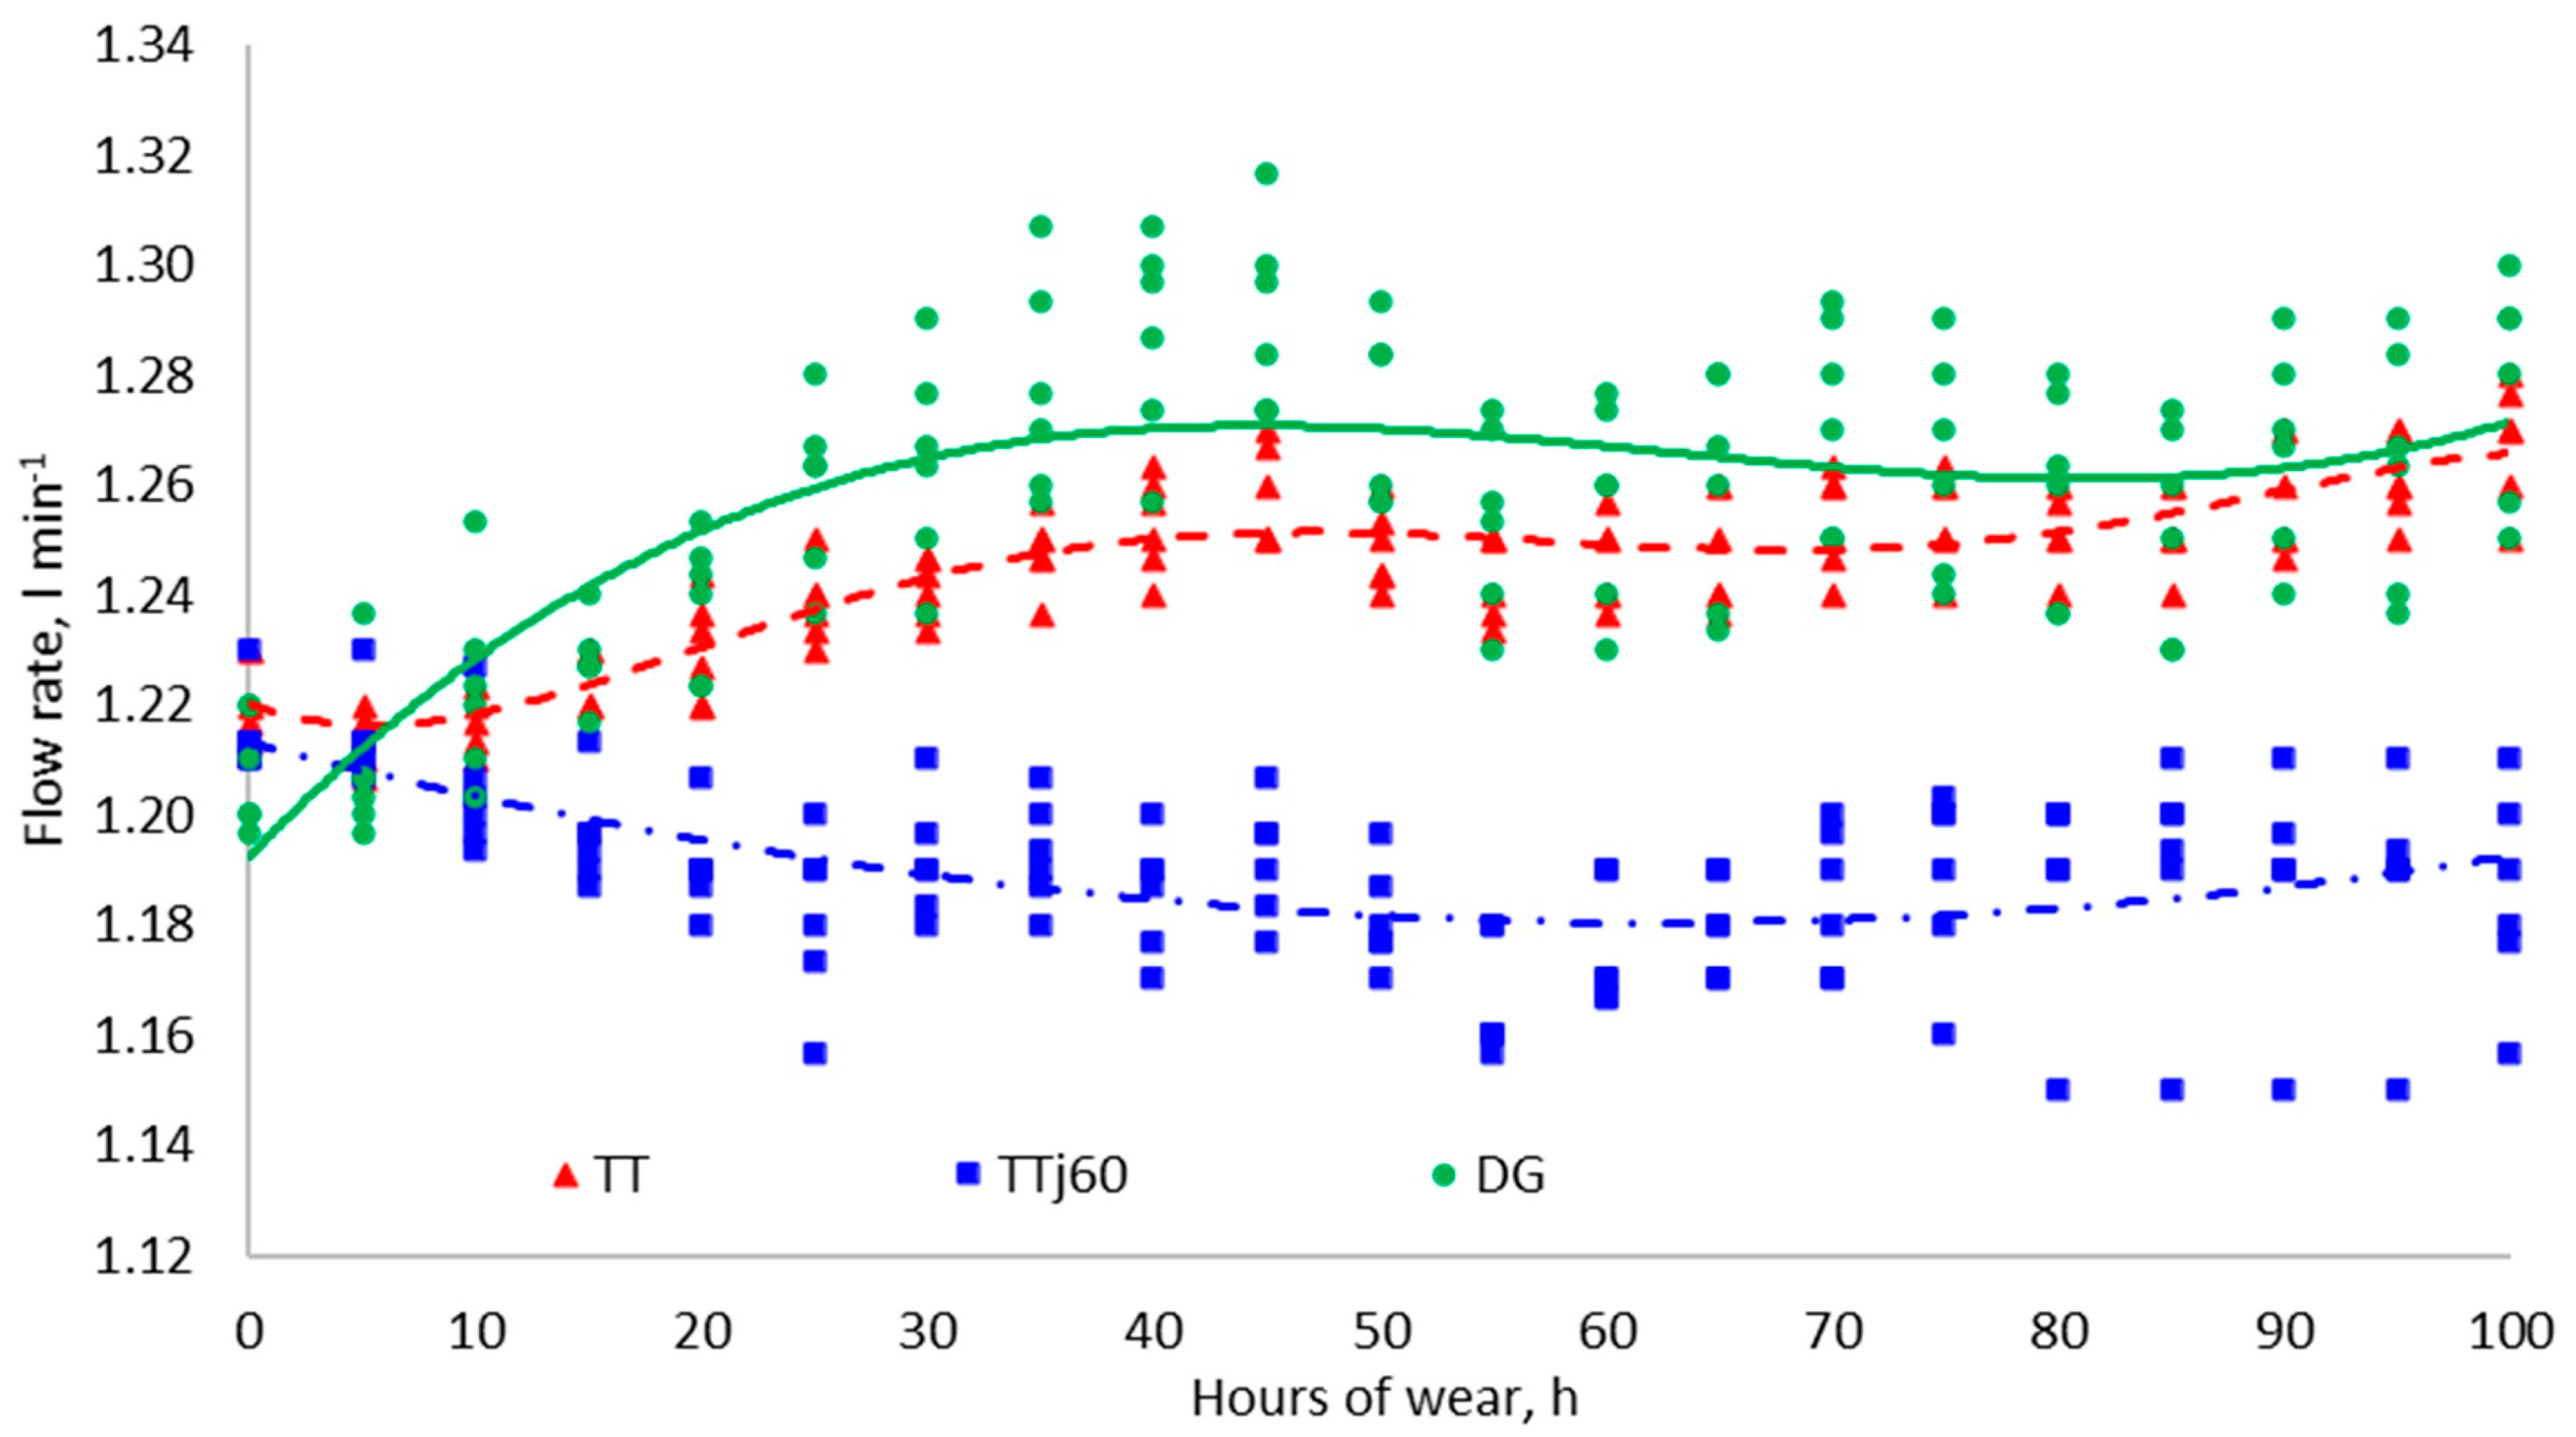
- During the first 45 h of wear, the flow rates of the DG and the TT nozzles increased with the wear period, while the flow rate of the TTj60 nozzle showed an opposite trend. The increase in flow rate for the DG nozzle was from 1.21 L/min for new nozzles to 1.29 L/min after 45 h of wear and from 1.22 L/min to 1.26 L/min for the TT nozzle. For the new TTj60 nozzle, the flow rate was 1.21 L/min, and it was 1.19 L/min after 45 h of wear.
- After completing the test, the virtual coefficient of variation (CVv) values for the three types of nozzles were less than 10% (7%, 9%, and 5% for TT, TTj60, and DG, respectively), which is acceptable according to the ISO 16122-2, 2015 standard.
- There was an increase in the quantity of spray deposited in the middle of the spray swath as the wear test progressed for the three types of nozzles.
Author Contributions
Funding
Institutional Review Board Statement
Informed Consent Statement
Data Availability Statement
Conflicts of Interest
References
- Dafsari, R.A.; Yu, S.; Choi, Y.; Lee, J. Effect of geometrical parameters of air-induction nozzles on droplet characteristics and behaviour. Biosyst. Eng. 2021, 209, 14–29. [Google Scholar] [CrossRef]
- Miller, P.C.; Tuck, C.R.; Murphy, S.; Ferreira, M. Measurements of the droplet velocities in sprays produced by different designs of agricultural spray nozzle. In Proceedings of the European Conference on Liquid Atomization and Spray Systems, Como Lake, Italy, 8–10 September 2008; Paper ID ILASS08-8-5. pp. 8–10. [Google Scholar]
- Kennelly, M.M.; Wolf, R.E. Effect of nozzle type and water volume on dollar spot control in greens-height creeping bentgrass. Appl. Turfgrass Sci. 2009, 6, 1–8. [Google Scholar] [CrossRef]
- Lafferty, C.L.; Tian, L.F. Using computation fluid dynamics to determine the effect of internal nozzle flow on droplet size. In Proceedings of the 2001 ASAE Annual Meeting—American Society of Agricultural and Biological Engineers, Sacramento, CA, USA, 29 July−1 August 2001; p. 1. [Google Scholar]
- Vong, C.N.; Larbi, P.A. Development and Prototype Testing of an Agricultural Nozzle Clog Detection Device. Trans. ASABE 2021, 64, 49–61. [Google Scholar] [CrossRef]
- Cerruto, E.; Manetto, G.; Papa, R.; Longo, D. Modelling Spray Pressure Effects on Droplet Size Distribution from Agricultural Nozzles. Appl. Sci. 2021, 11, 9283. [Google Scholar] [CrossRef]
- Chen, P.; Lan, Y.; Huang, X.; Qi, H.; Wang, G.; Wang, J.; Wang, L.; Xiao, H. Droplet deposition and control of planthoppers of different nozzles in two-stage rice with a quadrotor unmanned aerial vehicle. Agronomy 2020, 10, 303. [Google Scholar] [CrossRef]
- Krawczuk, A.; Parafiniuk, S.; Przywara, A.; Huyghebaert, B.; Rabier, F.; Limbourg, Q.; Mostade, O.; Kocira, S. Technical parameters of biostimulant spraying a determinant of biometric traits and yield of soybean seeds. Agric. Eng. 2021, 25, 171–179. [Google Scholar] [CrossRef]
- Yao, W.; Lan, Y.; Hoffmann, W.C.; Li, J.; Guo, S.; Zhang, H.; Wang, J. Droplet size distribution characteristics of aerial nozzles by bell206l4 helicopter under medium and low airflow velocity wind tunnel conditions and field verification test. Appl. Sci. 2020, 10, 2179. [Google Scholar] [CrossRef]
- Ballal, K.; Krishnan, P.; Kemble, J.; Issler, A. Nozzle selection and replacement based on nozzle wear analysis. In Proceedings of the Third International Conference on Precision Agriculture, Madison, WI, USA, 23−26 June 1996; American Society of Agronomy, Crop Science Society of America, Soil Science Society of America: Madison, WI, USA, 1996; pp. 795–804. [Google Scholar]
- Forney, S.H.; Luck, J.D.; Kocher, M.F.; Pitla, S.K. Laboratory and full boom-based investigation of nozzle setup error effects on flow, pressure, and spray pattern distribution. Appl. Eng. Agric. 2017, 33, 641–653. [Google Scholar] [CrossRef][Green Version]
- Krishnan, P.; Evans, T.; Ballal, K.; Kemble, L.J. Scanning electron microscopic studies of new and used fan nozzles for agricultural sprayers. Appl. Eng. Agric. 2004, 20, 133–138. [Google Scholar] [CrossRef]
- Singh, A.K.; Bhatt, Y.C. Wear on circular orifice plate of hollow-cone type agrochemical spray nozzles. Agric. Eng. Int. CIGR J. 2018, 20, 78–84. [Google Scholar]
- Singh, A.K.; Bhatt, Y.C.; Dhande, K.; Wandkar., S.V.; Stanley, N. System of mathematical equations to predict wear rate on circular-cone orifice of pesticide spray nozzles. Int. J. Precis. Agric. Aviat. 2019, 2, 76–80. [Google Scholar]
- Bochniak, A.; Kluza, P.A.; Kuna-Broniowska, I.; Koszel, M. Application of non-parametric bootstrap confidence intervals for evaluation of the expected value of the droplet stain diameter following the spraying process. Sustainability 2019, 11, 7037. [Google Scholar] [CrossRef]
- Sayinci, B. Detection of shape manufacturing defects of flat fan-pattern nozzle orifices using elliptic fourier descriptors. J. Agric. Sci. 2016, 22, 317–330. [Google Scholar]
- Kluza, P.A.; Kuna-Broniowska, I.; Parafiniuk, S. Modeling and prediction of the uniformity of spray liquid coverage from flat fan spray nozzles. Sustainability 2019, 11, 6716. [Google Scholar] [CrossRef]
- Sayinci, B. Effect of strainer type, spray pressure, and orifice size on the discharge coefficient of standard flat-fan nozzles. Turk. J. Agric. For. 2015, 39, 692–704. [Google Scholar] [CrossRef]
- Matthews, G. Chapter 3: Application of pesticides. In Pesticides: Health, Safety and the Environment; John Wiley & Sons: Hoboken, NJ, USA, 2015; pp. 46–77. [Google Scholar]
- ASAE S471; Procedure for Measuring Sprayer Nozzle Wear Rate. 46th ed. ASAE Standards: St. Joseph, MI, USA, 1999.
- Huyghebaert, B. Verification of Measurement Methods of Flat Fan Nozzles Working Parameters Used in Agriculture. Ph.D. Thesis, University of Life Sciences in Lublin, Lublin, Poland, 2015; p. 149. [Google Scholar]
- Huyghebaert, B.; Debouche, C.; Mostade, O. Flow rate quality of new flat fan nozzles. Trans. ASAE 2001, 44, 769. [Google Scholar] [CrossRef]
- ISO 16122-2; Agricultural and Forestry Machinery—Inspection of Sprayers in Use—Part 2: Horizontal Boom Sprayers. International Organization for Standardization: Geneva, Switzerland, 2015; p. 18.
- Sawa, J.; Huyghebaert, B.; Parafiniuk, S. Testing device for a complex measurement of the performances nozzles. In Proceedings of the 4th European Workshop on Plant Protection Equipment Inspections—SPISE 4 Workshop, Lana, South Tyrol, Italy, 27−29 March 2012; pp. 228–233. [Google Scholar]
- Parafiniuk, S. Conversion of Test Results Obtained for Single Spray Nozzles to Identify the Working Parameters of the Sprayer Boom. Ph.D. Habilitation Thesis, University of Life Sciences in Lublin, Lublin, Poland, 2013. [Google Scholar]
- ISO 5682-1; Equipment for Crop Protection—Spraying Equipment—Part 1: Test Methods for Sprayer Nozzles. International Organization for Standardization: Geneva, Switzerland, 1996; p. 18.
- R Development Core Team. R: A Language and Environment for Statistical Computing; R Foundation for Statistical Computing: Vienna, Austria, 2012; ISBN 3-900051-07-0. Available online: http://www.R-project.org/ (accessed on 20 September 2021).
- Bolat, A.; Ozluoymak, O.B.; Bayat, A. Determination of spray performance of new and worn flat fan nozzles and spray angle based on novel image analysis software. Fresenius Environ. Bull. 2021, 30, 8532–8540. [Google Scholar]


| Nozzle Type and Size | Full Name | Nominal Flow Rate, L/ min | Spray Angle, ° | Pressure Range, Bar | Design Feature | Application Rate, l ha−1 (at Speed of 4 km h−1) |
|---|---|---|---|---|---|---|
| TeeJet TT 03 | Turbo TeeJet, Wide Angle Flat Spray | 1.18 | 110 | 1.0–6.0 | Twin chamber, large and rounded internal passage | 354 |
| TeeJet TTj60 03 | Turbo Twinjet, Twin ** Flat Spray | 1.18 | 110 | 1.5–6.0 | Dual outlet produces dual 110° flat fan spray patterns | 354 |
| TeeJet DG 03 | Drift Guard Flat Spray | 1.18 | 110 | 2.0–5.0 | Removable pre-orifice | 354 |
| Nozzle Type | Hours of Wear, h | |||||||||
|---|---|---|---|---|---|---|---|---|---|---|
| 10 | 20 | 30 | 40 | 50 | 60 | 70 | 80 | 90 | 100 | |
| Wear Rate, % | ||||||||||
| TT | 3.2 | 4.2 | 5.2 | 6.2 | 5.8 | 5.6 | 6.2 | 6.2 | 6.6 | 7.4 |
| TTj60 | 2.1 | 0.9 | 1.0 | 0.5 | 0.1 | −0.4 | 0.4 | 0.7 | 0.7 | 0.5 |
| DG | 3.7 | 4.9 | 7.1 | 9.0 | 7.8 | 6.5 | 7.8 | 6.7 | 7.3 | 8.3 |
| DG | TT | TTj60 | ||||
|---|---|---|---|---|---|---|
| New | Worn | New | Worn | New | Worn | |
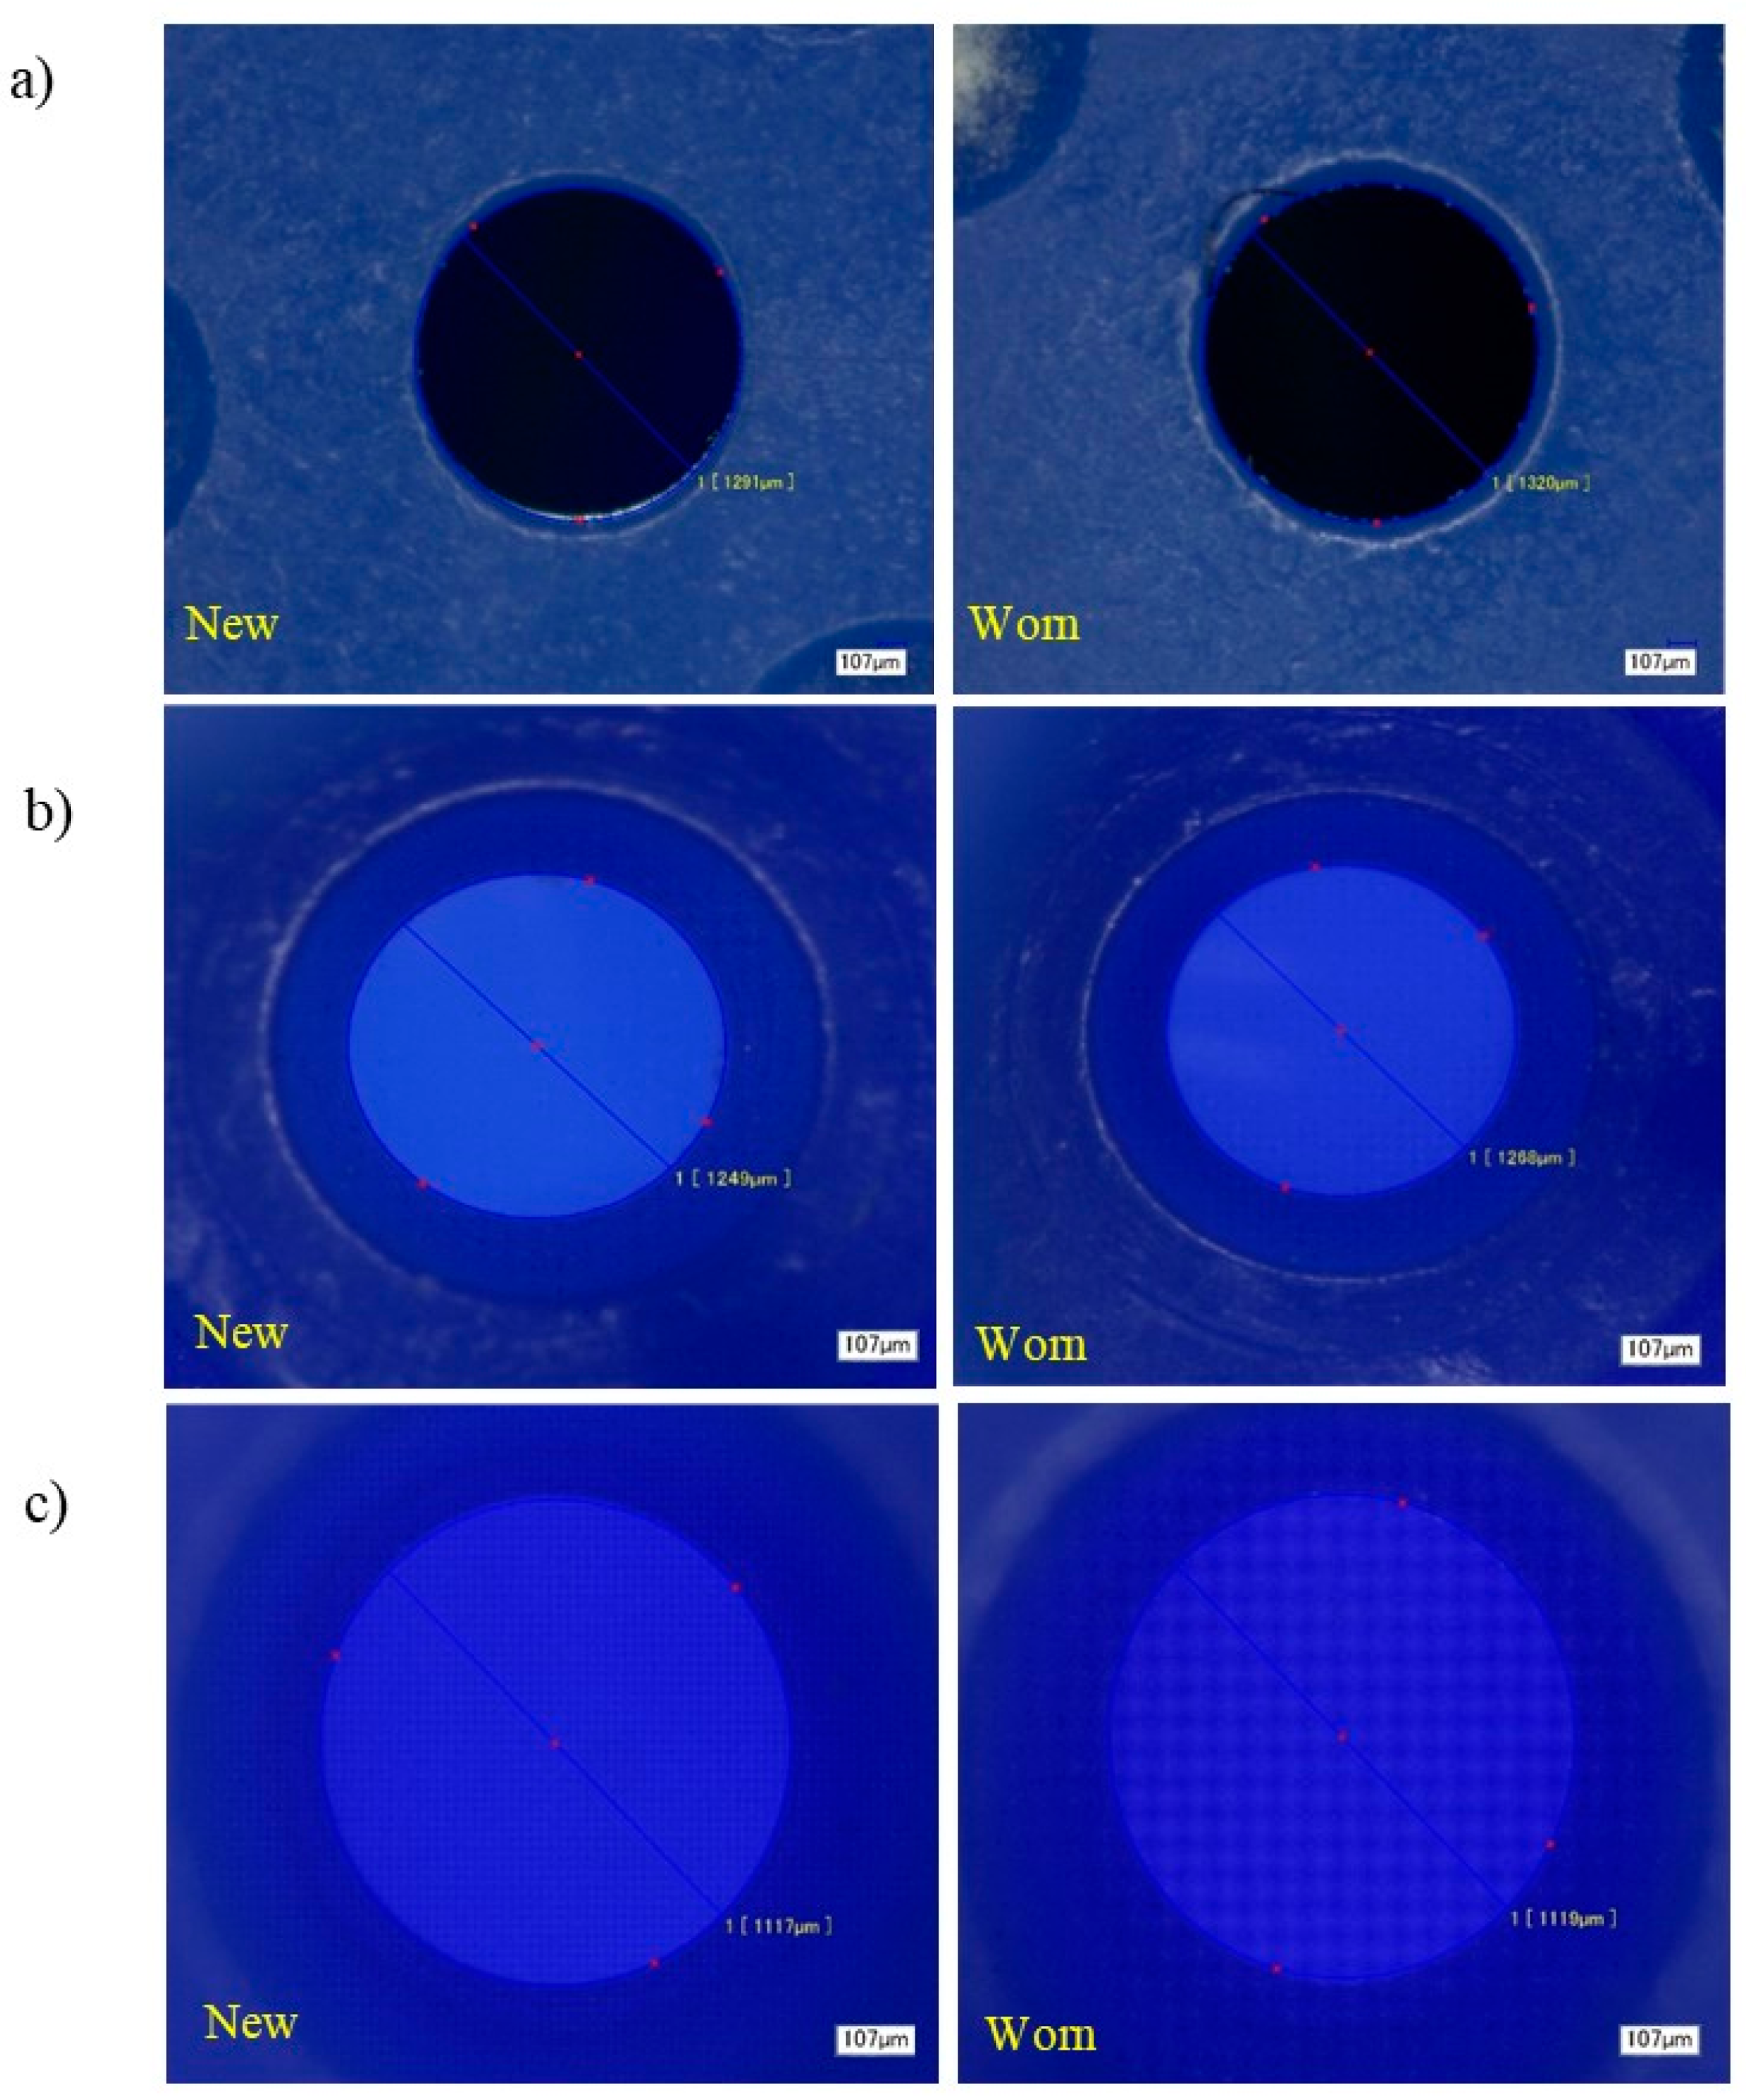
| Area, mm2 | 1.31 | 1.37 | 1.23 | 1.26 | 0.98 | 0.98 |
| Diameter, mm | 1.29 | 1.32 | 1.25 | 1.27 | 1.12 | 1.12 |
| Nozzle Type | Spray Distribution Characteristics | Hours of Wear, h | ||||||||||
|---|---|---|---|---|---|---|---|---|---|---|---|---|
| 0 | 10 | 20 | 30 | 40 | 50 | 60 | 70 | 80 | 90 | 100 | ||
| TT | Average *, mL | 193.3 | 200.7 | 199.5 | 210.1 | 194.0 | 196.5 | 199.8 | 208.1 | 215.4 | 214.5 | 218.5 |
| SD ** | 7.1 | 6.6 | 12.5 | 7.6 | 20.6 | 14.7 | 22.4 | 11.4 | 28.5 | 21.3 | 15.1 | |
| CVV | 4% | 3% | 6% | 4% | 11% | 8% | 11% | 6% | 13% | 10% | 7% | |
| TTj60 | Average, mL | 196.1 | 202.7 | 193.6 | 203.7 | 194.1 | 191.2 | 195.0 | 198.1 | 200.7 | 206.5 | 206.6 |
| SD | 11.5 | 10.9 | 7.0 | 8.8 | 15.4 | 15.2 | 13.9 | 11.8 | 24.8 | 21.2 | 18.8 | |
| CVV | 6% | 5% | 4% | 4% | 8% | 8% | 7% | 6% | 12% | 10% | 9% | |
| DG | Average, mL | 213.2 | 211.8 | 213.4 | 220.7 | 215.0 | 212.5 | 216.4 | 213.3 | 211.4 | 222.9 | 227.1 |
| SD | 8.1 | 13.5 | 13.5 | 11.6 | 23.3 | 18.3 | 18.9 | 14.0 | 15.5 | 12.6 | 11.9 | |
| CVV | 4% | 6% | 6% | 5% | 11% | 9% | 9% | 7% | 7% | 6% | 5% | |
Publisher’s Note: MDPI stays neutral with regard to jurisdictional claims in published maps and institutional affiliations. |
© 2022 by the authors. Licensee MDPI, Basel, Switzerland. This article is an open access article distributed under the terms and conditions of the Creative Commons Attribution (CC BY) license (https://creativecommons.org/licenses/by/4.0/).
Share and Cite
Milanowski, M.; Subr, A.; Parafiniuk, S. Evaluation of Different Internal Designs of Hydraulic Nozzles under an Accelerated Wear Test. Appl. Sci. 2022, 12, 889. https://doi.org/10.3390/app12020889
Milanowski M, Subr A, Parafiniuk S. Evaluation of Different Internal Designs of Hydraulic Nozzles under an Accelerated Wear Test. Applied Sciences. 2022; 12(2):889. https://doi.org/10.3390/app12020889
Chicago/Turabian StyleMilanowski, Marek, Alaa Subr, and Stanisław Parafiniuk. 2022. "Evaluation of Different Internal Designs of Hydraulic Nozzles under an Accelerated Wear Test" Applied Sciences 12, no. 2: 889. https://doi.org/10.3390/app12020889
APA StyleMilanowski, M., Subr, A., & Parafiniuk, S. (2022). Evaluation of Different Internal Designs of Hydraulic Nozzles under an Accelerated Wear Test. Applied Sciences, 12(2), 889. https://doi.org/10.3390/app12020889